Abstract
Clathrin-mediated endocytosis in yeast is driven by a protein patch containing close to 100 different types of proteins. Among the proteins are 5000-10,000 copies of polymerized actin, and successful endocytosis requires growth of the actin network. Since it is not known exactly how actin network growth drives endocytosis, we calculate the spatial distribution of actin growth required to generate the force that drives the process. First, we establish the force distribution that must be supplied by actin growth, by combining membrane-bending profiles obtained via electron microscopy with established theories of membrane mechanics. Next we determine the profile of actin growth, using a continuum mechanics approach and an iterative procedure starting with an actin growth profile obtained from a linear analysis. The profile has fairly constant growth outside a central hole of radius 45-50 nm, but very little growth in this hole. This growth profile can reproduce the required forces if the actin shear modulus exceeds 80 kPa, and the growing filaments can exert very large polymerization forces. The growth profile prediction could be tested via electron-microscopy or superresolution experiments in which the turgor pressure is suddenly turned off.
PACS numbers: 87.16.A-, 87.16.D-, 87.16.Ka, 87.17.Aa
I. Introduction
Endocytosis is a key cellular process by which cells ingest nutrients from outside the cell and recycle membrane components [1]. The process occurs on a submicron length scale, smaller than that of other ingestion processes such as pinocytosis and phagocytosis. During endocytosis, the cell membrane first forms a shallow dimple. The dimple becomes a tubule, and the tubule is pinched off to form a vesicle that travels into the cytoplasm. Yeast has been a preferred model system for studying this process because of the ease of genetic manipulation and fluorescent labeling. Major driving forces for endocytosis in yeast include curvature-generating proteins and actin polymerization at the cell membrane [2], which causes the actin network to grow.
The clathrin-mediated variant of endocytosis (CME) has been studied extensively in yeast. The classic curvature-generating protein in CME is clathrin, which spontaneously forms cages and appears early in the process. Other established and putative curvature-generating proteins include Bzz1 and Ede1, which arrive early, and Rvs161/167, which arrives later. However, polymerization of actin is often required for successful endocytosis both in yeast and mammalian cells. In mammalian cells with membrane tension increased by hypoosmotic treatment, suppression of actin polymerization reduces the rate of endocytosis [3]. In yeast, actin polymerization is required for endocytosis under normal conditions [4, 5]. This requirement is lessened under conditions of reduced turgor pressure [6, 7] and conversely becomes more stringent when turgor pressure is increased [7]. Finally, correlative light- and electron-microscopy measurements indicate that membrane bending is always preceded by actin polymerization [8], although this finding has been disputed by electron-microscopy studies using other methods [9].
Several modeling studies [10–12] have explored endocytic dynamics driven by assumed distributions of actin forces. However, the mechanism by which actin network growth exerts pulling forces to drive invagination is not definitively established. Mechanisms based on filaments growing inwards in the plane of the membrane [13], and growing perpendicular to the membrane [14–16], have been proposed. We have previously compared these models [16], and found that particularly in the early stages of invagination, the inward-growth scenario would involve an extremely large force per filament tip. Therefore we focused on the perpendicular-growth scenario, in which polymerization of filament tips at the membrane pushes the actin filament network away from the membrane into the cytoplasm. The inward-moving network is in turn attached to adapter proteins such as Sla2 [17–19] at the center of the endocytic protein patch, which are dragged into the cytoplasm and pull the membrane along. We found that a ring-shaped distribution of actin growth can lead to focused pulling forces over a small region of the membrane, having a distribution qualitatively correct for endocytosis.
Here we build on this work by asking more precisely what spatial distribution of actin growth, in conjunction with contributions from curvature-generating proteins, would reproduce the force distribution required to overcome opposing forces from membrane bending and turgor pressure in the early stages of endocytosis. We calculate the distribution of actin growth in several steps.
Evaluate the force densities from turgor pressure and membrane bending from measured membrane profiles using the “Helfrich” continuum theory [20] of membrane elasticity, evaluate the force density from curvature-generating proteins by treating them as a “fuzzy” disk on the membrane, and evaluate the force density from the cell wall using a continuum-mechanics approach. We use a single, averaged membrane profile because we treat the actin growth distribution in the early stage of endocytosis, just after the membrane leaves the cell wall, rather than trying to calculate the dynamics of the actin network during the entire process.
Evaluate the required actin-growth force density using the constraint of force balance at all points on the membrane, extending previous calculations of the total actin force [6, 11].
Use simulations of a continuum-mechanics model of a growing hemispherical actin network, along with an initial distribution of actin growth coupled with an iterative correction method, to find a distribution of actin growth that yields the required forces. We begin with a trial distribution based on linear elasticity theory.
We find that actin growth occurs in a ring-shaped region, with a hole of diameter 45-50 nm around the endocytic site, and the growth rate is fairly constant inside this region. The hole diameter is larger than we assumed in our previous simulations [16], but otherwise the shape is similar. This profile can generate the required forces if the actin network is very stiff (shear modulus 80 kPa or greater), and the growing filaments have a larger stall force than is generally assumed.
II. Model
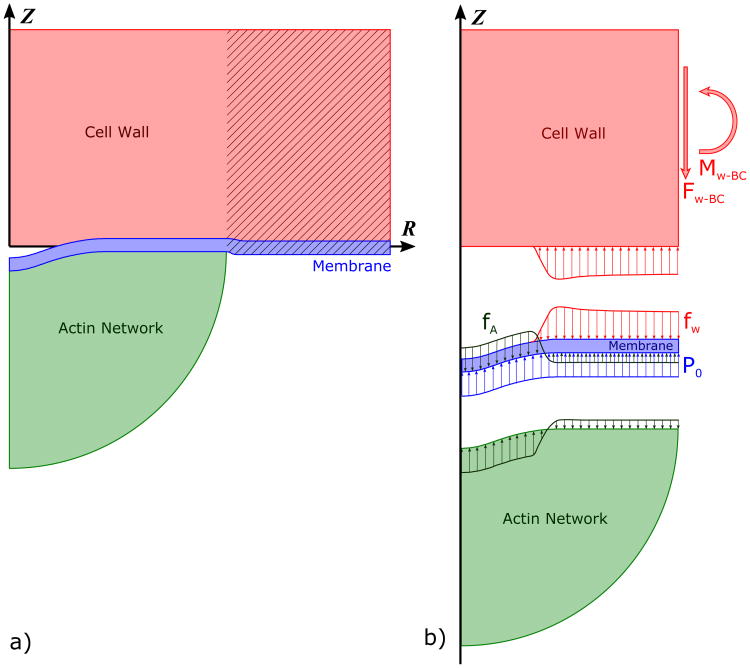
In this section we present models for the forces generated by the actin network and curvature-generating proteins (CGP), the forces due to the membrane deformation, and the forces acting between the cell wall and the membrane. We focus on the initial stage of endocytosis, when the membrane first separates from the cell wall. The main elements of the model shown in Fig. 1a are the actin network, membrane, CGP (not shown but taken to reside at the membrane), and cell wall. The scenario leading to pulling forces in this model is as follows. Polymerization occurs in a ring-shaped region near the membrane-actin boundary. The actin network thus pushes up against the membrane, and by Newton's Third Law the membrane pushes down on the actin network in the ring region. This force is transferred to the central region of the actin network, which moves down, pulling the membrane with it.
Fig. 1.
Axisymmetric diagram of the model. a) The membrane is separated from the cell wall in the initial stage, in which the membrane forms a shallow dimple. The hatched sections of the cell wall and membrane are not included in the model but are shown for clarity. b) Free-body diagram of the cell wall, membrane, and actin network. P0 is the turgor pressure; fW is the reaction force density of the cell wall; and fA is the force density applied by (and on) the actin network. The cell wall force, fW, is balanced by a shear force Fw–bc and bending moment Mw–bc at the boundary. The forces fM and fCGP are omitted for clarity.
The free-body diagram in Fig. 1b highlights the forces involved in the process. We assume local force balance on each point of the membrane. The force densities fA generated by the actin and the CGP (fCGP) must overcome the turgor pressure P0, the membrane bending force density fM, and the reaction force fW from the wall to the membrane being pushed into it by the turgor pressure. The deformation is slow, usually developing a tubule on the order of seconds [8]. Therefore, we assume that the force due to the actin growth is quasi-static in the sense that the membrane deformation equilibrates instantaneously after an increment of growth.
The local force-balance equation then becomes
| (1) |
The forces in Eq. 1 act on the membrane and are taken to be along the z-direction, since we consider only the initial stage of bending where the membrane is nearly flat. We thus ignore radial force components. The positive force direction is taken to be pushing into the cell wall (up in Fig. 1). The model includes no external forces except for those acting on the cell wall. The local force balance allows us to calculate fA from the other force densities, as described in detail below. We obtain fM and fCGP from experimentally measured membrane displacements using a theoretical analysis based on the bending rigidity of the membrane and CGP layer, and the spontaneous curvature of the CGP layer. We obtain fW using a simulation in which the deformed membrane is embedded into a the cell wall, described by an elastic model. Finally, the turgor pressure is taken to supply a uniform force density P0.
There are also several integrated force-balance relations that simplify the calculation of the forces. The actin network moves very slowly, and is in the limit of low Reynolds number. The net force on the network from the membrane, which equals the drag force, may thus be obtained by the Stokes relation as fdrag = 6πηRv = 0.3 × 10⁻³pN, where the viscosity η = 8.9 × 10⁻³N · s/m2 is taken as ten times the viscosity of water, R = 100 nm is the radius of the actin network, and v = 20 nm/sec [21] is the velocity of the motion into the cell. Since fdrag is so small, we take the actin force to vanish when integrated over the surface of the actin network. The total force due to membrane bending vanishes because it is an internal force. The membrane is the only agent acting on the CGP, and the total force on the CGP must vanish. Therefore, by Newton's third law, the total force from the CGP onto the membrane must also vanish. Finally the total force from the cell wall onto the membrane must be balanced by the force from the turgor pressure. This holds because the total actin force and the total CGP force onto the membrane are zero, and the total force on the membrane must be zero.
A. Membrane
Here, we describe our model for estimating membrane bending forces and our method for estimating the membrane profile from experimental data. In calculating the membrane forces, we treat the membrane as an infinitely thin sheet described by a tension and a bending modulus, in the spirit of the “Helfrich” model [22]. Below, in Section IIC, we model the membrane as an elastic material with a finite thickness in order to calculate interaction forces with the cell wall. However, this model is not used to calculate forces resulting from bending or stretching of the membrane.
1. Membrane Bending Force
As in Refs. [10] and [11], we use a Helfrich-type model to calculate the force density fN due to membrane bending. We use the axisymmetric implementation of Ref. [12], which treats local variations in parameters such as the concentration of CGP. The z-direction force is given by
| (2) |
where n = − sin(ψ)er + cos(ψ)k is a vector normal to the membrane surface, ψ is the angle of the normal away from the z-direction, er is a unit vector in the radial direction, k is a unit vector in the z-direction, and s is the arc length coordinate in the radial direction. The mean curvature is defined as
| (3) |
The strain energy density function for the membrane is given by
| (4) |
where κB is the membrane bending modulus. H0 is the preferred curvature, which vanishes for the bare membrane.
Note that we have left out the Gaussian curvature contribution to the forces, because it does not contribute here: For the membrane, the spatial variation of the Gaussian bending modulus is probably very weak. Therefore the Gaussian curvature energy [23] is proportional to the integral
| (5) |
where the surface S is a portion of the membrane large enough that the the endocytic forces cause no deformation at its boundary ∂S, while C1 and C2 are the principal curvatures of the membrane. The Gauss-Bonnet theorem [24] states that
| (6) |
where χ is the Euler characteristic of S (determined by its topology) and kg is the geodesic curvature of ∂S. Then I, and thus the Gaussian curvature energy, are independent of deformations at the endocytic site because they do not change the topology of S nor the geodesic curvature at its boundary. Thus the Gaussian curvature causes no forces in the endocytic region.
Bending of the cell membrane can in principle change the tension σ [25]. We have ignored this effect because the resulting forces are very small in comparison to the other forces. For a 50 nm × 50nm patch of curvature-generating proteins, similar to the size treated here, Ref. [25] obtained tension changes less than 10−3pN/nm. For the early stages of indentation that we consider, the force density is approximately σ∇2w [26], where w is the membrane displacement. For a 10 nm indentation of radius 30 nm, ∇2w ≃ 10nm/(30 nm)2 = 0.01nm−1. The corresponding force density, for σ = 10−3pN/nm, is 10−5pN/nm2 = 10Pa. This is four orders of magnitude smaller than the net force density from the other contributions, calculated below. Therefore it is legitimate to ignore the coupling between bending and tension.
2. Extracting Membrane Profiles from Experimental Data
Kukulski et al. [8] measured the membrane displacement at a number of stages of endocytosis in S. cerevisiae cells. EM images from an early stage of endocytosis in which the membrane resembles a dimple are shown in Fig. 2a. Membrane profiles were also estimated by fitting points from the EM with a second-degree polynomial.
Fig. 2.
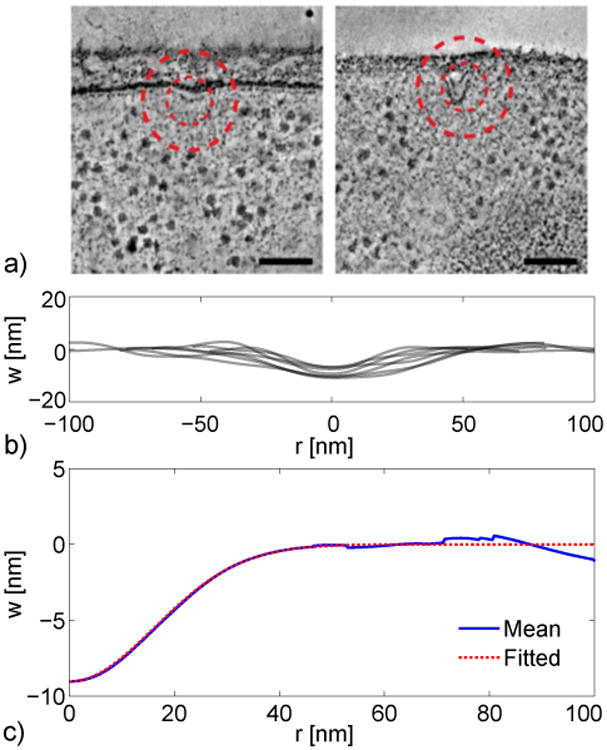
a) Electron microscopy (EM) images of endocytic profiles. The left profile shows the initial stage of endocytosis, in which the membrane forms a shallow dimple. Scale bars indicate 100 nm. Reprinted with permission from Kukulski et al. [8]. b) Selected membrane profiles from the EM experiments [8]. Vertical displacement of membrane is w. c) Mean membrane profile of the initial stage of endocytosis (solid line) and Gaussian fit (dashed line).
We selected membrane profiles from Ref. [8] to estimate a mean membrane profile during the initial stage of endocytosis. Selected profiles were required to have both small displacements and symmetrical profiles. Profiles that had invaginations of about 11 nm or less were initially collected. From this set, we selected profiles which had a clear axis of symmetry so that the peak displacement was apparent. These selection criteria resulted in seven experimental profiles, which are plotted in Fig. 2b (note that they are flipped in the z-direction relative to the profiles given in Ref. [8]).
To find a mean profile, the axis of rotation is taken to be the minimum (most negative) displacement value. An averaged profile is obtained by combining the data on either side of the minimum. Outliers among the axisymmetric profiles are rejected (please see the discussion in the Appendix). The remaining profiles are normalized by the respective peak invaginations, interpolated using a cubic spline along a common grid, and averaged. The invagination depth of the resulting mean profile, shown in Fig. 2c, is the mean depth of the original profiles.
Finally, the mean experimental profile is fitted in both spatial coordinates (r and z) and arc length coordinates (s and ψ(s)). In the spatial coordinates, the mean profile of the membrane displacement w is least-squares fit to the Gaussian function
| (7) |
where A is the depth of the invagination, β is a shape parameter, and B accounts for the fact that we have data only over a finite range of r. After the mean profile is fitted, the parameter B is discarded so that w(r → ∞) = 0. The arc length is calculated by numerically differentiating both r and z to find the discrete step in arc length, taking
| (8) |
and numerically integrating. The azimuthal angle is calculated from
| (9) |
Because we consider the early stage of invagination, we assume that ψ is small, so that cosθ ≃ 1. The angle coordinates are fit to an odd-order polynomial expansion using constrained least squares. We chose a polynomial fit for mathematical convenience in applying boundary conditions and for numerical convenience in finding the membrane force at r = 0. In addition, the integrated polynomial fit is a close match to the Gaussian fit in the spatial domain (see Appendix). Eliminating even-power terms from the polynomial ensures that it satisfies the boundary conditions (12) that ψ(s) and the second derivative of ψ(s) with respect to s must be zero at s = 0. We chose odd polynomial of order 11, which results in a total of 6 fitting parameters. This number of parameters resulted in a good fit and avoided unphysical oscillations in the fitted curve.
B. Curvature Generating Proteins
Since we treat only the initial stages of deformation, we assume for convenience a flat membrane profile, so H(s) = 0 in Eq. 2. This results in the CGP force
| (10) |
where κi is the spatial distribution of the bending modulus. The spatial variation of κi is assumed to result from the spatial distribution of the CGP proteins in a small patch. Note that a similar expression is obtained if a spatially varying spontaneous curvature is treated (see Appendix). As for the calculation of the internal membrane-bending forces, we do not include bending terms from the Gaussian bending energy in our CGP force calculation. Because of the spatial variation of κi, the Gaussian bending energy could in principle induce forces. However, this energy term is proportional to the product of the two principal curvatures [20]. Since the curvatures in the initial stage of endocytosis treated here are small, the Gaussian bending energy should be negligible relative to contributions from mean curvature.
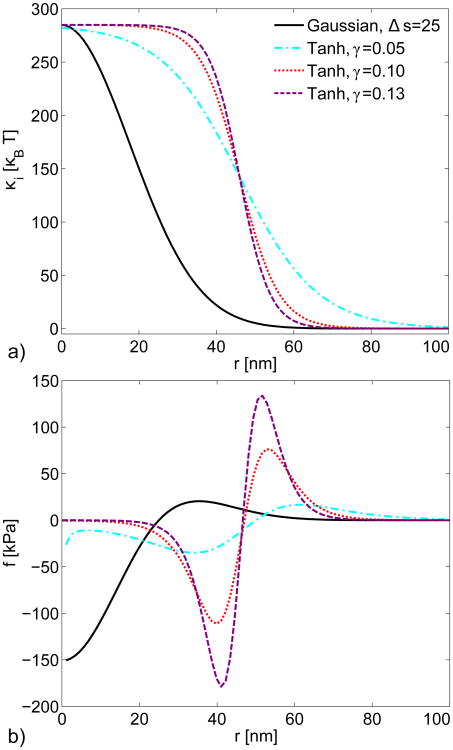
We selected the following two distributions, which model the transition of the CGP bending modulus from its maximum value κcgp at the center of the patch to near zero at the edge:
| (11) |
| (12) |
where γ determines the rate of the transition, s0 is the center of the transition, and Δs adjusts the shape of the Gaussian curve. Figure 3 compares various possible profiles and their corresponding forces. Again, we assume that ψ is small and cos θ ≃ 1. We chose a value of Δs so that the peak force from the Gaussian transition, in Fig. 3b, would be comparable to the forces obtained by the tanh forms. For the narrower tanh distributions, fCGP has the form of a force couple or bending moment at the edge of the distribution, with only weak forces in the center. This occurs because fCGP is proportional to the Laplacian of κi(s) (Eq. 10), which vanishes in regions where κi(s) is constant. The form of fCGP is consistent with the physical observation that bending a rod to a uniform curvature requires only bending couples at the ends, but no forces along the bulk of the rod. The proportionality to the Laplacian also implies that the maximum force appears near r = 0 for the transition from Eq. 12. We treat the transition radius of the preferred curvature s0 = 46 nm as a fitting parameter approximately equal to the transition radius of the wall force, calculated below. This choice of s0 minimizes the total force that actin polymerization must supply (see Appendix).
Fig. 3.
a) Possible profiles of the bending modulus in the CGP patch. For the hyperbolic tangent profiles (Eq. 11), the center of the transition occurs at s0 = 46 nm; Δs is in nm and γ is given in units of nm−1. b) Force densities fCGP resulting from the bending modulus profiles. A negative force indicates that CGP are pulling the membrane into the cell.
C. Cell Wall
We calculate the wall reaction force fW from the membrane bending profile in Fig. 2c. Consider Fig. 1 in which the turgor pressure is applied to the entire surface of the membrane, but fW acts only where the membrane and wall are in contact. We define fW as the elastic reaction force due to the displacement of the cell wall surface caused by the membrane pushing into it. We take the location of the separation point, or endocytic width RW, to be the point where fW=0. RW is crucial for estimating fA, and we estimate it from the experimental membrane profiles.
We created a second axisymmetric continuum mechanics model, shown in Fig. 4, to estimate fW. The cell wall and membrane are allowed to slide freely over each other. The bottom surface of the membrane is held rigidly in the shape of the mean experimental displacement. This rigid surface is displaced vertically, creating stresses in both the cell wall and membrane after contact. We increase this vertical displacement until the total force from the wall onto the membrane is balanced by the integrated turgor pressure (they do not balance point-by point), as discussed in connection with Eq. 1:
Fig. 4.
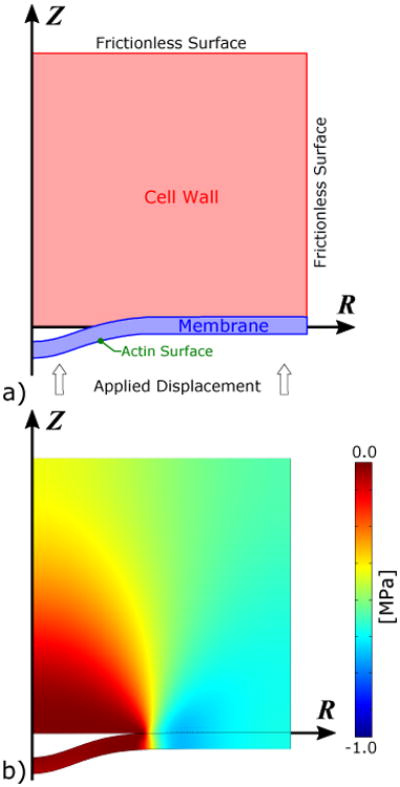
a) Axisymmetric continuum mechanics model used to estimate the wall reaction force fW during the initial stages of endocytosis. The interface between the cell wall and membrane is frictionless. A frictionless boundary condition (BC) with zero displacement in the z-direction is applied to the top surface of the cell wall. A frictionless BC with zero displacement in the radial direction is applied to the outer radius of both the cell wall and the membrane. The membrane is displaced vertically (in the z-direction) into the cell wall to create the wall force. The wall force on the membrane is estimated from fW = −σzz. b) The resulting stresses in the membrane and cell wall estimated by finite element solution of the continuum-mechanics model.
| (13) |
where fW is the Cauchy stress in the z-direction on the membrane surface in contact with the actin network and RA is the diameter of the actin network.
For both the cell wall and membrane we chose linear-elastic material models. For the cell wall, we chose material parameters of Young's modulus EW and Poisson's ratio νW. For the cell membrane, we chose material parameters of shear modulus μM and bulk modulus KM. Note that this membrane material model is only used to estimate the cell wall reaction force fW and is not used for the membrane bending forces. Although the model is approximate in that it ignores the liquid-like nature of the lipid bilayer for in-plane motions, we feel that it is sufficiently accurate for calculating the out-of-plane interaction forces with the cell wall.
This response of the model was found by finite-element (FE) simulation using COMSOL Multiphysics software (V.5.1) [27] to perform a 2D axisymmetric simulation. All geometry, moduli, and forces were non-dimensionalized using a length parameter of R0 = 25 nm and κ0 = 20kBT. The cell wall and membrane are initially separated with the contacting surfaces modeled as a frictionless pair. A frictionless BC with zero displacement in the z-direction was applied to the top surface of the cell wall. Similarly, a frictionless BC with zero displacement in the radial direction was applied to the outer radii of both the cell wall and the membrane. The cell wall domain was discretized into 5192 triangular elements, and the membrane domain was discretized into 386 triangular elements, using quartic interpolation functions for the displacement field. The size of the elements on the contacting surfaces were equivalent to 2 nm. The stationary studies were solved using the COMSOL parallel sparse direct algorithm with relative tolerance < 10−3. We compared solution results of various mesh sizes, interpolation functions, and tolerances to confirm the robustness of the results.
D. Growing Actin Network
The actin network is modeled as an elastic material initially having the shape of a hemisphere. Actin growth is concentrated near the boundary with the membrane since the nucleators of actin polymerization in endocytosis are membrane-bound [28]. We calculate the effects of inhomogeneous actin growth by FE simulation of a continuum mechanics model, as shown in Fig. 5. The initial configuration of the actin network is a hemisphere with radius RA. After each step of growth, material is added, and the actin network deforms to satisfy elastic equilibrium. Deformations from the growth result in a stress fA at the network-membrane interface. We assume that the actin network always remains attached to the membrane. We ignore the effect of the small initial membrane bending on the shape of the actin network, keeping the membrane-bound surface flat. This is legitimate, because the forces induced by the bending are much smaller than those induced by the actin growth. We thus apply a boundary condition (BC) at the network surface that prevents displacement in the z-direction. We do, however, allow free motion in the r-direction. In addition, the actin network is likely highly permeable to the osmolytes creating the turgor pressure, so a zero-force BC is imposed on the cytosolic boundary of the actin network.
Fig. 5.
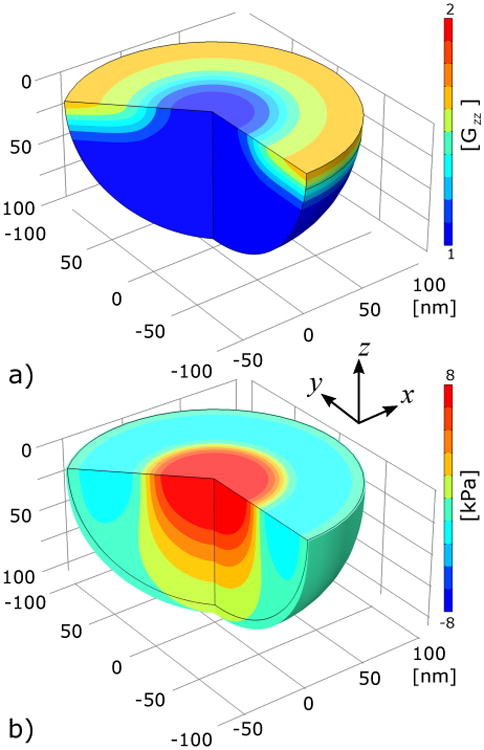
Results from FE simulation of the continuum mechanics model used to obtain the actin force fA from a growth distribution g(r) taken from the linear theory of Sec. 2.1.3. The actin network is modeled as a hemisphere with radius RA = 100 nm in contact with a rigid, freely sliding boundary at the membrane surface. The network is not permitted to pull away from the surface. a) The growth distribution in the model after a simulation time of 0.65 time units. b) The resulting stress σZZ in the FE model after a simulation time of 0.65 time units. Positive stress is tensile.
1. Growth Methodology
We treat the growth mechanics as in our previous model [16]. The total deformation tensor (including growth and elastic deformation) is defined as
| (14) |
where X⃗ is the initial location of a particle and x⃗ is the location of the particle after deformation [29]. Total deformation results from a combination of both growth and elastic strain. The relationship between these tensors is
| (15) |
where the hat indicates a tensor, F̂e is the elastic deformation, and Ĝ is the growth tensor. In the special case in which no elastic deformation occurs, the total deformation is equal to the growth tensor. The elastic strains [29] are given by
| (16) |
The growth distribution is built up gradually using a fictitious time variable t:
| (17) |
Here r is the radial coordinate along the membrane and z is the distance from the membrane. We focus on z-direction growth, as in our previous work [16]. The Gaussian decay factor implements our assumption that growth occurs near the membrane. The term g(r) gives the radial dependence of the estimated growth distribution, and the parameter Zp is the width of the growth zone away from the membrane. The growth distribution g(r) = 1 gives growth that is uniform across the z = 0 surface of the actin network. Then the network simply moves backwards with essentially zero force, because the viscous drag force is very small.
We incorporated growth into FE simulations of the axisymmetric model using COMSOL Multiphysics software (V.5.1) [27]. All geometry, moduli, and forces were non-dimensionalized using reference values of R0 = 25 nm for lengths and κ0 = 20kBT for the curvature modulus. The simulations for the linear growth models were run until a maximum strain of 0.1 was reached. The simulations for the fully nonlinear models were run until the peak stress reached the required peak stress estimated from the experimental data. Simulations were performed with the domain discretized into 2298 triangular elements with a size equivalent to 2 nm or less on the membrane boundary, using quartic interpolation functions for the displacement field. The quasi-static, time-dependent studies were solved using the COMSOL backward differentiation formula algorithm with absolute error tolerance less than 10−5 and relative tolerance less than 10−6. We compared solution results for various mesh sizes, interpolation functions, and tolerances to confirm the robustness of the results.
2. Actin Material Model
We use a slightly compressible, hyperelastic [29] material model for the actin network. Hyperelastic models describe materials that respond elastically under large deformations. Their constitutive laws take into account both material nonlinearity and nonlinearity due to changes in shape, in contrast to linear elastic models, which capture neither effect. Soft tissue and gels are commonly modeled with this approach [29]. We model the the actin network as a hyperelastic material because we expect it to undergo large deformations during endocytosis. We use a Fung-type variant [30, 31] as a general framework to us to describe a variety of nonlinear material behaviors. When the parameter α is very small (0.01) the Fung model behaves similarly to the classical Neo-Hookean material model, which is widely used to model isotropic soft tissues, gels, and rubber [29]. The strain energy density function is as follows:
| (18a) |
| (18b) |
| (18c) |
where is the elastic, right Cauchy-Green deformation tensor and Je = detF̂e is the elastic volume ratio [29]. The actin shear modulus μA, bulk modulus KA, and nonlinearity constant α are the key parameters. The strain energy is quadratic for small deformations, and increases exponentially for large deformations. The actin force density fA is then obtained as the z-direction stress at the membrane-bound surface of the actin network at the end of the simulation run.
E. Parameter Values
The parameter values are given in Table I. The cell wall thickness hW and Young's modulus EW are the lower values measured by Smith et al. [32]. For the cell wall Poisson's ratio νW we chose 0.49 which corresponds to a slightly compressible material. We chose a membrane thickness hm used in our previous study [16], which is consistent with measured values [33]. We chose a membrane shear modulus μM larger than previously used [16], to improve the simulation efficiency. The ratio KM/μM = 2 for the membrane is typical for close-packed materials. For membrane tension σ we selected 1 × 10⁻⁴ N·m−1, which is the largest value in the range given by Liu et al. [10]. The bending modulus of the bare membrane κB is the middle of the range of 10kBT to 30kBT measured by Rawicz et al. [34]. The values for the bending modulus of the curvature-generating proteins, κCGP, and the preferred curvature of CGP, H0, come from the experimental study by Jin et al. [35]. We selected the actin shear modulus μA and bulk modulus KA from our previous growth study [16]. The growth depth Zp was chosen as a the smallest value compatible with computational efficiency. The turgor pressure selected is near the middle of the range of literature values [36–40].
Table I. Parameter values.
| Parameter | Definition | Value | Comments |
|---|---|---|---|
| hW | Cell wall thickness | 100 nm | |
| EW | Cell wall Young's modulus | 110 MPa | Baseline |
| νW | Cell wall Poisson's ratio | 0.49 | Baseline |
| hM | Membrane thickness | 6 nm | |
| μM | Membrane shear modulus | 10 MPa | |
| KM | Membrane bulk modulus | 2 μM | |
| σ | Membrane tension | 1 × 10⁻⁴ N·m | |
| κB | Membrane bending modulus | 20 kB T | |
| H0 | CGP curvature | 0.02 nm−1 | Baseline |
| κCGP | CGP bending modulus | 285 kBT | Baseline |
| RA | Actin network radius | 100 nm | Baseline |
| μA | Actin shear modulus | 0.02 MPa | Baseline |
| KA | Actin bulk modulus | 10 μA | |
| α | Nonlinear Fung model parameter | 0.01 | Baseline |
| Zp | Growth region thickness | 25 nm | Baseline |
| P0 | Turgor pressure | 0.5 MPa | Baseline |
III. Results
A. Distribution of Actin Force Required to Drive Membrane Bending
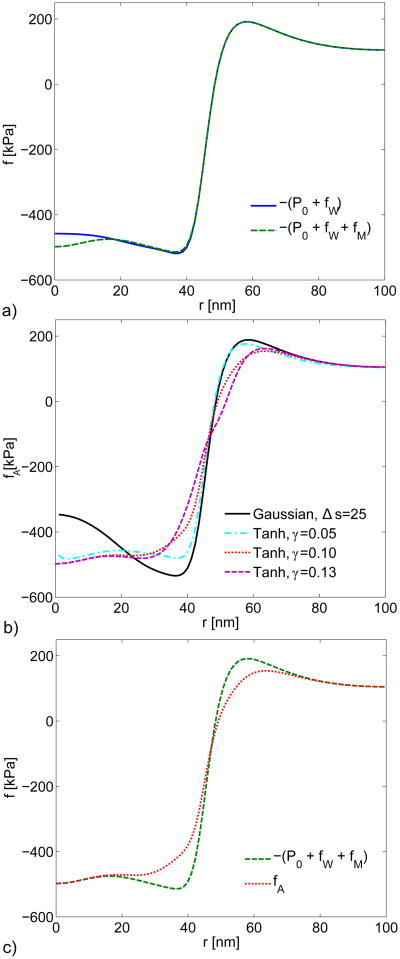
Figure 6a shows the combination of turgor pressure and wall force, − (P0 + fW), estimated from the model of Fig. 4, as well as the combination −(P0 + fW + fM), where fM is obtained from Eq. 2. The shape of −(P0 + fW) reveals a balance of forces from turgor pressure and cell wall at large r, while at small r the turgor pressure force dominates. The difference induced by including fM is small. Figure 6b shows the total actin force density fA = −P0 – fW – fM – FCGP obtained by combining the forces from Fig. 6a with the forces generated by the different CGP coat transition profiles from Fig. 3, using Eq. 10. The shape of fA is on the whole quite similar to that of −(P0 + fW), with a transition from negative (tensile) to a positive (compressive) force density near the point where the membrane separates from the cell wall. The maximum required pulling force is very close to P0, about 500 kPa. This shape is consistent with the “vertical distributed load” model considered in Ref. [12]. The actin force integrates to zero over the area of the actin network. Therefore, since the tensile force acts over a smaller area than the compressive force, the tensile force density is larger than the compressive force density. Fig. 6c compares fA with and without CGP. We selected the transition described by Eq. 11 with parameter γ = 0.10 nm−1 for the fCGP in this comparison as well as the following plots. It is seen that fCGP makes noticeable, but not dominant, corrections, reducing marginally the maximum force density that the actin must supply.
Fig. 6.
a) Wall reaction force plus turgor pressure (solid line) and black with inclusion of the internal membrane forces (dashed line). b) Total actin forces including the CGP force estimated from the Gaussian transition (solid line, Eq. 12) and the hyperbolic tangent transitions (broken lines, Eq. 11); Δs is in nm and γ is given in units of nm−1. c) Total actin force fA with (dotted line) and without (dashed line) fCGP obtained from Eq. 11 with γ = 0.10 nm−1 (dotted line). All curves generated from Eq. 11 have a transition radius of s0 = 46 nm.
B. Calculation of Actin Growth Profile
As a starting point for calculating the actin growth distribution that generates the required forces, and as a tool for obtaining improved growth profiles by iteration, we use a simplified approach based on linear elasticity. We analyze growth at the flat boundary between a semi-infinite elastic medium described by a bulk modulus K and a shear modulus μ, corresponding to the actin network, and an infinitely hard solid, corresponding to the combination of the cell wall and membrane. The boundary is at z = 0. The growth of the actin network is taken to be along the z-direction. For simplicity we take the growth to be completely localized z = 0. This is an approximation, since growth in the simulations is distributed over a distance Zp away from the boundary. The approximation should be accurate since Zp is much smaller than the actin network thickness. We denote the total extent of growth by , where we have assumed circular symmetry and r = [x2 + y2]1/2. The growth imposes a displacement uz(r) = h(r) at the boundary of the actin network. The relationship between uz (and thus h) and the force density fA is given by elasticity theory [41]:
| (19) |
where the integral is independent of the orientation of r⃗; r⃗ and r⃗′ are two-dimensional vectors in the plane of the boundary. Since g has circular symmetry and the two-dimensional Fourier transform of 1/r is 2π/k, the Fourier transform of this equation is
| (20) |
where . We use this result, together with our estimates of fA(r) and a numerical Fourier transform, to calculate h(r). We then take g(r) in Eq. 17 to be proportional to h(r) in our initial estimates and iterative improvements of our growth profiles.
Note that in Eq. 20, uniform growth corresponds to k = 0. Inverting Eq. 20 shows that f̃A(k) is proportional to kh̃(k), which vanishes as k → 0. Therefore uniform growth produces no forces. This is consistent with the physical picture that uniform growth of the actin network gives uniform retrograde motion of the network, which requires essentially no force because of the small velocity and physical size of the network. The prediction of Eq. 20 is approximate in two ways. First, it is based on a semiinfinite actin network, as opposed to the hemispherical network in our simulations. Second, it is valid only for sufficiently small amplitudes of growth and force that small-strain approximations of linear elasticity are accurate.
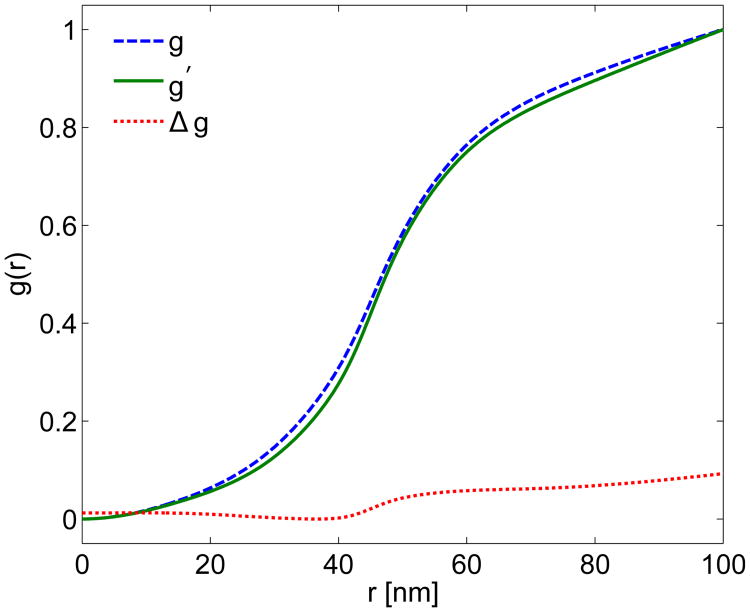
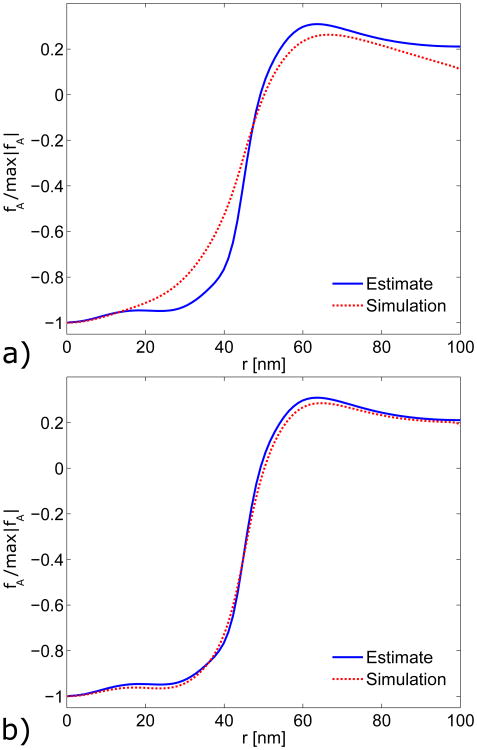
The resulting growth profile shown in Fig. 7 is normalized by its maximum value to facilitate convenient comparisons between multiple growth profiles. We incorporated this growth profile into our fully nonlinear FE simulations and calculated the resulting force distribution. In Fig. 8a, these simulation results are compared to the “estimated” forces obtained from Eq. 1, with both forces normalized by their largest magnitude. The force distribution from the simulations is reasonably close to the estimated one.
Fig. 7.
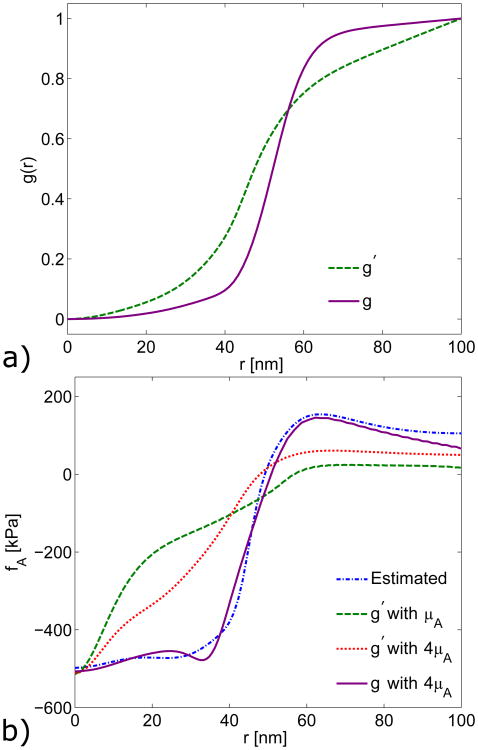
Growth distributions using the linearized growth theory (LGT). The dashed line is the growth distribution g calculated using LGT directly from the estimated actin force fA. The dotted line is a growth distribution A Δg, where Δg is the growth distribution resulting from using the difference between the simulated and estimated actin force as the input to the LGT. The solid line is the linearly corrected growth distribution g′ = AΔg + g, with A = 35.
Fig. 8.
Comparison of simulated (dotted lines) force density generated by FE code from LGT growth profiles (Fig. 7), with force density estimated from experimental observations [8] (solid lines). a) Actin force density resulting from linear growth profile g. b) Actin force density resulting from corrected growth profile g′.
But a much closer estimate of the growth distribution can be achieved by making iterative corrections to the original estimate. First, the difference between the normalized simulated and estimated actin forces is found by
| (21) |
where is the simulated force and fA is the estimated force. Second, the differential growth distribution Δg needed to account for Δf is estimated from Δf using the LGT. Next, the adjusted growth profile is calculated using
| (22) |
where A is a fitting parameter. Finally, the adjusted growth profile g′(r) is normalized before being implemented in the growth simulation. We repeated the correction process twice to achieve a better fit. Fig. 7 shows the profiles g and g′, with g′ and the difference term Δg both obtained from the second correction. As seen in Figure 8b, applying multiple corrections to the growth profile gives close agreement between the force obtained from the FE simulations and the experimentally estimated profile. Thus an iterated solution based on a linear starting point can closely reproduce the shape of the required actin force density fA. However, the magnitudes of the force densities obtained by the linear theory are too small. To obtain a force density with the correct magnitude an iterative approach with a more accurate starting growth profile is required.
To develop such an approach to matching both the shape and magnitude of fA, we used an initial guess to the growth distribution, followed by an iteration procedure based on the linear theory. To obtain an accurate force density, it was necessary to increase the actin shear modulus by a factor of four, to 0.08 MPa. We started by implementing a number of arbitrary growth profiles in the FE simulation and comparing the simulated actin forces at full magnitude with the estimated actin force. The best results came from using a growth profile of
| (23) |
where r0 = 52.5 nm is the transition radius and η = 0.16 nm−1 determines the slope at r0. This profile was then corrected using the LGT as in Eq. 22. The correction process was repeated three times resulting in the corrected growth profile g(r) in Fig. 9a. The linearly corrected growth profile g′(r) from Fig. 7 is included for comparison, and the two growth profiles are notably different. Figure 9b shows a close agreement between the actin force density estimated from the experimental profile and that simulated using the nonlinear-strain growth model.
Fig. 9.
a) Corrected fully nonlinear growth profile g from a general growth calculation (solid line), compared with normalized linearly corrected growth profile g′ (dashed line). Calculations performed with a shear modulus of 4μA = 80 kPa. b) Direct, full-magnitude comparison of actin forces estimated from the experimental profile (solid line) and simulated using the nonlinear-strain growth model (broken lines).
Since we found that the turgor pressure P0 is the main factor opposing the initial stages of endocytosis, we studied the effect of varying P0 from 0.25 to 2.0 MPa. We expected these changes to affect both the total actin pulling force FA, which must be supplied by actin polymerization, and the point RW at which the membrane separates from the cell wall. FA is found by integrating fA from r = 0 to RW. Note that FA corresponds to the point force assumed in other models [11] required to initiate endocytosis and RW is nearly the point at which the membrane separates from the cell wall. As shown in Table A4, turgor pressures between P0 = 0.25 MPa and P0 = 1.0 MPa result in FA values ranging from 1500 pN to 5000 pN. Such a large variation is expected because the turgor pressure directly opposes invagination. The FA values are larger than we found previously [16], most likely because in our previous work the crossover to actin occurred at a smaller radius. RW is relatively insensitive to P0. Since the width of our calculated polymerization hole is mainly determined by RW, this means that the shape of g(r) is insensitive to the turgor pressure that is assumed.
IV. Discussion
The general shape of the growth distribution g(r) shown in Fig. 9a is similar to that assumed in our earlier study [16]. The main difference is that the transition in the current g(r) occurs at larger r (45-50 nm vs 30 nm). The width of the transition is quite similar to the earlier one; in both cases taking g(r) from 20% to 80% of its maximum value requires an increase of about 30% in r. Our finding that g(r) in Fig. 9a generates the forces required to overcome turgor pressure and membrane-bending forces supports the general picture of endocytic invagination being driven by a ring of rapid growth around a central core where growth is slower. This finding relies on two key assumptions:
That F-actin at endocytic sites in yeast has a shear modulus much higher than cortical actin networks in other cell types. This is supported by the high density of F-actin and crosslinkers in the patches. If we assume a hemispherical patch of radius 0.1 μm [16], the volume of the patch is (2π/3)(0.1μm)3 = 2.1 × 10⁻³μm3. If we assume 6000 F-actin molecules in this patch [42], the actin concentration is 4700μM. Previous measurements [43] of the Young's modulus of branched actin gels at a density of 170μM obtained values of about 5 kPa. If we assume that the Young's modulus is proportional to the density, the resulting Young's modulus for the endocytic actin patch is 140 kPa, substantially higher the the value of 80 kPa required for invagination in our model. Simple theoretical estimates give similar values. Each actin subunit has a length increment of 2.7 nm, so the total length of F-actin is 19 μm. Treating the filament as a cylinder of radius 2.5 nm taken as the average of the minor and major radii [44], we find a total actin volume of 3.7 × 10⁻⁴μm3, giving a packing fraction of 18%. If we assume that the network deforms affinely under shear deformations, the deformation of the individual actin filaments is the same as that bulk deformation. Then the Young's modulus of the network is the Young's modulus of the material constituting an actin filament (estimated at 2.6 Gpa in Ref. [44]) times the packing fraction, or 470 kPa. The assumption of affine deformation is supported by the high density of crosslinkers - one molecule of the crosslinker fimbrin for approximately every ten molecules of polymerized actin [45]. These will tend to inhibit sliding of filaments parallel to each other. Thus both experimental measurements and theoretical estimates suggest that the high densities of F-actin and crosslinkers can produce a Young's modulus high enough to drive membrane invagination.
-
That actin network growth can proceed against the very large opposing forces resulting from the turgor pressure. We find that even after the forces from the curvature-generating proteins are accounted for, the total pulling force required from the actin network (obtained by integrating the portion of Fig. 6 where fA is negative) is 2800 pN. This value is consistent with Ref. [11]; Ref. [6] obtained a smaller value of 900 pN for a very narrow mature pit, but indicated that the force could be much larger for the initial indentation. The number of growing filaments is 100-150 [46], so forces on the order of 15 pN per growing filament are required. Within the Brownian-ratchet theory [47], the stall force estimated for a 2 μM free actin concentration A [46] is only fstall = (kBT/δ) ln (A/Ac) ≃ 5pN [48], using a critical concentration of 0.1μM [49] and a polymerization step size δ = 2.7nm. One possibility for making up the missing 10 pN of force per filament is that type-I myosins enhance force generation [6]. They could bind the filaments to the membrane and move to the growing tips of the actin filaments after each polymerization event. This would keep them far enough from the membrane that new subunits can be added freely [21] despite the opposing force. The force-generating capability of yeast type-1 myosins is not known, but mammalian type-1 myosins can generate up to 5 pN of force per molecule [50]. The number of type-I myosins is about 150 [46], comparable to the number of growing filaments. If each actin filament tip has a myosin aiding its polymerization by supplying 5 pN of force, a total force of 10 pN per actin filament could be achieved. Note that the actin filaments will not buckle even at this high a force. Quantitative fluorescence measurements [51] suggest that the actin network contains 300 filaments (capped plus force-generating; taken as the number of Arp2/3 complexes). Then 7000 actin subunits corresponds to an average filament length of l = 7000 × 2.7nm/300 = 63 nm. The Euler buckling force [52] for a filament of this length is fB = π2kBTl0/(2l)2 = 38 pN, where lp ≃ 15μm is the persistence length of actin filaments [44].
The fractional discrepancy between the 10 pN estimate and the 15 pN required to overcome turgor pressure is smaller than the fractional error in the turgor pressure, whose measured values have ranged from 0.2 MPa to 1.0Mpa. Recent experiments [40] using rapid indentation to avoid the confounding effects of osmoregulation suggest that the lower end of the range may be more accurate. Finally, the turgor pressure at the endocytic site may not be as large as is generally believed. Channel clusters [53] might occur at the endocytic site and thereby reduce turgor pressure by the local release of osmolytes [16, 54]. Thus 10 pN of force per filament may well be enough to drive invagination.
We also found that turgor pressure makes the dominant contribution to the force distribution that actin growth must overcome, if commonly accepted estimates of turgor pressure are used. In Fig. 6, it is clear that the baseline turgor pressure force is an order of magnitude larger than either the membrane bending force or the CGP force. This finding is consistent with those of Refs. [11] and [6], but disagrees with the findings of Ref. [12], who used a much lower turgor pressure and found that the membrane bending forces played a large role. Finally, we found that the forces generated by the CGP profiles with a sharp transition from patch to bare membrane, as in Eq. 11, produce a force couple as shown in Fig. 3b. These forces tend to “round-off” the sharp transitions in the actin force where the membrane separates from the wall. This effect lowers the overall required forces and may aid the actin by allowing a smoother growth distribution at the membrane surface. They reduce the total pulling force required from actin, but do not have a large effect at the center of the invagination.
How could the distribution of actin growth be measured? One possible approach is based on the fact that the shape of the actin network should closely reflect the growth profile, if external stresses on the surface of the network are absent. Since the turgor pressure causes the dominant opposing force, eliminating the turgor pressure would eliminate most of the external stresses. Thus, in principle, one could measure the growth profile as follows. One first allows actin to polymerize up to a point where the membrane is about to detach from the wall, and then abruptly reduces or eliminates the turgor pressure by adding osmolyte to the medium. Alternatively, simply waiting for a short time before freezing in an electron microscopy study might allow a drop in turgor pressure. The three-dimensional shape of the actin distribution after the turgor pressure is reduced would then be nearly that dictated by its growth. The shape could be measured by either electron tomography or 3D superresolution microscopy measurements of the actin distribution.
We have evaluated the robustness of our results by performing a number of studies to determine the effect of changes in the model parameters on both the simulated and estimated actin forces. As discussed above in Results, changes in the turgor pressure affect the magnitude of the required actin pulling force, but do not strongly impact the shape of the growth distribution g(r). For the simulated actin force we varied the parameters RA, α, and Zp. We found that the quality of fit of the model was sensitive only to values of Zp smaller than 25 nm (see Table A2), which is likely due to the increased distortion of elements at the actin surface for a smaller Zp. We found that large percentage changes in the parameters EW, νW, κCGP, s0, and H0 relative to our baseline model resulted in relatively modest changes in FA and RW (see Tables A3 and A4).
Supplementary Material
Acknowledgments
This work was supported by the National Institutes of Health under Grant R01 GM107667.
Appendix
Fitting Membrane Profiles to Experimental Data
We selected membrane profiles from the experimental study by Kukulski et al. [8] to estimate a mean membrane profile during the initial stage of endocytosis. Profiles that had invaginations of 11 nm or less and a clear peak were initially collected. These profiles were labeled by the authors of the experimental study [8] as 120, 1013, 1014, 1017, 1018, 1021, and 1023. The maximum invaginations of each profile are listed in Table A1. Three of these profiles are clearly symmetrical (profiles 120, 1014, and 1017), and this set of profiles is referred to as the “Symmetric Selection” set in Table A1. Of the remaining profiles, one side or the other (from the peak displacement) fits the general shape of the Symmetric Selection set. We refer to the set of profiles including both the Symmetric Selection set and the partial profiles as the “Outlier Rejection” set. Table A1 indicates which sides of the profiles are included in the Outlier Rejection set.
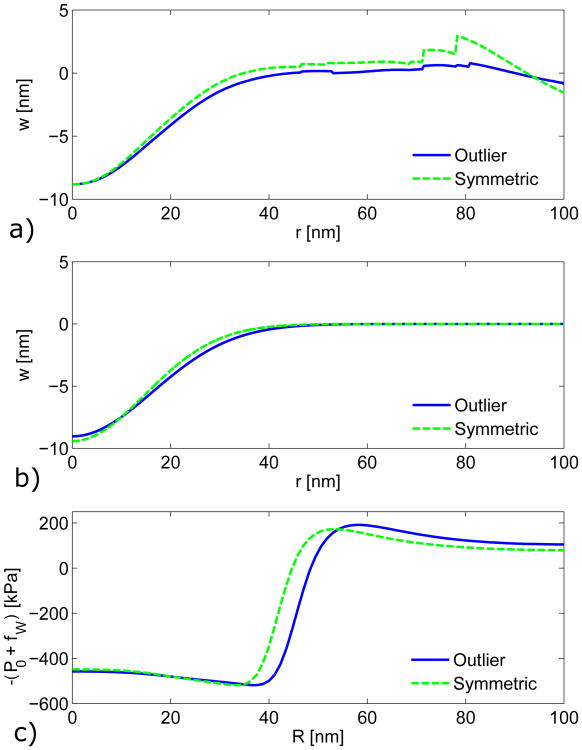
To find a mean profile, the profiles are flipped vertically to follow the convention shown in Fig. 2b, and the axis of rotation is taken to be the maximum displacement point. Before averaging, profiles are normalized by their respective peak invaginations and interpolated using a cubic spline along a common grid. The invagination depth of the resulting mean profiles, shown in Fig. A1a, is the mean depth of the original profiles. The mean profiles from the Outlier Rejection and Symmetric Selection sets are similar.
Sensitivity Studies
In this section, we discuss a number of parameter studies we performed to assess the effects of parameters on the growth simulations and the estimated actin force.
1. Fitting of Membrane Profile
Figure A1b shows a Gaussian fit (see Eq. 7) of the two mean profiles from Fig. A1a. The Symmetric Selection set results in a displacement profile with a slightly narrower dimple. Note that the fitting parameter B from Eq. 7, which does not affect the curvature, has been discarded in both cases. The resulting force densities −(fW + P0) from the FE simulations for both the Outlier Rejection and Symmetric Selection sets are compared in Fig. A1c. The force density from the Symmetric Selection set is about 4 nm narrower at the point (defined here as the location where fW + P0 = 0) than for the Outlier Rejection set. This indicates that is not particularly sensitive to the selection criteria of the membrane profiles.
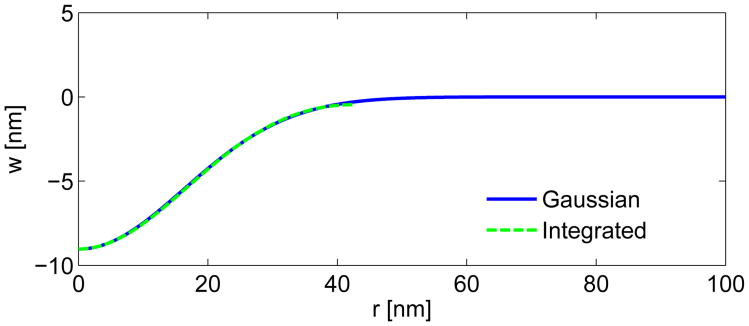
In the spatial domain (r and z), we fit the mean displacement profile from Fig. 2c using a Gaussian function. A Gaussian curve provides a continuous fit to the full radius of the actin patch (100 nm or more). Since the mean data from Fig. 2 is continuous to about 46 nm, a Gaussian fit is more convenient than a polynomial fit for the full actin patch. We chose a polynomial fit in the arc length coordinates (s and ψ(s)) for convenience in implementing the boundary conditions for Eq. 2. For the polynomial fit, the BCs could be met by constraining the odd terms to vanish. In order to compare these two fits, we transformed the polynomial fit into the spatial domain by numerically integrating the following two relationships:
| (A1) |
| (A2) |
where S is the maximum curve length (S ≈ 46 nm). For the integration constant z0 in Eq. A2, we chose the parameter A from the Gaussian fit in the spatial domain (see Eq. 7). Figure A2 provides a comparison of the Gaussian and integrated polynomial fits in the spatial domain. The comparison between the two fits is quite close, and the choice of two different fitting functions for the spatial and arc length coordinates appears reasonable.
2. Growth Parameters
For a numerical assessment of the agreement between the estimated and simulated actin forces, we use a normalized, absolute-mean error EA. This error is defined as
| (A3) |
where is the simulated actin force, fA(r) is the estimated actin force, and RA is the radius of the actin patch.
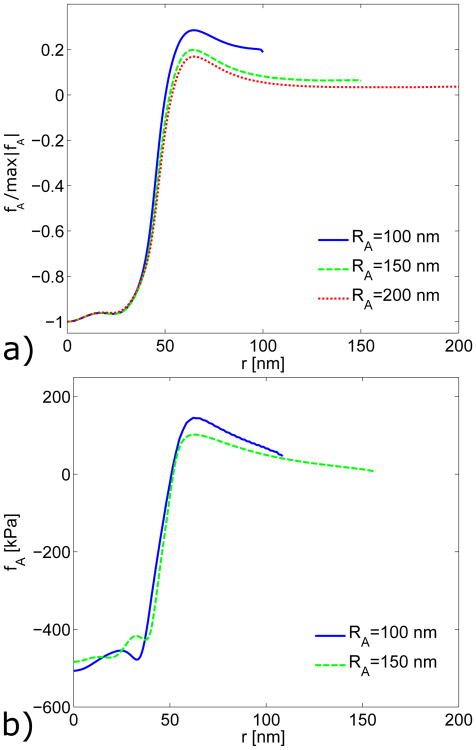
Effect of the Actin Network Radius on Calculated Growth Forces. We tried increasing the actin patch radius to 150 nm. The shape of the calculated force profile was similar to the 100 nm baseline case, as shown in Fig. A3. The compressive force density is lower for the actin radius of RA = 150 nm, as expected for the larger area. Table A2 shows that the actin radius has almost no effect on the agreement between simulated and estimated actin forces for simulations with linear or nonlinear strains.
Effect of the Parameter α in the Fung model. We ran growth simulations with α taking the values 0.001, 0.01, and 0.02, using the same growth profiles as in the baseline simulations. The change in α resulted in no appreciable difference in the simulated actin force density fA. Table A2 shows no significant changes in agreement between simulated and estimated actin forces due to changes in α.
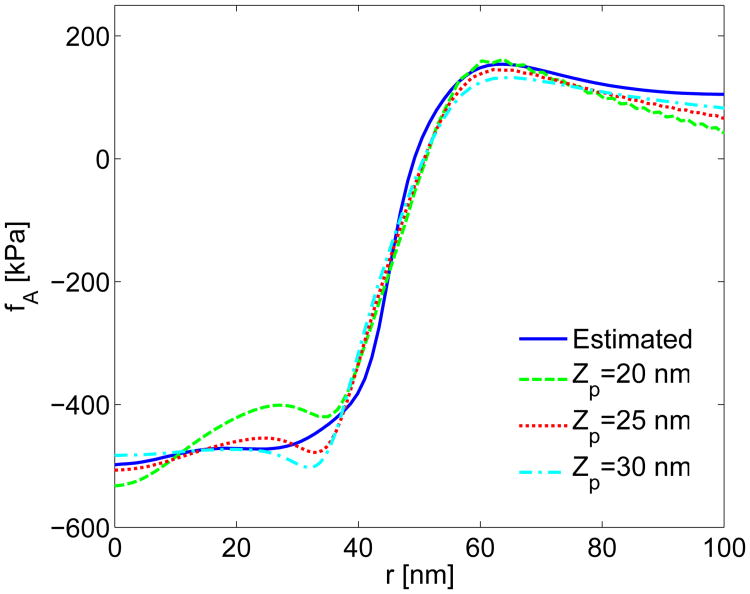
Effect of the Polymerization Region Thickness. We ran growth simulations with polymerization region thicknesses of Zp = 20, 25, and 30 nm, again using growth profiles from the baseline simulations. The differences in fA for Zp = 25 and 30 nm were insignificant as is apparent from Fig. A4 and Table A2. As seen in Fig. A4, the differences in fA between the simulations with Zp = 20 and 25 nm were more noticeable. Table A2 also indicates a poorer fit between simulated and estimated actin force for Zp = 20 nm. Thus the nonlinear-strain growth model is sensitive to Zp parameters below 25 nm, but it is not particular sensitive to larger values of Zp.
-
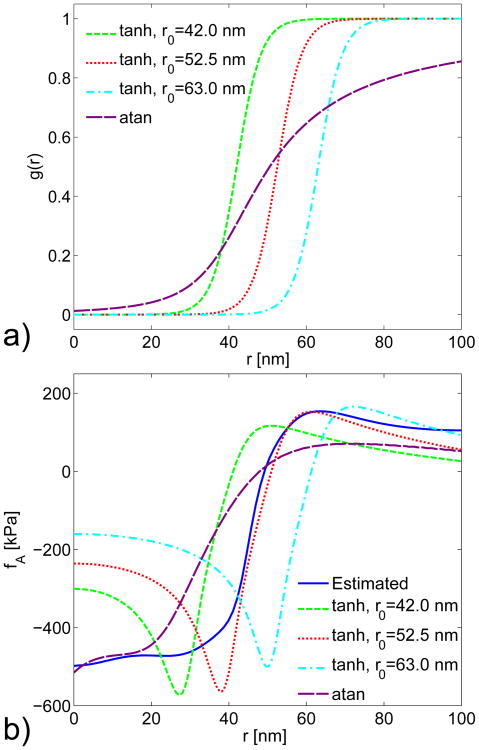
Effect of Shape of Growth Profile. Finally, we simulated the actin force density generated by several arbitrarily chosen growth profiles shown in Fig. A5a. We tried several parameters for the profile defined in Eq. 23 and a fitted profile based on our previous work [16]:
(A4) It is clear that the different forms and parameters generate substantial differences in the calculated force densities. Thus the calculated actin force density is sensitive to the form and width of the growth profile. Therefore, a growth profile that generates the correct actin force density is likely to be reasonably correct.
3. Cell Wall Parameters, Turgor Pressure and Geometry
-
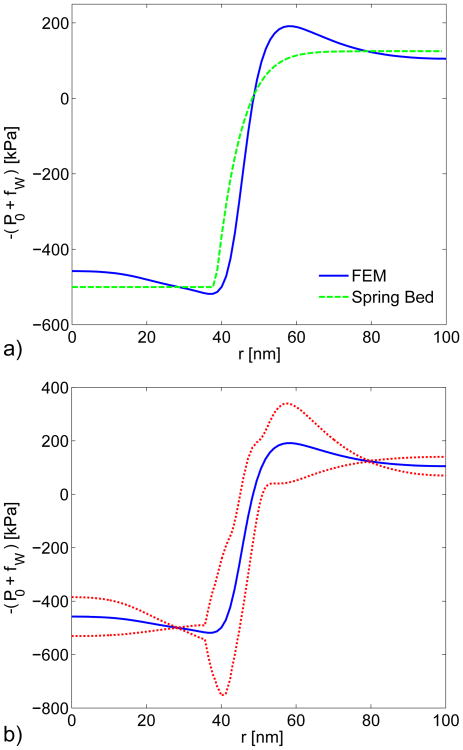
Effect of Mechanical Model of Cell Wall. We modeled the cell wall as both a continuous material (using FE simulation; see Fig. 6) and with a linear-spring bed model (not shown), and calculated fW using each model. The spring bed model assumes that the displacement of the cell wall at any particular point along the wall is independent the displacements at other points. A comparison of the force −(fW + P0) between both models for a turgor pressure of P0 = 0.5 MPa is shown in Fig. A6a. The sharp transition that occurs at r ≈ 38 nm for the spring bed model is the location at which the membrane separates from the cell wall. The transition is smooth for the continuous material model because displacements at any particular point along the cell wall impact the displacements at other points.
The two cell wall models represent extremes in treating the cell wall as a continuous or spatially uncoupled material. We expect that the behavior of the cell wall to fall somewhere within these two approaches. To estimate the sensitivity to the mechanical properties assumed for the cell wall, we performed a sensitivity analysis using both cell wall models and three turgor pressures. We used an error propagation approach [55] to estimate the sensitivity to the two types of models. We define the standard error or sensitivity at a given r as
(A5) where Pn = 0.25, 0.50, and 0.75 MPa are the three turgor pressures in the study, and N = 3 for three pressures. Figure A6 shows the force (fW + P0) ± αT for P0 = 0.5 MPa. The largest sensitivities tend to occur at the transitions at r ≈ 38 and r ≈ 58 which are the locations where the continuous assumption makes the largest impact. The sensitivity of to the cell wall model is less than 6 nm. The term is defined here as the location at which fW + P0 = 0, and is expected to be the location where the membrane separates from the cell wall. This indicates that the location at which the membrane separates from the cell wall is not particularly sensitive to the cell wall model chosen in the analysis.
Effect of Poisson's Ratio. In addition to comparing the different cell wall models, we also performed a study changing the Poisson's ratio in the continuum model of the cell wall. The baseline Poisson's ratio of ν = 0.49 assumes that the cell wall is nearly incompressible. For a turgor pressure of P0 = 0.5, we ran additional FE simulations for Poisson's ratios of ν = 0 and 0.3. For all three cases, the actin force fA was nearly identical. We also calculated the pulling force FA and location RW where fA crosses from positive to negative. For all of the following cell wall parameter studies we define the pulling force as the total actin force, fA, integrated over the area from r = 0 to r = RW. Table A3 shows only small variations in FA and RW due to large changes in the Poisson's ratio. Based on these results, the main results of the continuum mechanics model of the cell wall are not sensitive to Poisson's ratio.
Effect of Young's Modulus. We varied the Young's Modulus EW of the cell wall to assess the effect on both FA and RW. Table A3 shows FA and RW for both the continuum and linear-spring bed models of the cell wall with Young's Moduli of E = 1/4 × 110, 1/2 × 110, 110, and 2 × 110 MPa. Based on this study, neither FA nor RW are particularly sensitive to the cell wall Young's modulus.
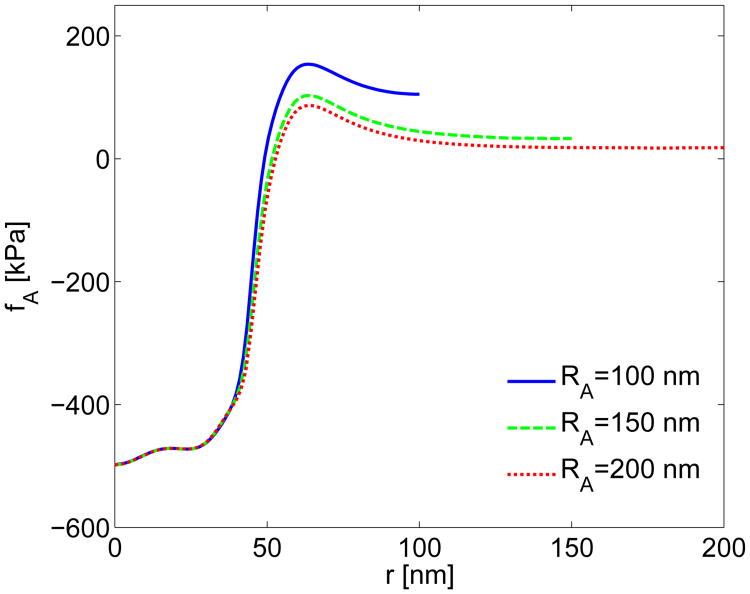
Effect of Actin Network Radius on on Force Profile Obtained from Experiments. The required actin force densities fA calculated for the actin network radii of RA = 100, 150, and 200 nm are shown in Fig. A7. Table A3 shows the corresponding values of FA and RW for both the continuum and linear-spring models for all three radii. The continuum model is insensitive to the width of the actin network, with almost no change in FA or RW for large changes in RA. The total pulling force FA for the linear-spring bed model is also insensitive to changes in actin network radius. The radius RW in the spring bed model does vary for different actin radii. However, with a maximum change of 8 nm for a 300% increase in actin network area, this model does not appear to be particularly sensitive to the actin network radius.
Effect of Turgor Pressure. The turgor pressure study summarized in Table A4 is discussed in the main text describing the continuum model of the cell wall. The results for the spring bed model are similar.
4. Membrane and CGP Parameters
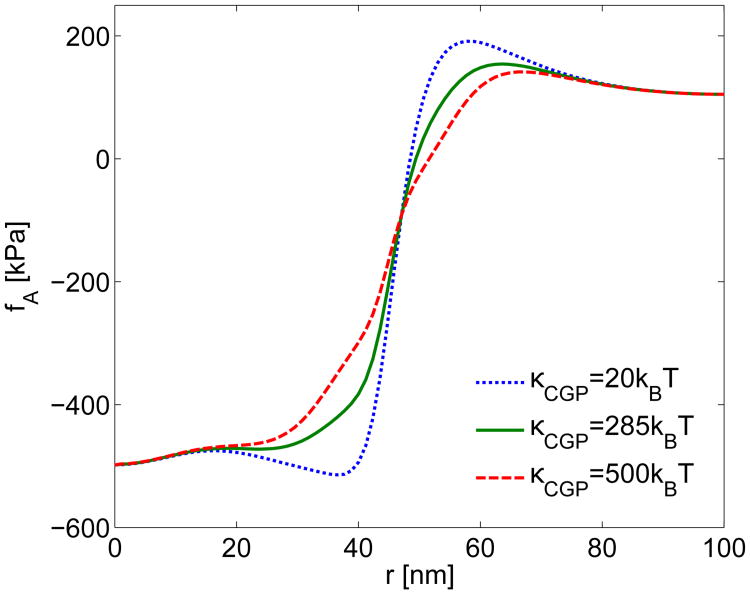
CGP Bending Modulus. To observe the effect of changes in the CGP bending modulus on the actin force obtained from the growth simulations, we calculated the total actin force for several bending moduli: κCGP = 20kBT, 285kBT, and 500kBT. Figure A8 shows that for a small bending modulus comparable to the bare membrane bending modulus κCGP = 20kBT, the CGP continue to generate a relatively small force. On the other hand, nearly doubling the CGP bending modulus to κCGP = 500kBT results in a noticeably more rounded actin force density. Further increases in CGP bending modulus result in an actin force that is no longer smooth at the transition point at s0 = 46 nm. Table A5 shows that the changes in CGP bending modulus have a minimal effect on both FA and RW. For all membrane and CGP parameter studies we define the pulling force as the total actin force fA, integrated over the area from r = 0 to r = Rw, where RW is the radial position at which fA = 0. On the whole, the results are not strongly sensitive to changes in κCGP.
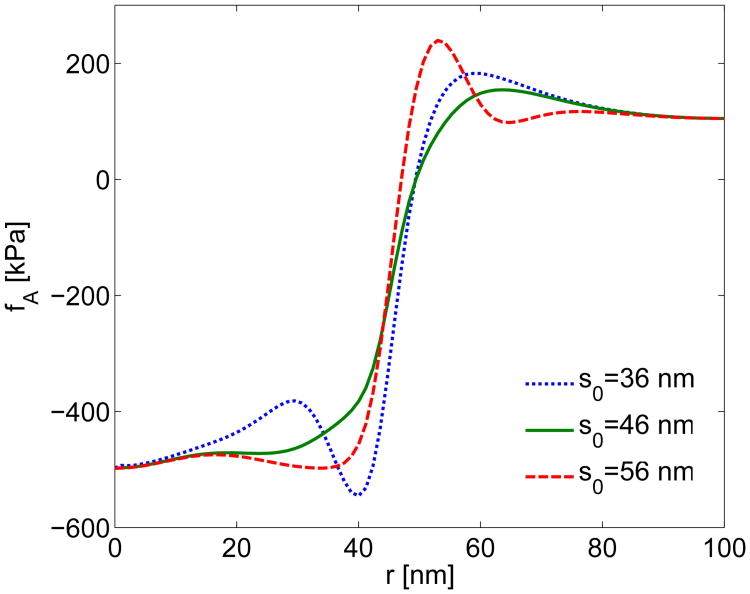
Transition Radius. We treated the transition radius s0 of the preferred curvature of the CGP as a fitting parameter when estimating the total actin force. The transition radius was approximately equal to the radius where the first derivative of the force fW + P0 was maximized, which resulted in a transition radius of s0 = 46 nm. In Fig. A9, actin forces with transition radii of s0 = 36, 46, and 56 nm are compared to highlight the effect of this parameter. Selecting a transition radius larger or smaller than s0= 46 nm results in enhanced spatial fluctuations in the actin force density. In addition, Table A5 shows that the changes in transition radius have a minimal effect on both FA and RW. However, our chosen value minimizes the required force FA. Thus we feel that this choice of transition radius makes physical sense.
Preferred Curvature. We also considered the effect on the actin force of changing the preferred curvature H0 of the CGP. We observed the effect of a selected range of preferred curvatures (H0 = 0.016, 0.02, and 0.024 nm−1) on the estimated actin force. We found that for this range, the change in shape of the actin force was minimal. In addition, Table A5 shows that the changes in preferred curvature have a minimum effect on both Fa and RW.
-
Alternative CGP Patch Transition. Finally, an alternative approach to modeling the transition of the CGP patch is to vary the preferred curvature and keep the bending modulus constant. The CGP forces are then defined by
(A6) where HC is preferred curvature of the CGP proteins. The preferred curvature is modeled with the tanh function:
(A7) where H0 is the maximum preferred curvature. When the CGP forces are calculated using Eqs. A6 and A7 for the same baseline parameters, the resulting actin force is nearly identical to the baseline case which uses Eq. 11. Using the transition curvature in Eqs. A6 and A7 results in a pulling force and endocytic width of FA = 2800 pN and RW = 48 nm, respectively.
Fig. A1.
Comparisons of a) the mean profiles, b) Gaussian fits of the mean profiles, and c) the resulting wall reaction forces using the displacement sets defined in Table A1. The curves found using the “Outlier Rejection” displacement sets are represented by solid lines, and those found using the “Symmetric Selection” displacement sets are represented by dashed lines.
Fig. A2.
Comparison of the Gaussian fit of the mean displacement profile (see Fig. 2c) and the integrated polynomial fit of the mean displacement profile in the arc length domain. The integration of the polynomial fit is only continuous to a radius of r ≈ 46 nm.
Fig. A3.
Comparison of actin force fA obtained from growth simulations for increasing radii of the actin patch. a) Normalized actin forces for linear strains. b) Full-magnitude comparisons of actin forces for nonlinear strains.
Fig. A4.
Comparison of actin force fA from actin growth simulations for nonlinear strains and polymerization region thicknesses of Zp = 20, 25, and 30 nm. The corrected growth profile g(r) from Fig. 9a was used for all three simulations. “Estimated” denotes force profile obtained from experimental data.
Fig. A5.
a) Growth profiles used for simulating actin forces. The tanh curves are defined by Eq. 23 with parameter values of η = 0.16 nm−1 and r0 = 42.0, 52.5, and 63.0 nm. The atan curve is based on Eq. A4 with r0 = 39.5 nm, and 0.1r0 is replaced with a fitted value of 14.5 nm. b) Comparison of simulated actin force fA using the growth profiles from Fig. a) (broken lines), and the actin force density estimated from experiments (solid line).
Fig. A6.
a) Comparison between the cell wall reaction force and turgor pressure (fW + P0) using elastic continuum (solid line) and linear-spring bed (dashed line) models of the cell wall. The turgor pressure in both simulations was P0 = 0.5 MPa. b) Sensitivity analysis comparing the continuum and linear-spring bed cell wall models. The forces fW + P0 from the continuum model with P0 = 0.5 MPa (solid line) and (fW + P0) ± αT (dotted lines) are shown. The sensitivity αT is calculated from Eq. A5.
Fig. A7.
Comparison of actin force profiles fA estimated from experiments for increasing radii of the actin network. The model from Fig. 4 was used to estimate the actin force for RA = 100, 150 and 200 nm with a matching cell wall and membrane radius in each case.
Fig. A8.
Study of the effect of the bending modulus κCGP on the actin force fA estimated from experiments. The CGP forces were generated from the hyperbolic tangent transition from Eq. 11 with γ = 0.1 and s0 = 46 nm.
Fig. A9.
Study of the effect of center of the transition radius s0 of the CGP on the experimentally estimated actin force fA. The CGP forces were generated from the hyperbolic tangent transition from Eq. 11 with γ = 0.1.
Table A1.
Curves from the experimental study by Kukulski et al. [8] that have less than the maximum invagination of 11 nm and have a clear axis of symmetry. Profile numbers are those of Ref. [8]. The maximum displacement of the invagination at the axis of symmetry is given for each profile. For the “Outlier Rejection” set, the sides included in the averaged profile are indicated. The “Symmetric Selection” set includes both sides of the selected profiles.
| Profile | Maximum Disp. [nm] | Outlier Rejection | Symmetric Selection |
|---|---|---|---|
|
| |||
| 120 | 7.5 | left & right | left & right |
| 1013 | 6.9 | left | |
| 1014 | 6.7 | left & right | left & right |
| 1017 | 9.2 | left & right | left & right |
| 1018 | 10.4 | left | |
| 1021 | 10.8 | left | |
| 1023 | 10.2 | right | |
Table A2.
Effect of growth and material parameters on quality of fit. RA is the radius of the actin network, α determines the nonlinearity in the Fung model, and Zp is the width of the growing region of the actin network. For each set of parameters, the error EA between the simulated and estimated actin force is given. The error EA is the normalized, absolute-mean error integrated over the surface of the actin as defined by Eq. A3. Normalized forces are used to calculate EA for simulations with linear strains, and the full magnitude forces are used to calculate EA for simulations with nonlinear strains.
| Section in Text | Parameter | EA | |
|---|---|---|---|
| Linear Strains | Nonlinear Strains | ||
|
| |||
| 2a | RA = 100 nm | 0.05 | 0.11 |
| RA = 150 nm | 0.04 | 0.11 | |
| RA = 200 nm | 0.04 | - | |
|
| |||
| 2b | α = 0.001 | 0.05 | 0.12 |
| α = 0.01 | 0.05 | 0.11 | |
| α = 0.02 | 0.05 | 0.11 | |
|
| |||
| 2c | Zp = 20 nm | 0.05 | 0.16 |
| Zp = 25 nm | 0.05 | 0.11 | |
| Zp = 30 nm | 0.04 | 0.12 | |
Table A3.
Sensitivity of results to the cell wall Poisson's ratio νW, cell wall Young's modulus EW, and actin network radius RA. The pulling force FA is the total actin force required to initiate endocytosis, and is calculated by integrating the force fA from r = 0 to RW. RW is defined as the location where fA = 0. Note that the spring bed model results do not include fM or fCGP, and this model has no Poisson's ratio by definition.
| Section in Text | Parameter | FA [pN] | RW [nm] | ||
|---|---|---|---|---|---|
| Continuum | Spring Bed | Continuum | Spring Bed | ||
|
| |||||
| 3b | νW = 0.0 | 2800 | - | 47 | - |
| νW = 0.3 | 2700 | - | 46 | - | |
| νW = 0.49 | 2800 | - | 48 | - | |
|
| |||||
| 3c | EW = 0.25 × 110 MPa | 2100 | 1800 | 42 | 43 |
| EW = 0.5 × 110 MPa | 2500 | 2300 | 46 | 46 | |
| EW = 1.0 × 110 MPa | 2800 | 2800 | 48 | 48 | |
| EW = 2.0 × 110 MPa | 3000 | 3300 | 51 | 51 | |
|
| |||||
| 3d | RA = 100 nm | 2800 | 2800 | 48 | 48 |
| RA = 150 nm | 2900 | 3000 | 51 | 53 | |
| RA = 200 nm | 3000 | 3100 | 53 | 56 | |
Table A4.
Effects of turgor pressure on actin force fA and force crossover radius RW. The pulling force FA is the total force required to initiate endocytosis, and is calculated by integrating the force fA from r = 0 to r = RW. The spring bed model results do not include fM or fCGP.
| P0 [MPa] | FA [pN] | RW [nm] | ||
|---|---|---|---|---|
| Continuum | Spring Bed | Continuum | Spring Bed | |
|
| ||||
| 0.25 | 1500 | 1700 | 53 | 51 |
| 0.5 | 2800 | 2800 | 48 | 48 |
| 1.0 | 5000 | 4600 | 45 | 45 |
| 2.0 | 8000 | 7200 | 41 | 42 |
Table A5.
Effect of CGP parameters on the total required actin force FAa and the endocytic width RW. FA is calculated by integrating the force fA from r = 0 to RW. RW is defined as the location where the experimentally estimated actin force fA = 0.
| Study | Parameter | FA [pN] | RW [nm] |
|---|---|---|---|
|
| |||
| 4a | κCGP = 20 kBT | 3100 | 48 |
| κCGP = 285 kBT | 2800 | 48 | |
| κCGP = 500 kBT | 2600 | 51 | |
|
| |||
| 4b | s0 = 36 nm | 3000 | 48 |
| s0 = 46 nm | 2800 | 48 | |
| s0 = 56 nm | 3000 | 46 | |
|
| |||
| 4c | H0 = 36 nm−1 | 2900 | 48 |
| H0 = 46 nm−1 | 2800 | 48 | |
| H0 = 56 nm−1 | 2700 | 49 | |
References
- 1.McMahon HT, Boucrot E. Nature reviews Molecular cell biology. 2011;12:517. doi: 10.1038/nrm3151. [DOI] [PubMed] [Google Scholar]
- 2.Kaksonen M, Toret CP, Drubin D. Cell. 2005;123:305. doi: 10.1016/j.cell.2005.09.024. [DOI] [PubMed] [Google Scholar]
- 3.Boulant S, Kural C, Zeeh JC, Ubelmann F, Kirchhausen T. Nature cell biology. 2011;13:1124. doi: 10.1038/ncb2307. [DOI] [PMC free article] [PubMed] [Google Scholar]
- 4.Weinberg J, Drubin DG. Trends in cell biology. 2012;22:1. doi: 10.1016/j.tcb.2011.09.001. [DOI] [PMC free article] [PubMed] [Google Scholar]
- 5.Mooren OL, Galletta BJ, Cooper JA. Annual review of biochemistry. 2012;81:661. doi: 10.1146/annurev-biochem-060910-094416. [DOI] [PubMed] [Google Scholar]
- 6.Basu R, Munteanu EL, Chang F. Molecular biology of the cell. 2014;25:679. doi: 10.1091/mbc.E13-10-0618. [DOI] [PMC free article] [PubMed] [Google Scholar]
- 7.Aghamohammadzadeh S, Ayscough KR. Nature cell biology. 2009;11:1039. doi: 10.1038/ncb1918. [DOI] [PMC free article] [PubMed] [Google Scholar]
- 8.Kukulski W, Schorb M, Briggs JA. Cell. 2012;150:508. doi: 10.1016/j.cell.2012.05.046. [DOI] [PubMed] [Google Scholar]
- 9.Idrissi FZ, Blasco A, Espinal A, Geli MI. Proceedings of the National Academy of Sciences. 2012;109:E2587. doi: 10.1073/pnas.1202789109. [DOI] [PMC free article] [PubMed] [Google Scholar]
- 10.Liu J, Sun Y, Drubin DG, Oster GF. PLoS biology. 2009;7:e1000204. doi: 10.1371/journal.pbio.1000204. [DOI] [PMC free article] [PubMed] [Google Scholar]
- 11.Dmitrieff S, Nédélec F. PLoS Computational Biology. 2015;11:e1004538. doi: 10.1371/journal.pcbi.1004538. [DOI] [PMC free article] [PubMed] [Google Scholar]
- 12.Walani N, Torres J, Agrawal A. Proceedings of the National Academy of Sciences. 2015;112:E1423. doi: 10.1073/pnas.1418491112. [DOI] [PMC free article] [PubMed] [Google Scholar]
- 13.Collins A, Warrington A, Taylor KA, Svitkina T. Curr Biol. 2011;21:1167. doi: 10.1016/j.cub.2011.05.048. [DOI] [PMC free article] [PubMed] [Google Scholar]
- 14.Kaksonen M, Toret CP, Drubin DG. Nature Reviews Molecular cell biology. 2006;7:404. doi: 10.1038/nrm1940. [DOI] [PubMed] [Google Scholar]
- 15.Galletta BJ, Cooper JA. Current opinion in cell biology. 2009;21:20. doi: 10.1016/j.ceb.2009.01.006. [DOI] [PMC free article] [PubMed] [Google Scholar]
- 16.Carlsson A, Bayly P. Biophysical Journal. 2014;106:1596. doi: 10.1016/j.bpj.2014.02.035. [DOI] [PMC free article] [PubMed] [Google Scholar]
- 17.Baggett JJ, D'Aquino KE, Wendland B. Genetics. 2003;165:1661. doi: 10.1093/genetics/165.4.1661. [DOI] [PMC free article] [PubMed] [Google Scholar]
- 18.Sun Y, Kaksonen M, Madden DT, Schekman R, Drubin DG. Molecular biology of the cell. 2005;16:717. doi: 10.1091/mbc.E04-08-0740. [DOI] [PMC free article] [PubMed] [Google Scholar]
- 19.Skruzny M, Brach T, Ciuffa R, Rybina S, Wachsmuth M, Kaksonen M. Proceedings of the National Academy of Sciences. 2012;109:E2533. doi: 10.1073/pnas.1207011109. [DOI] [PMC free article] [PubMed] [Google Scholar]
- 20.Helfrich W, Naturforsch Z C. 1973;28:693. doi: 10.1515/znc-1973-11-1209. [DOI] [PubMed] [Google Scholar]
- 21.Sun Y, Martin AC, Drubin DG. Developmental cell. 2006;11:33. doi: 10.1016/j.devcel.2006.05.008. [DOI] [PubMed] [Google Scholar]
- 22.Jülicher F, Seifert U. Physical Review E. 1994;49:4728. doi: 10.1103/physreve.49.4728. [DOI] [PubMed] [Google Scholar]
- 23.Jülicher F, Lipowsky R. Physical Review E. 1996;53:2670. doi: 10.1103/physreve.53.2670. [DOI] [PubMed] [Google Scholar]
- 24.Manfredo P. do carmo differential geometry of curves and surfaces. 1976 [Google Scholar]
- 25.Rangamani P, Mandadap KK, Oster G. Biophysical journal. 2014;107:751. doi: 10.1016/j.bpj.2014.06.010. [DOI] [PMC free article] [PubMed] [Google Scholar]
- 26.Zhong-Can OY, Helfrich W. Physical review letters. 1987;59:2486. doi: 10.1103/PhysRevLett.59.2486. [DOI] [PubMed] [Google Scholar]
- 27.COMSOL AB. Comsol multiphysics v. 5.1. 2015 URL www.comsol.com.
- 28.Picco A, Mund M, Ries J, Nédélec F, Kaksonen M. eLife. 2015;4:e04535. doi: 10.7554/eLife.04535. [DOI] [PMC free article] [PubMed] [Google Scholar]
- 29.Holzapfel GA. Nonlinear Solid Mechanics A Continuum Approach for Engineering. John Wiley & Sons, Ltd; 2000. [Google Scholar]
- 30.Fung YC. Biomechanics Mechanical Properties of Living Tissue. Springer-Verlag; 1993. [Google Scholar]
- 31.Delfino A, Stergiopulos N, Moore JE, Jr, Meister JJ. J Biomech. 1997;30:777. doi: 10.1016/s0021-9290(97)00025-0. [DOI] [PubMed] [Google Scholar]
- 32.Smith AE, Zhang Z, Thomas CR, Moxham KE, Middelberg APJ. PNAS. 2000;97:9871. doi: 10.1073/pnas.97.18.9871. [DOI] [PMC free article] [PubMed] [Google Scholar]
- 33.Schneiter R, Brgger B, Sandhoff R, Zellnig G, Leber A, Lampl M, Athenstaedt K, Hrastnik C, Eder S, Daum G, et al. J Cell Biol. 1999;146:741. doi: 10.1083/jcb.146.4.741. [DOI] [PMC free article] [PubMed] [Google Scholar]
- 34.Rawicz W, Olbrich KC, McIntosh T, Needham D, Evans E. Biophysical Journal. 2000;79:328. doi: 10.1016/S0006-3495(00)76295-3. [DOI] [PMC free article] [PubMed] [Google Scholar]
- 35.Jin AJ, Prasad K, Smith PD, Lafer EM, Nossal R. Biophysical Journal. 2006;90:3333. doi: 10.1529/biophysj.105.068742. [DOI] [PMC free article] [PubMed] [Google Scholar]
- 36.Minc N, Boudaoud A, Chang F. Current Biology. 2009;19:1096. doi: 10.1016/j.cub.2009.05.031. [DOI] [PMC free article] [PubMed] [Google Scholar]
- 37.Schaber J, Ángel Adrover M, Eriksson E, Pelet S, Petelenz-Kurdziel E, Klein D, Posas F, Goksör M, Peter M, Hohmann S, et al. Eur Biophys J. 2010;39:1547. doi: 10.1007/s00249-010-0612-0. [DOI] [PMC free article] [PubMed] [Google Scholar]
- 38.Meikle AJ, Reed RH, Gadd GM. Microbiology. 1988;134:3049. doi: 10.1099/00221287-134-11-3049. [DOI] [PubMed] [Google Scholar]
- 39.De Marañon I, Marechal PA, Gervais P. Biochemical and biophysical research communications. 1996;227:519. doi: 10.1006/bbrc.1996.1539. [DOI] [PubMed] [Google Scholar]
- 40.Goldenbogen B, Giese W, Hemmen M, Uhlendorf J, Herrmann A, Klipp E. Open Biology. 2016;6:160136. doi: 10.1098/rsob.160136. [DOI] [PMC free article] [PubMed] [Google Scholar]
- 41.Sokolnikoff IS, Specht RD, et al. Mathematical theory of elasticity. Vol. 83. McGraw-Hill; New York: 1956. [Google Scholar]
- 42.Goode BL, Eskin JA, Wendland B. Genetics. 2015;199:315. doi: 10.1534/genetics.112.145540. [DOI] [PMC free article] [PubMed] [Google Scholar]
- 43.Pujol T, du Roure O, Fermigier M, Heuvingh J. Proceedings of the National Academy of Sciences. 2012;109:10364. doi: 10.1073/pnas.1121238109. [DOI] [PMC free article] [PubMed] [Google Scholar]
- 44.Gittes F, Mickey B, Nettleton J, Howard J. The Journal of cell biology. 1993;120:923. doi: 10.1083/jcb.120.4.923. [DOI] [PMC free article] [PubMed] [Google Scholar]
- 45.Sirotkin V, Berro J, Macmillan K, Zhao L, Pollard TD. Mol Biol Cell. 2010;21:2894. doi: 10.1091/mbc.E10-02-0157. [DOI] [PMC free article] [PubMed] [Google Scholar]
- 46.Wang X, Galletta BJ, Cooper JA, Carlsson AE. Biophysical Journal. 2016;110:1430. doi: 10.1016/j.bpj.2016.02.018. [DOI] [PMC free article] [PubMed] [Google Scholar]
- 47.Peskin CS, Odell GM, Oster GF. Biophysical journal. 1993;65:316. doi: 10.1016/S0006-3495(93)81035-X. [DOI] [PMC free article] [PubMed] [Google Scholar]
- 48.Hill TL, Kirschner MW. International review of cytology. 1982;78:1. [PubMed] [Google Scholar]
- 49.Pollard TD. he Journal of cell biology. 1986;103:2747. doi: 10.1083/jcb.103.6.2747. [DOI] [PMC free article] [PubMed] [Google Scholar]
- 50.Greenberg MJ, Lin T, Goldman YE, Shuman H, Ostap EM. Proceedings of the National Academy of Sciences. 2012;109:E2433. doi: 10.1073/pnas.1207811109. [DOI] [PMC free article] [PubMed] [Google Scholar]
- 51.Galletta BJ, Carlsson AE, Cooper JA. Biophys J. 2012;103:2145. doi: 10.1016/j.bpj.2012.10.009. [DOI] [PMC free article] [PubMed] [Google Scholar]
- 52.Landau LD, Lifshitz E. Course of Theoretical Physics. 1986;3:109. [Google Scholar]
- 53.Tamás MJ, Luyten K, Sutherland FCW, Hernandez A, Albertyn J, Valadi H, Li H, Prior BA, Kilian SG, Ramos J, et al. Molecular microbiology. 1999;31:1087. doi: 10.1046/j.1365-2958.1999.01248.x. [DOI] [PubMed] [Google Scholar]
- 54.Scher-Zagier JK, Carlsson AE. Biophysical Journal. 2016;111:2747. doi: 10.1016/j.bpj.2016.10.040. [DOI] [PMC free article] [PubMed] [Google Scholar]
- 55.Hughes I, Hase T. Measurements and their Uncertainties. Oxford: 2010. [Google Scholar]
Associated Data
This section collects any data citations, data availability statements, or supplementary materials included in this article.


