

Abstract
The application of gene mapping methods to uncover the genetic basis of hypertension in the inbred spontaneously hypertensive rat (SHR) began over 25 yr ago. This animal provides a useful model of genetic high blood pressure, and some of its features are described. In particular, it appears to be a polygenic model of disease, and polygenes participate in human hypertension genetic risk. The SHR hypertension alleles were fixed rapidly by selective breeding in just a few generations and so are presumably common genetic variants present in the outbred Wistar strain from which SHR was created. This review provides a background to the origins and genesis of this rat line. It considers its usefulness as a model organism for a common cardiovascular disease. The progress and obstacles facing mapping are considered in depth, as are the emergence and application of other genome-wide genetic discovery approaches that have been applied to investigate this model. Candidate genes, their identification, and the evidence to support their potential role in blood pressure elevation are considered. The review assesses the progress that has arisen from this work has been limited. Consideration is given to some of the factors that have impeded progress, and prospects for advancing understanding of the genetic basis of hypertension in this model are discussed.
Keywords: SHR, genetics, mapping, blood pressure, review
the spontaneously hypertensive rat (SHR) exists as several lines that were produced by selective inbreeding on the trait of hypertension. Because of the rapid fixation of the hypertensive trait, this inbreeding must certainly have exploited naturally occurring genetic variation that was present in the outbred progenitors of this model. Selection and inbreeding fixed this variation in a homozygous state, providing a genetically homogenous model of heritable high blood pressure (66). The trait is polygenic, a genetic architecture expected from the manner in which the trait developed during selection, and confirmed by studies in which SHR have been intercrossed with normotensive rat lines (82). Several SHR lines were separated and bred within progressively more isolated lineages after the trait was initially fixed (67). However, because the trait was established among closely related forebears of these lines, the underlying genetic variation creating this trait that has been fixed in various SHR lines is certainly largely, if not wholly, shared among these various SHR lines.
During the last 25 yr there has been enormous growth in the availability and quality of tools to permit genetic analysis. While such tools emerged most rapidly for humans and subsequently for the mouse, they now exist in a well-developed state in the rat. This includes a representative genome sequence (29, 92) that provides an assembly against which next-generation, short-read sequences of additional rat strains, including SHR, have been aligned, allowing genetic variation between the reference and other rat strains to be assessed (3). The genetic basis of high blood pressure in SHR has now been actively investigated for over 25 yr. This investigation began as soon as sufficient genomic tools could be generated and has continued as the range of the tools has expanded and improved. This process has moved from the early development of simple sequence length polymorphisms (SSLP) useful for genetic mapping (30), to a large collection of genome-wide, stable single nucleotide polymorphisms (SNPs) (13) and onwards to include a comprehensive inventory of rat protein coding gene sequences (77), expressed proteins (57), and rat noncoding RNAs (33), as well as high coverage genome sequences for several SHR and numerous other inbred rat lines (2, 3).
The 25th anniversary of the publication of the first linkage mapping efforts directed at localizing the genomic position of genetic variation affecting blood pressure in SHR has recently been reached (39, 46). So, it is reasonable to ask what progress has been made during the past quarter century in identifying which pre-existing genetic variation was the subject of selection in the development of SHR and whether the selected genetic variation has been sufficiently uncovered to permit an integrated view that provides an answer to the question: what is the biological pathway by which severe hypertension in this model is achieved? The SHR model provides many opportunities relevant to the study of blood pressure and pathologies associated with hypertension. SHR may permit identification of the type of genetic variation that is able to overwhelm the normal physiological regulation of blood pressure and the pathways through which this variation acts.
The importance of the SHR model persists at least as long as progress in understanding the genetic causation of high blood pressure in humans remains in its currently limited state. Despite the large amount of resources directed to unraveling the genetic variation to which heritable effects on blood pressure occur in the human population, progress has been limited. In some regards there are parallels between the genetic complexity of heritable traits such as stature, on the one hand, and cardiovascular traits on the other, in human populations. These may be instructive to our understanding of the genetics of blood pressure regulation. Height may have narrow sense heritability as high as 80% (69) and appears to be determined by genetic variation in a very large number (hundreds) of loci, but together these explain only 20% of the heritability of height (58).
Current State of Genetics of Hypertension in Humans
Large-scale human population genetic studies have continued to seek progress in identifying loci, genetic variation, and functional pathways associated with blood pressure levels in humans. While the level of locus heterogeneity is perhaps less than that affecting height (though this might reflect a measurement precision difference between traits), locus heterogeneity is also very high with over 100 loci recently identified, with many having effect on both systolic and diastolic blood pressure (90). Of these, 32 represented newly identified associations that have not emerged previously, while 53 previously identified loci were validated for the first time. This population was organized into quintiles, based on the genetic risk score at the identified loci, and showed evidence of a ~9 mmHg effect on blood pressure attributable to these loci with a relatively continuous relationship from lower to upper quintiles (in which sample numbers were smallest). Likelihood of hypertension, cardiovascular disease, coronary artery disease, and stroke was similarly correlated with increasing genetic risk score, reflecting the expected relationship between blood pressure, hypertension diagnosis, and hypertension-associated end organ disease. Among the many loci identified, a small number were found to contain genes that are current targets of antihypertensive pharmacotherapy, lending biological support for the statistical association. However, the functional annotations associated with these blood pressure loci do not form any clear network of genes contained within physiological pathways by which blood pressure is known to be regulated.
The current state of human genetic epidemiology of blood pressure and hypertension is also reflected by another recent large scale study including high-density SNP association (~130,000 SNPs) in ~200,000 subjects (19). This study yielded 66 associations of which 17 were not previously uncovered. Risks scores associated with these 66 SNPs explained ~3.5% of the systolic blood pressure variance. Maximum effect size at any single locus was estimated at slightly more than 1.1 mmHg. The two studies described provide a useful assessment of the progress that human population genetics studies have achieved. This includes the discovery of a large number of replicable blood pressure loci, some associated with genes that function in known pathways by which cardiovascular function is pharmacologically influenced. However, no loci of substantial effect size are uncovered, and most of the heritable variation is not explained. There is another important limitation to this progress: the data generated in these population-based studies cannot explain the mechanisms by which blood pressure is altered within any single individual. Thus, the underlying pathogenesis of hypertension has not been uncovered by these large-scale human studies. This leaves unanswered the fundamental questions of what genetic variation combines in individual patients to raise blood pressure to hypertensive levels and through what functional networks such variation acts.
The “postgenomic” task of identifying the human functional variants in linkage disequilibrium with the associated SNP variants has yet to commence on any systematic scale, impeded perhaps by the large number of variants and the small size of their effects. Many of the SNPs underlying the identified associations may have a regulatory function, and efforts have begun to determine whether there is a relationship between DNase hypersensitive sites (that are open during transcription and therefore likely sites of regulation of gene expression) and disease-associated SNPs (36, 48, 84, 88). An important limitation of SNP-based genome-wide association studies (GWAS) and short-read exome sequencing technologies is their lack of power to interrogate regions of the genome rich in structural variation (42). Gene evolution proceeds not only through mutation of single bases, but via structural complexity that can arise from recombination events such as unequal crossing-over. This frequently results in segmental gene duplications and deletions and may include the duplication or deletion of entire coding genes and their proximal regulatory regions. Duplication can proceed multiple times. This may provide adaptation through increased gene expression but also provides the basis for adaptation through subsequent differential evolution of duplicate sequences, creating novel functional attributes to one or other of the duplicated sequences. SNPs have provided a powerful and accurate tool to assess genome-wide trait association. However, they cannot generally inform regarding the role of structural variations such as segmental duplications that are highly enriched in some regions of the genome.
Rat Hypertension Genetics as a Means to Mitigate Difficulties in Human Genetics
An inbred rat model of genetic hypertension provides very important opportunities that have yet to emerge in the field of polygenic susceptibility to elevated blood pressure in humans, namely:
1) the capacity to identify within one individual all the genetic variation that contributes heritable effects on blood pressure;
2) the discovery of the functional genomic units associated with that variation through which the trait is altered;
3) the impact of that variation on function;
4) the nature, if any, of biological interactions between causative variants;
5) how that variation acts to overcome the powerful and multi-dimensional counter-regulatory actions that respond to elevated blood pressure;
6) uncovering of novel pathways of pathogenesis that offer new opportunities for therapeutic control of blood pressure.
The advance of rat genomics tools has extended the means available to investigate and test genetic variation in SHR and its relationship to blood pressure. This may be particularly useful because early work with this model relied on genetic tools that were quite basic, not well validated, and prone to error. For example, the sequence of steps beginning with the development of SSLPs as mapping markers, the creation of genetic maps from studies of the segregation of these markers in rat crosses, the necessity to manually genotype multiple markers for each individual, analyze (gel electrophoresis), call, and record these size variants, and the reliance on blood pressure measurements often accompanied by thermal stress, stressful confinement, or restraint and noxious stimulation to the tail (pressure cuff occlusion) all provide opportunities at which errors and variability can reduce the power of studies to investigate the genetic basis of high blood pressure in SHR. Ultimately a sufficient body of evidence is required to demonstrate that any proposed genetic variant to which susceptibility to hypertension can be attributed is needed. Glazier and colleagues (32) have discussed several criteria for complex traits such as hypertension.
Origins of the SHR strain.
The progenitors of SHR and the widely used WKY (Wistar-Kyoto) inbred normotensive strain are very well documented (11, 81). The first “standardized” laboratory animal was the albino Wistar rat. The production of Wistar rats and their maintenance through controlled breeding and husbandry began in Philadelphia at The Wistar Institute of Anatomy and Biology beginning around 1909. Genealogies and modern whole genome sequencing methods show that the Wistar rat contributes a significant portion of the gene pool present in other laboratory rat strains (3). Outbred Wistar rats were transferred from Philadelphia to the Veterinary Physiology Laboratory in the Agriculture Department at the University of Tokyo in 1938. In 1944 animals from this stock were transferred to the University of Hokkaido and subsequently to Kyoto University Faculty of Medicine in 1951. At Kyoto, Okamoto and colleagues had noted efforts in New Zealand to generate a genetic model of hypertension by selective breeding (78). The Kyoto scientists began their own effort by selecting a male and female to form the founding pair, comprising a male whose blood pressure was 150–170 mmHg and a somewhat less hypertensive female, 130–140 mmHg. The selective breeding of the progeny of this pair was recorded in fine detail and was published to document the rapid fixation of the hypertensive trait in subsequent progeny and is summarized in Fig. 1 (66). The hypertension trait was essentially fully developed and fixed by selective brother-sister mating to the F3 generation. This is important for three reasons; first, trait fixation occurred too rapidly to permit new mutation to contribute to the trait. Second, although subsequently distinct SHR lineages (A1, A2, A3, B1, B2, C1, C2) were produced in Japan during completion of inbreeding (67), the initially fixed hypertension alleles must be common to all these SHR lines (Fig. 1). Third, the relevant variation is undoubtedly embedded within a haplotype context that was transmitted in linkage disequilibrium to all SHR lines and therefore represents a “selective sweep.” In contrast, normotensive lines, particularly those derived from Wistar rats (which is a large proportion of inbred albino laboratory rats) will exclude these selective sweep haplotypes. The existence of these shared haplotype blocks in SHR lines may facilitate the localization of blocks responsible for specific traits present in SHR (2, 3).
Fig. 1.
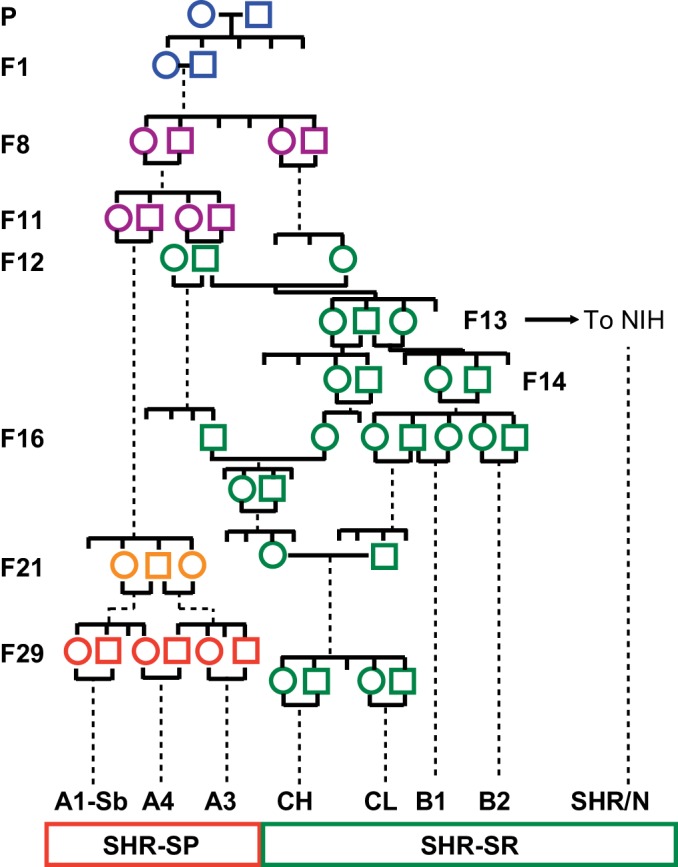
Summary of the breeding of spontaneously hypertensive rats (SHR) on the trait of elevated blood pressure from outbred Wistar stock in Kyoto (WKY). Incompletely inbred SHR animals were transferred to the National Institutes of Health (NIH) in the F13 generation and were subsequently fully inbred and distributed both from NIH (SHR/N) as well as from North American commercial breeders, e.g., SHR/NCrl, SHR/NHsd. Within the Kyoto colony at around the F21 generation, some animals in the A lineage were noted to experience cerebrovascular disease. Further selective breeding was performed to fix the trait of stroke susceptibility, leading to the stroke-prone, SHR-SP, line, of which SHR-A3 is the most widely distributed and studied. The lineages represented by green symbols experience severe hypertension, but resist stroke and other end-organ injury (hypertensive renal disease).
Genetic Mapping of Blood Pressure Loci in SHR
The earliest attempt to use genetic mapping approaches to localize blood pressure traits in the SHR genome began with two overlapping reports by Hilbert et al. (39) and Jacob et al. (46) in 1991 in which a common set of phenotypic data from a single stroke-prone spontaneously hypertensive rat (SHRSP) × WKY cross was used in both studies, but different genotyping and analytic methodologies were developed. The report by Hilbert et al. involved the development of a total of 181 mini- and microsatellite markers suitable for use in the 115 progeny of an SHR-SP (SHR-A3) × WKY F2 intercross. The same animals and a smaller set of 112 markers were reported in Jacob et al., with more detailed analysis of the map constructed to reveal that ~90% of the genome would be within 30 centimorgans of a marker. About 200 markers would have been needed to ensure that 99% of the genome was in linkage disequilibrium with markers, so this is a partial map used in the expectation that it might include markers sufficiently closely linked to at least one or more of the expected three or four polygenic loci involved in hypertension in SHRSP. Nonetheless, convincing evidence was developed in both studies to link a region of chromosome 10 (chr10) to systolic and diastolic blood pressure in salt-loaded animals.
Efforts to confirm this locus employed further marker development employed to isolate, within the WKY genetic background, congenic segments from the SHRSP chr10 locus previously linked to salt-loaded blood pressure. This work brought forth a remarkable discovery: the Heidelberg group (Kreutz et al., 52), who performed the crosses reported in Hilbert et al. and Jacob et al., had unwittingly maintained two distinct WKY lines, WKY0 and WKY1. These lines were congenic with each other. Across nearly 300 genome-wide markers, they differed only in a short segment of chr10.
This slight and unexpected difference between WKY0 and WKY1 has come to provide the basis for some data supporting the resolution of the chr10 locus into two distinct loci with different effects. The introduction of blood pressure measurement by telemetry revealed that the WKY1 line, which had not been used in the originally reported mapping (39, 46), had somewhat elevated baseline blood pressure compared with the WKY0. Further mapping of an F2 intercross from WKY0 × SHRSP indicated that the accidentally transferred locus had no influence on salt-loaded blood pressure (BP/SP-1a) but did influence baseline blood pressure (lower compared with WKY1). This lead to the conclusion that there are two chr10 loci that influence blood pressure: one haplotype, present in WKY0, lowers basal BP compared with the corresponding haplotype present in WKY1; the other locus, at which both WKY lines differ from SHR-SP (BP/SP-1b), contributes to elevation of blood pressure during salt loading.
The lower basal systolic blood pressure in WKY0 than in WKY1 supports the view that the SHR haplotype present at the SP/BP-1a locus in WKY1 elevates basal blood pressure compared with the alternative haplotype at this locus in WKY0 (WKY0 120.1 vs. WKY1 124.3 mmHg, P = 0.024). During salt loading, the blood pressure effect was greater in WKY1 than in WKY0 (WKY0 124.8 vs. WKY1 131.4 mmHg). Since these are congenic lines differing only at BP/SP-1a, this implies that salt sensitivity of blood pressure is attributable to the WKY1 SP/BP-1a haplotype at this locus. The original mapping between SHRSP and WKY0 revealed a chr10 locus that was detected only in salt-loaded animals. This allows that either one or both of SP/BP-1a or -1b might be salt-sensitive loci.
The chr10 locus has been identified in one additional SHRSP × WKY intercross using Izumo (Izm) substrains. Nara and colleagues used markers in the region of the angiotensin converting enzyme (ACE) gene that is located in the BP/SP-1b locus and found association with SBP most notable during salt loading (63). Failure to detect the chr10 locus in other SHR × WKY crosses may reflect not only its dependence on salt loading, but also the fact that the BP/SP-1b haplotype block does not appear to be present in all WKY lines: WKY/N and WKY/NHsd share this haplotype, but WKY/Gla and WKY/NCrl contain SHR alleles within this locus (Table 1). To investigate the BP/SP-1b locus further, an F2 intercross was performed between SHRSP and WKY1 and resulted in the identification of a new locus on chromosome 1 (chr1). This chr1 locus may be relevant to both basal and salt-loaded blood pressure, though effect sizes arising from the locus were larger in salt-loaded animals (53). Refinement of this locus was accomplished through subcongenic strain creation (41). Interestingly and adding important complexity, the variation at BP/SP-1a appears to shape the detectability of chromosome 1 effects on blood pressure: when an intercross is made between WKY0 animals that contain the BP/SP-1a locus and SHR-SP, the chr10 locus was linked to BP, but the chr1 locus was not. In contrast, when WKY1 animals in which the chr10 (BP/SP-1a) locus contains SHRSP alleles are crossed with SHRSP, then the chr1 and chr10 (BP/SP1-b) loci were both detected (53). The simplest conclusion is that there are epistatic interactions between these two chromosomes and that detectability of the chr1 locus is contingent on effects arising from variation (i.e., in BP/SP-1a) on chr10. These complex chr10 SP-1a and SP-1b effects are summarized in Table 2.
Table 1.
Haplotypes in SHR and WKY lines at the chromosome 10 BP-SP-1a and BP/SP1-b loci
| Locus |
||||
|---|---|---|---|---|
| SP/BP-1a | SP/BP-1b | |||
| Gene | Alp1b2 | Ngfr | Ace | Gh1 |
| Position | chr10:55.9 Mb | chr10:83.2 Mb | chr10:93.4 Mb | chr10:94.2 Mb |
| Strain | ||||
| WKY0 | X | W | W | W |
| WKY1 | S | W | W | W |
| WKY/N | S | W | W | W |
| WKY/Gla | S | S | S | S |
| WKY/NCrl | S | S | S | W |
| WKY/NHsd | S | W | W | W |
| SHR-A3 | S | S | S | S |
| SHR-B2 | S | S | S | S |
| SHRSP/Gla | S | S | S | S |
| SHR/NCrlPrin | S | S | S | S |
| SHR/Olalpcv | S | S | S | S |
| SHR/OlalpcvPrin | S | S | S | S |
WKY0, SHR-A3, SHR-B2 genotypes from whole genome sequencing of animals in our own colony. WKY1 genotypes from Kreutz et al. (52). Other genotypes from ftp.rgd.mcw.edu/pub. SHR, spontaneously hypertensive rat; WKY, Wistar Kyoto; SHRSP, stroke-prone spontaneously hypertensive rat; BP, blood pressure; X, neither S nor W.
Table 2.
Resolution of chr10 BP effects and interactions with chr1
| Haplotype SHRSP vs. WKY0 | Haplotype SHRSP vs. WKY1 | Baseline BP Effect of SHRSP Haplotype | Salt-loaded BP Effect of SHRSP Haplotype | Interaction of SHRSP Haplotype at This Locus with chr1 during Salt Loading | |
|---|---|---|---|---|---|
| BP/SP-1a | divergent | identical | ↑ | →↑ | chr1 locus revealed |
| BP/SP-1b | divergent | divergent | none | ↑ | none |
Table 3 shows the additional mapping studies that have been reported that seek to identify BP trait loci in SHR. Following the initial mapping efforts discussed above, the next study to report F2 intercross mapping of SHR BP loci also used an SHRSP × WKY cross (64). Nara et al. identified a locus on chromosome 1, marked by the leukosialin-based microsatellite marker and corresponding in position to chr1:205564368–20556450 in the Rn5 assembly (Table 3). The chr10 locus did not emerge from their genome-wide mapping effort (64), although a subsequent study confirmed an association with the previously reported salt-loaded chr10 BP locus (62).
Table 3.
Mapping of systolic blood pressure loci in SHR
| PMID | First Author | Year | Cross | BP Method | Genotyping | NaCl Loading, Y/N | Locus, chr | Band | LOD Score |
|---|---|---|---|---|---|---|---|---|---|
| This paper | Doris P | 2017 | SHR × WKY | BPT | SNP | N | 1 | q31 | 2.3 |
| 9774356 | Frantz S | 1998 | F2 SHR × WKY | AC | SSLP | N | 1 | q31 | 7.5 |
| 12569259 | Kato N | 2003 | SHR × WKY | TC | SSLP | N | 1 | q31 | 8.3 |
| 8352793 | Nara Y | 1993 | F2 SHR × WKY | TC | SSLP | Y/N | 1 | q36 | 4.3–3.0 |
| This paper | Doris P | 2017 | SHR × WKY | BPT | SNP | N | 2 | q12 | 2.4 |
| 9132270 | Schork N | 1995 | F2 BN × SHR | AC | SSLP | Y | 2 | q16 | 6.3 |
| 8901842 | Clark J | 1996 | F2 SHR × WKY† | BPT | SSLP | N | 2 | q21 | 3.3 |
| 8901842 | Clark J | 1996 | F2 SHR × WKY† | BPT | SSLP | Y | 2 | q21/q24 | 3.4 |
| This paper | Doris P | 2017 | SHR × WKY | BPT | SNP | N | 2 | q34 | 2.7 |
| 8901842 | Clark J | 1996 | F2 SHR × WKY† | BPT | SSLP | Y | 3 | p13-q24 | 4.4 |
| 12569259 | Kato N | 2003 | F2 SHR × WKY | TC | SSLP | Y/N | 3 | q23/q21 | 6.2/3.2 |
| 8977154 | Matsumoto C | 1996 | F2 SHR × WKY | TC | SSLP | Y | 3 | q31 | N/A |
| 8977154 | Matsumoto C | 1996 | F2 SHR × WKY | TC | SSLP | Y | 3 | q35 | N/A |
| 9132270 | Schork N | 1995 | F2 BN × SHR | AC | SSLP | Y | 4 | q21 | 4.6 |
| 12569259 | Kato N | 2003 | F2 SHR × WKY | TC | SSLP | Y | 4 | q34 | 3 |
| 12569259 | Kato N | 2003 | SHR × WKY | TC | SSLP | N | 5 | * | 3.5 |
| This paper | Doris P | 2017 | SHR × WKY | BPT | SNP | N | 6 | q11 | 2.7 |
| 9132270 | Schork N | 1995 | F2 BN × SHR | AC | SSLP | Y | 8 | q21 | 5.1 |
| 12569259 | Kato N | 2003 | F2 SHR × WKY | TC | SSLP | Y | 8 | q31 | 3.3 |
| 8829824 | Takami S | 1996 | F2 SHR × WKY | TC | SSLP | Y | 8 | q32 | N/A |
| 12569259 | Kato N | 2003 | SHR × WKY | TC | SSLP | N | 9 | q13 | 3 |
| 8829824 | Takami S | 1996 | F2 SHR × WKY | TC | SSLP | Y | 9 | q32 | N/A |
| 1655275 | Jacob H | 1991 | F2 SHR × WKY | AC | SSLP | Y | 10 | q21 | 4.8 |
| 1656270 | Hilbert P | 1991 | F2 SHR × WKY | AC | SSLP | Y/N | 10 | q26 | N/A |
| 12569259 | Kato N | 2003 | SHR × WKY | TC | SSLP | N | 13 | q13 | 3.3 |
| 12569259 | Kato N | 2003 | F2 SHR × WKY | TC | SSLP | Y | 15 | q22 | 4 |
| this paper | Doris P | 2017 | SHR × WKY | BPT | SNP | N | 16 | p11 | 2.7 |
| 9132270 | Schork N | 1995 | F2 BN × SHR | AC | SSLP | Y | 16 | p16 | 4.3 |
| 7560090 | Pravenec M | 1995 | BN × SHR RIL | AC | SSLP | N | 19 | q12 | N/A |
| 1656270 | Hilbert P | 1991 | F2 SHR × WKY | AC | SSLP | Y/N | X | N/A |
PMID, PubMed ID number; AC, arterial catheterization; TC, tail-cuff plethysmography; BPT, implanted telemetry device; RIL, recombinant inbred lines; N/A, not applicable or available, linkage mapping not performed. Genotyping by simple sequence length polymorphism (SSLP), automated high through-put single nucleotide polymorphism (SNP).
Ambiguous, marker marks more than one genomic position.
The WKY line used in this cross has unusually high blood pressure, and recent genome sequence data indicate extensive genetic contamination, including contamination with SHR.
The next reports to emerge seeking to localize chromosomal regions influencing blood pressure in SHR involved crosses with the inbred Brown-Norway (BN) strain. This strain is an inbred line derived from wild ancestors and therefore likely to represent a substantially different genetic relationship to Wistar-derived strains compared with the relationship among Wistar-derived strains. Pravenec and colleagues (73) created recombinant inbred (RI) lines between SHR and BN. These lines stably fix in homozygosity lines that contain different contributions from the two parental strains (4). Each line can be phenotyped multiple times but requires to be genotyped only once. This can increase the power of genetic analysis by decreasing phenotypic variance. This approach suggested that loci on chromosomes 2, 4, and 19 may harbor variation affecting blood pressure in the RI lines (72). Unfortunately the statistical approaches for analyzing these strains cannot utilize well-validated linkage methods. Thus, each marker is tested for association, and the result is a multiple testing limitation that must be overcome. Although the some of the P values for blood pressure associations were <0.005, a straightforward Bonferroni correction for the extent of multiple testing performed requires a threshold of 0.003, leaving some question about the reliability of these associations. The difficulty of this mapping approach in RI is extended by measurement of blood pressure using direct carotid puncture under light ether anesthesia. A more recent comparison of blood pressure phenotypes in the RI lines reveals remarkable differences between blood pressures obtained by this method and those obtained by implantable telemetry in the same lines (54). In light of these differences, the original mapping report warranted reconsideration, and the authors propose new associations between blood pressure and genomic regions containing Scnn1b, Ren, Hsp70, or TNF-α. Subsequent work from this group has sought to validate these associations by congenic line construction. A congenic line in which a large block of chr10 containing TNF-α was transferred from BN into SHR produced a lowering of baseline blood pressure (68). In contrast, the expected blood pressure-lowering effect of congenic transfer of the BN segment containing the renin gene was not observed; rather, increased blood pressure appears to result from this transfer (80). No reports appear to have emerged in which BN × SHR congenic lines have been used to verify blood pressure effects reported to arise from loci containing Scnn1b or Hsp70. Thus, the approach of seeking blood pressure associations in BN × SHR recombinant inbred strains has had partial success, providing positional evidence for blood pressure loci while not resolving these loci further.
Using Gene Expression to Identify Hypertension Genes and to Leverage Mapping of Blood Pressure in SHR
Part 1: discovery of differentially expressed genes and their investigation.
Before the rat genome sequence assembly was developed, opportunities for comprehensive genomic investigation of blood pressure in SHR were limited to the development and application of mapping markers to linkage analysis and the targeted investigation of genes known to participate in physiological regulation of blood pressure. An emerging approach was to seek genes whose expression may differ between SHR and WKY using differential hybridization methods. Iwai and Inagami (45) used this approach to identify an mRNA differentially expressed in SHR kidneys that was also upregulated in response to sodium depletion and showed, therefore, some features that are compatible with a gene participating in disturbed sodium reabsorption, a potential mechanism of hypertension in SHR. Sequencing indicated that this was a member of the family of cyclophilin proteins, but a sequencing error lead to incorrect identification of a novel cylophilin-like protein, cy-lp. Further analysis revealed that this was in fact a message for the rat cyclophilin B (CypB) protein, and differential expression in the SHR kidney was confirmed, localized to the proximal tubule, shown to be retained in immortalized proximal tubule cell cultures from SHR and WKY, shown to be increased in a dose-dependent manner by angiotensin II and, by analysis of protein-protein interactions, was suggested to serve functions linked to endoplasmic reticulum stress (47) and might therefore reflect renal alterations resulting from the pathogenic process of blood pressure elevation. CypB is also called peptidyl prolyl isomerase type B (PpiB), to reflect its fundamental enzymatic function. Although several chr8 loci have been mapped in various SHR crosses, none is centered on the q24 region to which CypB/PpiB localizes. This gene does not seem to have received further follow up for its potential role in blood pressure regulation, though it is interesting that all SHR lines share a single haplotype of this gene and all WKY share a contrasting haplotype (38).
In contrast with CypB, another gene originally isolated by Iwai and Inagami (43, 44) through SHR/WKY kidney differential hybridization, the Sa gene (also known as Sah, and correctly identified as Acsm3), has been the subject of extensive investigation in SHR and in humans. Samani and colleagues (76) tested the association between inheritance at the Sa locus and blood pressure in an SHR × WKY F2 intercross and found significant association with blood pressure. Acsm3 is located at chr1q36, a region in which mapping provides some support (Table 3). However, despite ~40 published follow-up studies in mice, rats, and humans, interest in the Acsm3 as a blood pressure gene has dissipated since the discovery that a mouse knockout of this gene lacks either basal or salt-loaded BP phenotypes (89) and that the gene was excluded as a blood pressure gene in an SHR × BN congenic line that refined this locus (79). This suggests that there may be genetic variation in or around the region of chr1 containing the Sa gene that remains to be uncovered and that does have an effect on SHR blood pressure.
Follow-up studies of the Sa locus have added a little additional complexity to the picture. Frantz et al. (26) reported more detailed mapping of the chr1 locus associated with blood pressure, and it was found that the locus was centered some distance from Sa. The flanking markers for one of the two congenic lines produced in this study indicated that the chr1 blood pressure effect could arise from a region closer to the mapped peak than to the Sa gene. In the other congenic line the blood pressure effect was outside the mapped peak maximum and this might reflect the presence of two blood pressure loci across ~70 Mb of chr1. An SHR-BN congenic line also supports an effect arising from a chromosomal segment overlapping the segments isolated by Frantz et al. (26, 79). Thus, at this region of chr1 there may be one or two loci affecting blood pressure with the broadest support indicating effects centered around chr1:142 Mb (Rn5) and possible effects arising closer to the Sa gene locus at chr1:196 Mb. Table 4 provides a summary of genes containing nonsynonymous variation in a 14 Mb block centered on chr1:142 Mb. In this block all SHR lines share the same variants and all WKY lines share the alternative variant (except for WKY/Gla that is known to be cladistically more closely related to SHR lines than to other WKY lines (3).
Table 4.
SHR and WKY synonymous and nonsynonymous variation across the BP locus around chr1:140 Mb
| SHR Lines |
WKY Lines |
||||||||||||
|---|---|---|---|---|---|---|---|---|---|---|---|---|---|
| Gene | NSV Pos | SP/Bbb | B2 | Olalpcv | SP/Gla | NCrlPrin | NHsd | OlalpcvPrin | Bbb | N | NCrl | NHsd | Gla |
| Akap13 | 138172681 | S | S | S | S | S | S | S | NS | NS | NS | NS | S |
| Akap13 | 138172703 | S | S | S | S | S | S | S | NS | NS | NS | NS | S |
| Unc45a | 143072019 | S | S | S | S | S | S | S | NS | NS | NS | NS | S |
| Nmb | 143676127 | S | S | S | S | S | S | S | NS | NS | NS | NS | S |
| Fsd2 | 144323042 | NS | NS | NS | NS | NS | NS | NS | S | S | S | S | NS |
| Fsd2 | 144325291 | NS | NS | NS | NS | NS | NS | NS | S | S | S | S | NS |
| Fsd2 | 144336220 | S | S | S | S | S | S | S | NS | NS | NS | NS | S |
| Fsd2 | 144336232 | S | S | S | S | S | S | S | NS | NS | NS | NS | S |
| Whamm | 144373445 | NS | NS | NS | NS | NS | NS | NS | S | S | HET | S | NS |
| Adamtsl3 | 145403450 | NS | NS | NS | NS | NS | NS | NS | S | S | S | S | NS |
NSV Pos, position on chr1 of nonsynonymous variant; NS, nonsynonymous; S, synonymous; HET, heterozygous. Nonsynonymous means with respect to the Brown-Norway rat reference sequence assembly Rn5. Nonsynonymous variants shared by all SHR and WKY lines are excluded.
Further work has been performed to investigate the more distal chr1 block. Through the production of additional subcongenic lines, a region of chr1:182–186 Mb (1q33–34) has been isolated as being responsible for blood pressure effects (12). Extensive gene-targeted resequencing and gene expression analysis of genes in this region have produced inconclusive results. None of the variant genes has clear biological functions readily connected to pathways influencing blood pressure. Spon1 has been highlighted as potentially harboring relevant regulatory variation resulting in differential expression and therefore prioritizing its candidacy. Spon1 is an ironic outcome to the extent that this genomic region was the focus of investigation because it was the location of Sa, a highly differentially expressed gene, shown subsequently to be uninvolved in blood pressure in SHR. Further resolution of the causative variation and mechanism of action in this distal chr1 locus has not been reported.
Part 2: comprehensive gene expression analysis with array technology.
The growth of cDNA sequence information for rat genes made possible the implementation of genomic approaches targeting expression of genes on a large, if not comprehensive, scale and allowed methods in which the expression of known individual genes could be quantified, rather than assessing differential expression and then seeking to identify the underlying genes. This approach was attractive, in part because promoter sequence variation is well recognized and provides a mechanism for large-scale genetically determined differences in gene expression. Such genetic control of gene expression is an obvious path by which traits are created (14, 15). Exploiting this opportunity is complicated by several other factors. These include difficulty in including changes in spliceform abundances, which might be detected as altered expression but might actually alter gene function in an opposite direction if the splice variant opposes the effects of the known cDNA. Another problem is that heritable gene expression differences frequently arise in trans. These differences are genetically determined, but by variants at distant locations in the genome whose identity is not uncovered by these studies. Finally, gene expression is highly tissue specific. To detect gene expression differences that generate traits, it may be necessary also to know explicitly in which tissue does expression of a particular gene lead to blood pressure traits and at what point in time during development of the trait. For hypertension studies, the kidney has often been selected. However, progress in this field may have been limited by the practical limits on the number of tissues that can be sampled and knowledge of their functional relationship to blood pressure regulation in the SHR model.
Nonetheless, it was a significant and welcome technical advance when the first effort to examine global gene expression in hypertensive rats was reported following the introduction of DNA array technology (1). These arrays comprised 10,000 single, but not necessarily unique, cDNA clones derived from rat heart and, therefore, representing a broad set of rat cDNAs reflecting tissue-specific gene expression across three tissues. Fluorescently labeled cDNA from transcripts expressed in epididymal fat from SHR and BN rats was allowed to compete for binding to the cDNA array, and unequal fluorescence from the SHR or BN-specific fluorophores was detected. The main discovery was that Cd36, a gene encoding a membrane glycoprotein that serves as a receptor for thrombospondin, binds long chain fatty acids, and may be involved in fatty acid transport, was expressed at very low levels in SHR compared with BN. This was interesting because the SHR/N line studied has been observed to have interesting metabolic phenotypes (insulin resistance, hypertriglyceridemia) that may be connected to reduced Cd36 function. This appears to result from at least one unequal recombination event and therefore provides an interesting example of the role of structural variation in generating phenotypes (74). The multiple metabolic phenotypes attributed to this Cd36 variation may not all arise from Cd36 as other SHR lines lacking this variation also appear to be insulin resistant (34). However, caution is warranted: structural genetic variation is challenging to resolve without long read sequencing. Short read genome sequences do not resolve the structural complexity at this locus and examination of assembled genome sequences suggests that there may be more than two Cd36 haplotypes shared across various SHR and WKY lines.
There was some interest in the possible role of this variant in hypertension because of the coexistence of this metabolic phenotype with high blood pressure in SHR (making a potentially useful genetic model of the clinical entity recognized as “metabolic syndrome”) and because of some evidence that SHR blood pressure might be influenced by a chromosome 4 locus overlapping Cd36 (72). However, other work has shown that Cd36 is not absent in SHR but is a hypomorphic allele with expression of two minor spliceforms of Cd36 and protein abundance reduced to 26–85% of levels observed in WKY (9). Thus, the hypothesis that functional knockout of Cd36 in SHR is related to high blood pressure may need to accommodate the possibility of more functional activity of cd36 in SHR/N than originally anticipated. However, this may be modified by amino acid substitutions that also appear to be present in the SHR/N cd36 allele and that result from the unequal crossing-over event that leads to recombination of two ancestral copies of cd36 in SHR/N (1, 31). Efforts have been made to perform gene rescue of deficient Cd36 in SHR/N by transgenesis. The initial report of this transgenic model indicated that there was no effect of gene rescue on blood pressure, though gene expression was restored and some metabolic phenotypes were normalized (49). A later report appeared to reverse this conclusion (71). However, the evidence supporting reversal is rather complex.
It was observed that among four different SHR lines in which cd36 gene rescue was attempted by transgenesis, only one line had reduced blood pressure. In an effort to explain this inconsistent pattern, renal expression of Cd36 was examined and found to be high in the transgenic line with reduced blood pressure and low in those without reduced blood pressure. Kidney transplant was then used to show that transplantation of a kidney “expressing” the Cd36 transgene associated with lower blood pressure in the genetic background of a wild-type SHR. This work reveals some problems associated with the use of transgenesis to rescue gene function and prove a phenotypic effect of the defective allele. Transgenes may be recombined into genomic loci in which some of the regulatory elements present in the locus in which the native gene exists are absent. This may lead to unnatural expression patterns and loss of native control of gene expression, and this in turn may affect phenotypes of interest. Other explanations of the effects of SHR/N Cd36 transgenesis are possible, including that transgenesis has differentially disrupted the expression of other genes involved in blood pressure in the different transgenic lines. A convincing gene rescue would have shown gene rescue in all tissues normally expressing Cd36, restoration of metabolic phenotypes attributed to Cd36 variation, and reduced blood pressure. Further progress delineating the pathogenetic mechanism by which defective Cd36 expression elevates blood pressure, and by which high renal expressing transgenic Cd36 reduces blood pressure, is still to emerge.
A little further evidence probing the relevance of cd36 function to blood pressure regulation is available. First, aged cd36 knockout mice had higher blood pressure than wild-type mice. No data were presented for blood pressure in young animals used in the same study, and the aged animals were studied as a model of cardiomyopathy, in which the deletion of cd36 was hypothesized to protect the aging myocardium from metabolic injury and was found to improve mechanical function, effects that do not directly lead to a conclusion that cd36 deletion elevates blood pressure (50). Second, one human study that examined patients with clinical cd36 deficiency (cd 36 genotype/mutation was not reported) has found higher levels of blood pressure in affecteds compared with matched controls (60). Large-scale human population GWAS do not appear to have uncovered associations between cd36 variation and blood pressure, and another large-scale study directly investigating human cd36 variation also failed to find association with blood pressure levels (37).
The newest approach to assessing transcript abundance is RNA sequencing (RNA-Seq). The method uses next-generation sequencing to perform a comprehensive survey of all mRNAs in a sample and quantitates their relative abundance. An important value is that there is growing awareness of the biological function of noncoding RNAs in the genome and RNA-Seq provides the possibility of an unbiased assessment of the function of these novel RNA elements in SHR compared with contrasting normotensive strains. However, as with all expression approaches, the critical discoveries may only come to light when the “correct” tissues are selected for study. RNA-Seq is also capable of detecting genetic variants present in expressed messages and advances far beyond most hybridization array technology in its capacity to identify RNA splice variants. At this time, there do not appear to be any reports that have applied this technology in an effort to understand hypertension in SHR.
Leveraging the Shared Ancestry of SHR Lines
Hypertension was fixed rapidly during the early inbreeding of SHR from outbred Wistar stock (66). This implies a relatively limited number of loci contributing to the trait, and it also implies that all SHR lines subsequently developed during the completion of inbreeding likely share a single set of hypertension alleles. A major European collaborative project sought to develop a large-scale panel of rat SNPs, anticipating the utility of such markers in both linkage mapping and in fine-scale resolution of haplotype structure in rats (13). Because many inbred rat strains that manifest interesting and important phenotypes share common ancestry, the degree of genetic variation between animals expressing and lacking traits is likely to have reduced complexity because such divergent lines may retain substantial haplotype sharing across genomic regions traceable to a common recent ancestor. This anticipation may be amplified in the case of SHR and WKY. All such animals are progeny of a small number of outbred Wistar animals that were transferred from the US to Japan and have therefore passed through one or more important genetic bottlenecks that can have strong effects to reduce genetic variation. This is reflected in many fewer genetic differences between SHR and WKY lines than more distant lines. For example, SSLP genotypes in SHR-A3/Izm and SHR/Izm indicate that only 24% of 357 SSLP markers diverge. Between SHRSP/Izm and WKY/Izm divergence is 54%, while between SHRSP/Izm and Brown-Norway SSLP divergence is almost complete (93%) (data available at http://www.anim.med.kyoto-u.ac.jp/nbr/pedigree/). Phylogenetic analysis of ~20,000 genome-wide SNPs confirms and emphasizes the genetic relatedness of SHR lines to one another and of WKY lines to one another and reveals the limited divergence of both lines from their common progenitors (2, 3). Because SSLPs are intrinsically prone to mutation, a better view of shared ancestry is provided by comparison of SNP variation. Between SHRSP and WKY 26% of a sample of nearly 10,000 genome-wide SNPs were divergent. This shared ancestry reduces complexity via the shared inheritance of genomic haplotype blocks that have descended from a common ancestor. SHR lines should share all, or almost all, blood pressure loci in common, and these loci are likely to be present in or contain blocks of shared haplotype. Similarly, all normotensive WKY lines should contrast from all SHR lines at haplotype blocks relevant to hypertension while still retaining extensive genetic similarity to SHR. This fact is overlooked at times. For example, an impressive study integrating quantitative RNA-Seq and proteomics in liver tissue from SHR and BN has identified four genes in which there are important differences between SHR and BN, Hao2, Cyp8b1, Serpina3m, and Cyp17a1 (57). Of these, only Hao2 and Cyp8b1 exist in haplotype blocks that diverge between SHR and WKY. A promoter variant was identified in Cyp17a1 (57), a gene associated with blood pressure in human population studies (17, 28, 55, 65), in which mutation can lead to adrenal dysfunction and hypertension (6, 7, 32). This SHR variant was associated with a very strong cis-regulated difference in expression, with hepatic Cyp17a1 protein absent in SHR liver. This variant resulted in the modification of a transcription factor binding site in the proximal promoter of Cyp17a1, providing a possible explanation for the virtual absence of Cyp17a1 expression in SHR liver. However, the same variant is present in all WKY lines that have been sequenced (chr1:273,859,961, Rn5), as well as most other inbred rat lines (38), allowing it to be excluded with some confidence as a hypertension variant in SHR. Furthermore, transcription is a tissue-specific process, and the altered expression in liver, a tissue not generally considered central to blood pressure regulation, does not mean that the same transcriptional effect of this variant will exist in tissues that are involved in SHR hypertension (e.g., kidney). Thus, these elegant studies advance genomics of the rat but do not appear to have revealed Cyp17a1 as a key hypertension gene in SHR.
Several efforts to exploit the reduced genetic complexity provided by haplotype structure and shared ancestry have been made. Atanur and colleagues (3) have identified regions of the genomes of inbred rat strains that appear to have been subjected to artificial selective sweeps, presumably as the result of trait selection. They then sought to determine whether such regions colocalized with known rat quantitative trait loci (QTL). A statistically significant correlation was observed between such selective sweeps and QTLs. One way to leverage selective sweeps that have contributed to traits by altering gene expression is to examine expression across several SHR and WKY lines and to determine which differentially expressed genes are consistently different in multiple SHR lines, compared with WKY. It can then be determined which of these genes are localized to genomic regions in which SHR lines have different haplotypes from WKY lines. Among such identified genes several were found to have their expression controlled in cis. However, none of the identified genes are located in regions of the genome identified by blood pressure mapping in SHR (18). A cross-platform, cross-hypertension meta-analysis of renal gene expression has been reported (59) that seeks to identify pathways of hypertension using publicly available gene expression array data acquired from SHR and the Lyon hypertensive rat and including WKY normotensive control data. While this approach has led to an interesting assembly of differentially expressed genes across several tissues, it has not been extended to directly test the involvement of variation in these genes in blood pressure.
In summary, a broad range of differential expression approaches have been applied to seek genes transmitting variation that contributes to hypertension in SHR. Most have failed to identify genes that withstand detailed scrutiny and the one exception, Cd36, is variable only in SHR derived from colonies inbred at the National Institutes of Health and thus is not among the variation initially fixed and shared by all SHR lines (34).
Unique BP Locus in SHR-SP (SHR-A3) That Reduces Blood Pressure Difference to a Single Locus
It has been widely recognized that systolic blood pressure in SHR-SP is higher than in other SHR lines (61). These data emerged from early studies of direct intra-arterial catheter measurements and tail-cuff plethysmography (40, 83, 91). We have extended it further by showing that it is readily defined by telemetry, and we have mapped a single locus on chr17 in which inheritance of SHR-A3 alleles is associated with this increase in blood pressure of nearly 20 mmHg (5). The end-organ injury that is first to emerge in SHR-A3 is renal damage (8, 25, 35). To exclude renal injury as a cause of blood pressure difference, blood pressure measurements and mapping were performed in animals at an age before the emergence of renal damage (10). This locus is ~8 Mb is size but is quite gene rich and contains a range of candidate genes, some of which contain amino acid substitution between SHR-A3 and other SHR lines. It is also a region in which all SHR lines for which there is whole genome sequence (38) share a continuous haplotype that differs from SHR-A3 and in which WKY and other SHR lines share the same haplotype over most of this region. Work is ongoing to refine this locus and determine the causative variation. While this faces significant challenges, it does offer the advantage that between SHR-A3 and other SHR lines, the blood pressure difference this region creates is a simple trait that may have the properties of a Mendelian trait. This reduced genetic complexity distinguishes it from other SHR blood pressure loci that have been mapped by intercrossing with normotensive strains. Future resolution by congenic and subcongenic line construction have the added advantage that 87% of the genomes of SHR-A3 and SHR-B2 lines is identical (5), including other blood pressure loci, reducing the risk of undetected recombinations that transmit additional blood pressure variants during congenic backcrossing such as can occur with crosses with normotensive lines.
Concerning the Genetic Basis of Hypertension in SHR: What May Be Preventing Progress?
Just as human population studies have struggled to find genetic variation with substantial effects on blood pressure, so too have studies of SHR failed to identify those genetic variations so rapidly selected and fixed within the first few generations of breeding this line that drive increased blood pressure. It is possible that both human and SHR studies are hampered by the same types of problems. It is worthwhile to consider what types of effects might be at work to make trait gene discovery such a difficult undertaking.
Some human quantitative traits, such as height, change over the growth period but are very stable for the rest of the lifespan. Others, such as body weight, are more variable across time. But both can be measured readily and with great precision. Blood pressure is a much more dynamic trait. The simple act of measuring it can change it in both humans and SHR. Methods of assessing blood pressure in rat models also vary in precision: tail-cuff measurements depend on the detection of beat-by-beat blood flow changes as the compressive tail cuff is depressurized. Direct arterial catheterization is intrinsically more precise but can bring numerous technical challenges including patency of the catheter, effects of antithrombotic treatments, recovery period if blood loss occurs during catheterization, and adverse effects of arterial occlusion to stabilize catheters. The introduction of blood pressure telemetry by implanted catheter allows all these technical issues to be reduced. There are also behavioral issues: tail-cuff measurements involve thermal stress to induce thermoregulatory cutaneous blood flow in the tail. There is also restraint stress as conscious animals must have movement limited for the investigator to detect signals reliably. The tube restraint stress typical of tail-cuff plethysmography results in persistently elevated rat serum corticosterone levels (70). Finally there is the noxious stimulus of tail compression by the occlusive cuff. Tail pinch is widely used as a noxious stimulus in the rat to determine level of general anesthesia. Stressful stimuli may result in the penetrance of traits that reflect underlying genetic variation in the blood pressure response to stress (which may be related to autonomic reactivity) rather than the basal level of blood pressure, and such traits may themselves segregate independently from basal blood pressure loci, creating additional genetic complexity that hampers mapping. While repeated exposures may reduce some of the trait variation attributable to these factors, they are unlikely to dissipate fully. It can be seen in Table 3 that four of 11 studies in which blood pressure has been mapped in SHR crosses have used exteriorized arterial catheterization. Concerns also arise with direct arterial catheterization particularly if sedatives or anesthetic agents are employed during recording. Even measurements in catheterized conscious animals require the use of mobility limiting tethers that alter the state of the subjects. In Table 3, five of 11 blood pressure mapping studies in SHR crosses have used direct intra-arterial catheterization. So far only one published original paper has reported the use of implanted radio-telemetry devices in SHR mapping, and we have contributed additional original data in the current paper. It is interesting that increased phenotyping precision permitted by use of telemetry does not result in an increase in QTL logarithm of odds (LOD) scores. One possible explanation is that errors contributed to the higher LOD scores reported in earlier publications.
Errors contributing to mapping can also arise from other sources. These include errors in linkage map generation. Prior to completion of the rat genome, sequence marker positions were determined generally by radiation hybrid mapping and by reference to the likelihood of being separated from other markers by meiotic recombination. Such recombination maps, while generally robust and useful, can contain errors, and as knowledge of genome structure has advanced, some markers have been reassigned to different chromosomes or different locations and orders with respect to other markers. Another important source of error is genotyping error (56). While well-powered mapping studies are relatively robust to random genotyping errors, persistently erroneous mistyping can distort mapping if not identified and corrected. Similarly, the SSLP markers used for most rat mapping must be analyzed and typed manually, with extensive opportunity for mistyping or sample or marker misidentification. Data from our own SHR mapping included in Table 3 indicate that this is the only SHR blood pressure mapping that has used SNPs as mapping markers. These SNP markers have many advantages: their genomic position is known by reference to the assembled rat genome sequence as well as by verification through recombination. Knowledge of genomic position allows optimization of marker spacing across the entire genome. SNPs can be typed in highly automated systems with automated genotype discriminant analysis and quality control. After initial DNA preparation, all sample handling is performed robotically from multiwell plates, avoiding subsequent sample misidentifications. Even with these technical improvements, LOD scores are at the lower range of those observed in other studies indicating in SHR the lack of loci with large and independent phenotypic effects.
To assess whether the combination of highly automated SNP-based genotyping and precise blood pressure measurement by telemetry might impact the results of blood pressure mapping we have performed a new F2 intercross using SHR-SP and WKY progenitors supplied from the same colonies as initially reported by Hilbert et al. (39) and Jacob et al. (46). A total of 173 F2 animals was studied by telemetry implant from Data Sciences. A total of 296 SNP markers known to be polymorphic were selected from ~10,000 SNPs type as part of the Star SNP consortium effort (13). Genotyping was performed by Sequenom automated mass spectrometry (27). Since the surrounding sequence of these markers is known, their genomic position was determined and included as a selection criterion to provide markers that were evenly spaced across the genome (within the constraints placed by shared ancestry in these two lines). Of the 296 markers selected, 252 performed within the quality control parameters of the Sequenom system (both amplification in multiplexed PCR reactions and allelic discrimination criteria were considered). Animals were studied at 16–18 wk of age. This time point was chosen because renal injury begins to emerge in SHR-SP after 18 wk of age, and the presence of renal injury may lead to further elevation in blood pressure that is secondary to hypertension and that involves an additional set of genetic loci to create injury susceptibility. Nonetheless, at this age, severe hypertension has been established in SHR-SP, and the rate of pressure increase with age is relatively small, reducing age-related phenotypic variability. No salt loading was performed to minimize underlying genetic complexity of the blood pressure phenotype. The results of this mapping are summarized in Table 3, and LOD plots for systolic and diastolic blood pressure are shown in Fig. 2. Several insights emerge: there does not appear to be a single blood pressure locus that reaches nominal thresholds for statistical significance estimated by the mapping software R/QTL (P = 0.05, LOD = 3.7). This is a remarkable finding in light of the technical improvements reached in this study. The likely explanation is that the elevation of systolic blood pressure in SHR is not achieved by simple dominant additive variants but, rather, by recessive genetic variation at multiple loci that interacts nonadditively and is largely lost in most F2 animals. Substantially greater statistical power (larger number of F2 animals) may be necessary to confirm the tentative LOD peaks that emerge from this analysis. Second, in the absence of salt loading, no evidence of a chr10 blood pressure locus is detectable, supporting the conclusion made in F2 mapping of the same SHR-SP and WKY lines regarding the interaction of this locus with salt intake.
Fig. 2.

Logarithm of odds (LOD) plots of systolic and diastolic blood pressure mapping in an SHR-A3 × WKY0 F2 intercross (n = 173). The 95% confidence interval is achieved at a LOD score of 3.7. This level was exceeded only for the chr1:133 Mb peak for diastolic blood pressure.
Parent of Origin and Y Chromosome Effects
Another important feature of blood pressure regulation in SHR is parent of origin effects. Hilbert et al. (39) reported differences in the blood pressure of F2 progeny from an SHR-SP × WKY intercross when male SHR-SP animals were mated to female WKY compared with the reciprocal parental cross (male WKY to female SHR-SP). This difference, amounting to 16 mmHg in males from the two crosses and 8 mmHg in females, was lost when male F2 animals were salt loaded but was preserved in female F2 animals during salt loading. Ely and Turner (24) reported about the same time that male progeny (F1) of a WKY (female) and SHR (male) cross had higher blood pressure than male progeny of the reciprocal cross. Unlike in the report of Hilbert, there was no effect noted in female F1 progeny. F2 animals from these reciprocal F1 crosses were also studied, and notable blood pressure elevation was apparent when the F2 animals were descended from a male SHR paternal progenitor. This led the authors to propose that the observed effects might be caused by blood pressure effects arising from the SHR Y chromosome. This hypothesis was tested by backcrossing male SHR animals into female WKY, repeating the backcrossing for seven generations using male backcrossed progeny mating to female WKY (86). The result expected is preservation of the SHR Y chromosome in an autosomal background that is increasingly WKY, theoretically up to >99% WKY after seven backcrosses. The result was animals that had blood pressures intermediate between SHR and WKY, with the difference attributed to a Y chromosome effect. Since a reciprocal backcross used to produce animals that should be 99% SHR in their autosome and carry the WYK Y chromosome also had intermediate blood pressures, the hypothesis of Y chromosome effects on blood pressure was broadly sustained, though it should be noted that there was no genome-wide genotyping performed to confirm the expected genetic background replacement and tail cuff-measured blood pressures were reported longitudinally across varying ages, challenging a precise definition of the effects of this breeding paradigm. As a further refinement an additional set of data was reported following further backcrossing in both the above crosses. In this case, the blood pressure difference attributable to the Y chromosome form SHR or WKY was reduced compared with the earlier report but was still present (22).Tail-cuff blood pressure measurement has been supplemented with more recent telemetry measurement and indicates differences approaching 20 mmHg systolic blood pressure attributable to the SHR Y chromosome in the WKY genetic background. Along with further backcrossing, this effect appears to be increasingly robust (21).
The possibility that these Y chromosome phenotypes arise as a result of the most obvious phenotypic consequence of the Y chromosome, the determination of sex as manifested by the hormonal environment produced by the testes and its relationship to androgen function, has led to more targeted methods of investigation. Using crosses with androgen receptor-deficient Sprague-Dawley rats, Ely and colleagues (22, 23) developed evidence suggesting that both the androgen receptor as well as some component lost by removal of the testis, even when the androgen receptor was deficient, both act to alter blood pressure in the presence of heterozygosity for SHR blood pressure alleles. Remarkably, WKY females and females of the WKY genetic background whose male siblings and fathers possess the SHR Y chromosome but who themselves have WKY autosomes and two WKY-derived X chromosomes were found to have different blood pressure responses to testosterone when ovariectomized. The blood pressure response was very large, particularly in animals at 16 wk of age in whom testosterone added into ovariectomized females accounted for a remarkable 63 mmHg increase in blood pressure in genetically WKY animals with male sibs and fathers transmitting the SHR Y chromosome, compared with 16 mmHg in WKY animals whose male relatives transmit the WKY Y chromosome. These very surprising findings could not be attributed to differences in the response of renin and angiotensinogen gene expression to testosterone treatment. There were also remarkable differences in renal renin and angiotensinogen gene expression across the two lines at 10, but not at 16, wk. The authors propose that gene imprinting may explain their observations. Gene imprinting indicates nongerm-line changes in DNA differentially affecting gene expression, in this case when the inherited gene is transmitted from a father that does or does not contain the SHR Y chromosome. However, the gene expression effect is transitory (present at 10 wk and absent at 16 wk) and further appears to affect only a very small number of autosomal genes, and this suggests that some other explanation might be at work. The robustness of the SHR Y chromosome blood pressure effect has been supported by the creation of an SHR line containing the Y chromosome from the BN strain. Here the use of blood pressure telemetry reveals that substitution of the SHR Y chromosome with the BN in the SHR genetic background resulted in a lowering of systolic and diastolic blood pressure of ~10–15 mmHg, with the difference increasing across ages when the SHR blood pressure is increasing (51). These findings confirm a blood pressure effect arising from the SHR Y chromosome but do not clarify the mechanism by which this occurs.
The rat Y chromosome is annotated as containing nine protein-coding and 13 noncoding genes (http://www.ensembl.org/Rattus_norvegicus/Location/Chromosome?r=Y:1-3310458). Efforts to understand the mechanisms arising in this very limited repertoire of Y chromosome-expressed genes have focused on the sex determining gene, Sry. Sry is a member of the SOX family of the high mobility group box family of transcription factors. There is some evidence that expression of Sry can occur outside the testis, the site of its major sex-determining function. This includes reports that the substantia nigra of the brain stem is one such location and that expression of Sry in this location might influence expression of tyrosine hydroxylase, a key enzyme in dopamine and norepinephrine biosynthesis, and thereby potentially influence central autonomic function (16). There is some evidence that Sry is expressed in kidney and adrenal, both potential additional sites where biological effects impinging on blood pressure control might arise (85, 87). Quantification of gene expression by RT-PCR indicates lower expression levels in the adrenal than in testis, while kidney expression appears to be at levels similar to the testis. The absence of expressed sequence data supporting the nontesticular expression of Sry remains a problem as quantitative RT-PCR is not a tool directed at comprehensive expression analysis (full-length coding transcripts and evidence of expressed protein are needed).
In common with other rodents, rats may have multiple copies of the Sry gene arising as the result of gene duplication events. A potential source of different Sry function arises from copy number variation as well as sequence variation due to mutation differentially affecting these copies. SHR is believed to contain eleven copies of the Sry gene. However, one copy could not be amplified from the WKY genome (Sry3), suggesting copy loss (75). Experiments designed to test the potential role of Sry3 absence in WKY in blood pressure regulation have employed use of expression constructs for Sry3 delivered by direct injection into the renal medulla followed by “electroporation” achieved by passing electrical pulse through the kidney tissue (20). Systolic blood pressure became significantly different, compared with animals treated with control expression vectors, but only after 3 wk postinjection. At this time mean arterial pressure did not differ but did differ after 28 days, largely because reductions were observed in control animals. Plasma renin activity was increased, but only after 14 days posttreatment, and there was a small decline in renal sodium excretion, but only at 28 days posttreatment. Earlier experiments had indicated large differences in renal norepinephrine turnover between SHR and WKY, and the potential role of Sry3 in mediating this was investigated after electroporation, but no effects on renal catecholamines were detected. It is possible that more sophisticated experimental approaches will eventually clarify the inconsistencies in set of observations. Kidney-targeted expression of transgenic Sry3 in WKY would provide a more consistent method to interrogate the possible role of this region of the Y chromosome in blood pressure, which remains a largely unexplained, if rather provocative and intriguing mystery.
Conclusions and a Few Prospects
The state of SHR hypertension genetics reflects the challenges of complex trait genetics that also hamper progress in studies of human hypertension genetics. Complex genetic pathways underlie the disease, with interactions between causative variants having impeded underpowered mapping studies. Autosomal loci have been uncovered in SHR mapping, but there is limited replication in independent studies, and efforts at further refinement have not led to the identification of any of the causative variation that was fixed during selection on the trait of high blood pressure. The most prospective locus is centered on chr1 where three independent studies have provided evidence in support of genetic variation affecting blood pressure centered around chr1:140 Mb (see Table 4). There is robust evidence of Y chromosome involvement in SHR blood pressure. However, efforts to define the causal variation have not yet reached a convincing conclusion that provides a complete mechanistic explanation. The progress of SHR genetics remains handicapped by a rat genome assembly that, while upgraded progressively, remains unfinished. Nonetheless, short-read next-generation sequencing provides rich resources to improve analysis notably by drawing on allelic sharing across multiple SHR lines.
The emergence of long read sequencing provides a new opportunity to improve rat genomic resources by generating sequence assemblies that resolve structural variation in the genome. Such structural variation has already proven an important source of phenotypes in Wistar-derived rat strains. Similarly, RNA-Seq affords new opportunities to invigorate SHR genetics research by providing a more complete assessment of functional variation affecting RNA expression. Such studies are of particular value when they incorporate analysis of multiple tissues that may be relevant to blood pressure regulation in SHR. The limited progress that has been made has been hampered by a lack of knowledge regarding the complexity of the task, and an urgent expectation that recently emerged genetic mapping tools would be sufficient to make important discoveries. As often happens, biology poses more complex challenges than initially anticipated. As a model organism, SHR still provides the critical opportunity to resolve polygenic hypertension disease susceptibility. The desirability of this result remains until a similar level of progress is made in human hypertension genetics. Indeed, such progress in humans seems even more remote than similar progress in SHR. Thus, resolution of the genetic basis of hypertension in SHR remains an important objective because it offers the opportunity to understand what type of genetic variation is at work, how the causative genetic variants interact to create disease, and how they overcome normal physiological counterregulation. These are critical insights necessary if genetic knowledge is to be directed toward understanding the pathogenesis of high blood pressure.
GRANTS
Work in the author’s laboratory has been supported by National Institute of Diabetes and Digestive and Kidney Diseases Grant R01DK-081866. Support from the UTH Cullen Chair in Molecular Medicine is gratefully acknowledged.
DISCLOSURES
No conflicts of interest, financial or otherwise, are declared by the author.
AUTHOR CONTRIBUTIONS
P.A.D. conceived and designed research; P.A.D. performed experiments; P.A.D. analyzed data; P.A.D. interpreted results of experiments; P.A.D. prepared figures; P.A.D. drafted manuscript; P.A.D. edited and revised manuscript; P.A.D. approved final version of manuscript.
ACKNOWLEDGMENTS
The development of this review has benefitted greatly from the contributions of three anonymous reviewers of the manuscript. The author is sincerely grateful for the time and energy committed by them, for the contribution of their expertise, insight, and knowledge, and for their anonymous work that has resulted in an improved review.
REFERENCES
- 1.Aitman TJ, Glazier AM, Wallace CA, Cooper LD, Norsworthy PJ, Wahid FN, Al-Majali KM, Trembling PM, Mann CJ, Shoulders CC, Graf D, St Lezin E, Kurtz TW, Kren V, Pravenec M, Ibrahimi A, Abumrad NA, Stanton LW, Scott J. Identification of Cd36 (Fat) as an insulin-resistance gene causing defective fatty acid and glucose metabolism in hypertensive rats. Nat Genet 21: 76–83, 1999. doi: 10.1038/5013. [DOI] [PubMed] [Google Scholar]
- 2.Atanur SS, Birol I, Guryev V, Hirst M, Hummel O, Morrissey C, Behmoaras J, Fernandez-Suarez XM, Johnson MD, McLaren WM, Patone G, Petretto E, Plessy C, Rockland KS, Rockland C, Saar K, Zhao Y, Carninci P, Flicek P, Kurtz T, Cuppen E, Pravenec M, Hubner N, Jones SJ, Birney E, Aitman TJ. The genome sequence of the spontaneously hypertensive rat: Analysis and functional significance. Genome Res 20: 791–803, 2010. doi: 10.1101/gr.103499.109. [DOI] [PMC free article] [PubMed] [Google Scholar]
- 3.Atanur SS, Diaz AG, Maratou K, Sarkis A, Rotival M, Game L, Tschannen MR, Kaisaki PJ, Otto GW, Ma MC, Keane TM, Hummel O, Saar K, Chen W, Guryev V, Gopalakrishnan K, Garrett MR, Joe B, Citterio L, Bianchi G, McBride M, Dominiczak A, Adams DJ, Serikawa T, Flicek P, Cuppen E, Hubner N, Petretto E, Gauguier D, Kwitek A, Jacob H, Aitman TJ. Genome sequencing reveals loci under artificial selection that underlie disease phenotypes in the laboratory rat. Cell 154: 691–703, 2013. doi: 10.1016/j.cell.2013.06.040. [DOI] [PMC free article] [PubMed] [Google Scholar]
- 4.Bailey DW. Recombinant-inbred strains. An aid to finding identity, linkage, and function of histocompatibility and other genes. Transplantation 11: 325–327, 1971. doi: 10.1097/00007890-197103000-00013. [DOI] [PubMed] [Google Scholar]
- 5.Bell R, Herring SM, Gokul N, Monita M, Grove ML, Boerwinkle E, Doris PA. High-resolution identity by descent mapping uncovers the genetic basis for blood pressure differences between spontaneously hypertensive rat lines. Circ Cardiovasc Genet 4: 223–231, 2011. doi: 10.1161/CIRCGENETICS.110.958934. [DOI] [PMC free article] [PubMed] [Google Scholar]
- 6.Biglieri EG. 17 alpha-Hydroxylase deficiency: 1963–1966. J Clin Endocrinol Metab 82: 48–50, 1997. [DOI] [PubMed] [Google Scholar]
- 7.Biglieri EG, Herron MA, Brust N. 17-hydroxylation deficiency in man. J Clin Invest 45: 1946–1954, 1966. doi: 10.1172/JCI105499. [DOI] [PMC free article] [PubMed] [Google Scholar]
- 8.Blezer EL, Schurink M, Nicolay K, Bär PR, Jansen GH, Koomans HA, Joles JA, Mayhan WG. Proteinuria precedes cerebral edema in stroke-prone rats: a magnetic resonance imaging study. Stroke 29: 167–174, 1998. doi: 10.1161/01.STR.29.1.167. [DOI] [PubMed] [Google Scholar]
- 9.Bonen A, Han XX, Tandon NN, Glatz JF, Lally J, Snook LA, Luiken JJ. FAT/CD36 expression is not ablated in spontaneously hypertensive rats. J Lipid Res 50: 740–748, 2009. doi: 10.1194/jlr.M800237-JLR200. [DOI] [PMC free article] [PubMed] [Google Scholar]
- 10.Braun MC, Herring SM, Gokul N, Monita M, Bell R, Hicks MJ, Wenderfer SE, Doris PA. Hypertensive renal disease: susceptibility and resistance in inbred hypertensive rat lines. J Hypertens 31: 2050–2059, 2013. doi: 10.1097/HJH.0b013e328362f9a5. [DOI] [PMC free article] [PubMed] [Google Scholar]
- 11.Clause BT. The Wistar Institute Archives: Rats (not mice) and history https://amphilsoc.org/mendel/1998.htm. [Jun 25th, 2017]. [PubMed]
- 12.Clemitson JR, Dixon RJ, Haines S, Bingham AJ, Patel BR, Hall L, Lo M, Sassard J, Charchar FJ, Samani NJ. Genetic dissection of a blood pressure quantitative trait locus on rat chromosome 1 and gene expression analysis identifies SPON1 as a novel candidate hypertension gene. Circ Res 100: 992–999, 2007. doi: 10.1161/01.RES.0000261961.41889.9c. [DOI] [PMC free article] [PubMed] [Google Scholar]
- 13.STAR Consortium; Saar K, Beck A, Bihoreau MT, Birney E, Brocklebank D, Chen Y, Cuppen E, Demonchy S, Dopazo J, Flicek P, Foglio M, Fujiyama A, Gut IG, Gauguier D, Guigo R, Guryev V, Heinig M, Hummel O, Jahn N, Klages S, Kren V, Kube M, Kuhl H, Kuramoto T, Kuroki Y, Lechner D, Lee YA, Lopez-Bigas N, Lathrop GM, Mashimo T, Medina I, Mott R, Patone G, Perrier-Cornet JA, Platzer M, Pravenec M, Reinhardt R, Sakaki Y, Schilhabel M, Schulz H, Serikawa T, Shikhagaie M, Tatsumoto S, Taudien S, Toyoda A, Voigt B, Zelenika D, Zimdahl H, Hubner N. SNP and haplotype mapping for genetic analysis in the rat. Nat Genet 40: 560–566, 2008. doi: 10.1038/ng.124. [DOI] [PMC free article] [PubMed] [Google Scholar]
- 14.Cookson W, Liang L, Abecasis G, Moffatt M, Lathrop M. Mapping complex disease traits with global gene expression. Nat Rev Genet 10: 184–194, 2009. doi: 10.1038/nrg2537. [DOI] [PMC free article] [PubMed] [Google Scholar]
- 15.Croteau-Chonka DC, Rogers AJ, Raj T, McGeachie MJ, Qiu W, Ziniti JP, Stubbs BJ, Liang L, Martinez FD, Strunk RC, Lemanske RF Jr, Liu AH, Stranger BE, Carey VJ, Raby BA. Expression quantitative trait loci information improves predictive modeling of disease relevance of non-coding genetic variation. PLoS One 10: e0140758, 2015. doi: 10.1371/journal.pone.0140758. [DOI] [PMC free article] [PubMed] [Google Scholar]
- 16.Dewing P, Chiang CW, Sinchak K, Sim H, Fernagut PO, Kelly S, Chesselet MF, Micevych PE, Albrecht KH, Harley VR, Vilain E. Direct regulation of adult brain function by the male-specific factor SRY. Curr Biol 16: 415–420, 2006. doi: 10.1016/j.cub.2006.01.017. [DOI] [PubMed] [Google Scholar]
- 17.Diver LA, MacKenzie SM, Fraser R, McManus F, Freel EM, Alvarez-Madrazo S, McClure JD, Friel EC, Hanley NA, Dominiczak AF, Caulfield MJ, Munroe PB, Connell JM, Davies E. Common polymorphisms at the CYP17A1 locus associate with steroid phenotype: support for blood pressure genome-wide association study signals at this locus. Hypertension 67: 724–732, 2016. doi: 10.1161/HYPERTENSIONAHA.115.06925. [DOI] [PMC free article] [PubMed] [Google Scholar]
- 18.Dmitrieva RI, Hinojos CA, Grove ML, Bell RJ, Boerwinkle E, Fornage M, Doris PA. Genome-wide identification of allelic expression in hypertensive rats. Circ Cardiovasc Genet 2: 106–115, 2009. doi: 10.1161/CIRCGENETICS.108.809509. [DOI] [PMC free article] [PubMed] [Google Scholar]
- 19.Ehret GB, Ferreira T, Chasman DI, Jackson AU, Schmidt EM, Johnson T, Thorleifsson G, Luan J, Donnelly LA, Kanoni S, Petersen AK, Pihur V, Strawbridge RJ, Shungin D, Hughes MF, Meirelles O, Kaakinen M, Bouatia-Naji N, Kristiansson K, Shah S, Kleber ME, Guo X, Lyytikäinen LP, Fava C, Eriksson N, Nolte IM, Magnusson PK, Salfati EL, Rallidis LS, Theusch E, Smith AJP, Folkersen L, Witkowska K, Pers TH, Joehanes R, Kim SK, Lataniotis L, Jansen R, Johnson AD, Warren H, Kim YJ, Zhao W, Wu Y, Tayo BO, Bochud M, CHARGE-EchoGen consortium; CHARGE-HF consortium; Wellcome Trust Case Control Consortium; Absher D, Adair LS, Amin N, Arking DE, Axelsson T, Baldassarre D, Balkau B, Bandinelli S, Barnes MR, Barroso I, Bevan S, Bis JC, Bjornsdottir G, Boehnke M, Boerwinkle E, Bonnycastle LL, Boomsma DI, Bornstein SR, Brown MJ, Burnier M, Cabrera CP, Chambers JC, Chang IS, Cheng CY, Chines PS, Chung RH, Collins FS, Connell JM, Döring A, Dallongeville J, Danesh J, de Faire U, Delgado G, Dominiczak AF, Doney ASF, Drenos F, Edkins S, Eicher JD, Elosua R, Enroth S, Erdmann J, Eriksson P, Esko T, Evangelou E, Evans A, Fall T, Farrall M, Felix JF, Ferrières J, Ferrucci L, Fornage M, Forrester T, Franceschini N, Duran OHF, Franco-Cereceda A, Fraser RM, Ganesh SK, Gao H, Gertow K, Gianfagna F, Gigante B, Giulianini F, Goel A, Goodall AH, Goodarzi MO, Gorski M, Gräßler J, Groves C, Gudnason V, Gyllensten U, Hallmans G, Hartikainen AL, Hassinen M, Havulinna AS, Hayward C, Hercberg S, Herzig KH, Hicks AA, Hingorani AD, Hirschhorn JN, Hofman A, Holmen J, Holmen OL, Hottenga JJ, Howard P, Hsiung CA, Hunt SC, Ikram MA, Illig T, Iribarren C, Jensen RA, Kähönen M, Kang H, Kathiresan S, Keating BJ, Khaw KT, Kim YK, Kim E, Kivimaki M, Klopp N, Kolovou G, Komulainen P, Kooner JS, Kosova G, Krauss RM, Kuh D, Kutalik Z, Kuusisto J, Kvaløy K, Lakka TA, Lee NR, Lee IT, Lee WJ, Levy D, Li X, Liang KW, Lin H, Lin L, Lindström J, Lobbens S, Männistö S, Müller G, Müller-Nurasyid M, Mach F, Markus HS, Marouli E, McCarthy MI, McKenzie CA, Meneton P, Menni C, Metspalu A, Mijatovic V, Moilanen L, Montasser ME, Morris AD, Morrison AC, Mulas A, Nagaraja R, Narisu N, Nikus K, O’Donnell CJ, O’Reilly PF, Ong KK, Paccaud F, Palmer CD, Parsa A, Pedersen NL, Penninx BW, Perola M, Peters A, Poulter N, Pramstaller PP, Psaty BM, Quertermous T, Rao DC, Rasheed A, Rayner NWNWR, Renström F, Rettig R, Rice KM, Roberts R, Rose LM, Rossouw J, Samani NJ, Sanna S, Saramies J, Schunkert H, Sebert S, Sheu WH, Shin YA, Sim X, Smit JH, Smith AV, Sosa MX, Spector TD, Stančáková A, Stanton A, Stirrups KE, Stringham HM, Sundstrom J, Swift AJ, Syvänen AC, Tai ES, Tanaka T, Tarasov KV, Teumer A, Thorsteinsdottir U, Tobin MD, Tremoli E, Uitterlinden AG, Uusitupa M, Vaez A, Vaidya D, van Duijn CM, van Iperen EPA, Vasan RS, Verwoert GC, Virtamo J, Vitart V, Voight BF, Vollenweider P, Wagner A, Wain LV, Wareham NJ, Watkins H, Weder AB, Westra HJ, Wilks R, Wilsgaard T, Wilson JF, Wong TY, Yang TP, Yao J, Yengo L, Zhang W, Zhao JH, Zhu X, Bovet P, Cooper RS, Mohlke KL, Saleheen D, Lee JY, Elliott P, Gierman HJ, Willer CJ, Franke L, Hovingh GK, Taylor KD, Dedoussis G, Sever P, Wong A, Lind L, Assimes TL, Njølstad I, Schwarz PE, Langenberg C, Snieder H, Caulfield MJ, Melander O, Laakso M, Saltevo J, Rauramaa R, Tuomilehto J, Ingelsson E, Lehtimäki T, Hveem K, Palmas W, März W, Kumari M, Salomaa V, Chen YI, Rotter JI, Froguel P, Jarvelin MR, Lakatta EG, Kuulasmaa K, Franks PW, Hamsten A, Wichmann HE, Palmer CNA, Stefansson K, Ridker PM, Loos RJF, Chakravarti A, Deloukas P, Morris AP, Newton-Cheh C, Munroe PB. The genetics of blood pressure regulation and its target organs from association studies in 342,415 individuals. Nat Genet 48: 1171–1184, 2016. doi: 10.1038/ng.3667. [DOI] [PMC free article] [PubMed] [Google Scholar]
- 20.Ely D, Boehme S, Dunphy G, Hart M, Chiarappa F, Miller B, Martins AS, Turner M, Milsted A. The Sry3 Y chromosome locus elevates blood pressure and renin-angiotensin system indexes. Gend Med 8: 126–138, 2011. doi: 10.1016/j.genm.2010.11.014. [DOI] [PMC free article] [PubMed] [Google Scholar]
- 21.Ely D, Caplea A, Dunphy G, Daneshvar H, Turner M, Milsted A, Takiyyudin M. Spontaneously hypertensive rat Y chromosome increases indexes of sympathetic nervous system activity. Hypertension 29: 613–618, 1997. doi: 10.1161/01.HYP.29.2.613. [DOI] [PubMed] [Google Scholar]
- 22.Ely DL, Daneshvar H, Turner ME, Johnson ML, Salisbury RL. The hypertensive Y chromosome elevates blood pressure in F11 normotensive rats. Hypertension 21: 1071–1075, 1993. doi: 10.1161/01.HYP.21.6.1071. [DOI] [PubMed] [Google Scholar]
- 23.Ely DL, Salisbury R, Hadi D, Turner M, Johnson ML. Androgen receptor and the testes influence hypertension in a hybrid rat model. Hypertension 17: 1104–1110, 1991. doi: 10.1161/01.HYP.17.6.1104. [DOI] [PubMed] [Google Scholar]
- 24.Ely DL, Turner ME. Hypertension in the spontaneously hypertensive rat is linked to the Y chromosome. Hypertension 16: 277–281, 1990. doi: 10.1161/01.HYP.16.3.277. [DOI] [PubMed] [Google Scholar]
- 25.Feld LG, Van Liew JB, Galaske RG, Boylan JW, Chang H, Manz N, Muir P. Selectivity of renal injury and proteinuria in the spontaneously hypertensive rat. Kidney Int 12: 332–343, 1977. doi: 10.1038/ki.1977.120. [DOI] [PubMed] [Google Scholar]
- 26.Frantz SA, Kaiser M, Gardiner SM, Gauguier D, Vincent M, Thompson JR, Bennett T, Samani NJ. Successful isolation of a rat chromosome 1 blood pressure quantitative trait locus in reciprocal congenic strains. Hypertension 32: 639–646, 1998. doi: 10.1161/01.HYP.32.4.639. [DOI] [PubMed] [Google Scholar]
- 27.Gabriel S, Ziaugra L, Tabbaa D. SNP genotyping using the Sequenom MassARRAY iPLEX platform. Curr Protoc Hum Genet Chapter 2: Unit 2 12, 2009. 10.1002/0471142905.hg0212s60. [DOI] [PubMed] [Google Scholar]
- 28.Ganesh SK, Tragante V, Guo W, Guo Y, Lanktree MB, Smith EN, Johnson T, Castillo BA, Barnard J, Baumert J, Chang YP, Elbers CC, Farrall M, Fischer ME, Franceschini N, Gaunt TR, Gho JM, Gieger C, Gong Y, Isaacs A, Kleber ME, Mateo Leach I, McDonough CW, Meijs MF, Mellander O, Molony CM, Nolte IM, Padmanabhan S, Price TS, Rajagopalan R, Shaffer J, Shah S, Shen H, Soranzo N, van der Most PJ, Van Iperen EP, Van Setten J, Vonk JM, Zhang L, Beitelshees AL, Berenson GS, Bhatt DL, Boer JM, Boerwinkle E, Burkley B, Burt A, Chakravarti A, Chen W, Cooper-Dehoff RM, Curtis SP, Dreisbach A, Duggan D, Ehret GB, Fabsitz RR, Fornage M, Fox E, Furlong CE, Gansevoort RT, Hofker MH, Hovingh GK, Kirkland SA, Kottke-Marchant K, Kutlar A, Lacroix AZ, Langaee TY, Li YR, Lin H, Liu K, Maiwald S, Malik R, CARDIOGRAM, METASTROKE; Murugesan G, Newton-Cheh C, O’Connell JR, Onland-Moret NC, Ouwehand WH, Palmas W, Penninx BW, Pepine CJ, Pettinger M, Polak JF, Ramachandran VS, Ranchalis J, Redline S, Ridker PM, Rose LM, Scharnag H, Schork NJ, Shimbo D, Shuldiner AR, Srinivasan SR, Stolk RP, Taylor HA, Thorand B, Trip MD, van Duijn CM, Verschuren WM, Wijmenga C, Winkelmann BR, Wyatt S, Young JH, Boehm BO, Caulfield MJ, Chasman DI, Davidson KW, Doevendans PA, Fitzgerald GA, Gums JG, Hakonarson H, Hillege HL, Illig T, Jarvik GP, Johnson JA, Kastelein JJ, Koenig W, LifeLines Cohort Study; März W, Mitchell BD, Murray SS, Oldehinkel AJ, Rader DJ, Reilly MP, Reiner AP, Schadt EE, Silverstein RL, Snieder H, Stanton AV, Uitterlinden AG, van der Harst P, van der Schouw YT, Samani NJ, Johnson AD, Munroe PB, de Bakker PI, Zhu X, Levy D, Keating BJ, Asselbergs FW. Loci influencing blood pressure identified using a cardiovascular gene-centric array. Hum Mol Genet 22: 1663–1678, 2013. doi: 10.1093/hmg/dds555. [DOI] [PMC free article] [PubMed] [Google Scholar]
- 29.Gibbs RA, Weinstock GM, Metzker ML, Muzny DM, Sodergren EJ, Scherer S, Scott G, Steffen D, Worley KC, Burch PE, Okwuonu G, Hines S, Lewis L, DeRamo C, Delgado O, Dugan-Rocha S, Miner G, Morgan M, Hawes A, Gill R, Celera, Holt RA, Adams MD, Amanatides PG, Baden-Tillson H, Barnstead M, Chin S, Evans CA, Ferriera S, Fosler C, Glodek A, Gu Z, Jennings D, Kraft CL, Nguyen T, Pfannkoch CM, Sitter C, Sutton GG, Venter JC, Woodage T, Smith D, Lee HM, Gustafson E, Cahill P, Kana A, Doucette-Stamm L, Weinstock K, Fechtel K, Weiss RB, Dunn DM, Green ED, Blakesley RW, Bouffard GG, De Jong PJ, Osoegawa K, Zhu B, Marra M, Schein J, Bosdet I, Fjell C, Jones S, Krzywinski M, Mathewson C, Siddiqui A, Wye N, McPherson J, Zhao S, Fraser CM, Shetty J, Shatsman S, Geer K, Chen Y, Abramzon S, Nierman WC, Havlak PH, Chen R, Durbin KJ, Egan A, Ren Y, Song XZ, Li B, Liu Y, Qin X, Cawley S, Worley KC, Cooney AJ, D’Souza LM, Martin K, Wu JQ, Gonzalez-Garay ML, Jackson AR, Kalafus KJ, McLeod MP, Milosavljevic A, Virk D, Volkov A, Wheeler DA, Zhang Z, Bailey JA, Eichler EE, Tuzun E, Birney E, Mongin E, Ureta-Vidal A, Woodwark C, Zdobnov E, Bork P, Suyama M, Torrents D, Alexandersson M, Trask BJ, Young JM, Huang H, Wang H, Xing H, Daniels S, Gietzen D, Schmidt J, Stevens K, Vitt U, Wingrove J, Camara F, Mar Albà M, Abril JF, Guigo R, Smit A, Dubchak I, Rubin EM, Couronne O, Poliakov A, Hübner N, Ganten D, Goesele C, Hummel O, Kreitler T, Lee YA, Monti J, Schulz H, Zimdahl H, Himmelbauer H, Lehrach H, Jacob HJ, Bromberg S, Gullings-Handley J, Jensen-Seaman MI, Kwitek AE, Lazar J, Pasko D, Tonellato PJ, Twigger S, Ponting CP, Duarte JM, Rice S, Goodstadt L, Beatson SA, Emes RD, Winter EE, Webber C, Brandt P, Nyakatura G, Adetobi M, Chiaromonte F, Elnitski L, Eswara P, Hardison RC, Hou M, Kolbe D, Makova K, Miller W, Nekrutenko A, Riemer C, Schwartz S, Taylor J, Yang S, Zhang Y, Lindpaintner K, Andrews TD, Caccamo M, Clamp M, Clarke L, Curwen V, Durbin R, Eyras E, Searle SM, Cooper GM, Batzoglou S, Brudno M, Sidow A, Stone EA, Venter JC, Payseur BA, Bourque G, López-Otín C, Puente XS, Chakrabarti K, Chatterji S, Dewey C, Pachter L, Bray N, Yap VB, Caspi A, Tesler G, Pevzner PA, Haussler D, Roskin KM, Baertsch R, Clawson H, Furey TS, Hinrichs AS, Karolchik D, Kent WJ, Rosenbloom KR, Trumbower H, Weirauch M, Cooper DN, Stenson PD, Ma B, Brent M, Arumugam M, Shteynberg D, Copley RR, Taylor MS, Riethman H, Mudunuri U, Peterson J, Guyer M, Felsenfeld A, Old S, Mockrin S, Collins F; Rat Genome Sequencing Project Consortium . Genome sequence of the Brown Norway rat yields insights into mammalian evolution. Nature 428: 493–521, 2004. doi: 10.1038/nature02426. [DOI] [PubMed] [Google Scholar]
- 30.Gigante B, Rubattu S, Zee RY, Volpe M, Lindpaintner K. Non-random chromosomal distribution of SSLPs: systematic assessment using a novel genetic linkage map between two closely related rat strains. Cytogenet Cell Genet 95: 64–72, 2001. doi: 10.1159/000057019. [DOI] [PubMed] [Google Scholar]
- 31.Glazier AM, Scott J, Aitman TJ. Molecular basis of the Cd36 chromosomal deletion underlying SHR defects in insulin action and fatty acid metabolism. Mamm Genome 13: 108–113, 2002. doi: 10.1007/s00335-001-2132-9. [DOI] [PubMed] [Google Scholar]
- 32.Goldsmith O, Solomon DH, Horton R. Hypogonadism and mineralocorticoid excess. The 17-hydroxylase deficiency syndrome. N Engl J Med 277: 673–677, 1967. doi: 10.1056/NEJM196709282771302. [DOI] [PubMed] [Google Scholar]
- 33.Gopalakrishnan K, Kumarasamy S, Mell B, Joe B. Genome-wide identification of long noncoding RNAs in rat models of cardiovascular and renal disease. Hypertension 65: 200–210, 2015. doi: 10.1161/HYPERTENSIONAHA.114.04498. [DOI] [PMC free article] [PubMed] [Google Scholar]
- 34.Gotoda T, Iizuka Y, Kato N, Osuga J, Bihoreau MT, Murakami T, Yamori Y, Shimano H, Ishibashi S, Yamada N. Absence of Cd36 mutation in the original spontaneously hypertensive rats with insulin resistance. Nat Genet 22: 226–228, 1999. doi: 10.1038/10285. [DOI] [PubMed] [Google Scholar]
- 35.Guerrini U, Sironi L, Tremoli E, Cimino M, Pollo B, Calvio AM, Paoletti R, Asdente M. New insights into brain damage in stroke-prone rats: a nuclear magnetic imaging study. Stroke 33: 825–830, 2002. doi: 10.1161/hs0302.104111. [DOI] [PubMed] [Google Scholar]
- 36.Gusev A, Lee SH, Trynka G, Finucane H, Vilhjálmsson BJ, Xu H, Zang C, Ripke S, Bulik-Sullivan B, Stahl E, Schizophrenia Working Group of the Psychiatric Genomics Consortium; SWE-SCZ Consortium, Kähler AK, Hultman CM, Purcell SM, McCarroll SA, Daly M, Pasaniuc B, Sullivan PF, Neale BM, Wray NR, Raychaudhuri S, Price AL; Schizophrenia Working Group of the Psychiatric Genomics Consortium; SWE-SCZ Consortium . Partitioning heritability of regulatory and cell-type-specific variants across 11 common diseases. Am J Hum Genet 95: 535–552, 2014. doi: 10.1016/j.ajhg.2014.10.004. [DOI] [PMC free article] [PubMed] [Google Scholar]
- 37.Heni M, Müssig K, Machicao F, Machann J, Schick F, Claussen CD, Stefan N, Fritsche A, Häring HU, Staiger H. Variants in the CD36 gene locus determine whole-body adiposity, but have no independent effect on insulin sensitivity. Obesity (Silver Spring) 19: 1004–1009, 2011. doi: 10.1038/oby.2010.251. [DOI] [PubMed] [Google Scholar]
- 38.Hermsen R, de Ligt J, Spee W, Blokzijl F, Schäfer S, Adami E, Boymans S, Flink S, van Boxtel R, van der Weide RH, Aitman T, Hübner N, Simonis M, Tabakoff B, Guryev V, Cuppen E. Genomic landscape of rat strain and substrain variation. BMC Genomics 16: 357, 2015. doi: 10.1186/s12864-015-1594-1. [DOI] [PMC free article] [PubMed] [Google Scholar]
- 39.Hilbert P, Lindpaintner K, Beckmann JS, Serikawa T, Soubrier F, Dubay C, Cartwright P, De Gouyon B, Julier C, Takahasi S, Vincent M, Ganten D, Georges M, Lathrop GM. Chromosomal mapping of two genetic loci associated with blood-pressure regulation in hereditary hypertensive rats. Nature 353: 521–529, 1991. doi: 10.1038/353521a0. [DOI] [PubMed] [Google Scholar]
- 40.Howe PR, Rogers PF, Smith RM. Antihypertensive effect of alcohol in spontaneously hypertensive rats. Hypertension 13: 607–611, 1989. doi: 10.1161/01.HYP.13.6.607. [DOI] [PubMed] [Google Scholar]
- 41.Hübner N, Lee YA, Lindpaintner K, Ganten D, Kreutz R. Congenic substitution mapping excludes Sa as a candidate gene locus for a blood pressure quantitative trait locus on rat chromosome 1. Hypertension 34: 643–648, 1999. doi: 10.1161/01.HYP.34.4.643. [DOI] [PubMed] [Google Scholar]
- 42.Huddleston J, Eichler EE. An incomplete understanding of human genetic variation. Genetics 202: 1251–1254, 2016. doi: 10.1534/genetics.115.180539. [DOI] [PMC free article] [PubMed] [Google Scholar]
- 43.Iwai N, Inagami T. Identification of a candidate gene responsible for the high blood pressure of spontaneously hypertensive rats. J Hypertens 10: 1155–1157, 1992. doi: 10.1097/00004872-199210000-00007. [DOI] [PubMed] [Google Scholar]
- 44.Iwai N, Inagami T. Isolation of preferentially expressed genes in the kidneys of hypertensive rats. Hypertension 17: 161–169, 1991. doi: 10.1161/01.HYP.17.2.161. [DOI] [PubMed] [Google Scholar]
- 45.Iwai N, Inagami T. Molecular cloning of a complementary DNA to rat cyclophilin-like protein mRNA. Kidney Int 37: 1460–1465, 1990. doi: 10.1038/ki.1990.136. [DOI] [PubMed] [Google Scholar]
- 46.Jacob HJ, Lindpaintner K, Lincoln SE, Kusumi K, Bunker RK, Mao YP, Ganten D, Dzau VJ, Lander ES. Genetic mapping of a gene causing hypertension in the stroke-prone spontaneously hypertensive rat. Cell 67: 213–224, 1991. doi: 10.1016/0092-8674(91)90584-L. [DOI] [PubMed] [Google Scholar]
- 47.Kainer DB, Doris PA. Cyclophilin B expression in renal proximal tubules of hypertensive rats. Hypertension 35: 958–964, 2000. doi: 10.1161/01.HYP.35.4.958. [DOI] [PubMed] [Google Scholar]
- 48.Kirsten H, Al-Hasani H, Holdt L, Gross A, Beutner F, Krohn K, Horn K, Ahnert P, Burkhardt R, Reiche K, Hackermüller J, Löffler M, Teupser D, Thiery J, Scholz M. Dissecting the genetics of the human transcriptome identifies novel trait-related trans-eQTLs and corroborates the regulatory relevance of non-protein coding loci. Hum Mol Genet 24: 4746–4763, 2015. doi: 10.1093/hmg/ddv194. [DOI] [PMC free article] [PubMed] [Google Scholar]
- 49.Klevstig M, Manakov D, Kasparova D, Brabcova I, Papousek F, Zurmanova J, Zidek V, Silhavy J, Neckar J, Pravenec M, Kolar F, Novakova O, Novotny J. Transgenic rescue of defective Cd36 enhances myocardial adenylyl cyclase signaling in spontaneously hypertensive rats. Pflugers Arch 465: 1477–1486, 2013. doi: 10.1007/s00424-013-1281-5. [DOI] [PubMed] [Google Scholar]
- 50.Koonen DP, Febbraio M, Bonnet S, Nagendran J, Young ME, Michelakis ED, Dyck JR. CD36 expression contributes to age-induced cardiomyopathy in mice. Circulation 116: 2139–2147, 2007. doi: 10.1161/CIRCULATIONAHA.107.712901. [DOI] [PubMed] [Google Scholar]
- 51.Kren V, Qi N, Krenova D, Zidek V, Sladká M, Jáchymová M, Míková B, Horky K, Bonne A, Van Lith HA, Van Zutphen BF, Lau YF, Pravenec M, St Lezin E. Y-chromosome transfer induces changes in blood pressure and blood lipids in SHR. Hypertension 37: 1147–1152, 2001. doi: 10.1161/01.HYP.37.4.1147. [DOI] [PubMed] [Google Scholar]
- 52.Kreutz R, Hübner N, James MR, Bihoreau MT, Gauguier D, Lathrop GM, Ganten D, Lindpaintner K. Dissection of a quantitative trait locus for genetic hypertension on rat chromosome 10. Proc Natl Acad Sci USA 92: 8778–8782, 1995. doi: 10.1073/pnas.92.19.8778. [DOI] [PMC free article] [PubMed] [Google Scholar]
- 53.Kreutz R, Struk B, Rubattu S, Hübner N, Szpirer J, Szpirer C, Ganten D, Lindpaintner K. Role of the alpha-, beta-, and gamma-subunits of epithelial sodium channel in a model of polygenic hypertension. Hypertension 29: 131–136, 1997. doi: 10.1161/01.HYP.29.1.131. [DOI] [PubMed] [Google Scholar]
- 54.Kunes J, Dobesová Z, Musilová A, Zídek V, Vorlícek J, Pravenec M, Kren V, Zicha J. Hemodynamic characterization of recombinant inbred strains: twenty years later. Hypertens Res 31: 1659–1668, 2008. doi: 10.1291/hypres.31.1659. [DOI] [PubMed] [Google Scholar]
- 55.Levy D, Ehret GB, Rice K, Verwoert GC, Launer LJ, Dehghan A, Glazer NL, Morrison AC, Johnson AD, Aspelund T, Aulchenko Y, Lumley T, Köttgen A, Vasan RS, Rivadeneira F, Eiriksdottir G, Guo X, Arking DE, Mitchell GF, Mattace-Raso FU, Smith AV, Taylor K, Scharpf RB, Hwang SJ, Sijbrands EJ, Bis J, Harris TB, Ganesh SK, O’Donnell CJ, Hofman A, Rotter JI, Coresh J, Benjamin EJ, Uitterlinden AG, Heiss G, Fox CS, Witteman JC, Boerwinkle E, Wang TJ, Gudnason V, Larson MG, Chakravarti A, Psaty BM, van Duijn CM. Genome-wide association study of blood pressure and hypertension. Nat Genet 41: 677–687, 2009. doi: 10.1038/ng.384. [DOI] [PMC free article] [PubMed] [Google Scholar]
- 56.Lincoln SE, Lander ES. Systematic detection of errors in genetic linkage data. Genomics 14: 604–610, 1992. doi: 10.1016/S0888-7543(05)80158-2. [DOI] [PubMed] [Google Scholar]
- 57.Low TY, van Heesch S, van den Toorn H, Giansanti P, Cristobal A, Toonen P, Schafer S, Hübner N, van Breukelen B, Mohammed S, Cuppen E, Heck AJ, Guryev V. Quantitative and qualitative proteome characteristics extracted from in-depth integrated genomics and proteomics analysis. Cell Reports 5: 1469–1478, 2013. doi: 10.1016/j.celrep.2013.10.041. [DOI] [PubMed] [Google Scholar]
- 58.Marouli E, Graff M, Medina-Gomez C, Lo KS, Wood AR, Kjaer TR, Fine RS, Lu Y, Schurmann C, Highland HM, Rüeger S, Thorleifsson G, Justice AE, Lamparter D, Stirrups KE, Turcot V, Young KL, Winkler TW, Esko T, Karaderi T, Locke AE, Masca NG, Ng MC, Mudgal P, Rivas MA, Vedantam S, Mahajan A, Guo X, Abecasis G, Aben KK, Adair LS, Alam DS, Albrecht E, Allin KH, Allison M, Amouyel P, Appel EV, Arveiler D, Asselbergs FW, Auer PL, Balkau B, Banas B, Bang LE, Benn M, Bergmann S, Bielak LF, Blüher M, Boeing H, Boerwinkle E, Böger CA, Bonnycastle LL, Bork-Jensen J, Bots ML, Bottinger EP, Bowden DW, Brandslund I, Breen G, Brilliant MH, Broer L, Burt AA, Butterworth AS, Carey DJ, Caulfield MJ, Chambers JC, Chasman DI, Chen YI, Chowdhury R, Christensen C, Chu AY, Cocca M, Collins FS, Cook JP, Corley J, Galbany JC, Cox AJ, Cuellar-Partida G, Danesh J, Davies G, de Bakker PI, de Borst GJ, de Denus S, de Groot MC, de Mutsert R, Deary IJ, Dedoussis G, Demerath EW, den Hollander AI, Dennis JG, Di Angelantonio E, Drenos F, Du M, Dunning AM, Easton DF, Ebeling T, Edwards TL, Ellinor PT, Elliott P, Evangelou E, Farmaki AE, Faul JD, Feitosa MF, Feng S, Ferrannini E, Ferrario MM, Ferrieres J, Florez JC, Ford I, Fornage M, Franks PW, Frikke-Schmidt R, Galesloot TE, Gan W, Gandin I, Gasparini P, Giedraitis V, Giri A, Girotto G, Gordon SD, Gordon-Larsen P, Gorski M, Grarup N, Grove ML, Gudnason V, Gustafsson S, Hansen T, Harris KM, Harris TB, Hattersley AT, Hayward C, He L, Heid IM, Heikkilä K, Helgeland Ø, Hernesniemi J, Hewitt AW, Hocking LJ, Hollensted M, Holmen OL, Hovingh GK, Howson JM, Hoyng CB, Huang PL, Hveem K, Ikram MA, Ingelsson E, Jackson AU, Jansson JH, Jarvik GP, Jensen GB, Jhun MA, Jia Y, Jiang X, Johansson S, Jørgensen ME, Jørgensen T, Jousilahti P, Jukema JW, Kahali B, Kahn RS, Kähönen M, Kamstrup PR, Kanoni S, Kaprio J, Karaleftheri M, Kardia SL, Karpe F, Kee F, Keeman R, Kiemeney LA, Kitajima H, Kluivers KB, Kocher T, Komulainen P, Kontto J, Kooner JS, Kooperberg C, Kovacs P, Kriebel J, Kuivaniemi H, Küry S, Kuusisto J, La Bianca M, Laakso M, Lakka TA, Lange EM, Lange LA, Langefeld CD, Langenberg C, Larson EB, Lee IT, Lehtimäki T, Lewis CE, Li H, Li J, Li-Gao R, Lin H, Lin LA, Lin X, Lind L, Lindström J, Linneberg A, Liu Y, Liu Y, Lophatananon A, Luan J, Lubitz SA, Lyytikäinen LP, Mackey DA, Madden PA, Manning AK, Männistö S, Marenne G, Marten J, Martin NG, Mazul AL, Meidtner K, Metspalu A, Mitchell P, Mohlke KL, Mook-Kanamori DO, Morgan A, Morris AD, Morris AP, Müller-Nurasyid M, Munroe PB, Nalls MA, Nauck M, Nelson CP, Neville M, Nielsen SF, Nikus K, Njølstad PR, Nordestgaard BG, Ntalla I, O’Connel JR, Oksa H, Loohuis LM, Ophoff RA, Owen KR, Packard CJ, Padmanabhan S, Palmer CN, Pasterkamp G, Patel AP, Pattie A, Pedersen O, Peissig PL, Peloso GM, Pennell CE, Perola M, Perry JA, Perry JR, Person TN, Pirie A, Polasek O, Posthuma D, Raitakari OT, Rasheed A, Rauramaa R, Reilly DF, Reiner AP, Renström F, Ridker PM, Rioux JD, Robertson N, Robino A, Rolandsson O, Rudan I, Ruth KS, Saleheen D, Salomaa V, Samani NJ, Sandow K, Sapkota Y, Sattar N, Schmidt MK, Schreiner PJ, Schulze MB, Scott RA, Segura-Lepe MP, Shah S, Sim X, Sivapalaratnam S, Small KS, Smith AV, Smith JA, Southam L, Spector TD, Speliotes EK, Starr JM, Steinthorsdottir V, Stringham HM, Stumvoll M, Surendran P, ’t Hart LM, Tansey KE, Tardif JC, Taylor KD, Teumer A, Thompson DJ, Thorsteinsdottir U, Thuesen BH, Tönjes A, Tromp G, Trompet S, Tsafantakis E, Tuomilehto J, Tybjaerg-Hansen A, Tyrer JP, Uher R, Uitterlinden AG, Ulivi S, van der Laan SW, Van Der Leij AR, van Duijn CM, van Schoor NM, van Setten J, Varbo A, Varga TV, Varma R, Edwards DR, Vermeulen SH, Vestergaard H, Vitart V, Vogt TF, Vozzi D, Walker M, Wang F, Wang CA, Wang S, Wang Y, Wareham NJ, Warren HR, Wessel J, Willems SM, Wilson JG, Witte DR, Woods MO, Wu Y, Yaghootkar H, Yao J, Yao P, Yerges-Armstrong LM, Young R, Zeggini E, Zhan X, Zhang W, Zhao JH, Zhao W, Zhao W, Zheng H, Zhou W; EPIC-InterAct Consortium; CHD Exome+ Consortium; ExomeBP Consortium; T2D-Genes Consortium; GoT2D Genes Consortium; Global Lipids Genetics Consortium; ReproGen Consortium; MAGIC Investigators, Rotter JI, Boehnke M, Kathiresan S, McCarthy MI, Willer CJ, Stefansson K, Borecki IB, Liu DJ, North KE, Heard-Costa NL, Pers TH, Lindgren CM, Oxvig C, Kutalik Z, Rivadeneira F, Loos RJ, Frayling TM, Hirschhorn JN, Deloukas P, Lettre G. Rare and low-frequency coding variants alter human adult height. Nature 542: 186–190, 2017. doi: 10.1038/nature21039. [DOI] [PMC free article] [PubMed] [Google Scholar]
- 59.Marques FZ, Campain AE, Yang YH, Morris BJ. Meta-analysis of genome-wide gene expression differences in onset and maintenance phases of genetic hypertension. Hypertension 56: 319–324, 2010. doi: 10.1161/HYPERTENSIONAHA.110.155366. [DOI] [PubMed] [Google Scholar]
- 60.Miyaoka K, Kuwasako T, Hirano K, Nozaki S, Yamashita S, Matsuzawa Y. CD36 deficiency associated with insulin resistance. Lancet 357: 686–687, 2001. doi: 10.1016/S0140-6736(00)04138-6. [DOI] [PubMed] [Google Scholar]
- 61.Nagaoka A, Iwatsuka H, Suzuoki Z, Okamoto K. Genetic predisposition to stroke in spontaneously hypertensive rats. Am J Physiol 230: 1354–1359, 1976. [DOI] [PubMed] [Google Scholar]
- 62.Nara Y, Mashimo T, Tamada T, Matsumoto C, Ishinaga Y, Nabika T, Ikeda K, Sawamura M, Yamori Y. Analysis in spontaneously hypertensive rats. Clin Exp Pharmacol Physiol 26: 536–538, 1999. doi: 10.1046/j.1440-1681.1999.03089.x. [DOI] [PubMed] [Google Scholar]
- 63.Nara Y, Nabika T, Ikeda K, Sawamura M, Endo J, Yamori Y. Blood pressure cosegregates with a microsatellite of angiotensin I converting enzyme (ACE) in F2 generation from a cross between original normotensive Wistar-Kyoto rat (WKY) and stroke-prone spontaneously hypertensive rat (SHRSP). Biochem Biophys Res Commun 181: 941–946, 1991. doi: 10.1016/0006-291X(91)92027-H. [DOI] [PubMed] [Google Scholar]
- 64.Nara Y, Nabika T, Ikeda K, Sawamura M, Mano M, Endo J, Yamori Y. Basal high blood pressure cosegregates with the loci on chromosome 1 in the F2 generation from crosses between normotensive Wistar Kyoto rats and stroke-prone spontaneously hypertensive rats. Biochem Biophys Res Commun 194: 1344–1351, 1993. doi: 10.1006/bbrc.1993.1972. [DOI] [PubMed] [Google Scholar]
- 65.Newton-Cheh C, Johnson T, Gateva V, Tobin MD, Bochud M, Coin L, Najjar SS, Zhao JH, Heath SC, Eyheramendy S, Papadakis K, Voight BF, Scott LJ, Zhang F, Farrall M, Tanaka T, Wallace C, Chambers JC, Khaw KT, Nilsson P, van der Harst P, Polidoro S, Grobbee DE, Onland-Moret NC, Bots ML, Wain LV, Elliott KS, Teumer A, Luan J, Lucas G, Kuusisto J, Burton PR, Hadley D, McArdle WL, Brown M, Dominiczak A, Newhouse SJ, Samani NJ, Webster J, Zeggini E, Beckmann JS, Bergmann S, Lim N, Song K, Vollenweider P, Waeber G, Waterworth DM, Yuan X, Groop L, Orho-Melander M, Allione A, Di Gregorio A, Guarrera S, Panico S, Ricceri F, Romanazzi V, Sacerdote C, Vineis P, Barroso I, Sandhu MS, Luben RN, Crawford GJ, Jousilahti P, Perola M, Boehnke M, Bonnycastle LL, Collins FS, Jackson AU, Mohlke KL, Stringham HM, Valle TT, Willer CJ, Bergman RN, Morken MA, Döring A, Gieger C, Illig T, Meitinger T, Org E, Pfeufer A, Wichmann HE, Kathiresan S, Marrugat J, O’Donnell CJ, Schwartz SM, Siscovick DS, Subirana I, Freimer NB, Hartikainen AL, McCarthy MI, O’Reilly PF, Peltonen L, Pouta A, de Jong PE, Snieder H, van Gilst WH, Clarke R, Goel A, Hamsten A, Peden JF, Seedorf U, Syvänen AC, Tognoni G, Lakatta EG, Sanna S, Scheet P, Schlessinger D, Scuteri A, Dörr M, Ernst F, Felix SB, Homuth G, Lorbeer R, Reffelmann T, Rettig R, Völker U, Galan P, Gut IG, Hercberg S, Lathrop GM, Zelenika D, Deloukas P, Soranzo N, Williams FM, Zhai G, Salomaa V, Laakso M, Elosua R, Forouhi NG, Völzke H, Uiterwaal CS, van der Schouw YT, Numans ME, Matullo G, Navis G, Berglund G, Bingham SA, Kooner JS, Connell JM, Bandinelli S, Ferrucci L, Watkins H, Spector TD, Tuomilehto J, Altshuler D, Strachan DP, Laan M, Meneton P, Wareham NJ, Uda M, Jarvelin MR, Mooser V, Melander O, Loos RJ, Elliott P, Abecasis GR, Caulfield M, Munroe PB; Wellcome Trust Case Control Consortium . Genome-wide association study identifies eight loci associated with blood pressure. Nat Genet 41: 666–676, 2009. doi: 10.1038/ng.361. [DOI] [PMC free article] [PubMed] [Google Scholar]
- 66.Okamoto K, Aoki K. Development of a strain of spontaneously hypertensive rats. Jpn Circ J 27: 282–293, 1963. doi: 10.1253/jcj.27.282. [DOI] [PubMed] [Google Scholar]
- 67.Okamoto K, Yamori Y, Nagaoka A. Establishment of the stroke-prone spontaneously hypertensive rat (SHR). Circ Res 34: I143–I153, 1974. [Google Scholar]
- 68.Pausova Z, Sedova L, Berube J, Hamet P, Tremblay J, Dumont M, Gaudet D, Pravenec M, Kren V, Kunes J. Segment of rat chromosome 20 regulates diet-induced augmentations in adiposity, glucose intolerance, and blood pressure. Hypertension 41: 1047–1055, 2003. doi: 10.1161/01.HYP.0000064347.49341.0B. [DOI] [PubMed] [Google Scholar]
- 69.Perola M, Sammalisto S, Hiekkalinna T, Martin NG, Visscher PM, Montgomery GW, Benyamin B, Harris JR, Boomsma D, Willemsen G, Hottenga JJ, Christensen K, Kyvik KO, Sørensen TI, Pedersen NL, Magnusson PK, Spector TD, Widen E, Silventoinen K, Kaprio J, Palotie A, Peltonen L; GenomEUtwin Project . Combined genome scans for body stature in 6,602 European twins: evidence for common Caucasian loci. PLoS Genet 3: e97, 2007. doi: 10.1371/journal.pgen.0030097. [DOI] [PMC free article] [PubMed] [Google Scholar]
- 70.Pitman DL, Ottenweller JE, Natelson BH. Plasma corticosterone levels during repeated presentation of two intensities of restraint stress: chronic stress and habituation. Physiol Behav 43: 47–55, 1988. doi: 10.1016/0031-9384(88)90097-2. [DOI] [PubMed] [Google Scholar]
- 71.Pravenec M, Churchill PC, Churchill MC, Viklicky O, Kazdova L, Aitman TJ, Petretto E, Hubner N, Wallace CA, Zimdahl H, Zidek V, Landa V, Dunbar J, Bidani A, Griffin K, Qi N, Maxova M, Kren V, Mlejnek P, Wang J, Kurtz TW. Identification of renal Cd36 as a determinant of blood pressure and risk for hypertension. Nat Genet 40: 952–954, 2008. doi: 10.1038/ng.164. [DOI] [PubMed] [Google Scholar]
- 72.Pravenec M, Gauguier D, Schott JJ, Buard J, Kren V, Bila V, Szpirer C, Szpirer J, Wang JM, Huang H. Mapping of quantitative trait loci for blood pressure and cardiac mass in the rat by genome scanning of recombinant inbred strains. J Clin Invest 96: 1973–1978, 1995. doi: 10.1172/JCI118244. [DOI] [PMC free article] [PubMed] [Google Scholar]
- 73.Pravenec M, Klír P, Kren V, Zicha J, Kunes J. An analysis of spontaneous hypertension in spontaneously hypertensive rats by means of new recombinant inbred strains. J Hypertens 7: 217–221, 1989. doi: 10.1097/00004872-198903000-00008. [DOI] [PubMed] [Google Scholar]
- 74.Pravenec M, Zidek V, Simakova M, Kren V, Krenova D, Horky K, Jachymova M, Mikova B, Kazdova L, Aitman TJ, Churchill PC, Webb RC, Hingarh NH, Yang Y, Wang JM, Lezin EM, Kurtz TW. Genetics of Cd36 and the clustering of multiple cardiovascular risk factors in spontaneous hypertension. J Clin Invest 103: 1651–1657, 1999. doi: 10.1172/JCI6691. [DOI] [PMC free article] [PubMed] [Google Scholar]
- 75.Prokop JW, Underwood AC, Turner ME, Miller N, Pietrzak D, Scott S, Smith C, Milsted A. Analysis of Sry duplications on the Rattus norvegicus Y-chromosome. BMC Genomics 14: 792, 2013. doi: 10.1186/1471-2164-14-792. [DOI] [PMC free article] [PubMed] [Google Scholar]
- 76.Samani NJ, Lodwick D, Vincent M, Dubay C, Kaiser MA, Kelly MP, Lo M, Harris J, Sassard J, Lathrop M. A gene differentially expressed in the kidney of the spontaneously hypertensive rat cosegregates with increased blood pressure. J Clin Invest 92: 1099–1103, 1993. doi: 10.1172/JCI116616. [DOI] [PMC free article] [PubMed] [Google Scholar]
- 77.Shimoyama M, De Pons J, Hayman GT, Laulederkind SJ, Liu W, Nigam R, Petri V, Smith JR, Tutaj M, Wang SJ, Worthey E, Dwinell M, Jacob H. The Rat Genome Database 2015: genomic, phenotypic and environmental variations and disease. Nucleic Acids Res 43: D743–D750, 2015. doi: 10.1093/nar/gku1026. [DOI] [PMC free article] [PubMed] [Google Scholar]
- 78.Smirk FH, Hall WH. Inherited hypertension in rats. Nature 182: 727–728, 1958. doi: 10.1038/182727a0. [DOI] [PubMed] [Google Scholar]
- 79.St Lezin E, Liu W, Wang JM, Yang Y, Qi N, Kren V, Zidek V, Kurtz TW, Pravenec M. Genetic analysis of rat chromosome 1 and the Sa gene in spontaneous hypertension. Hypertension 35: 225–230, 2000. doi: 10.1161/01.HYP.35.1.225. [DOI] [PubMed] [Google Scholar]
- 80.St Lezin E, Liu W, Wang N, Wang JM, Kren V, Zidek V, Zdobinska M, Krenova D, Bottger A, van Zutphen BF, Pravenec M. Effect of renin gene transfer on blood pressure in the spontaneously hypertensive rat. Hypertension 31: 373–377, 1998. doi: 10.1161/01.HYP.31.1.373. [DOI] [PubMed] [Google Scholar]
- 81.Suckow MA, Weisbroth SH, Franklin CL. The Laboratory Rat. Amsterdam: Elsevier-Academic Press, 2005. [Google Scholar]
- 82.Tanase H, Suzuki Y, Ooshima A, Yamori Y, Okamoto K. Genetic analysis of blood pressure in spontaneously hypertensive rats. Jpn Circ J 34: 1197–1212, 1970. doi: 10.1253/jcj.34.1197. [DOI] [PubMed] [Google Scholar]
- 83.Tanase H, Yamori Y, Hansen CT, Lovenberg W. Heart size in inbred strains of rats. Part 1. Genetic determination of the development of cardiovascular enlargement in rats. Hypertension 4: 864–872, 1982. doi: 10.1161/01.HYP.4.6.864. [DOI] [PubMed] [Google Scholar]
- 84.Trynka G, Raychaudhuri S. Using chromatin marks to interpret and localize genetic associations to complex human traits and diseases. Curr Opin Genet Dev 23: 635–641, 2013. doi: 10.1016/j.gde.2013.10.009. [DOI] [PMC free article] [PubMed] [Google Scholar]
- 85.Turner ME, Farkas J, Dunmire J, Ely D, Milsted A. Which Sry locus is the hypertensive Y chromosome locus? Hypertension 53: 430–435, 2009. doi: 10.1161/HYPERTENSIONAHA.108.124131. [DOI] [PubMed] [Google Scholar]
- 86.Turner ME, Johnson ML, Ely DL. Separate sex-influenced and genetic components in spontaneously hypertensive rat hypertension. Hypertension 17: 1097–1103, 1991. doi: 10.1161/01.HYP.17.6.1097. [DOI] [PubMed] [Google Scholar]
- 87.Turner ME, Martin C, Martins AS, Dunmire J, Farkas J, Ely DL, Milsted A. Genomic and expression analysis of multiple Sry loci from a single Rattus norvegicus Y chromosome. BMC Genet 8: 11, 2007. doi: 10.1186/1471-2156-8-11. [DOI] [PMC free article] [PubMed] [Google Scholar]
- 88.Varshney A, Scott LJ, Welch RP, Erdos MR, Chines PS, Narisu N, Albanus RD, Orchard P, Wolford BN, Kursawe R, Vadlamudi S, Cannon ME, Didion JP, Hensley J, Kirilusha A; NISC Comparative Sequencing Program, Bonnycastle LL, Taylor DL, Watanabe R, Mohlke KL, Boehnke M, Collins FS, Parker SC, Stitzel ML. Genetic regulatory signatures underlying islet gene expression and type 2 diabetes. Proc Natl Acad Sci USA 114: 2301–2306, 2017. doi: 10.1073/pnas.1621192114. [DOI] [PMC free article] [PubMed] [Google Scholar]
- 89.Walsh V, Somody L, Farrell A, Zhang B, Brown J, Pritchard C, Vincent M, Samani NJ. Analysis of the role of the SA gene in blood pressure regulation by gene targeting. Hypertension 41: 1212–1218, 2003. doi: 10.1161/01.HYP.0000069010.28143.5C. [DOI] [PubMed] [Google Scholar]
- 90.Warren HR, Evangelou E, Cabrera CP, Gao H, Ren M, Mifsud B, Ntalla I, Surendran P, Liu C, Cook JP, Kraja AT, Drenos F, Loh M, Verweij N, Marten J, Karaman I, Lepe MP, O’Reilly PF, Knight J, Snieder H, Kato N, He J, Tai ES, Said MA, Porteous D, Alver M, Poulter N, Farrall M, Gansevoort RT, Padmanabhan S, Mägi R, Stanton A, Connell J, Bakker SJ, Metspalu A, Shields DC, Thom S, Brown M, Sever P, Esko T, Hayward C, van der Harst P, Saleheen D, Chowdhury R, Chambers JC, Chasman DI, Chakravarti A, Newton-Cheh C, Lindgren CM, Levy D, Kooner JS, Keavney B, Tomaszewski M, Samani NJ, Howson JM, Tobin MD, Munroe PB, Ehret GB, Wain LV, Wain LV, Vaez A, Jansen R, Joehanes R, van der Most PJ, Erzurumluoglu AM, O’Reilly P, Cabrera CP, Warren HR, Rose LM, Verwoert GC, Hottenga J-J, Strawbridge RJ, Esko T, Arking DE, Hwang S-J, Guo X, Kutalik Z, Trompet S, Shrine N, Teumer A, Ried JS, Bis JC, Smith AV, Amin N, Nolte IM, Lyytikäinen L-P, Mahajan A, Wareham NJ, Hofer E, Joshi PK, Kristiansson K, Traglia M, Havulinna AS, Goel A, Nalls MA, Sõber S, Vuckovic D, Luan J, M FDG, Ayers KL, Marrugat J, Ruggiero D, Lopez LM, Niiranen T, Enroth S, Jackson AU, Nelson CP, Huffman JE, Zhang W, Marten J, Gandin I, Harris SE, Zemonik T, Lu Y, Evangelou E, Shah N, de Borst MH, Mangino M, Prins BP, Campbell A, Li-Gao R, Chauhan G, Oldmeadow C, Abecasis G, Abedi M, Barbieri CM, Barnes MR, Batini C, Blake T, Boehnke M, Bottinger EP, Braund PS, Brown M, Brumat M, Campbell H, Chambers JC, Cocca M, Collins F, Connell J, Cordell HJ, Damman JJ, Davies G, de Geus EJ, de Mutsert R, Deelen J, Demirkale Y, Doney ASF, Dörr M, Farrall M, Ferreira T, Frånberg M, Gao H, Giedraitis V, Gieger C, Giulianini F, Gow AJ, Hamsten A, Harris TB, Hofman A, Holliday EG, Jarvelin M-R, Johansson Å, Johnson AD, Jousilahti P, Jula A, Kähönen M, Kathiresan S, Khaw K-T, Kolcic I, Koskinen S, Langenberg C, Larson M, Launer LJ, Lehne B, Liewald DCM, Lin L, Lind L, Mach F, Mamasoula C, Menni C, Mifsud B, Milaneschi Y, Morgan A, Morris AD, Morrison AC, Munson PJ, Nandakumar P, Nguyen QT, Nutile T, Oldehinkel AJ, Oostra BA, Org E, Padmanabhan S, Palotie A, Paré G, Pattie A, Penninx BWJH, Poulter N, Pramstaller PP, Raitakari OT, Ren M, Rice K, Ridker PM, Riese H, Ripatti S, Robino A, Rotter JI, Rudan I, Saba Y, Pierre AS, Sala CF, Sarin A-P, Schmidt R, Scott R, Seelen MA, Shields DC, Siscovick D, Sorice R, Stanton A, Stott DJ, Sundström J, Swertz M, Taylor KD, Thom S, Tzoulaki I, Tzourio C, Uitterlinden AG, Völker U, Vollenweider P, Wild S, Willemsen G, Wright AF, Yao J, Thériault S, Conen D, John A, Sever P, Debette S, Mook-Kanamori DO, Zeggini E, Spector TD, van der Harst P, Palmer CNA, Vergnaud A-C, Loos RJF, Polasek O, Starr JM, Girotto G, Hayward C, Kooner JS, Lindgren CM, Vitart V, Samani NJ, Tuomilehto J, Gyllensten U, Knekt P, Deary IJ, Ciullo M, Elosua R, Keavney BD, Hicks AA, Scott RA, Gasparini P, Laan M, Liu YM, Watkins H, Hartman CA, Salomaa V, Toniolo D, Perola M, Wilson JF, Schmidt H, Zhao JH, Lehtimäki T, van Duijn CM, Gudnason V, Psaty BM, Peters A, Rettig R, James A, Jukema JW, Strachan DP, Palmas W, Metspalu A, Ingelsson E, Boomsma DI, Franco OH, Bochud M, Newton-Cheh C, Munroe PB, Elliott P, Chasman DI, Chakravarti A, Knight J, Morris AP, Levy D, Tobin MD, Snieder H, Caulfield MJ, Ehret GB, Barnes MR, Tzoulaki I, Caulfield MJ, Elliott P; International Consortium of Blood Pressure (ICBP) 1000G Analyses; BIOS Consortium; Lifelines Cohort Study; Understanding Society Scientific group; CHD Exome+ Consortium; ExomeBP Consortium; T2D-GENES Consortium; GoT2DGenes Consortium; Cohorts for Heart and Ageing Research in Genome Epidemiology (CHARGE) BP Exome Consortium; International Genomics of Blood Pressure (iGEN-BP) Consortium; UK Biobank CardioMetabolic Consortium BP working group . Genome-wide association analysis identifies novel blood pressure loci and offers biological insights into cardiovascular risk. Nat Genet 49: 403–415, 2017. doi: 10.1038/ng.3768. [DOI] [PMC free article] [PubMed] [Google Scholar]
- 91.Watanabe TX, Sokabe H. Acute vasodepressor effect of D-3-mercapto-2-methylpropanoyl-L-proline (SQ 14,225) in the stroke-prone substrain of spontaneously hypertensive rats (SHRSP). Jpn J Pharmacol 29: 133–135, 1979. doi: 10.1254/jjp.29.133. [DOI] [PubMed] [Google Scholar]
- 92.Worley KC, Weinstock GM, Gibbs RA. Rats in the genomic era. Physiol Genomics 32: 273–282, 2008. doi: 10.1152/physiolgenomics.00208.2007. [DOI] [PubMed] [Google Scholar]