

Abstract
Skeletal muscle mitochondrial protein synthesis is regulated in part by insulin. The development of insulin resistance with diet-induced obesity may therefore contribute to impairments to protein synthesis and decreased mitochondrial respiration. Yet the impact of diet-induced obesity and insulin resistance on mitochondrial energetics is controversial, with reports varying from decreases to increases in mitochondrial respiration. We investigated the impact of changes in insulin sensitivity on long-term rates of mitochondrial protein synthesis as a mechanism for changes to mitochondrial respiration in skeletal muscle. Insulin resistance was induced in C57BL/6J mice using 4 wk of a high-fat compared with a low-fat diet. For 8 additional weeks, diets were enriched with pioglitazone to restore insulin sensitivity compared with nonenriched control low-fat or high-fat diets. Skeletal muscle mitochondrial protein synthesis was measured using deuterium oxide labeling during weeks 10–12. High-resolution respirometry was performed using palmitoyl-l-carnitine, glutamate+malate, and glutamate+malate+succinate as substrates for mitochondria isolated from quadriceps. Mitochondrial protein synthesis and palmitoyl- l-carnitine oxidation were increased in mice consuming a high-fat diet, regardless of differences in insulin sensitivity with pioglitazone treatment. There was no effect of diet or pioglitazone treatment on ADP-stimulated respiration or H2O2 emission using glutamate+malate or glutamate+malate+succinate. The results demonstrate no impairments to mitochondrial protein synthesis or respiration following induction of insulin resistance. Instead, mitochondrial protein synthesis was increased with a high-fat diet and may contribute to remodeling of the mitochondria to increase lipid oxidation capacity. Mitochondrial adaptations with a high-fat diet appear driven by nutrient availability, not intrinsic defects that contribute to insulin resistance.
Keywords: mitochondria, deuterium oxide, tracer, respiration, protein turnover
mitochondrial protein synthesis helps maintain the mitochondrial proteome of skeletal muscle and is regulated in part by insulin (2, 38). The development of insulin resistance with obesity is associated with decreased skeletal muscle insulin signaling and may have negative impacts on mitochondrial protein synthesis. It has been reported that compared with lean controls, obese adults had lower basal mitochondrial protein synthesis and a blunted response to insulin infusion (14). Furthermore, adults with type 2 diabetes had lower content of gene transcripts for mitochondrial proteins compared with lean adults (30). Lower protein synthesis may contribute to the decreased mitochondrial protein abundance and decreased respiratory capacity that has been reported in adults with obesity or type 2 diabetes (7, 40).
Other findings have challenged the notion of mitochondrial declines with insulin resistance. Compared with low-fat diet controls, rats with diet-induced obesity and insulin resistance had greater mitochondrial protein abundance by Western blot and palmitate oxidation capacity (16). Mice consuming a high-fat diet also had greater mitochondrial density by electron microscopy and greater respiration of isolated mitochondria using substrates for complexes I or II despite having lower insulin sensitivity than mice consuming a low-fat diet (23). Such gains may be protective against developing insulin resistance with high-fat diet (31). Accordingly, mitochondrial protein synthesis was reported to be increased in obese humans (15) and rats (10) compared with lean controls. It is therefore not clear whether mitochondrial protein synthesis is altered following changes to insulin sensitivity and contributes to changes in mitochondrial protein abundance or respiratory capacity.
Longer-duration labeling approaches may allow insight into the regulation of protein synthesis with insulin resistance that is not captured over acute time frames. Use of deuterium oxide (D2O) labeling can provide a measurement of protein synthesis over days to several weeks (26, 27, 39). The synthesis rate represents an average over periods of feeding, fasting, and physical activity, which all influence mitochondrial protein synthesis rates (6, 48). D2O is provided in drinking water to enrich the body water pool with 2H atoms. Amino acids, including alanine, become endogenously labeled with 2H and are subsequently incorporated into proteins (9). Previous work using D2O labeling for 24 h demonstrated that obese rats had similar rates of mitochondrial protein synthesis at rest and a blunted response to exercise compared with lean controls (32, 33), suggesting that mitochondrial protein synthesis may develop resistance to anabolic stimuli. Understanding cumulative rates of protein synthesis over longer periods provides insight into the regulation of mitochondrial proteins following changes to insulin sensitivity.
Our purpose was to investigate whether mitochondrial protein synthesis, using D2O labeling for 14 days, is impaired with insulin resistance and then subsequently restored with an insulin-sensitizing treatment, pioglitazone (PIO). We hypothesized that compared with lean controls, mice with diet-induced obesity would have decreased rates of long-term skeletal muscle protein synthesis, including mitochondrial protein synthesis, and decreased mitochondrial respiratory capacity. The secondary hypothesis was that restoring insulin sensitivity with PIO would increase protein synthesis and mitochondrial respiratory capacity. Contrary to our hypothesis, mitochondrial protein synthesis and energetics were not impaired following induction of insulin resistance. Instead, a high-fat diet appeared to have a stronger effect on mitochondrial adaptations than did changes to insulin sensitivity. The increased mitochondrial protein synthesis provides a possible mechanism for increased mitochondrial lipid oxidation as an adaptation to a high-fat diet.
METHODS
Study design.
The study was approved by the Animal Care and Use Committees at the Mayo Clinic (no. 385-14) and Oregon State University (no. 4788). Eight- to ten-week-old male C57BL/6J mice (Jackson Laboratories) were housed 3–5 per cage in 12:12-h light-dark cycle at 22°C with free access to food and water. Mice consumed either a low-fat diet (LFD) or a high-fat diet (HFD) for 4 wk, and then diets were enriched in PIO or not (CON) for 8 additional weeks. Glucose tolerance tests (GTT) and insulin tolerance tests (ITT) were performed at baseline (week 0), following induction of insulin resistance (week 4), and then at week 10. Metabolic assessment by continuous laboratory animal monitoring system (CLAMS; Columbus Instruments, Columbus, OH) was performed at week 10 along with body composition by EchoMRI. D2O labeling was performed between weeks 10 and 12 for skeletal muscle protein synthesis. At week 12, mice were fasted for 4 h and then anesthetized by sodium pentobarbital overdose for tissue collection.
Diet composition.
Diets were purchased as pellets and matched for sucrose (LFD, D12450J; HFD, D12492; Research Diets, New Brunswick, NJ). The percent kilocalories from total fat/carbohydrates/protein for the LFD were 10/70/20 and for the HFD were 60/20/20. PIO (TCI America, Portland, OR) was mixed into diets at 53 mg PIO/4,057 kcal of diet. PIO was provided in the diet to avoid stress on the mice associated with a regular intraperitoneal injection. The dose provided ~2 mg·kg body wt−1·day−1 for HFD and 6 mg·kg body wt−1·day−1 for LFD, which was comparable to an intraperitoneal dose of 10 mg·kg body wt−1·day−1 that was effective for improving insulin sensitivity in mice consuming a HFD (43).
D2O labeling.
On week 10, all mice had an intraperitoneal injection of D2O (~99%; Cambridge Isotope Laboratories, Tewksbury, MA) at 30 μl/g body wt to raise body water enrichment to ~5% (assuming 60% water weight) followed by continued consumption of D2O enriched at 8% in drinking water (11). Plasma samples collected at euthanasia were analyzed for D2O enrichment to calculate precursor enrichment. Body water enrichment was determined from plasma using an Agilent 7890A gas chromatograph coupled to a 5975C mass spectrometer (39). Quadriceps muscle was fractionated by differential centrifugation to subcellular fractions enriched with myofibrillar, sarcoplasmic, and mitochondrial proteins (11, 26). Protein fractions were hydrolyzed to amino acids, derivatized, and analyzed on an Agilent 7890B gas chromatograph coupled to a 5977A mass spectrometer. The newly synthesized fraction (f) of muscle proteins was calculated from the enrichment of labeled alanine bound to muscle proteins divided by the true precursor enrichment (p). The precursor enrichment was calculated from D2O enrichment in plasma, which was adjusted using mass isotopomer distribution analysis calculations (9). The fraction then was divided by time and multiplied by 100 to obtain the fractional synthesis rate (FSR).
Glucose and insulin tolerance testing.
GTT and ITT were performed in individual mice in fresh cages. Blood samples were collected into a microhematocrit capillary tube from a tail nick. Mice were not restrained during testing or blood collection. For GTT, food was removed at 0700 to induce a 6-h fast. A blood sample was collected for fasting plasma insulin (Alpco, Salem, NH), and then glucose was provided as an intraperitoneal injection of 2 g/kg body wt of 20% sucrose. Blood glucose concentrations were measured by a handheld glucometer at 0, 5, 15, 30, 60, and 120 min. For ITT, food was removed at 0700 to induce a 4-h fast. Insulin (Humulin R; Eli Lilly, Indianapolis IN) was injected intraperitoneally at 0.5 IU/kg body wt. Blood glucose concentrations were measured at 0, 15, 30, 60, and 90 min. We compared PIO and CON treatment within each diet group to avoid comparing mice with large differences in body weights and therefore different injection volumes (25).
High-resolution respirometry.
Mitochondria were isolated from quadriceps muscle using differential centrifugation (24). High-resolution respirometry was performed using two Oxygraph-2k units (Oroboros Instruments, Innsbruck, Austria) with MiR05 respiration buffer (0.5 mM EGTA, 3 mM MgCl2-6H2O, 60 mM lactobionic acid, 20 mM taurine, 10 mM KH2PO4, 20 mM HEPES, 110 mM sucrose, and 1 g/l bovine serum albumin). One Oxygraph measured oxygen consumption and H2O2 production using 10 μM Amplex red, 5 U/ml superoxide dismutase, and 1 U/ml horseradish peroxidase and calibrated using injections of H2O2. The titration sequence was 50 μl of mitochondrial suspension (Mitos), 10 mM glutamate + 2 mM malate, 5 mM ADP (OxPHOSGM, where OxPHOS stands for oxidative phosphorylation), 10 mM succinate (OxPHOSGMS), 0.5 μM rotenone (OxPHOSGMS+Rot), 2 μg/ml oligomycin (LeakGMS), sequential additions of 0.05 mM FCCP to plateau (ETSGMS+Rot, where ETS stands for electron transport system), and 2.5 mM antimycin for residual oxygen consumption (ROXGMS).
A second Oxygraph measured oxygen consumption during fatty acid oxidation (FAO) using palmitoyl-l-carnitine with addition of 50 μl of mitochondrial suspension (Mitos), 0.005 mM palmitoyl-l-carnitine + 2 mM malate, 5 mM ADP (OxPHOSFAO), 2 μg/ml oligomycin (LeakFAO), sequential additions of 0.05 mM FCCP to plateau (ETSFAO), and 2.5 mM antimycin (ROXFAO) as described previously (23). Membrane integrity was verified by adding 10 μM cytochrome c and observing little to no change in OxPHOSFAO [average change −2.7 ± 2.9% (SD)]. Cytochrome c is not compatible with Amplex red and was not added to the glutamate-malate-succinate titrations. Protein concentration of the mitochondrial preparation was measured by bicinchoninic assay (Bio-Rad, Hercules, CA).
Western blotting.
Quadriceps muscle (~30 mg) was homogenized 1:10 wt/vol in buffer (20 mM Tris·HCl, pH 7.5, 150 mM NaCl, 1 mM Na2EDTA, 1 mM EGTA, 1% Triton, 2.5 mM sodium pyrophosphate, 1 mM β-glycerophosphate, 1 mM Na3VO4, and 1× Sigma Protease Inhibitor Cocktail no. P8340) and then incubated at 4°C for 20 min and centrifuged at 10,000 g for 10 min at 4°C. Approximately 30 μg of protein from the supernatant were separated on 10 or 12% bis-Tris gels and then transferred to nitrocellulose membranes. Equal loading was verified using Ponceau staining of membranes and tubulin as a loading control. Gels included a negative and positive control cell lysate plus repeated internal control. The average intensities for all three controls were used to normalize intensities between gels. Membranes were blocked in 5% bovine serum albumin in Tris-buffered saline with Tween (TBST) and then incubated overnight at 4°C in primary antibodies (1:1,000). Membranes were washed 3 × 10 min in TBST and then incubated for 1 h at room temperature in secondary antibody diluted in blocking buffer. Images were generated using infrared imaging (Odyssey; Li-Cor, Lincoln NE). Primary antibodies were microtubule-associated light chain 3 (LC3; no. 12741; Cell Signaling Technology), p62 (no. 7695; Cell Signaling Technology), tubulin (no. 926-42213; Li-Cor), pSer473 Akt (no. 9271; Cell Signaling Technology), total Akt (no. 2920; Cell Signaling Technology), OxPHOS cocktail (no. 110413; Abcam), hydroxyacyl-CoA dehydrogenase (HADH; PA5-28203; Thermo Fisher Scientific), and voltage-dependent anion channel (VDAC; no. 9412; Cell Signaling Technology). Secondary antibodies were anti-rabbit-700 (1:10,000; no. 926-68071; Li-Cor) and anti-mouse-800 (1:50,000; no. 926-32212; Li-Cor). Oxidative damage was measured using a kit (Oxyblot; Abcam, Cambridge, MA).
Statistics.
Data generated at death were analyzed with a two-way analysis of variance model (ANOVA) by diet and pioglitazone treatment. Post hoc comparisons were made using Tukey’s honestly significant difference. Energy expenditure was analyzed using analysis of covariance (ANCOVA) of lean body mass and pioglitazone treatment (44). A lack of interaction for lean body mass × pioglitazone was verified before ANCOVA. The results of ITT and GTT between PIO and CON were compared by unpaired t-test within diet groups. Statistical significance was set at P = 0.05. Statistics were performed using JMP Pro version 12.0 (SAS Institute, Cary, NC). Graphs were generated using Prism version 6 (GraphPad Software, La Jolla, CA). Data are presented as means ± SD.
RESULTS
Mouse phenotyping.
By week 4, mice consuming a HFD had greater body weight and signs of diet-induced insulin resistance compared with a LFD, including higher fasting blood glucose and insulin concentrations (Fig. 1, A and B). The HFD model decreased glucose tolerance [HFD: 6,098 ± 5,179 vs. LFD: 2,831 ± 2,560 area under the curve (AUC), P = 0.006] and insulin tolerance (HFD: 10,092 ± 2,312 vs. LFD: 7,360 ± 5,968 AUC, P = 0.037). PIO treatment improved glucose tolerance (Fig. 1, C–E) and insulin tolerance (Fig. 1, F–H) in mice on a HFD. The results verified that the induction of insulin resistance then improved insulin sensitivity with PIO treatment on mice consuming a HFD.
Fig. 1.

Assessment of glucose and insulin sensitivity. Fasting hyperglycemia was detected at weeks 4 and 12 in mice consuming a high-fat diet (HFD) compared with low-fat diet (LFD), with no differences with pioglitazone (PIO) treatment (A). Fasting hyperinsulinemia was detected at week 4 in mice consuming HFD, which was attenuated by week 12 with PIO treatment (B). Blood glucose concentrations during glucose tolerance testing (GTT) at week 12 (C and D). PIO treatment in HFD decreased the area under the curve (AUC) above baseline for glucose concentrations during GTT (E). Blood glucose concentrations during insulin tolerance testing (ITT) at week 12 (F and G). Two mice had a fall in blood glucose during GTT (1 each from HFD+PIO and LFD+CON), and one mouse in the HFD had a drastic rise in blood glucose during ITT; these mice were removed from the respective analyses. The fall in blood glucose from t = 0 to t = 30 min was greater with PIO treatment in HFD mice (H). Blood glucose concentrations during GTT and ITT were analyzed by two-way ANOVA (drug × time) within each diet group. AUC during GTT and ITT were compared within each diet using unpaired t-test. Bars indicate means ± SD; AU, arbitrary units. n = 8–14 per group. ***P ≤ 0.001 for post-hoc comparison within diet group.
At week 10, HFD+PIO and HFD+CON mice had similar lean body mass, but HFD+PIO had higher body weight because of greater fat mass (Fig. 2A). There was no effect of PIO treatment on the relationship between lean body mass and energy expenditure when measured during 24 h of feeding (Fig. 2B), with an interaction of P = 0.069 between lean body mass and PIO treatment. Mice with PIO treatment had greater (P < 0.0001) energy expenditure during 24 h of fasting, but the relationship did not vary with lean body mass (Fig. 2C). Data are not shown for energy intake, based on weighed food intake, because of a much higher calculated intake for the LFD (~16 kcal/day) than the HFD (~8 kcal/day) that would result in the HFD mice being in negative energy balance. The physical characteristics of the LFD made it more prone to spillage from the hoppers, and excess wasting may account for the apparent higher intake of the LFD. Whole body respiratory exchange ratio (RER) was lower with the HFD, indicating greater lipid oxidation (Fig. 2D).
Fig. 2.

Body composition and whole body energy metabolism. Mice underwent body composition analysis by EchoMRI and continuous laboratory animal monitoring in individual cages at week 10. Body weight was greater in HFD+PIO mice because of greater fat mass (A). ANCOVA revealed that PIO treatment did not change the positive relationship between total daily energy expenditure (EE) and lean body mass during 24 h of feeding (B). PIO treatment resulted in greater energy expenditure during 24 h of fasting without an interaction with lean body mass (C). Whole body respiratory exchange ratio (RER) was lower with HFD with no effect of PIO (D). Body composition and RER data were compared with two-way ANOVA (diet × drug) with post hoc analysis performed using Tukey’s test. Bars indicate means ± SD; n = 8–14 per group. ***P < 0.01 for post hoc comparison within diet group; #P < 0.0001 between intercepts of regression lines.
Protein synthesis.
Protein synthesis rates were measured during weeks 10–12 using D2O enrichment in drinking water. Mitochondrial protein synthesis was greater in mice consuming the HFD compared with the LFD but was not different between HFD+PIO and HFD+CON (Fig. 3A). Similarly, sarcoplasmic protein synthesis was greater with the HFD than the LFD and not different between HFD+PIO and HFD+CON (Fig. 3B). Myofibrillar protein synthesis was not different between diet or PIO treatment groups (Fig. 3C). The greater protein synthesis rates for mitochondrial and sarcoplasmic fractions occurred in mice consuming HFD despite varying degrees of insulin sensitivity between PIO and CON.
Fig. 3.
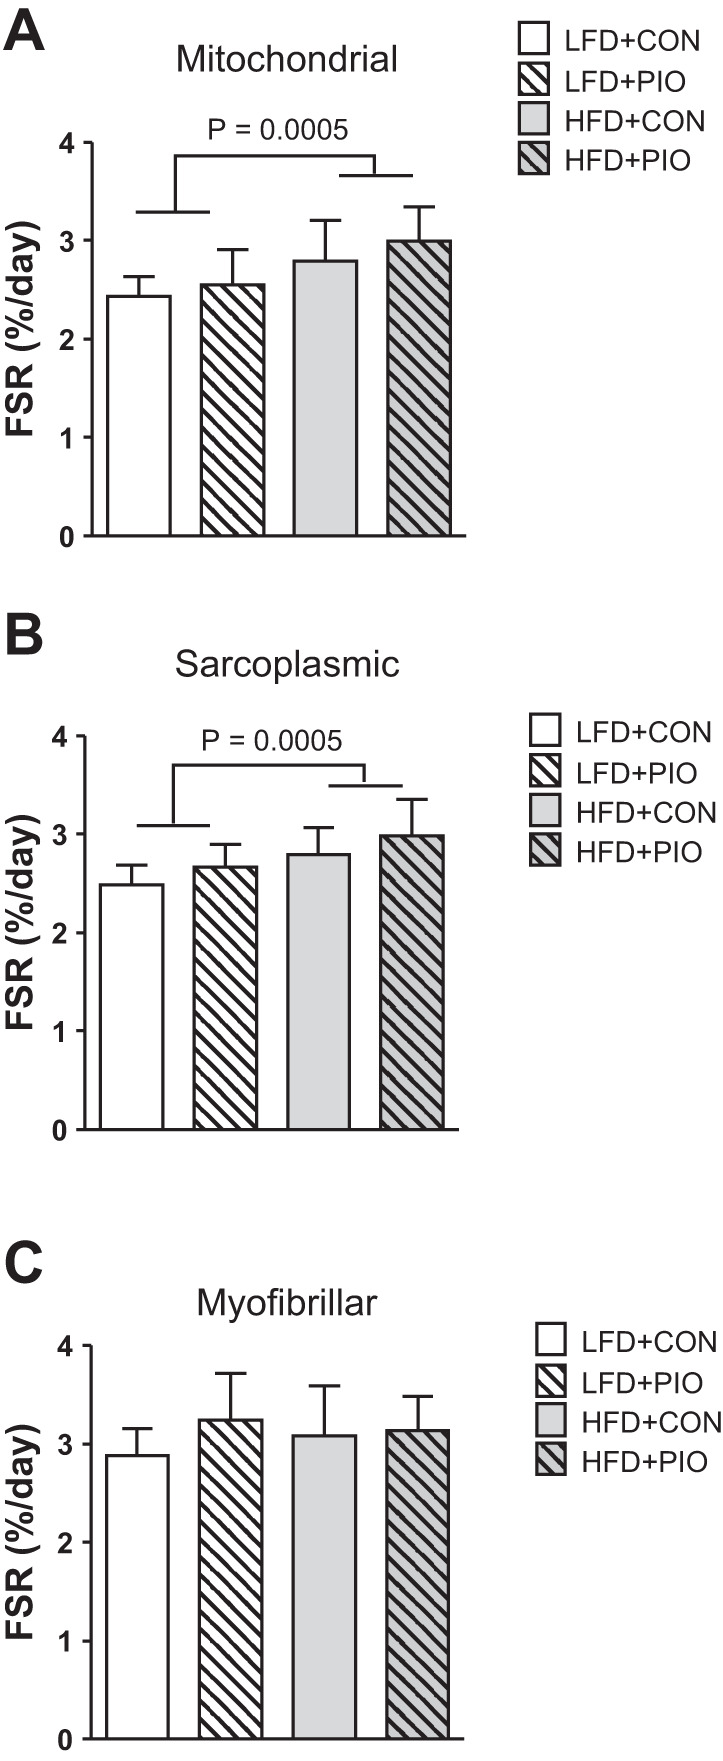
Long-term protein synthesis of skeletal muscle fractions. The fractional synthesis rate (FSR) of skeletal muscle protein pools was measured over 14 days using deuterium oxide labeling. Mitochondrial protein FSR was increased in HFD mice with no difference of PIO treatment (A). Sarcoplasmic protein FSR was increased with HFD, and there was a main effect of PIO treatment, but no diet × drug interaction (B). Myofibrillar protein FSR was not different between HFD or PIO treatment groups (C). Data were compared with two-way ANOVA (diet × drug). Data are means ± SD; n = 8–14 per group.
Mitochondrial respiration.
We measured respiration of mitochondria isolated from quadriceps muscles at death. There were no differences between diet or PIO treatment groups in oxidative phosphorylation capacity per mitochondrial protein abundance with electrons provided through glutamate, malate, and succinate (Fig. 4A). Respiration due to proton leak (LeakGMS) was similar between diet and PIO treatment groups as was electron transport capacity (ETSGMS+Rot). Of note, ETSGMS+Rot did not include the contribution of electrons from complex I due to the prior addition of rotenone; therefore, our reported maximal ETS capacity during GMS titration is less than that with a GMS titration with no inhibition.
Fig. 4.

Skeletal muscle mitochondrial respiration and H2O2 emission. High-resolution respirometry was performed on mitochondria isolated from quadriceps muscle using glutamate-malate-succinate (GMS) or palmitoyl-l-carnitine for fatty acid oxidation (FAO) followed by inhibitors and uncoupler. Oxygen consumption (JO2) during glutamate-malate-succinate-based respiration was not different between diet or PIO groups when expressed relative to mitochondrial protein (mito) abundance (A). Oxygen consumption (JO2) during fatty acid oxidation (OxPHOSFAO) was increased with HFD with no effect of PIO when expressed relative to mitochondrial protein abundance (B). The addition of cytochrome c (cyto c) did not alter respiration and indicates that mitochondrial membranes were intact. There were no differences between groups in H2O2 emissions measured during glutamate-malate-succinate respiration (JH2O2; C). Oxidative damage was not different between diet or PIO treatment groups as measured by carbonyl modification to quadriceps muscle lysates (D). Representative images from blots for antibodies against oxidative damage and tubulin. Samples were analyzed for oxidative damage using nonderivatized (−) or derivatized samples (+) and were not boiled such that tubulin has an apparent molecular weight that is higher than predicted. Data were compared with two-way ANOVA (diet × drug). Data are means ± SD; n = 8–14 per group.
Maximal palmitoyl-l-carnitine oxidation (OxPHOSFAO) was greater in HFD mice, but there was no difference with PIO treatment (Fig. 4B). Mice fed a HFD had increased maximal electron transport capacity with fatty acid substrate (ETSFAO). Respiration was expressed per mitochondrial protein abundance and indicates that HFD induced a greater fatty acid oxidation capacity per microgram of mitochondrial protein content.
We were interested in H2O2 emission during oxidative phosphorylation and measured H2O2 emission in isolated mitochondria during GMS titrations. There were no differences between diet or PIO treatment groups in H2O2 emission between LFD and HFD mice during either OxPHOS or LeakGMS respiration, whereas LeakGMS induced the highest H2O2 emission (Fig. 4C). Oxidative damage to whole muscle lysates, as measured by protein carbonyl content, was not different between diet or PIO groups (Fig. 4D). Overall, we did not detect measurable differences in mitochondrial H2O2 emission or oxidative damage to muscle proteins during decreased insulin sensitivity induced by the HFD or improvements to insulin sensitivity with PIO treatment.
We considered whether mitochondrial protein abundance changed with the HFD, given that protein synthesis was increased, as was mitochondrial fatty acid respiration. We did not detect differences between HFD or PIO treatment groups for protein abundance of subunits for complexes I–V (Fig. 5, A–E); however, HADH protein abundance was increased with the HFD (Fig. 5F). The results indicate a greater capacity for β-oxidation and increased respiration capacity per mitochondrial protein with a HFD.
Fig. 5.

Mitochondrial complex protein abundance. The protein abundance for subunits for complexes I–V was not different between diet or PIO treatment groups as measured using immunoblotting (A–E). Hydroxyacl-CoA dehydrogenase (HADH) protein abundance was increased with HFD (F). Representative images are provided from the same blot for subunit identification and Ponceau staining or tubulin as loading control (G and H). Data are means ± SD; CTL, interassay control; n = 8–14 per group.
Autophagy and insulin signaling.
Given that mitochondrial protein synthesis and respiration were increased without changes to mitochondrial protein abundance, we considered whether there were differences in markers of protein degradation. LC3-I content was not changed in any group whereas LC3-II content and the ratio of LC3-II to LC3-I was increased with the HFD compared with the LFD, indicating an accumulation of autophagosomes (Fig. 6, A–C). The protein content of p62, which declines during increased autophagy flux (5), was decreased in HFD compared with LFD groups, and the effect was not modified by PIO treatment (Fig. 6D). We considered whether such whole cell measures were evident in mitochondria but did not detect any changes to LC3-II content in a mitochondrial-enriched fraction (Fig. 6E). VDAC protein abundance did not change in whole cell lysates (data not shown) and was used as normalization across mitochondrial isolations. Static markers do not directly measure flux through autophagy (28); however, the p62 and LC3 results are consistent with increased autophagy activation at the whole cell, but not mitochondrial, level. Akt phosphorylation in the fasted state at Ser473 was greater with both HFD groups compared with LFD (Fig. 6F), consistent with higher fasting insulin concentrations. The increase of mitochondrial protein synthesis and autophagosome content is consistent with greater protein turnover with no change in mitochondrial protein abundance. Such gains occurred as a main effect in response to the HFD and were not different between PIO and CON.
Fig. 6.

Autophagy and Akt activation. Autophagy and Akt activation were measured by immunoblotting of lysates from quadriceps muscle. The conversion of microtubule-associated light chain 3 (LC3)-I to LC3-II was greater with HFD mice and not different with PIO treatment (A–C). Protein content for p62 was decreased with HFD (D). LC3-II content of mitochondria isolated from gastrocnemius muscle was not different between diet or PIO groups (E). Akt phosphorylation was greater with HFD at Ser473 normalized to total Akt (F). PIO treatment did not alter the response to HFD. Representative images are provided with corresponding graphs. Voltage-dependent anion channel (VDAC) was used to normalize LC3-II content in mitochondrial isolations. Data are means ± SD; (−), negative control for autophagy or phosphorylation; (+), positive control for autophagy or phosphorylation; CTL, interassay control; n = 8–14 per group.
DISCUSSION
The major conclusion of our study is that mitochondrial protein synthesis is increased rather than impaired with HFD-induced insulin resistance. This conclusion is based on greater long-term rates of mitochondrial protein synthesis in mice consuming a HFD compared with LFD, regardless of restoration of insulin sensitivity using PIO treatment. The results do not support that insulin resistance leads to declines in mitochondrial respiratory capacity as there were no measured impairments to mitochondrial respiration or H2O2 emission following induction of insulin resistance and improving insulin sensitivity with PIO did not influence these outcomes. Instead, mice consuming a HFD had higher mitochondrial lipid oxidation capacity and whole body lipid oxidation. Our results provide a mechanism by which mitochondrial lipid oxidation is increased with HFD and support the notion that changes in mitochondrial respiration are a primary response to HFD and not a direct result of insulin resistance.
Insulin contributes to mitochondrial protein turnover through stimulation of protein synthesis when amino acid concentrations are maintained (38) and suppression of degradation (37); therefore, it could be expected that the development of insulin resistance may decrease mitochondrial protein turnover. In support, declines in whole body protein turnover have been reported in patients with type 2 diabetes compared with lean or obese controls (34). Yet, studies have indicated that protein synthesis was not impaired with insulin resistance when measured at the whole body or regional level over several hours (4, 41, 46). Furthermore, mitochondrial protein synthesis was higher in obese adults than in lean when measured over several hours (15). Our results using a long-term labeling approach indicate that protein synthesis rates of either mitochondrial or other muscle fractions were not decreased as a result of insulin resistance.
A potential mechanism for increased mitochondrial protein synthesis with a HFD may be a response to high circulating concentrations of insulin and fatty acids. Hyperinsulinemia stimulates mitochondrial protein synthesis when essential amino acids are maintained by exogenous infusion (38). Lipids can signal through the peroxisome proliferator-activated receptor (PPAR) family of transcription factors, which regulate the transcription of many genes involved with mitochondrial metabolism, particularly for fatty acid oxidation (12). Thus increased mitochondrial protein synthesis with a HFD may result from a combination of translational activation by hyperinsulinemia and transcriptional activation in response to high lipids.
Previous work using D2O labeling for 24 h demonstrated similar mitochondrial protein synthesis rates between obese Zucker rats and controls at rest (32). Compared with lean rats, obese rats did not stimulate mitochondrial protein synthesis as measured by the average synthesis rate during the 24 h following resistance exercise, indicating that mitochondrial protein synthesis may develop resistance to an anabolic stimulus (33). Our approach measured protein synthesis over 14 days as the average across feeding, fasting, and physical activity periods. Any potential resistance to acute anabolic stimuli did not develop into differences over the longer-term labeling period.
The increase in mitochondrial protein synthesis with a HFD was matched by increased lipid oxidation capacity, regardless of improving insulin sensitivity with PIO. The mouse model of diet-induced obesity with varying degrees of insulin sensitivity indicates that changes in mitochondrial respiration were in response to diet and not dependent on insulin sensitivity. Others have also demonstrated gains in mitochondrial respiratory capacity in models of insulin resistance, as rodents on high-fat diets have increased markers of mitochondrial content (16), respiration (23), and capacity for fatty acid oxidation compared with low-fat diet controls (45). Thus higher mitochondrial protein synthesis may contribute to increased mitochondrial protein abundance observed with a HFD (16). Our results indicated that insulin resistance was not accompanied by impairments to mitochondrial respiratory capacity and, instead, demonstrated increased capacity for lipid oxidation in the mitochondria and consistently greater whole body fat oxidation during feeding and fasting periods.
There is a strong precedent for decreased mitochondrial content and respiration with obesity, insulin resistance, or type 2 diabetes (19, 29, 30, 36, 40). Lower mitochondrial content and respiratory capacity are suggested to contribute to an accumulation of excess fuels, particularly as intramuscular lipids (35), and impaired insulin signaling. Yet data generated from adults across a span of ages and body compositions showed no relationship between mitochondrial respiratory capacity and insulin sensitivity measured by insulin clamp (22). Instead of decreased oxidative capacity as a contributor to insulin resistance, evidence indicates that increased fat oxidation with a HFD is associated with the accumulation of lipid metabolites that impair insulin signaling (21), although the mechanism of how lipid metabolites interfere with insulin signaling remains to be fully elucidated. Our data are consistent with a HFD resulting in greater flux through lipid oxidation pathways, regardless of insulin-sensitizer treatment, when measured across the whole body or isolated mitochondria.
Mitochondrial H2O2 emissions with a HFD are implicated in the development of insulin resistance (1). Higher rates of mitochondrial H2O2 emissions during ADP-limited respiration have been detected in obese adults and were restored to a lean phenotype following aerobic training (20). We measured H2O2 emission simultaneously during ADP-saturating conditions and did not detect any differences with insulin resistance or treatment with PIO. We cannot exclude the possibility that maximal H2O2 emission is different during ADP-limited respiration.
Autophagy is a primary pathway to degrade mitochondria and was increased with a HFD when measured in whole cell lysates, regardless of PIO treatment. Such activation may explain why the abundance of specific mitochondrial proteins did not change despite the increased mitochondrial protein synthesis with the HFD. The degradation of individual proteins may vary given that specific mitochondrial proteins were increased (e.g., HADH) but not others (e.g., oxidative phosphorylation subunits). Previous work has demonstrated differences in degradation products of individual mitochondrial proteins during insulin deprivation (37). Insulin signaling through Akt has a suppressive effect on autophagy, yet Akt phosphorylation in the fasted state was increased in HFD mice and may be attributed to higher circulating insulin than in LFD mice. An important consideration is that autophagy and Akt were assessed in a fasted state, whereas defects may occur in response to greater nutrient availability. For example, other studies have reported that insulin resistance was associated with blunted Akt phosphorylation during a hyperinsulinemic clamp (42).
Autophagy promotes cellular function in part by degrading proteins that have accumulated damage as irreversible posttranslational modification, such as oxidative modifications (50). We did not detect any differences in global oxidative damage to proteins between diet or PIO treatment groups but cannot exclude that individual proteins may accumulate oxidative damage (18). Our present results of increased autophagy are consistent with a previous study showing increased skeletal muscle protein degradation in adults with insulin resistance (3).
Our approach induced insulin resistance with a HFD and then treated mice with PIO to model disease development and treatment. Weighed-food intake indicated that mice on the HFD received a lower dose per body weight than those on the LFD, yet the dose of PIO achieved the goal of improving insulin sensitivity during the HFD. PIO can disrupt complex I assembly and inhibit mitochondrial respiration (13), and such inhibition appears to be concentration dependent (8). Our dose of PIO did not appear to inhibit respiration with GMS or palmitoyl-l-carnitine.
All mitochondrial measurements occurred after the induction or treatment of insulin resistance. We cannot determine whether changes in mitochondria preceded the development of insulin resistance or may result from longer durations of insulin resistance. Our results provide a mechanism of increased mitochondrial protein synthesis as a contributor to increased lipid respiration with a HFD. Extended exposure to increased flux through lipid oxidation pathways may contribute to insulin resistance (21).
In conclusion, long-term rates of mitochondrial protein synthesis and respiratory capacity were not impaired with HFD-induced insulin resistance. Instead, mitochondrial protein synthesis was increased and may account for increased mitochondrial lipid oxidation capacity in mice consuming a HFD, regardless of differences in insulin sensitivity with PIO treatment. Collectively, our results indicate that changes to mitochondria with a HFD may be due to nutrient availability and not intrinsic defects that contribute to insulin resistance.
GRANTS
Funding was provided by National Institute of Diabetes and Digestive and Kidney Diseases Grant 103829 to M. M. Robinson.
DISCLOSURES
No conflicts of interest, financial or otherwise, are declared by the authors.
AUTHOR CONTRIBUTIONS
M.M.R. conceived and designed research; M.M.R. performed experiments; S.A.N., B.F.M., K.L.H., S.E.E., H.D.S., and M.M.R. analyzed data; S.A.N., B.F.M., K.L.H., S.E.E., H.D.S., and M.M.R. interpreted results of experiments; M.M.R. prepared figures; M.M.R. drafted manuscript; S.A.N., B.F.M., K.L.H., S.E.E., H.D.S., and M.M.R. edited and revised manuscript; S.A.N., B.F.M., K.L.H., S.E.E., H.D.S., and M.M.R. approved final version of manuscript.
ACKNOWLEDGMENTS
We thank Dr. Sreekumaran Nair, Dr. Ian Lanza, Dr. Manjunatha Shankarappa, Kate Klaus, and Dawn Morse from the Mayo Clinic for skilled assistance and contributions as well as Emily Burney and Bergen Sather from Oregon State University. We appreciate the services of Dr. Nathan Lebrasseur and Dr. Tom White from the Mayo Clinic for mouse metabolic phenotyping. We also thank Rick Peelor III at Colorado State University for skilled assistance on mass spectrometry and Jaime Laurin and Justin Reid for sample preparation.
REFERENCES
- 1.Anderson EJ, Lustig ME, Boyle KE, Woodlief TL, Kane DA, Lin CT, Price JW III, Kang L, Rabinovitch PS, Szeto HH, Houmard JA, Cortright RN, Wasserman DH, Neufer PD. Mitochondrial H2O2 emission and cellular redox state link excess fat intake to insulin resistance in both rodents and humans. J Clin Invest 119: 573–581, 2009. doi: 10.1172/JCI37048. [DOI] [PMC free article] [PubMed] [Google Scholar]
- 2.Barazzoni R, Short KR, Asmann Y, Coenen-Schimke JM, Robinson MM, Nair KS. Insulin fails to enhance mTOR phosphorylation, mitochondrial protein synthesis, and ATP production in human skeletal muscle without amino acid replacement. Am J Physiol Endocrinol Metab 303: E1117–E1125, 2012. doi: 10.1152/ajpendo.00067.2012. [DOI] [PMC free article] [PubMed] [Google Scholar]
- 3.Bell JA, Volpi E, Fujita S, Cadenas JG, Sheffield-Moore M, Rasmussen BB. Skeletal muscle protein anabolic response to increased energy and insulin is preserved in poorly controlled type 2 diabetes. J Nutr 136: 1249–1255, 2006. [DOI] [PMC free article] [PubMed] [Google Scholar]
- 4.Biolo G, Tessari P, Inchiostro S, Bruttomesso D, Sabadin L, Fongher C, Panebianco G, Fratton MG, Tiengo A. Fasting and postmeal phenylalanine metabolism in mild type 2 diabetes. Am J Physiol Endocrinol Metab 263: E877–E883, 1992. [DOI] [PubMed] [Google Scholar]
- 5.Bjørkøy G, Lamark T, Pankiv S, Øvervatn A, Brech A, Johansen T. Monitoring autophagic degradation of p62/SQSTM1. Methods Enzymol 452: 181–197, 2009. doi: 10.1016/S0076-6879(08)03612-4. [DOI] [PubMed] [Google Scholar]
- 6.Bohé J, Low A, Wolfe RR, Rennie MJ. Human muscle protein synthesis is modulated by extracellular, not intramuscular amino acid availability: a dose-response study. J Physiol 552: 315–324, 2003. doi: 10.1113/jphysiol.2003.050674. [DOI] [PMC free article] [PubMed] [Google Scholar]
- 7.Boushel R, Gnaiger E, Schjerling P, Skovbro M, Kraunsøe R, Dela F. Patients with type 2 diabetes have normal mitochondrial function in skeletal muscle. Diabetologia 50: 790–796, 2007. doi: 10.1007/s00125-007-0594-3. [DOI] [PMC free article] [PubMed] [Google Scholar]
- 8.Brunmair B, Staniek K, Gras F, Scharf N, Althaym A, Clara R, Roden M, Gnaiger E, Nohl H, Waldhäusl W, Fürnsinn C. Thiazolidinediones, like metformin, inhibit respiratory complex I: a common mechanism contributing to their antidiabetic actions? Diabetes 53: 1052–1059, 2004. doi: 10.2337/diabetes.53.4.1052. [DOI] [PubMed] [Google Scholar]
- 9.Busch R, Kim YK, Neese RA, Schade-Serin V, Collins M, Awada M, Gardner JL, Beysen C, Marino ME, Misell LM, Hellerstein MK. Measurement of protein turnover rates by heavy water labeling of nonessential amino acids. Biochim Biophys Acta 1760: 730–744, 2006. doi: 10.1016/j.bbagen.2005.12.023. [DOI] [PubMed] [Google Scholar]
- 10.Chanseaume E, Giraudet C, Gryson C, Walrand S, Rousset P, Boirie Y, Morio B. Enhanced muscle mixed and mitochondrial protein synthesis rates after a high-fat or high-sucrose diet. Obesity (Silver Spring) 15: 853–859, 2007. doi: 10.1038/oby.2007.582. [DOI] [PubMed] [Google Scholar]
- 11.Drake JC, Bruns DR, Peelor FF III, Biela LM, Miller RA, Miller BF, Hamilton KL. Long-lived Snell dwarf mice display increased proteostatic mechanisms that are not dependent on decreased mTORC1 activity. Aging Cell 14: 474–482, 2015. doi: 10.1111/acel.12329. [DOI] [PMC free article] [PubMed] [Google Scholar]
- 12.Finck BN, Bernal-Mizrachi C, Han DH, Coleman T, Sambandam N, LaRiviere LL, Holloszy JO, Semenkovich CF, Kelly DP. A potential link between muscle peroxisome proliferator- activated receptor-alpha signaling and obesity-related diabetes. Cell Metab 1: 133–144, 2005. doi: 10.1016/j.cmet.2005.01.006. [DOI] [PubMed] [Google Scholar]
- 13.García-Ruiz I, Solís-Muñoz P, Fernández-Moreira D, Muñoz-Yagüe T, Solís-Herruzo JA. Pioglitazone leads to an inactivation and disassembly of complex I of the mitochondrial respiratory chain. BMC Biol 11: 88, 2013. doi: 10.1186/1741-7007-11-88. [DOI] [PMC free article] [PubMed] [Google Scholar]
- 14.Guillet C, Delcourt I, Rance M, Giraudet C, Walrand S, Bedu M, Duche P, Boirie Y. Changes in basal and insulin and amino acid response of whole body and skeletal muscle proteins in obese men. J Clin Endocrinol Metab 94: 3044–3050, 2009. doi: 10.1210/jc.2008-2216. [DOI] [PubMed] [Google Scholar]
- 15.Halvatsiotis P, Short KR, Bigelow M, Nair KS. Synthesis rate of muscle proteins, muscle functions, and amino acid kinetics in type 2 diabetes. Diabetes 51: 2395–2404, 2002. doi: 10.2337/diabetes.51.8.2395. [DOI] [PubMed] [Google Scholar]
- 16.Hancock CR, Han DH, Chen M, Terada S, Yasuda T, Wright DC, Holloszy JO. High-fat diets cause insulin resistance despite an increase in muscle mitochondria. Proc Natl Acad Sci USA 105: 7815–7820, 2008. doi: 10.1073/pnas.0802057105. [DOI] [PMC free article] [PubMed] [Google Scholar]
- 18.Jaleel A, Henderson GC, Madden BJ, Klaus KA, Morse DM, Gopala S, Nair KS. Identification of de novo synthesized and relatively older proteins: accelerated oxidative damage to de novo synthesized apolipoprotein A-1 in type 1 diabetes. Diabetes 59: 2366–2374, 2010. doi: 10.2337/db10-0371. [DOI] [PMC free article] [PubMed] [Google Scholar]
- 19.Kelley DE, He J, Menshikova EV, Ritov VB. Dysfunction of mitochondria in human skeletal muscle in type 2 diabetes. Diabetes 51: 2944–2950, 2002. doi: 10.2337/diabetes.51.10.2944. [DOI] [PubMed] [Google Scholar]
- 20.Konopka AR, Asante A, Lanza IR, Robinson MM, Johnson ML, Dalla Man C, Cobelli C, Amols MH, Irving BA, Nair KS. Defects in mitochondrial efficiency and H2O2 emissions in obese women are restored to a lean phenotype with aerobic exercise training. Diabetes 64: 2104–2115, 2015. doi: 10.2337/db14-1701. [DOI] [PMC free article] [PubMed] [Google Scholar]
- 21.Koves TR, Ussher JR, Noland RC, Slentz D, Mosedale M, Ilkayeva O, Bain J, Stevens R, Dyck JR, Newgard CB, Lopaschuk GD, Muoio DM. Mitochondrial overload and incomplete fatty acid oxidation contribute to skeletal muscle insulin resistance. Cell Metab 7: 45–56, 2008. doi: 10.1016/j.cmet.2007.10.013. [DOI] [PubMed] [Google Scholar]
- 22.Lalia AZ, Dasari S, Johnson ML, Robinson MM, Konopka AR, Distelmaier K, Port JD, Glavin MT, Esponda RR, Nair KS, Lanza IR. Predictors of whole-body insulin sensitivity across ages and adiposity in adult humans. J Clin Endocrinol Metab 101: 626–634, 2016. doi: 10.1210/jc.2015-2892. [DOI] [PMC free article] [PubMed] [Google Scholar]
- 23.Lanza IR, Blachnio-Zabielska A, Johnson ML, Schimke JM, Jakaitis DR, Lebrasseur NK, Jensen MD, Sreekumaran Nair K, Zabielski P. Influence of fish oil on skeletal muscle mitochondrial energetics and lipid metabolites during high-fat diet. Am J Physiol Endocrinol Metab 304: E1391–E1403, 2013. doi: 10.1152/ajpendo.00584.2012. [DOI] [PMC free article] [PubMed] [Google Scholar]
- 24.Lanza IR, Nair KS. Functional assessment of isolated mitochondria in vitro. Methods Enzymol 457: 349–372, 2009. doi: 10.1016/S0076-6879(09)05020-4. [DOI] [PMC free article] [PubMed] [Google Scholar]
- 25.McGuinness OP, Ayala JE, Laughlin MR, Wasserman DH. NIH experiment in centralized mouse phenotyping: the Vanderbilt experience and recommendations for evaluating glucose homeostasis in the mouse. Am J Physiol Endocrinol Metab 297: E849–E855, 2009. doi: 10.1152/ajpendo.90996.2008. [DOI] [PMC free article] [PubMed] [Google Scholar]
- 26.Miller BF, Robinson MM, Bruss MD, Hellerstein M, Hamilton KL. A comprehensive assessment of mitochondrial protein synthesis and cellular proliferation with age and caloric restriction. Aging Cell 11: 150–161, 2012. doi: 10.1111/j.1474-9726.2011.00769.x. [DOI] [PMC free article] [PubMed] [Google Scholar]
- 27.Miller BF, Wolff CA, Peelor FF III, Shipman PD, Hamilton KL. Modeling the contribution of individual proteins to mixed skeletal muscle protein synthetic rates over increasing periods of label incorporation. J Appl Physiol (1985) 118: 655–661, 2015. doi: 10.1152/japplphysiol.00987.2014. [DOI] [PMC free article] [PubMed] [Google Scholar]
- 28.Mizushima N, Yoshimori T. How to interpret LC3 immunoblotting. Autophagy 3: 542–545, 2007. doi: 10.4161/auto.4600. [DOI] [PubMed] [Google Scholar]
- 29.Mogensen M, Sahlin K, Fernström M, Glintborg D, Vind BF, Beck-Nielsen H, Højlund K. Mitochondrial respiration is decreased in skeletal muscle of patients with type 2 diabetes. Diabetes 56: 1592–1599, 2007. doi: 10.2337/db06-0981. [DOI] [PubMed] [Google Scholar]
- 30.Mootha VK, Lindgren CM, Eriksson KF, Subramanian A, Sihag S, Lehar J, Puigserver P, Carlsson E, Ridderstråle M, Laurila E, Houstis N, Daly MJ, Patterson N, Mesirov JP, Golub TR, Tamayo P, Spiegelman B, Lander ES, Hirschhorn JN, Altshuler D, Groop LC. PGC-1alpha-responsive genes involved in oxidative phosphorylation are coordinately downregulated in human diabetes. Nat Genet 34: 267–273, 2003. doi: 10.1038/ng1180. [DOI] [PubMed] [Google Scholar]
- 31.Morrow RM, Picard M, Derbeneva O, Leipzig J, McManus MJ, Gouspillou G, Barbat-Artigas S, Dos Santos C, Hepple RT, Murdock DG, Wallace DC. Mitochondrial energy deficiency leads to hyperproliferation of skeletal muscle mitochondria and enhanced insulin sensitivity. Proc Natl Acad Sci USA 114: 2705–2710, 2017. doi: 10.1073/pnas.1700997114. [DOI] [PMC free article] [PubMed] [Google Scholar]
- 32.Nilsson MI, Dobson JP, Greene NP, Wiggs MP, Shimkus KL, Wudeck EV, Davis AR, Laureano ML, Fluckey JD. Abnormal protein turnover and anabolic resistance to exercise in sarcopenic obesity. FASEB J 27: 3905–3916, 2013. doi: 10.1096/fj.12-224006. [DOI] [PubMed] [Google Scholar]
- 33.Nilsson MI, Greene NP, Dobson JP, Wiggs MP, Gasier HG, Macias BR, Shimkus KL, Fluckey JD. Insulin resistance syndrome blunts the mitochondrial anabolic response following resistance exercise. Am J Physiol Endocrinol Metab 299: E466–E474, 2010. doi: 10.1152/ajpendo.00118.2010. [DOI] [PubMed] [Google Scholar]
- 34.Pereira S, Marliss EB, Morais JA, Chevalier S, Gougeon R. Insulin resistance of protein metabolism in type 2 diabetes. Diabetes 57: 56–63, 2008. doi: 10.2337/db07-0887. [DOI] [PubMed] [Google Scholar]
- 35.Petersen KF, Dufour S, Befroy D, Garcia R, Shulman GI. Impaired mitochondrial activity in the insulin-resistant offspring of patients with type 2 diabetes. N Engl J Med 350: 664–671, 2004. doi: 10.1056/NEJMoa031314. [DOI] [PMC free article] [PubMed] [Google Scholar]
- 36.Ritov VB, Menshikova EV, He J, Ferrell RE, Goodpaster BH, Kelley DE. Deficiency of subsarcolemmal mitochondria in obesity and type 2 diabetes. Diabetes 54: 8–14, 2005. doi: 10.2337/diabetes.54.1.8. [DOI] [PubMed] [Google Scholar]
- 37.Robinson MM, Dasari S, Karakelides H, Bergen HR III, Nair KS. Release of skeletal muscle peptide fragments identifies individual proteins degraded during insulin deprivation in type 1 diabetic humans and mice. Am J Physiol Endocrinol Metab 311: E628–E637, 2016. doi: 10.1152/ajpendo.00175.2016. [DOI] [PMC free article] [PubMed] [Google Scholar]
- 38.Robinson MM, Soop M, Sohn TS, Morse DM, Schimke JM, Klaus KA, Nair KS. High insulin combined with essential amino acids stimulates skeletal muscle mitochondrial protein synthesis while decreasing insulin sensitivity in healthy humans. J Clin Endocrinol Metab 99: E2574–E2583, 2014. doi: 10.1210/jc.2014-2736. [DOI] [PMC free article] [PubMed] [Google Scholar]
- 39.Robinson MM, Turner SM, Hellerstein MK, Hamilton KL, Miller BF. Long-term synthesis rates of skeletal muscle DNA and protein are higher during aerobic training in older humans than in sedentary young subjects but are not altered by protein supplementation. FASEB J 25: 3240–3249, 2011. doi: 10.1096/fj.11-186437. [DOI] [PMC free article] [PubMed] [Google Scholar]
- 40.Simoneau JA, Kelley DE. Altered glycolytic and oxidative capacities of skeletal muscle contribute to insulin resistance in NIDDM. J Appl Physiol (1985) 83: 166–171, 1997. [DOI] [PubMed] [Google Scholar]
- 41.Staten MA, Matthews DE, Bier DM. Leucine metabolism in type II diabetes mellitus. Diabetes 35: 1249–1253, 1986. doi: 10.2337/diab.35.11.1249. [DOI] [PubMed] [Google Scholar]
- 42.Storgaard H, Jensen CB, Björnholm M, Song XM, Madsbad S, Zierath JR, Vaag AA. Dissociation between fat-induced in vivo insulin resistance and proximal insulin signaling in skeletal muscle in men at risk for type 2 diabetes. J Clin Endocrinol Metab 89: 1301–1311, 2004. doi: 10.1210/jc.2003-031243. [DOI] [PubMed] [Google Scholar]
- 43.Takada S, Hirabayashi K, Kinugawa S, Yokota T, Matsushima S, Suga T, Kadoguchi T, Fukushima A, Homma T, Mizushima W, Masaki Y, Furihata T, Katsuyama R, Okita K, Tsutsui H. Pioglitazone ameliorates the lowered exercise capacity and impaired mitochondrial function of the skeletal muscle in type 2 diabetic mice. Eur J Pharmacol 740: 690–696, 2014. doi: 10.1016/j.ejphar.2014.06.008. [DOI] [PubMed] [Google Scholar]
- 44.Tschöp MH, Speakman JR, Arch JR, Auwerx J, Brüning JC, Chan L, Eckel RH, Farese RV Jr, Galgani JE, Hambly C, Herman MA, Horvath TL, Kahn BB, Kozma SC, Maratos-Flier E, Müller TD, Münzberg H, Pfluger PT, Plum L, Reitman ML, Rahmouni K, Shulman GI, Thomas G, Kahn CR, Ravussin E. A guide to analysis of mouse energy metabolism. Nat Methods 9: 57–63, 2011. doi: 10.1038/nmeth.1806. [DOI] [PMC free article] [PubMed] [Google Scholar]
- 45.Turner N, Bruce CR, Beale SM, Hoehn KL, So T, Rolph MS, Cooney GJ. Excess lipid availability increases mitochondrial fatty acid oxidative capacity in muscle: evidence against a role for reduced fatty acid oxidation in lipid-induced insulin resistance in rodents. Diabetes 56: 2085–2092, 2007. doi: 10.2337/db07-0093. [DOI] [PubMed] [Google Scholar]
- 46.Welle S, Nair KS. Failure of glyburide and insulin treatment to decrease leucine flux in obese type II diabetic patients. Int J Obes 14: 701–710, 1990. [PubMed] [Google Scholar]
- 48.Wilkinson SB, Phillips SM, Atherton PJ, Patel R, Yarasheski KE, Tarnopolsky MA, Rennie MJ. Differential effects of resistance and endurance exercise in the fed state on signalling molecule phosphorylation and protein synthesis in human muscle. J Physiol 586: 3701–3717, 2008. doi: 10.1113/jphysiol.2008.153916. [DOI] [PMC free article] [PubMed] [Google Scholar]
- 50.Zhang C, Cuervo AM. Restoration of chaperone-mediated autophagy in aging liver improves cellular maintenance and hepatic function. Nat Med 14: 959–965, 2008. doi: 10.1038/nm.1851. [DOI] [PMC free article] [PubMed] [Google Scholar]