

Abstract
Male hypogonadism results in changes in body composition characterized by increases in fat mass. Resident immune cells influence energy metabolism in adipose tissue and could promote increased adiposity through paracrine effects. We hypothesized that manipulation of circulating sex steroid levels in healthy men would alter adipose tissue immune cell populations. Subjects (n = 44 men, 19–55 yr of age) received 4 wk of treatment with the gonadotropin-releasing hormone receptor antagonist acyline with daily administration of 1) placebo gel, 2) 1.25 g testosterone gel (1.62%), 3) 5 g testosterone gel, or 4) 5 g testosterone gel with an aromatase inhibitor. Subcutaneous adipose tissue biopsies were performed at baseline and end-of-treatment, and adipose tissue immune cells, gene expression, and intra-adipose estrogen levels were quantified. Change in serum total testosterone level correlated inversely with change in the number of CD3+ (β = −0.36, P = 0.04), CD4+ (β = −0.34, P = 0.04), and CD8+ (β = −0.33, P = 0.05) T cells within adipose tissue. Change in serum 17β-estradiol level correlated inversely with change in the number of adipose tissue macrophages (ATMs) (β = −0.34, P = 0.05). A negative association also was found between change in serum testosterone and change in CD11c+ ATMs (β = −0.41, P = 0.01). Overall, sex steroid deprivation was associated with increases in adipose tissue T cells and ATMs. No associations were found between changes in serum sex steroid levels and changes in adipose tissue gene expression. Circulating sex steroid levels may regulate adipose tissue immune cell populations. These exploratory findings highlight a possible novel mechanism that could contribute to increased metabolic risk in hypogonadal men.
Keywords: obesity, estrogen, testosterone, adipose tissue, immune cells
low androgen states in men are strongly associated with metabolic dysregulation. Hypogonadotropic hypogonadism is evident in 30–50% of men with obesity and type 2 diabetes mellitus (T2DM) (44, 61), and androgen deficiency may be both a cause and effect of these metabolic disorders (14, 40). A causal role is supported by observations that testosterone replacement therapy reduces fat mass in hypogonadal men (4, 19, 74, 81), whereas men undergoing androgen deprivation therapy (ADT) for treatment of prostate cancer exhibit greater adiposity with associated increased risks of insulin resistance and T2DM (8, 36). These seminal papers showing reductions in fat mass consequent to testosterone therapy have been reproduced in more recent studies, including cohorts of men with T2DM, severe obesity, and older age (7, 28, 29, 33, 42). Exogenous testosterone further was shown to reduce adiposity in a large meta-analysis that included over 4,500 subjects (13). Similarly, in experimental models of sex steroid deprivation in healthy men, increases in fat mass have been observed within 4–16 wk of treatment (12, 27, 58).
Furthermore, some although not all clinical studies have demonstrated improvements in insulin sensitivity and even mortality consequent to exogenous testosterone treatment in hypogonadal men with T2DM and obesity (20, 33, 34, 38, 41, 56). Interestingly, elevated serum levels of C-reactive protein (CRP) have been observed in hypogonadal men with T2DM (5), and testosterone treatment has led to reductions in serum CRP and other circulating markers of immune system activation, although this has been an inconsistent finding (20, 38). These findings have led to substantial interest in use of testosterone therapy as an adjunctive treatment strategy in hypogonadal men with obesity and T2DM (40).
The mechanisms by which testosterone regulates body composition in men remain poorly understood. Androgen deprivation could lead to increased adiposity indirectly, through changes in appetite, mood, or behavior that contribute to overall positive energy balance (3, 68, 89). Sex steroids also have been shown to influence appetite regulation in males, as orchiectomy in mice leads to reduced meal frequency that is reversed with exogenous testosterone therapy (1). Reductions in food intake due to androgen deficiency in male mice further have been observed on both regular chow and high-fat diets (24). In male mice, colocalization of the androgen receptor (AR) and leptin receptor has been demonstrated in hypothalamic neurons, and androgen signaling has been shown to modulate central leptin sensitivity (39). Testosterone also could mediate direct changes within adipose tissue that suppress adiposity at least in part independently of overall energy balance. Androgens have been shown to regulate adipocyte differentiation, lipolysis, fatty acid uptake, and adipokine production (21, 22, 32, 50, 64); thus androgen withdrawal could promote adiposity by directly altering energy metabolism within adipocytes, resulting in lipid accumulation and accrual of fat mass. Notably, recent clinical data suggest that testosterone regulation of adiposity in men is partially mediated through its aromatization to estradiol (12, 27), with parallel findings in an animal model of androgen deficiency (37). Estradiol also has been shown to modulate lipolysis, lipogenesis, cellular differentiation, mitochondrial biogenesis, and insulin sensitivity in adipocytes (10, 22, 48, 51) and, accordingly, could regulate fat mass through direct effects within adipose tissue.
In addition to direct effects on adipocytes, sex steroids could influence fat mass through effects on other resident cell types within adipose tissue including immune cell populations. Within the past decade, a critical role for adipose tissue immune cells in the regulation of intra-adipose energy metabolism has been recognized. Resident immune cells are present within adipose tissue and undergo dynamic changes in both number and phenotype during states of both positive and negative energy balance with associated adipose tissue remodeling (31, 57, 62, 76, 84). Animal models demonstrate that adipose tissue immune cells exhibit highly heterogeneous phenotypes and perform myriad functions, particularly in response to perturbations in tissue homeostasis (43, 49, 69, 78, 83, 88). Thus through the secretion of paracrine effectors including growth and angiogenic factors, matrix metalloproteinases, and cytokines, these tissue immune cells are critical mediators of lipid and glucose metabolism, adipocyte differentiation, and tissue remodeling (23, 47, 52, 54, 55, 75, 76, 86, 88). Both myeloid and lymphoid immune cells are present within adipose tissue and undergo distinct phenotypic changes with the development of obesity (54, 60, 87). These cells express ARs and estrogen receptors, and immunomodulatory roles of both testosterone and estradiol have been extensively described, as illustrated by demonstrated effects on cellular proliferation and differentiation, cytokine generation, chemotaxis, and cell survival (45, 79). Estrogens and androgens therefore could regulate fat mass in part through influencing the phenotype and associated paracrine functions of resident immune cells within adipose tissue.
Thus sex steroids could regulate body composition through direct effects within adipose tissue, but the respective effects of testosterone and estradiol deprivation on adipose tissue biology have not been examined in men. We performed a randomized, double-blind clinical study to determine the impact of short-term sex steroid manipulation on insulin sensitivity and body composition in healthy men. In an exploratory substudy, subcutaneous adipose tissue biopsies were performed to assess changes in adipose tissue biology that could lend new mechanistic insight into sex steroid-mediated regulation of adiposity in men.
MATERIALS AND METHODS
Study design.
Healthy men 19–55 yr of age with normal baseline serum testosterone levels were enrolled as previously described (12). All study procedures received approval from the University of Washington Institutional Review Board, and written informed consent was obtained from all subjects before performance of any procedures. The study was registered at ClinicalTrials.gov (ID NCT01686828).
Exclusion criteria included a body mass index (BMI) >33 kg/m2, uncontrolled hypertension, history of diabetes, and current or recent use of testosterone or glucocorticoids.
All subjects received the gonadotropin-releasing hormone receptor antagonist acyline (300 μg/kg body wt) by subcutaneous injection every 2 wk for a 4-wk drug treatment period. In a double-blinded fashion, subjects were randomly assigned in a block size of four to concurrently receive daily treatment with 1) placebo transdermal gel and placebo tablets (Castrate group), 2) low-dose testosterone gel (1.25 g of 1.62% gel; AndroGel) and placebo tablets (Low T/E group), 3) full replacement dose testosterone gel (5 g of 1.62% gel) and placebo tablets (Normal T/E group), or 4) full replacement dose testosterone gel and the aromatase inhibitor letrozole (Apotex) (Normal T/Low E group). Abdominal subcutaneous adipose tissue samples were collected at baseline and at the end of the 4-wk treatment period. Tissue samples were obtained through needle aspiration biopsy using previously published methods (9). The baseline biopsy site was recorded for each subject, and the end-of-treatment biopsy was performed on the contralateral side of the abdomen.
Adipose tissue collection and processing.
Adipose tissue samples were washed with sterile PBS. A portion of each sample was flash frozen on dry ice for gene expression analyses. The remainder was placed in a tube with 20 ml PBS with 1% BSA and placed on ice for 30–60 min. Adipose tissue digestion and flow cytometry were performed as previously described (35), with a 1-h incubation at 37°C with collagenase I (final concentration 1.0 mg/ml; Worthington, Lakewood, NJ) in PBS with 50 U/ml DNAse I. The digestate was passed through a 180-μM filter and then separated by centrifugation to separate the adipocytes from the stromovascular cells (SVCs). Contaminating red blood cells within the SVC fraction were then lysed.
Immunophenotyping of adipose tissue immune cells.
SVCs were labeled with directly conjugated primary antibodies to quantify distinct leukocyte populations. CD45 was used as a pan-leukocyte marker. CD15 and CD16 were used to identify neutrophils. CD1c positively identifies dendritic cells, and CD14 and CD206 were used to identify ATMs among the CD15−CD1c− cells. ATM subsets were further characterized using CD11c, CD36, CD40, ABCA1, and CD163 antibodies. All antibodies were purchased from either BD Parmengen (San Jose, CA) or Biolegend (San Diego, CA).
Adipose tissue RNA isolation and gene expression analysis.
As previously described in detail (46), total RNA was extracted from adipose tissue using RNeasy mini kits (Qiagen, Hilden, Germany) and quantified using the RiboGreen RNA Quantitation Kit (Thermo Fisher Scientific, Waltham, MA). cDNA synthesis employed 1.5 μg of total RNA using the High-Capacity cDNA Reverse Transcription Kit (Applied Biosystems, Foster City, CA) followed by PCR on an Mx3005P Multiplex QPCR System (Stratagene, Cedar Creek, TX) using predesigned ABI TaqMan Gene Expression Assays. By including a standard curve on each plate, Ct values were converted to copy numbers of all target genes. Data were normalized to the geometric mean of two housekeeping genes (11, 80) (phosphoglycerate kinase and 18s rRNA) and expressed as target gene copy number per nanograms of RNA. Target genes included lipoprotein lipase, hormone-sensitive lipase, peroxisome proliferator-activated receptor-γ, estrogen receptor-α, AR, aromatase, GLUT4, leptin, adiponectin, IL-10, IL-1β, IL-6, TGF-β, and TNF-α.
Measurement of adipose tissue estrogens.
Serum and adipose tissue samples were extracted and subjected to ultraperformance liquid chromatography tandem mass spectrometry (UPLC/MS-MS) analysis for measurement of estrogens using modified method as described previously (30). UPLC analyses were carried out using a Waters Acquity UPLC system connected with the high performance Xevo-TQ mass spectrometer. Analytical separations on the UPLC system were conducted using an Acquity UPLC BEH C18 1.7-µm column (2 × 50 mm) at a flow rate of 0.2 ml/min. The elutions from the UPLC column were introduced to the Xevo-TQ mass spectrometer. All MS experiments were performed by using electrospray ionization (ESI) in negative ion mode, with an ESI-MS capillary voltage of 2.5 kV, an extractor cone voltage of 3 V, and a detector voltage of 650 V. The following MS conditions were used: desolvation gas at 600 l/h, desolvation temperature at 350°C, and source temperature of 150°. Pure standards of estrogens were used to optimize the UPLC-MS/MS conditions before analysis and performance of calibration curves. Elutions from the UPLC column were analyzed in the MRM mode, and the resulting data were processed by using TargetLynx 4.1 software (Waters). Reference standards were run before the first sample, in the middle of run, and after the last sample to prevent errors due to matrix effect and day-to-day instrument variations.
Statistical analyses.
For all adipose tissue end points, a time-by-group interaction was examined through repeated-measures ANOVA (RM-ANOVA). Nonnormally distributed data were log transformed, and P < 0.05 was considered statistically significant. In exploratory analyses, correlations between changes in adipose tissue end points and changes in serum sex steroid levels, fat mass, and insulin sensitivity (as quantified by Matsuda index) were analyzed through stepwise linear regression analyses. For all regression models, changes in serum testosterone and 17β-estradiol levels were included as independent, scale variables (1 = 1 ng/ml change in total testosterone or 10 pg/ml change in 17β-estradiol). Regression analyses were repeated with inclusion of changes in fat mass and insulin sensitivity as quantified by Matsuda index. Nonnormally distributed variables were log transformed after addition of an integer constant to eliminate negative values. Both statistically significant determinants (P < 0.05) and determinants evident as statistical trends (P < 0.1) were included in the final models, and standardized β-coefficients are shown. All statistical analyses were performed with GraphPad Prism version 5 (GraphPad, La Jolla, CA) and SPSS Statistics 23 (IBM, Armonk, NY).
RESULTS
Subjects.
Subject enrollment and baseline characteristics have been reported previously (12). Of the 45 subjects included in the primary analyses, 44 had available adipose tissue from both baseline and end-of-treatment biopsies. One subject declined the biopsy at the follow up. Gene expression analyses were performed for all 44 subjects. Sufficient adipose tissue from the biopsies for flow cytometry was obtained for 42 subjects. However, technical issues with the flow cytometer led to exclusion of samples with unreliable results before performance of any statistical analyses from several participants, yielding a total of 37 subjects included in analyses for myeloid cells and 36 subjects included for analyses of lymphoid cells. Additional frozen adipose tissue samples from both baseline and follow-up study visits were available from 31 subjects, enabling measurements of intra-adipose estrogen concentrations. No serious adverse events occurred in association with adipose tissue biopsy. The most common adverse events were bruising and mild pain at the biopsy site.
Serum hormone levels and adipose tissue immune cell populations.
On-treatment serum sex steroid levels were achieved as intended for all four treatment groups (Table 1). Although serum total testosterone levels were not overtly low among most subjects in the Low T/E group, the mean serum testosterone level was at the lower end of the normal range at week 2 and remained below baseline at the week 4 visit. Therefore, the treatment regimen appeared to confer the desired decrement in testosterone exposure during the drug treatment period for subjects in this group.
Table 1.
Serum sex steroid levels
| Castrate (n = 10) |
Low T/E (n = 10) |
Normal T/E (n = 11) |
Normal T/Low E (n = 13) |
||||||||||
|---|---|---|---|---|---|---|---|---|---|---|---|---|---|
| Baseline | Week 2 | Week 4 | Baseline | Week 2 | Week 4 | Baseline | Week 2 | Week 4 | Baseline | Week 2 | Week 4 | P Value | |
| Serum total testosterone, ng/ml | 4.9 (1.5) | 1.0 (1.5) | 0.2 (0.2) | 5.3 (1.6) | 3.0 (1.2) | 4.1 (2.1) | 4.9 (1.4) | 5.6 (3.9) | 7.2 (4.6) | 6.1 (1.8) | 5.2 (2.7) | 7.4 (3.3) | <0.0001 |
| Serum 17β-estradiol, pg/ml | 24.4 (6.8) | 6.7 (4.7) | 5.1 (2.2) | 29.7 (12.5) | 13.8 (5.7) | 14.6 (10.0) | 25.4 (7.4) | 23.0 (17.2) | 29.8 (18.5) | 26.4 (6.4) | 1.6 (1.5) | 3.7 (1.8) | <0.0001 |
Data are shown as means (SD). Baseline and on-treatment serum sex steroid levels for the 44 subjects included in the analyses. Castrate: placebo transdermal gel and placebo tablets (Castrate group); Low T/E: low-dose testosterone gel (1.25 g of 1.62% gel; AndroGel) and placebo tablets; Normal T/E: full replacement dose testosterone gel (5 g of 1.62% gel) and placebo tablets; Normal T/Low E: full replacement dose testosterone gel and the aromatase inhibitor letrozole (Apotex). P values represent time-by-group interactions from repeated-measures (RM)-ANOVA comparing all treatment arms at baseline and week 4.
As previously reported, a time-by-group interaction was observed for change in fat mass, with both testosterone and estradiol deprivation contributing to increases in adiposity over the 4-wk treatment period (12). Thus subjects in the Castrate, Low T/E, and Normal T/Low E groups all exhibited increases in fat mass (mean changes of +1.1 ± 0.8, 0.7 ± 0.8, and 0.5 ± 0.8 kg, respectively), whereas no increase in fat mass was evident in the Normal T/E group (mean change of −0.4 ± 1.0 kg). When subjects were grouped on the basis of drug treatment assignment, no significant time-by-group interactions were seen for any of the quantified lymphocyte or myeloid adipose tissue immune cell populations in overall RM-ANOVAs with the exception of CD40+ ATMs, although an interaction was evident only when cell number was expressed as a percentage of total ATMs (Tables 2 and 3) Across all subjects, on-treatment serum testosterone levels were evident as a near continuum spanning medical castration to supraphysiological levels (Fig. 1A), and a similar spectrum of on-treatment levels was achieved for serum 17β-estradiol (Fig. 1B). To increase statistical power for additional, exploratory analyses, all subjects were considered as a single cohort, and correlations were examined between changes in serum sex steroid levels and changes in adipose tissue immune cells through linear regression.
Table 2.
Adipose tissue lymphocyte populations
| Castrate (n = 9) |
Low T/E (n = 9) |
Normal T/E (n = 8) |
Normal T/Low E (n = 10) |
||||||
|---|---|---|---|---|---|---|---|---|---|
| Baseline | Week 4 | Baseline | Week 4 | Baseline | Week 4 | Baseline | Week 4 | P Value (Overall RM-ANOVA) | |
| T cells | |||||||||
| CD3+, cells/g AT | 155 (103) | 348 (288) | 93 (57) | 248 (236) | 138 (109) | 174 (125) | 203 (175) | 460 (643) | 0.74 |
| CD3+, %CD45+ cells | 10.2 (3.1) | 13.8 (5.3) | 8.6 (3.6) | 11.2 (5.0) | 10.9 (7.9) | 9.6 (1.8) | 10.4 (5.0) | 18.6 (15.6) | 0.88 |
| T-cell subsets | |||||||||
| Helper T cells | |||||||||
| CD4+, cells/g AT | 72 (45) | 164 (142) | 38 (20) | 119 (116) | 65 (52) | 89 (77) | 81 (56) | 233 (323) | 0.71 |
| CD4+, %CD3+ cells | 48.0 (8.0) | 47.4 (11.1) | 42.9 (8.3) | 47.9 (11.4) | 48.6 (10.4) | 47.3 (13.3) | 45.5 (12.2) | 49.9 (12.1) | 0.48 |
| Cytotoxic T cells | |||||||||
| CD8+, cells/g AT | 61 (46) | 126 (104) | 42 (33) | 101 (96) | 47 (34) | 58 (32) | 89 (107) | 174 (251) | 0.75 |
| CD8+, %CD3+ cells | 38.2 (10.5) | 36.7 (7.0) | 40.5 (11.2) | 40.7 (10.4) | 35.7 (6.7) | 36.6 (7.5) | 38.3 (12.1) | 36.3 (12.9) | 0.83 |
| B cells* | |||||||||
| CD20+, cells/g AT | 24 (17) | 38 (20) | 16 (12) | 32 (30) | 20 (17) | 30 (22) | 26 (29) | 40 (45) | 0.98 |
| CD20+, %CD45+ cells | 1.7 (1.1) | 1.4 (0.5) | 1.1 (0.6) | 1.8 (1.5) | 1.2 (0.8) | 1.3 (0.7) | 1.4 (1.1) | 1.8 (1.4) | 0.78 |
Data are shown as means (SD), and with cell numbers are presented in thousands. Baseline and end-of-treatment lymphocyte populations in adipose tissue (AT). P values represent time-by-group interactions from RM-ANOVA comparing all treatment arms at baseline and week 4.
B cells were quantified with myeloid cell populations, so subject number per group applies to T cells only; subject numbers from Table 3 apply to B cells.
Table 3.
Adipose tissue myeloid cell populations
| Castrate (n = 7) |
Low T/E (n = 9) |
Normal T/E (n = 9) |
Normal T/Low E (n = 12) |
||||||
|---|---|---|---|---|---|---|---|---|---|
| Baseline | Week 4 | Baseline | Week 4 | Baseline | Week 4 | Baseline | Week 4 | P Value (Overall RM-ANOVA) | |
| ATMs | |||||||||
| CD14+206+, cells/g AT | 30 (18) | 54 (31) | 47 (27) | 56 (49) | 47 (37) | 36 (21) | 54 (41) | 66 (63) | 0.65 |
| CD14+206+, %CD45+ cells | 1.9 (1.1) | 2.4 (1.8) | 3.8 (2.3) | 3.9 (4.0) | 3.0 (1.7) | 2.3 (2.2) | 3.4 (2.1) | 3.1 (1.4) | 0.57 |
| ATM subsets | |||||||||
| CD11c+, cells/g AT | 7 (5) | 15 (10) | 10 (11) | 15 (18) | 12 (13) | 10 (7) | 10 (7) | 15 (26) | 0.59 |
| CD11c+, %ATMs | 22.3 (12.3) | 28.7 (11.5) | 21.8 (19.7) | 25.9 (23.9) | 28.6 (18.9) | 29.6 (17.4) | 21.8 (16.6) | 21.4 (17.7) | 0.67 |
| ABCA1+, cells/g AT | 8 (16) | 16 (25) | 11 (17) | 12 (26) | 8 (14) | 5 (9) | 3 (7) | 12 (25) | 0.73 |
| ABCA1+, %ATMs | 16.6 (31.6) | 25.2 (38.0) | 24.9 (41.1) | 32.5 (45.4) | 20.2 (33.1) | 14.7 (28.9) | 9.3 (21.8) | 24.8 (41.2) | 0.89 |
| CD36+, cells/g AT | 11 (9) | 15 (9) | 22 (13) | 15 (13) | 21 (32) | 13 (11) | 17 (15) | 19 (15) | 0.34 |
| CD36+, %ATMs | 37.0 (15.4) | 33.0 (19.8) | 50.0 (23.9) | 30.1 (17.6) | 41.9 (28.2) | 33.7 (22.0) | 33.7 (22.4) | 32.9 (19.7) | 0.25 |
| CD40+, cells/g AT | 1 (0.7) | 2 (1) | 2 (1) | 2 (1) | 2 (2) | 3 (5) | 2 (1) | 3 (2) | 0.18 |
| CD40+, %ATMs | 3.4 (1.6) | 4.0 (0.8) | 3.7 (1.1) | 2.8 (1.9) | 3.7 (1.4) | 5.6 (5.1) | 2.9 (1.2) | 4.4 (3.9) | 0.03* |
| CD163+, cells/g AT | 9 (6) | 21 (20) | 15 (11) | 34 (44) | 16 (17) | 13 (10) | 24 (24) | 23 (20) | 0.54 |
| CD163+, %ATMs | 48.7 (36.6) | 48.7 (34.1) | 40.1 (31.3) | 45.7 (35.0) | 39.9 (35.7) | 41.8 (31.5) | 44.2 (36.2) | 45.2 (33.4) | 0.45 |
| Neutrophils | |||||||||
| CD15+16+, cells/g AT | 740 (208) | 1,350 (1,150) | 688 (467) | 1,000 (730) | 1,000 (588) | 1,500 (1,470) | 791 (637) | 887 (782) | 0.84 |
| CD15+16+, %CD45+ cells | 52.4 (7.8) | 50.1 (18.4) | 46.7 (12.0) | 47.7 (19.3) | 57.1 (9.9) | 54.0 (22.5) | 38.4 (16.3) | 35.4 (21.7) | 0.97 |
| NK cells | |||||||||
| CD16+, cells/g AT | 38 (19) | 40 (20) | 34 (23) | 41 (15) | 28 (13) | 34 (21) | 36 (21) | 42 (21) | 0.93 |
| CD16+, %CD45+ cells | 2.7 (1.0) | 1.7 (0.5) | 2.3 (1.2) | 2.2 (1.6) | 1.8 (0.8) | 2.1 (1.8) | 2.3 (1.2) | 2.6 (1.9) | 0.61 |
| Dendritic cells | |||||||||
| CD1c+, cells/g AT | 13 (9) | 36 (22) | 11 (12) | 15 (10) | 9 (7) | 15 (10) | 10 (7) | 27 (27) | 0.87 |
| CD1c+, %CD45+ cells | 1.0 (0.6) | 1.6 (1.4) | 0.7 (0.7) | 0.9 (0.8) | 0.6 (0.7) | 0.8 (0.7) | 0.8 (0.6) | 1.4 (0.9) | 0.57 |
Data are shown as means (SD), and cell numbers are shown in thousands. Baseline and end-of-treatment myeloid cell populations in adipose tissue (AT). ATMs, adipose tissue macrophages. P values represent time-by-group interactions from RM-ANOVA comparing all treatment arms at baseline and week 4.
denotes statistical significance.
Fig. 1.
Changes in serum total testosterone (A) and 17β-estradiol (B) levels for all study subjects over the 4-wk treatment period. Dotted horizontal lines represent standard reference range; n = 44.
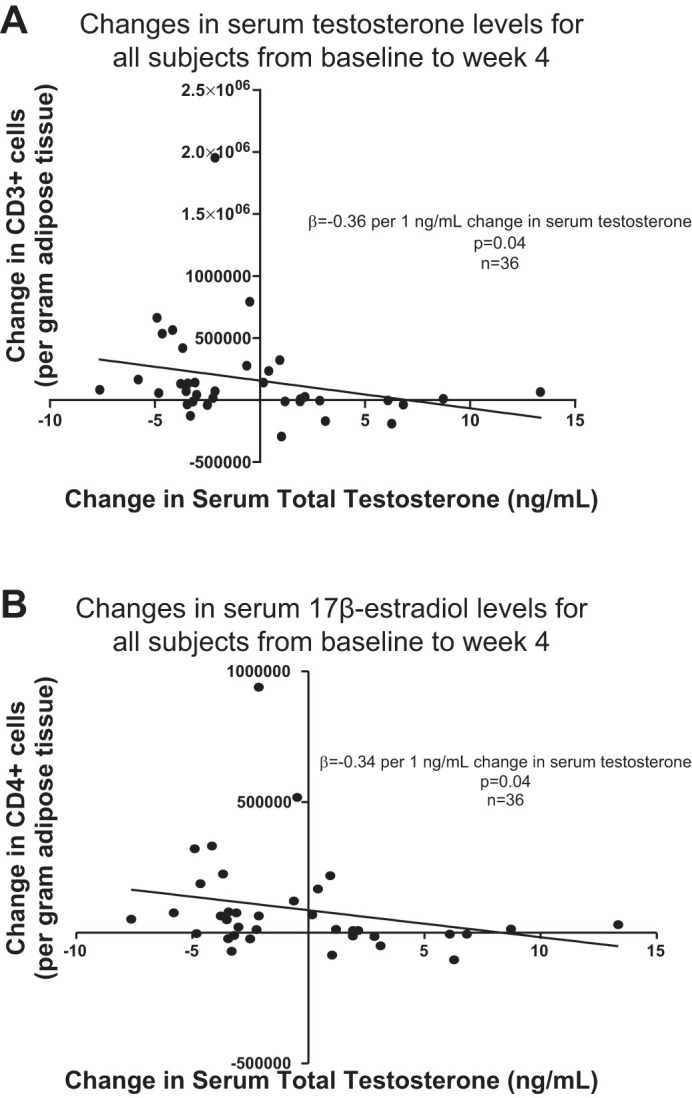
Despite the absence of a significant time-by-group interaction, the mean number of CD3+ T cells in adipose tissue appeared to increase in both treatment groups rendered testosterone deficient (Castrate and Low T/E), whereas mean CD3+ T-cell number remained stable in the Normal T/E group. This pattern was apparent whether CD3+ cells were quantified as an absolute cell number per gram of adipose tissue or a percentage of total CD45+ cells and, furthermore, was similar for both CD4+ and CD8+ T-cell subsets. Consistent with these observations, a significant, inverse association was evident between change in serum total testosterone level and change in the total number of adipose tissue CD4+ T cells (β = −0.34 per 1 ng/ml change in serum total testosterone, P = 0.04, Table 4 and Fig. 2B). Inclusion of changes in fat mass and Matsuda index in the regression model did not affect the association between change in serum testosterone level and change in CD4+ cell number. For both CD3+ and CD8+ T cells, changes in cell number also exhibited inverse correlations with change in serum testosterone level but only when change in fat mass also was included in the regression models (β = −0.36 per 1 ng/ml change in serum total testosterone, P = 0.04 for change in CD3+ T cells and β = −0.33 per 1 ng/ml change in serum total testosterone, P = 0.05 for change in CD8+ T cells, Fig. 2, A and C). Inverse associations also were found between changes in both CD3+ T cells and CD8+ T cells and change in fat mass (β = −0.31, P = 0.08 and β = −0.35, P = 0.04, respectively). When CD3+ T cells were quantified as a perecentage of total CD45+ cells, the change in CD3+ cells did not associate with changes in serum testosterone level or fat mass. Change in serum testosterone did not associate with change in the number of adipose tissue B cells nor were differences in changes in B-cell number evident among the treatment groups.
Table 4.
Correlations between changes in immune cell populations and changes in serum sex steroids, fat mass, and insulin sensitivity
| ΔSerum Total testosterone |
ΔSerum 17β-Estradiol |
ΔFat Mass |
ΔMatsuda Index |
|||||
|---|---|---|---|---|---|---|---|---|
| β-Coefficient | P value | β-Coefficient | P value | β-Coefficient | P value | β-Coefficient | P value | |
| ΔCD3+, cells/g AT | −0.36 | 0.04 | — | NS | −0.31 | 0.08 | — | NS |
| ΔCD4+, cells/g AT | −0.34 | 0.04 | — | NS | — | NS | — | NS |
| ΔCD8+, cells/g AT | −0.33 | 0.05 | — | NS | −0.35 | 0.04 | — | NS |
| ΔATMs, per g AT | — | NS | −0.34 | 0.05 | — | NS | — | NS |
| ΔCD11c+, cells/g AT | −0.41 | 0.01 | — | NS | — | NS | — | NS |
| ΔCD40+, cells/g AT | — | NS | — | NS | — | NS | 0.42 | 0.01 |
| ΔCD163+, cells/g AT | −0.36 | 0.03 | — | NS | — | NS | — | NS |
| ΔDendritic, cells/g AT | — | NS | — | NS | — | NS | 0.60 | <0.0001 |
Correlations as determined by multistep linear regression between changes in immune cell numbers in AT and changes in serum levels of total testosterone and 17β-estradiol, fat mass, and insulin sensitivity as quantified by Matsuda index. Standardized β-coefficients are shown. Only statistically significant correlations or those evident as statistical trends were kept in the regression models.
Fig. 2.

Significant, inverse associations were found between change in serum testosterone levels and changes in intra-adipose CD3+ (A), CD4+ (B), and CD8+ (C) T cells and CD11c+ adipose tissue macrophages (ATMs) (D).
No associations were found between change in serum 17β-estradiol level and changes in either T-cell or B-cell populations within adipose tissue. Change in Matsuda index similarly did not associate with changes in adipose tissue lymphocyte populations.
Among the myeloid cell populations, increases in the number of ATMs were apparent in all treatment groups except the Normal T/E (control) group (Table 3). Consistent with this finding, change in serum 17β-estradiol level showed a negative association with change in ATMs whether ATMs were quantified as cells per gram of adipose tissue (β = −0.34 per 10 pg/ml change in serum 17β-estradiol, P = 0.05, Fig. 3A) or perecentage of CD45+ cells (β = −0.42 per 10 pg/ml change in serum 17β-estradiol, P = 0.01, Fig. 3B). ATM subsets of CD11c+, ABCA1+, CD36+, CD40+, and CD163+ cells also were identified. Change in serum estradiol did not associate with changes in ATM subsets. No associations were found between change in serum estradiol level and changes in adipose tissue neutrophils or NK cells.
Fig. 3.
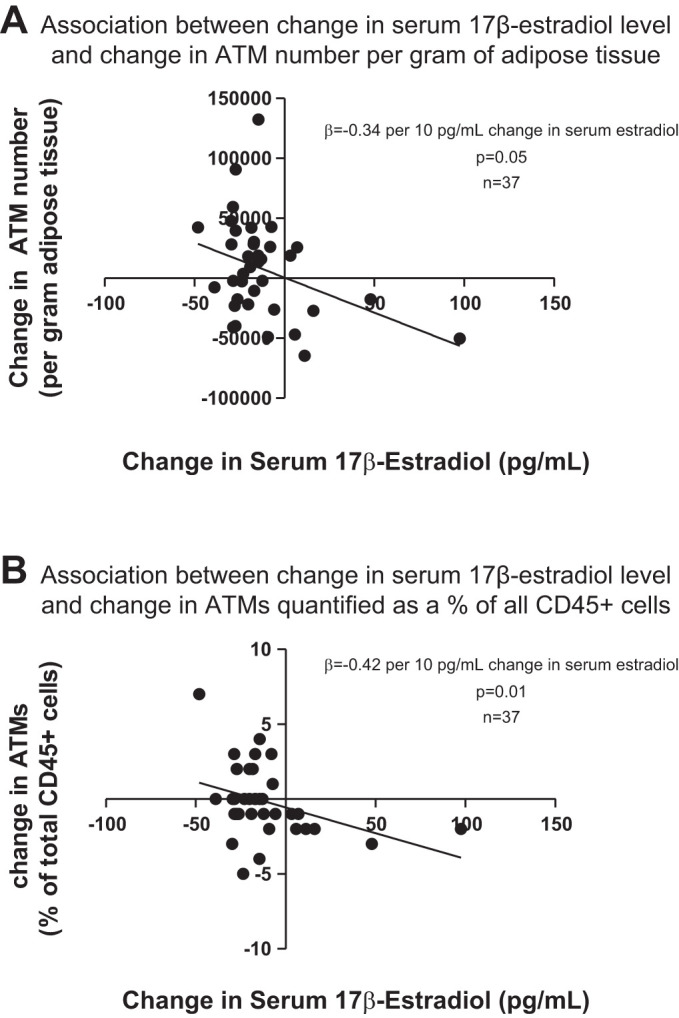
Change in serum 17β-estradiol level showed an inverse association with change in adipose tissue macrophages (ATMs), whether ATMs were quantified as cells per gram adipose tissue (A) or percentage of total CD45+ cells (B).
Change in serum testosterone did not associate with changes in total number of ATMs, neutrophils, or NK cells within adipose tissue. However, increases in CD11c+ ATMs were evident in both testosterone deficient groups (Castrate and Low T/E) whether quantified as cells per gram of adipose tissue or percentage of ATMs. Corroborating this observation, change in serum testosterone level correlated inversely with the change in CD11c+ ATM number (β = −0.41 per 1 ng/ml change in serum total testosterone, P = 0.01, Fig. 2D). This relationship was seen as a statistical trend when CD11c+ ATMs were quantified as a percentage of all ATMs (β = −0.28 per 1 ng/ml change in serum total testosterone, P = 0.099). Change in serum testosterone also showed a negative association with the change in CD163+ ATM cell number (β = −0.36 per 1 ng/ml change in serum total testosterone, P = 0.03).
No significant associations were found between changes in fat mass or Matsuda index and changes in total number of ATMs, neutrophils, or NK cells. Furthermore, inclusion of fat mass in the regression model did not attenuate the inverse association found between change in serum 17β-estradiol level and change in ATMs quantified either as a percentage of CD45+ cells (β = −0.45 per 10 pg/ml change in serum 17β-estradiol, P = 0.03) or as cells per gram of adipose tissue (β = −0.43 per 10 pg/ml change in serum 17β-estradiol, P = 0.04). Change in adipose tissue dendritic cells exhibited a positive association with change in Matsuda index (β = 0.60, P < 0.0001) but only when expressed as cells per gram of adipose tissue. Change in CD40+ ATM cell number also exhibited a strong, positive correlation with change in Matsuda index (β = 0.42, P = 0.009).
Our original study was powered for the primary end point of a difference in the change in insulin sensitivity between the Castrate and Normal T/E groups. Thus our power calculations indicated a target enrollment goal of 60 subjects to ensure that 48 subjects (n = 12 per group) would complete all study visits and study-related procedures. To determine statistical power for linear regression analyses of these secondary end points, post hoc power calculations were performed for each of the immune cell populations that exhibited a significant association with changes in serum sex steroid levels. Statistical power ranged from 37 to 67% for these linear regression analyses (Table 5).
Table 5.
Post hoc statistical power calculations for linear regression analyses
| Statistical Power | |
|---|---|
| ΔCD3+, cells/g AT | 37% |
| ΔCD4+, cells/g AT | 46% |
| ΔCD8+, cells/g AT | 46% |
| ΔATMs, per g AT | 67% |
| ΔCD11c+, cells/g AT | 56% |
Post hoc statistical power for linear regression analysis was calculated for each of the immune cell populations within AT that showed a significant association with changes in serum sex steroid levels.
Adipose tissue gene expression.
Whole tissue gene expression was measured with target genes representing sex steroid and energy metabolism, adipokines, and genes implicated in immune function (Table 6). When RM-ANOVA was performed based on treatment group assignment, no time-by-group interactions were found for any of the adipose tissue gene targets in overall RM-ANOVAs. Furthermore, no significant correlations were found between changes in gene expression and changes in serum sex steroid levels or fat mass. Change in Matsuda index showed a significant, negative association only with change in retinol-binding protein 4 (RBP4) mRNA expression (β = −0.34, P = 0.02). An inverse association between change in Matsuda index and change in hormone-sensitive lipase (LIPE) mRNA expression was seen as a statistical trend (β = −0.28, P = 0.06). A statistical trend also was evident for the association between change in fat mass and change in IL-6 (IL6) mRNA expression (β = −0.28, P = 0.07).
Table 6.
Adipose tissue gene expression
| Castrate (n = 10) |
Low T/E (n = 10) |
Normal T/E (n = 11) |
Normal T/Low E (n = 13) |
||||||
|---|---|---|---|---|---|---|---|---|---|
| Baseline | Week 4 | Baseline | Week 4 | Baseline | Week 4 | Baseline | Week 4 | P Value (Overall RM-ANOVA) | |
| Energy metabolism | |||||||||
| Lipoprotein lipase | 11,344 (4,361) | 7,493 (1,293) | 9,689 (3,238) | 8,224 (3,485) | 9,145 (2,625) | 7,885 (2,736) | 9,709 (2,810) | 8,320 (3,133) | 0.59 |
| Hormone-sensitive lipase | 43 (15) | 30 (12) | 49 (18) | 36 (20) | 58 (24) | 46 (18) | 48 (32) | 35 (18) | 0.99 |
| GLUT4 Retinol-binding protein 4 | 227 (167) | 170 (78) | 205 (71) | 180 (83) | 243 (165) | 215 (182) | 244 (99) | 218 (104) | |
| Retinol-binding protein-4 | 4,472 (2,246) | 3,228 (1,559) | 4,326 (1,592) | 3,831 (2,224) | 4,236 (932) | 3,269 (1,072) | 3,750 (1,064) | 2,735 (941) | 0.66 |
| Adipocyte differentiation and function | |||||||||
| PPARγ | 666 (325) | 559 (249) | 596 (176) | 523 (197) | 645 (153) | 545 (172) | 595 (241) | 570 (313) | 0.75 |
| Leptin | 1,451 (621) | 1,158 (469) | 1,271 (440) | 1,153 (758) | 1,109 (282) | 850 (325) | 1,066 (677) | 765 (525) | 0.83 |
| Adiponectin | 3,306 (909) | 2,260 (584) | 3,252 (460) | 2,592 (969) | 3,342 (901) | 2,613 (854) | 3,401 (872) | 2,374 (653) | 0.69 |
| Immune system function | |||||||||
| IL-10 | 6 (5) | 18 (12) | 6 (4) | 18 (20) | 6 (6) | 14 (13) | 6 (5) | 13 (11) | 0.88 |
| IL-6 | 6 (6) | 3 (1) | 5 (3) | 4 (2) | 6 (5) | 8 (10) | 5 (2) | 4 (2) | 0.54 |
| TNF-α | 6 (3) | 7 (3) | 4 (2) | 6 (3) | 4 (1) | 8 (8) | 4 (2) | 5 (3) | 0.92 |
| TGF-β | 292 (122) | 356 (121) | 275 (128) | 307 (106) | 258 (69) | 451 (444) | 229 (88) | 291 (120) | 0.76 |
| CCL2 | 63 (53) | 83 (47) | 38 (23) | 68 (70) | 49 (25) | 85 (84) | 40 (22) | 57 (32) | 0.99 |
| IL-1β | 4 (4) | 3 (3) | 3 (2) | 3 (2) | 2 (1) | 15 (32) | 3 (6) | 5 (8) | 0.33 |
| Sex steroid signaling | |||||||||
| Aromatase | 11 (9) | 11 (6) | 8 (7) | 9 (7) | 7 (4) | 9 (6) | 8 (6) | 10 (9) | 0.90 |
| AR | 383 (96) | 260 (101) | 364 (93) | 277 (105) | 399 (114) | 303 (117) | 345 (115) | 245 (108) | 0.88 |
| ERα | 120 (44) | 101 (43) | 149 (43) | 109 (51) | 139 (31) | 107 (57) | 139 (44) | 97 (43) | 0.55 |
Data are shown as means (SD) and represent transcript copy number rounded to the nearest whole number and normalized to the geometric mean of phosphoglycerate kinase and 18 s. Baseline and end-of-treatment whole adipose tissue gene expression are shown. P values represent time-by-group interactions from RM-ANOVA comparing all treatment arms at baseline and week 4. AR, androgen receptor; ERα, estrogen receptor-α; PPARγ, peroxisome proliferator-activated receptor-γ; TGF, transforming growth factor.
Adipose tissue estrogen levels.
As for immune cell populations and gene expression targets, no time-by-group interactions were observed for intra-adipose 17β-estradiol and estrone levels when subjects were grouped according to original drug treatment assignment (Table 7). When all subjects were grouped together, change in serum 17β-estradiol level did not correlate with change in intra-adipose 17β-estradiol level (β = 0.24 per 10 pg/ml change in serum 17β-estradiol, P = 0.21). There was also no correlation found between change in serum 17β-estradiol level and change in adipose tissue estrone level (β = 0.13 per 10 pg/ml change in serum 17β-estradiol, P = 0.51). The only correlate of change in intra-adipose 17β-estradiol level was change in fat mass, with the association evident as a statistical trend (β = −0.34, P = 0.06). Importantly, however, given the weak associations observed between serum and intra-adipose tissue estrogens, these linear regression analyses had very limited statistical power; thus post hoc power calculations indicated 48% power to detect a significant correlation between change in serum 17β-estradiol level and change in intra-adipose estrone level but only 6% power to detect a significant correlation between changes in serum and intra-adipose 17β-estradiol levels.
Table 7.
Adipose tissue estrogen levels
| Castrate (n = 8) |
Low T/E (n = 7) |
Normal T/E (n = 8) |
Normal T/Low E (n = 8) |
||||||
|---|---|---|---|---|---|---|---|---|---|
| Baseline | Week 4 | Baseline | Week 4 | Baseline | Week 4 | Baseline | Week 4 | P value (Overall RM-ANOVA) | |
| Estrone, pg/ml | 360 (169) | 179 (108) | 393 (180) | 383 (131) | 562 (574) | 467 (347) | 329 (114) | 155 (135) | 0.15 |
| 17β-Estradiol, pg/ml | 849 (471) | 457 (310) | 1,116 (605) | 600 (387) | 810 (288) | 492 (229) | 690 (208) | 548 (393) | 0.70 |
Data are shown as means (SD). Baseline and end-of-treatment adipose tissue estrogen levels. P values represent time-by-group interactions from RM-ANOVA comparing all treatment arms at baseline and week 4.
DISCUSSION
This study is the first to interrogate changes in adipose tissue biology consequent to sex steroid manipulation in human subjects. The findings in this exploratory study demonstrate negative associations between change in serum testosterone level and changes in the number of adipose tissue T cells and CD11c+ ATMs. Furthermore, change in serum estradiol level showed an inverse association with change in the total number of adipose tissue ATMs. In contrast, changes in CD40+ ATMs and dendritic cells correlated positively with change in insulin sensitivity but not changes in serum sex steroid levels. No associations were found between changes in serum sex steroid levels and changes in whole adipose tissue gene expression or intra-adipose estrogen levels. These findings suggest that circulating sex steroids may contribute to the regulation of adipose tissue immune cell populations in men. Although results are preliminary and limited by substantial intersubject variation, they suggest a novel mechanism whereby sex steroids may regulate body composition in men.
Testosterone but not estradiol deprivation showed a strong association with increases in the numbers of intra-adipose T cells. The observed expansion of T-cell populations is consistent with testosterone’s established role as an inhibitor of lymphopoiesis (63, 79). Furthermore, a prior clinical study similarly used acyline to effect short-term sex steroid deprivation in healthy men and demonstrated changes in circulating T-cell populations (67). Change in serum 17β-estradiol correlated inversely with the change in ATM number, a finding consistent with extensive data demonstrating the role of estradiol in regulating macrophage differentiation and function (15, 45). Increased macrophage infiltration into adipose tissue has been observed in mouse models of global as well as macrophage- and adipocyte-specific estrogen receptor-α (ERα) deficiency (18, 71). Very few studies have examined the relationship between sex steroids and CD11c expression in immune cells; ovariectomized mice exhibited changes in CD11c+ splenic dendritic cell populations, and estrone inhibited monocyte CD11c+ expression in vitro (16, 17). The current findings represent the first clinical data to our knowledge that suggest a role for testosterone in regulating macrophage CD11c expression.
In our original study, both testosterone and estradiol deprivation contributed to increases in fat mass (12). Thus, given the concurrent changes in serum sex steroids levels and fat mass that occurred during the treatment period, causal relationships cannot be clearly established for the changes in adipose tissue immune cells. Sex steroid deprivation could lead to changes in mood, motivation, appetite, and behavior (3, 68, 90) that lead to positive energy balance and accrual of fat mass, and expansion of T-cell, ATM, and CD11c+ ATM populations is reproducibly observed with obesity in both animal and human studies (31, 53, 73, 85). Thus changes in adiposity could underlie the observed associations between changes in serum sex steroids and those in adipose tissue immune cells. Notably, changes in the number of CD3+ and CD8+ T cells also correlated with change in fat mass, although the fact that these were inverse correlations is unexpected and requires substantiation in future studies. Only changes in serum sex steroid levels, however, correlated with changes in ATM number and CD11c+ ATM number, suggesting that these associations may not be mediated solely through changes in adiposity. Furthermore, inclusion of change in fat mass in the regression models strengthened rather than attenuated the inverse associations found between changes in CD3+ and CD8+ T cells and change in serum testosterone level.
Preclinical data support the possibility that the immunomodulatory functions of sex steroid signaling can directly influence adiposity. In female mice, bone marrow-specific deletion of ERα led to increases in fat mass in association with increased adipose tissue macrophage infiltration (71). In parallel, male mice with AR deficiency in hematopoietic cells exhibited greater visceral fat mass (72). Mice with global AR deficiency exhibit obesity with aging (26), whereas no increases in adiposity were found in adipocyte-specific AR-deficient animals, suggesting that AR signaling in intra-adipose cells other than adipocytes might be important for regulation of fat mass (59). Thus findings from these prior studies are consistent with a model of sex steroids regulating adiposity through immune-mediated mechanisms. The current analyses offer preliminary evidence that this model may also be relevant to body composition regulation in men. In future clinical studies, dedicated assessment of energy intake and expenditure will be critical for discriminating the direct and indirect effects of circulating sex steroids on fat mass, overall energy balance, and adipose tissue immune cells. Given the marked variation in adipose tissue immune cell numbers, particularly in the treatment group with selective estradiol deficiency (Normal T/Low E), studies with greater statistical power are necessary to verify our findings. The possibility also exists that intersubject variation obscured additional effects of circulating sex steroids on adipose tissue immune cells. A complementary method of immune cell quantification such as immunohistochemistry also could be helpful for corroborating findings by flow cytometry, although this method is limited by substantial cellular heterogeneity within adipose tissue.
Changes in intra-adipose gene expression did not correlate with changes in serum sex steroid levels. Previously, androgens were shown to regulate lipoprotein lipase activity and adiponectin secretion in human adipose tissue ex vivo (6). Testosterone also reduced hormone-sensitive lipase protein expression and leptin secretion in human adipocytes (21). Recently, androgen deprivation through orchiectomy was shown to worsen adiposity and inhibit hormone-sensitive lipase expression in a mouse model of diet-induced obesity (24). In another mouse model that employed orchiectomy, discrete roles for testosterone and estradiol were demonstrated in regulating adipose tissue expression of lipid metabolism genes (37). The negative findings in our study most likely reflect that the study was inadequately powered to examine these end points, particularly given the marked intersubject variation in gene expression evident both at baseline and after the treatment intervention. Inclusion of all four treatment groups in these analyses also could have contributed to the negative findings for time-by-group interactions, particularly as on-treatment serum sex steroid levels in subjects within the Low T/E group exhibited overlap with those in both the Castrate and Normal T/E groups. Furthermore, correlation analyses were based on two isolated measurements of serum sex steroid levels that may not fully capture total sex steroid exposure over the 4-wk treatment period. Based on these measurements, mean serum sex steroid levels within each group were achieved as intended. Nonetheless, within-group variation in on-treatment sex steroid exposure could have contributed to the absence of significant findings for time-by-group interactions in the primary analyses despite significant associations between changes in serum sex steroid levels and adipose tissue immune cells in the subject cohort as a whole. Importantly, too, these exploratory analyses examined numerous adipose tissue end points without adjusting for multiple comparisons and are therefore subject to an inflated α-error. These data will serve as the basis for designing larger follow-up studies powered specifically to examine gene expression end points. Future studies also would benefit from analysis of multiple adipose tissue samples for each subject given the compositional heterogeneity as well as more frequent measurement of serum sex steroid levels during the treatment intervention. Gene expression profiling specifically of the stromovascular fraction of adipose tissue further could provide important insight into immune cell phenotype that may not be captured by whole tissue analyses.
No correlations were observed between changes in serum and intra-adipose estrogen levels, suggesting some degree of local, tissue-specific regulation. Decreases in adipose tissue estrone levels appeared most prominent in the estradiol deprivation groups (Castrate and Normal T/Low E), and the absence of a significant association between serum and intra-adipose estrone levels may result from the small subject number. The weak association between changes in serum and adipose tissue estrogen levels also could reflect inadequate aromatase inhibitor exposure. The dose used in this study was likely adequate, as serum estrogen levels were markedly suppressed in the Normal T/Low E group as intended. Furthermore, letrozole is a highly potent third generation aromatase inhibitor, and the dose employed was higher than that commonly used as treatment for breast cancer in post-menopausal women (2, 25). However, the short duration of treatment might underlie the weak associations between serum and tissue estrogen levels. Estrogens are stored in adipose tissue in the form of estrogen fatty acyl esters as well as estrogen sulfates. These estrogen derivatives can be converted to estrone and 17β-estradiol through the action of lipases and steroid sulfatase, thus generating bioactive estrogens through aromatase-independent mechanisms. Therefore, the possibility exists that more prolonged aromatase inhibition would be needed to deplete tissue estrogen stores and lead to comparable reductions in serum and tissue levels. This apparent dissociation between serum and adipose estrogen levels is consistent with a previous study demonstrating that serum and adipose tissue 17β-estradiol levels did not correlate in obese men and women (82). Local regulation of 17β-estradiol and estrone concentrations is also supported by data showing differential aromatase expression and steroid sulfatase activity within adipose tissue in pre- and postmenopausal women (65). Dissociations between serum and tissue-specific sex steroid levels also have been observed in other tissues, as clearly demonstrated by lack of associations between circulating and intraprostatic androgen levels (66, 77).
Our findings suggest that sex steroid deprivation in men may result in changes in adipose tissue immune cell populations. These changes in immune cell number and/or phenotype potentially could contribute to changes in energy metabolism within adipose tissue that favor accrual of fat mass. These preliminary findings thus suggest a novel mechanism by which circulating sex steroids may regulate adiposity in men. These findings further suggest discrete roles for both testosterone and estradiol, consistent with recent clinical data demonstrating that both androgen and estrogen exposure contribute to the regulation of fat mass in men (12, 27). Additional human studies are needed, specifically powered to detect changes in adipose tissue immune cells and gene expression and designed to assess changes in activity, food intake, and overall energy balance. Such work will help to better define the metabolic roles of sex steroids and avoid potential adverse effects of sex steroid manipulation in men.
GRANTS
This study was supported by American Heart Association Clinical Research Program and Eunice Kennedy Shriver National Institute of Child Health and Development (NICHD) Grant 6K12- HD-053984 (to K. B. Rubinow), National Institute of Diabetes and Digestive and Kidney Diseases Grant T32-DK-007247–37 (to J. Chao), and NICHD Grant HD-042454, the National Institute of Aging Grant R01-AG-037603), and the Robert McMillen Professorship in Lipid Research (to S. T. Page).
DISCLOSURES
S. T. Page has received study drug supplies for an investigator-initiated clinical study from AbbVie, Inc. All of the other authors have nothing to disclose.
AUTHOR CONTRIBUTIONS
K.B.R., M.K., and S.T.P. conceived and designed research; K.B.R., J.C., D.H., B.V.Y., N.W.G., J.K.A., and S.T.P. performed experiments; K.B.R., D.H., B.V.Y., and N.W.G. analyzed data; K.B.R., M.K., and S.T.P. interpreted results of experiments; K.B.R. prepared figures; K.B.R. drafted manuscript; K.B.R., J.C., D.H., M.K., B.V.Y., N.W.G., J.K.A., and S.T.P. edited and revised manuscript; K.B.R., J.C., D.H., M.K., B.V.Y., N.W.G., J.K.A., and S.T.P. approved final version of manuscript.
ACKNOWLEDGMENTS
We thank the University of Washington Diabetes Research Center (sponsored by the National Institute of Diabetes and Digestive and Kidney Diseases Grant P30-DK-017047) for adipose tissue gene expression analyses. Besins Healthcare (Bangkok, Thailand) provided testosterone and placebo gel at no cost.
REFERENCES
- 1.Asarian L, Geary N. Modulation of appetite by gonadal steroid hormones. Philos Trans R Soc Lond B Biol Sci 361: 1251–1263, 2006. doi: 10.1098/rstb.2006.1860. [DOI] [PMC free article] [PubMed] [Google Scholar]
- 2.Berry J. Are all aromatase inhibitors the same? A review of controlled clinical trials in breast cancer. Clin Ther 27: 1671–1684, 2005. doi: 10.1016/j.clinthera.2005.11.013. [DOI] [PubMed] [Google Scholar]
- 3.Bhasin S, Cunningham GR, Hayes FJ, Matsumoto AM, Snyder PJ, Swerdloff RS, Montori VM; Task Force, Endocrine Society . Testosterone therapy in men with androgen deficiency syndromes: an Endocrine Society clinical practice guideline. J Clin Endocrinol Metab 95: 2536–2559, 2010. doi: 10.1210/jc.2009-2354. [DOI] [PubMed] [Google Scholar]
- 4.Bhasin S, Woodhouse L, Storer TW. Androgen effects on body composition. Growth Horm IGF Res 13, Suppl A: S63–S71, 2003. doi: 10.1016/S1096-6374(03)00058-3. [DOI] [PubMed] [Google Scholar]
- 5.Bhatia V, Chaudhuri A, Tomar R, Dhindsa S, Ghanim H, Dandona P. Low testosterone and high C-reactive protein concentrations predict low hematocrit in type 2 diabetes. Diabetes Care 29: 2289–2294, 2006. doi: 10.2337/dc06-0637. [DOI] [PubMed] [Google Scholar]
- 6.Blouin K, Nadeau M, Perreault M, Veilleux A, Drolet R, Marceau P, Mailloux J, Luu-The V, Tchernof A. Effects of androgens on adipocyte differentiation and adipose tissue explant metabolism in men and women. Clin Endocrinol (Oxf) 72: 176–188, 2010. doi: 10.1111/j.1365-2265.2009.03645.x. [DOI] [PubMed] [Google Scholar]
- 7.Borst SE, Yarrow JF, Conover CF, Nseyo U, Meuleman JR, Lipinska JA, Braith RW, Beck DT, Martin JS, Morrow M, Roessner S, Beggs LA, McCoy SC, Cannady DF 2nd, Shuster JJ. Musculoskeletal and prostate effects of combined testosterone and finasteride administration in older hypogonadal men: a randomized, controlled trial. Am J Physiol Endocrinol Metab 306: E433–E442, 2014. doi: 10.1152/ajpendo.00592.2013. [DOI] [PMC free article] [PubMed] [Google Scholar]
- 8.Braga-Basaria M, Dobs AS, Muller DC, Carducci MA, John M, Egan J, Basaria S. Metabolic syndrome in men with prostate cancer undergoing long-term androgen-deprivation therapy. J Clin Oncol 24: 3979–3983, 2006. doi: 10.1200/JCO.2006.05.9741. [DOI] [PubMed] [Google Scholar]
- 9.Campbell KL, Makar KW, Kratz M, Foster-Schubert KE, McTiernan A, Ulrich CM. A pilot study of sampling subcutaneous adipose tissue to examine biomarkers of cancer risk. Cancer Prev Res (Phila) 2: 37–42, 2009. doi: 10.1158/1940-6207.CAPR-08-0073. [DOI] [PMC free article] [PubMed] [Google Scholar]
- 10.Capllonch-Amer G, Lladó I, Proenza AM, García-Palmer FJ, Gianotti M. Opposite effects of 17-β estradiol and testosterone on mitochondrial biogenesis and adiponectin synthesis in white adipocytes. J Mol Endocrinol 52: 203–214, 2014. doi: 10.1530/JME-13-0201. [DOI] [PubMed] [Google Scholar]
- 11.Catalán V, Gómez-Ambrosi J, Rotellar F, Silva C, Rodríguez A, Salvador J, Gil MJ, Cienfuegos JA, Frühbeck G. Validation of endogenous control genes in human adipose tissue: relevance to obesity and obesity-associated type 2 diabetes mellitus. Horm Metab Res 39: 495–500, 2007. doi: 10.1055/s-2007-982502. [DOI] [PubMed] [Google Scholar]
- 12.Chao J, Rubinow KB, Kratz M, Amory JK, Matsumoto AM, Page ST. Short-term estrogen withdrawal increases adiposity in healthy men. J Clin Endocrinol Metab 101: 3724–3731, 2016. doi: 10.1210/jc.2016-1482. [DOI] [PMC free article] [PubMed] [Google Scholar]
- 13.Corona G, Giagulli VA, Maseroli E, Vignozzi L, Aversa A, Zitzmann M, Saad F, Mannucci E, Maggi M. Testosterone supplementation and body composition: results from a meta-analysis of observational studies. J Endocrinol Invest 39: 967–981, 2016. doi: 10.1007/s40618-016-0480-2. [DOI] [PubMed] [Google Scholar]
- 14.Corona G, Rastrelli G, Morelli A, Vignozzi L, Mannucci E, Maggi M. Hypogonadism and metabolic syndrome. J Endocrinol Invest 34: 557–567, 2011. doi: 10.3275/7806. [DOI] [PubMed] [Google Scholar]
- 15.Cunningham M, Gilkeson G. Estrogen receptors in immunity and autoimmunity. Clin Rev Allergy Immunol 40: 66–73, 2011. doi: 10.1007/s12016-010-8203-5. [DOI] [PubMed] [Google Scholar]
- 16.Cunningham MA, Wirth JR, Scott JL, Eudaly J, Collins EL, Gilkeson GS. Early ovariectomy results in reduced numbers of CD11c+/CD11b+ spleen cells and impacts disease expression in murine lupus. Front Immunol 7: 31, 2016. doi: 10.3389/fimmu.2016.00031. [DOI] [PMC free article] [PubMed] [Google Scholar]
- 17.Cutini PH, Campelo AE, Agriello E, Sandoval MJ, Rauschemberger MB, Massheimer VL. The role of sex steroids on cellular events involved in vascular disease. J Steroid Biochem Mol Biol 132: 322–330, 2012. doi: 10.1016/j.jsbmb.2012.08.001. [DOI] [PubMed] [Google Scholar]
- 18.Davis KE, Neinast MD, Sun K, Skiles WM, Bills JD, Zehr JA, Zeve D, Hahner LD, Cox DW, Gent LM, Xu Y, Wang ZV, Khan SA, Clegg DJ. The sexually dimorphic role of adipose and adipocyte estrogen receptors in modulating adipose tissue expansion, inflammation, and fibrosis. Mol Metab 2: 227–242, 2013. doi: 10.1016/j.molmet.2013.05.006. [DOI] [PMC free article] [PubMed] [Google Scholar]
- 19.Dean JD, Carnegie C, Rodzvilla J, Smith T. Long-term effects of testim(r) 1% testosterone gel in hypogonadal men. Rev Urol 7: 87–94, 2005. [PMC free article] [PubMed] [Google Scholar]
- 20.Dhindsa S, Ghanim H, Batra M, Kuhadiya ND, Abuaysheh S, Sandhu S, Green K, Makdissi A, Hejna J, Chaudhuri A, Punyanitya M, Dandona P. Insulin resistance and inflammation in hypogonadotropic hypogonadism and their reduction after testosterone replacement in men with type 2 diabetes. Diabetes Care 39: 82–91, 2016. doi: 10.2337/dc15-1518. [DOI] [PMC free article] [PubMed] [Google Scholar]
- 21.Dicker A, Rydén M, Näslund E, Muehlen IE, Wirén M, Lafontan M, Arner P. Effect of testosterone on lipolysis in human pre-adipocytes from different fat depots. Diabetologia 47: 420–428, 2004. doi: 10.1007/s00125-003-1324-0. [DOI] [PubMed] [Google Scholar]
- 22.Dieudonne MN, Pecquery R, Leneveu MC, Giudicelli Y. Opposite effects of androgens and estrogens on adipogenesis in rat preadipocytes: evidence for sex and site-related specificities and possible involvement of insulin-like growth factor 1 receptor and peroxisome proliferator-activated receptor gamma2. Endocrinology 141: 649–656, 2000. doi: 10.1210/endo.141.2.7293. [DOI] [PubMed] [Google Scholar]
- 23.DiSpirito JR, Mathis D. Immunological contributions to adipose tissue homeostasis. Semin Immunol 27: 315–321, 2015. doi: 10.1016/j.smim.2015.10.005. [DOI] [PMC free article] [PubMed] [Google Scholar]
- 24.Dubois V, Laurent MR, Jardi F, Antonio L, Lemaire K, Goyvaerts L, Deldicque L, Carmeliet G, Decallonne B, Vanderschueren D, Claessens F. Androgen deficiency exacerbates high-fat diet-induced metabolic alterations in male mice. Endocrinology 157: 648–665, 2016. doi: 10.1210/en.2015-1713. [DOI] [PubMed] [Google Scholar]
- 25.Eiermann W, Paepke S, Appfelstaedt J, Llombart-Cussac A, Eremin J, Vinholes J, Mauriac L, Ellis M, Lassus M, Chaudri-Ross HA, Dugan M, Borgs M, Semiglazov V; Letrozole Neo-Adjuvant Breast Cancer Study Group . Preoperative treatment of postmenopausal breast cancer patients with letrozole: a randomized double-blind multicenter study. Ann Oncol 12: 1527–1532, 2001. doi: 10.1023/A:1013128213451. [DOI] [PubMed] [Google Scholar]
- 26.Fan W, Yanase T, Nomura M, Okabe T, Goto K, Sato T, Kawano H, Kato S, Nawata H. Androgen receptor null male mice develop late-onset obesity caused by decreased energy expenditure and lipolytic activity but show normal insulin sensitivity with high adiponectin secretion. Diabetes 54: 1000–1008, 2005. doi: 10.2337/diabetes.54.4.1000. [DOI] [PubMed] [Google Scholar]
- 27.Finkelstein JS, Lee H, Burnett-Bowie SA, Pallais JC, Yu EW, Borges LF, Jones BF, Barry CV, Wulczyn KE, Thomas BJ, Leder BZ. Gonadal steroids and body composition, strength, and sexual function in men. N Engl J Med 369: 1011–1022, 2013. doi: 10.1056/NEJMoa1206168. [DOI] [PMC free article] [PubMed] [Google Scholar]
- 28.Francomano D, Bruzziches R, Barbaro G, Lenzi A, Aversa A. Effects of testosterone undecanoate replacement and withdrawal on cardio-metabolic, hormonal and body composition outcomes in severely obese hypogonadal men: a pilot study. J Endocrinol Invest 37: 401–411, 2014. doi: 10.1007/s40618-014-0066-9. [DOI] [PubMed] [Google Scholar]
- 29.Francomano D, Lenzi A, Aversa A. Effects of five-year treatment with testosterone undecanoate on metabolic and hormonal parameters in ageing men with metabolic syndrome. Int J Endocrinol 2014: 527470, 2014. doi: 10.1155/2014/527470. [DOI] [PMC free article] [PubMed] [Google Scholar]
- 30.Gaikwad NW. Ultra performance liquid chromatography-tandem mass spectrometry method for profiling of steroid metabolome in human tissue. Anal Chem 85: 4951–4960, 2013. doi: 10.1021/ac400016e. [DOI] [PubMed] [Google Scholar]
- 31.Gerriets VA, MacIver NJ. Role of T cells in malnutrition and obesity. Front Immunol 5: 379, 2014. doi: 10.3389/fimmu.2014.00379. [DOI] [PMC free article] [PubMed] [Google Scholar]
- 32.Giudicelli Y, Dieudonne MN, Lacasa D, Pasquier YN, Pecquery R. Modulation by sex hormones of the membranous transducing system regulating fatty acid mobilization in adipose tissue. Prostaglandins Leukot Essent Fatty Acids 48: 91–100, 1993. doi: 10.1016/0952-3278(93)90015-O. [DOI] [PubMed] [Google Scholar]
- 33.Grossmann M, Hoermann R, Wittert G, Yeap BB. Effects of testosterone treatment on glucose metabolism and symptoms in men with type 2 diabetes and the metabolic syndrome: a systematic review and meta-analysis of randomized controlled clinical trials. Clin Endocrinol (Oxf) 83: 344–351, 2015. doi: 10.1111/cen.12664. [DOI] [PubMed] [Google Scholar]
- 34.Hackett G, Jones PW, Strange RC, Ramachandran S. Statin, testosterone and phosphodiesterase 5-inhibitor treatments and age related mortality in diabetes. World J Diabetes 8: 104–111, 2017. doi: 10.4239/wjd.v8.i3.104. [DOI] [PMC free article] [PubMed] [Google Scholar]
- 35.Hagman DK, Kuzma JN, Larson I, Foster-Schubert KE, Kuan LY, Cignarella A, Geamanu E, Makar KW, Gottlieb JR, Kratz M. Characterizing and quantifying leukocyte populations in human adipose tissue: impact of enzymatic tissue processing. J Immunol Methods 386: 50–59, 2012. doi: 10.1016/j.jim.2012.08.018. [DOI] [PMC free article] [PubMed] [Google Scholar]
- 36.Hamilton EJ, Gianatti E, Strauss BJ, Wentworth J, Lim-Joon D, Bolton D, Zajac JD, Grossmann M. Increase in visceral and subcutaneous abdominal fat in men with prostate cancer treated with androgen deprivation therapy. Clin Endocrinol (Oxf) 74: 377–383, 2011. doi: 10.1111/j.1365-2265.2010.03942.x. [DOI] [PubMed] [Google Scholar]
- 37.Holland AM, Roberts MD, Mumford PW, Mobley CB, Kephart WC, Conover CF, Beggs LA, Balaez A, Otzel DM, Yarrow JF, Borst SE, Beck DT. Testosterone inhibits expression of lipogenic genes in visceral fat by an estrogen-dependent mechanism. J Appl Physiol (1985) 121: 792–805, 2016. doi: 10.1152/japplphysiol.00238.2016. [DOI] [PubMed] [Google Scholar]
- 38.Huang G, Travison T, Maggio M, Edwards RR, Basaria S. Effects of testosterone replacement on metabolic and inflammatory markers in men with opioid-induced androgen deficiency. Clin Endocrinol (Oxf) 85: 232–238, 2016. doi: 10.1111/cen.13049. [DOI] [PubMed] [Google Scholar]
- 39.Johnson JA, Calo S, Nair L, IglayReger HB, Greenwald-Yarnell M, Skorupski J, Myers MG Jr, Bodary PF. Testosterone interacts with the feedback mechanisms engaged by Tyr985 of the leptin receptor and diet-induced obesity. J Steroid Biochem Mol Biol 132: 212–219, 2012. doi: 10.1016/j.jsbmb.2012.06.002. [DOI] [PubMed] [Google Scholar]
- 40.Jones TH. Effects of testosterone on Type 2 diabetes and components of the metabolic syndrome. J Diabetes 2: 146–156, 2010. doi: 10.1111/j.1753-0407.2010.00085.x. [DOI] [PubMed] [Google Scholar]
- 41.Jones TH, Arver S, Behre HM, Buvat J, Meuleman E, Moncada I, Morales AM, Volterrani M, Yellowlees A, Howell JD, Channer KS; TIMES2 Investigators . Testosterone replacement in hypogonadal men with type 2 diabetes and/or metabolic syndrome (the TIMES2 study). Diabetes Care 34: 828–837, 2011. doi: 10.2337/dc10-1233. [DOI] [PMC free article] [PubMed] [Google Scholar]
- 42.Juang PS, Peng S, Allehmazedeh K, Shah A, Coviello AD, Herbst KL. Testosterone with dutasteride, but not anastrazole, improves insulin sensitivity in young obese men: a randomized controlled trial. J Sex Med 11: 563–573, 2014. doi: 10.1111/jsm.12368. [DOI] [PubMed] [Google Scholar]
- 43.Kahles F, Meyer C, Möllmann J, Diebold S, Findeisen HM, Lebherz C, Trautwein C, Koch A, Tacke F, Marx N, Lehrke M. GLP-1 secretion is increased by inflammatory stimuli in an IL-6-dependent manner, leading to hyperinsulinemia and blood glucose lowering. Diabetes 63: 3221–3229, 2014. doi: 10.2337/db14-0100. [DOI] [PubMed] [Google Scholar]
- 44.Kapoor D, Aldred H, Clark S, Channer KS, Jones TH. Clinical and biochemical assessment of hypogonadism in men with type 2 diabetes: correlations with bioavailable testosterone and visceral adiposity. Diabetes Care 30: 911–917, 2007. doi: 10.2337/dc06-1426. [DOI] [PubMed] [Google Scholar]
- 45.Kovats S. Estrogen receptors regulate innate immune cells and signaling pathways. Cell Immunol 294: 63–69, 2015. doi: 10.1016/j.cellimm.2015.01.018. [DOI] [PMC free article] [PubMed] [Google Scholar]
- 46.Kratz M, Hagman DK, Kuzma JN, Foster-Schubert KE, Chan CP, Stewart S, van Yserloo B, Westbrook EO, Arterburn DE, Flum DR, Cummings DE. Improvements in glycemic control after gastric bypass occur despite persistent adipose tissue inflammation. Obesity (Silver Spring) 24: 1438–1445, 2016. doi: 10.1002/oby.21524. [DOI] [PMC free article] [PubMed] [Google Scholar]
- 47.Lacasa D, Taleb S, Keophiphath M, Miranville A, Clement K. Macrophage-secreted factors impair human adipogenesis: involvement of proinflammatory state in preadipocytes. Endocrinology 148: 868–877, 2007. doi: 10.1210/en.2006-0687. [DOI] [PubMed] [Google Scholar]
- 48.Law J, Bloor I, Budge H, Symonds ME. The influence of sex steroids on adipose tissue growth and function. Horm Mol Biol Clin Investig 19: 13–24, 2014. doi: 10.1515/hmbci-2014-0015. [DOI] [PubMed] [Google Scholar]
- 49.Lebherz C, Kahles F, Piotrowski K, Vogeser M, Foldenauer AC, Nassau K, Kilger E, Marx N, Parhofer KG, Lehrke M. Interleukin-6 predicts inflammation-induced increase of Glucagon-like peptide-1 in humans in response to cardiac surgery with association to parameters of glucose metabolism. Cardiovasc Diabetol 15: 21, 2016. doi: 10.1186/s12933-016-0330-8. [DOI] [PMC free article] [PubMed] [Google Scholar]
- 50.Lee HK, Lee JK, Cho B. The role of androgen in the adipose tissue of males. World J Mens Health 31: 136–140, 2013. doi: 10.5534/wjmh.2013.31.2.136. [DOI] [PMC free article] [PubMed] [Google Scholar]
- 51.Lizcano F, Guzmán G. Estrogen deficiency and the origin of obesity during menopause. BioMed Res Int 2014: 757461, 2014. doi: 10.1155/2014/757461. [DOI] [PMC free article] [PubMed] [Google Scholar]
- 52.Lu C, Kumar PA, Fan Y, Sperling MA, Menon RK. A novel effect of growth hormone on macrophage modulates macrophage-dependent adipocyte differentiation. Endocrinology 151: 2189–2199, 2010. doi: 10.1210/en.2009-1194. [DOI] [PMC free article] [PubMed] [Google Scholar]
- 53.Lumeng CN, Bodzin JL, Saltiel AR. Obesity induces a phenotypic switch in adipose tissue macrophage polarization. J Clin Invest 117: 175–184, 2007. doi: 10.1172/JCI29881. [DOI] [PMC free article] [PubMed] [Google Scholar]
- 54.Lumeng CN, DelProposto JB, Westcott DJ, Saltiel AR. Phenotypic switching of adipose tissue macrophages with obesity is generated by spatiotemporal differences in macrophage subtypes. Diabetes 57: 3239–3246, 2008. doi: 10.2337/db08-0872. [DOI] [PMC free article] [PubMed] [Google Scholar]
- 55.Lynch L, Nowak M, Varghese B, Clark J, Hogan AE, Toxavidis V, Balk SP, O’Shea D, O’Farrelly C, Exley MA. Adipose tissue invariant NKT cells protect against diet-induced obesity and metabolic disorder through regulatory cytokine production. Immunity 37: 574–587, 2012. doi: 10.1016/j.immuni.2012.06.016. [DOI] [PMC free article] [PubMed] [Google Scholar]
- 56.Magnussen LV, Glintborg D, Hermann P, Hougaard DM, Højlund K, Andersen M. Effect of testosterone on insulin sensitivity, oxidative metabolism and body composition in aging men with type 2 diabetes on metformin monotherapy. Diabetes Obes Metab 18: 980–989, 2016. doi: 10.1111/dom.12701. [DOI] [PubMed] [Google Scholar]
- 57.Mathis D. Immunological goings-on in visceral adipose tissue. Cell Metab 17: 851–859, 2013. doi: 10.1016/j.cmet.2013.05.008. [DOI] [PMC free article] [PubMed] [Google Scholar]
- 58.Mauras N, Hayes V, Welch S, Rini A, Helgeson K, Dokler M, Veldhuis JD, Urban RJ. Testosterone deficiency in young men: marked alterations in whole body protein kinetics, strength, and adiposity. J Clin Endocrinol Metab 83: 1886–1892, 1998. doi: 10.1210/jcem.83.6.4892. [DOI] [PubMed] [Google Scholar]
- 59.McInnes KJ, Smith LB, Hunger NI, Saunders PT, Andrew R, Walker BR. Deletion of the androgen receptor in adipose tissue in male mice elevates retinol binding protein 4 and reveals independent effects on visceral fat mass and on glucose homeostasis. Diabetes 61: 1072–1081, 2012. doi: 10.2337/db11-1136. [DOI] [PMC free article] [PubMed] [Google Scholar]
- 60.Morris DL, Singer K, Lumeng CN. Adipose tissue macrophages: phenotypic plasticity and diversity in lean and obese states. Curr Opin Clin Nutr Metab Care 14: 341–346, 2011. doi: 10.1097/MCO.0b013e328347970b. [DOI] [PMC free article] [PubMed] [Google Scholar]
- 61.Mulligan T, Frick MF, Zuraw QC, Stemhagen A, McWhirter C. Prevalence of hypogonadism in males aged at least 45 years: the HIM study. Int J Clin Pract 60: 762–769, 2006. doi: 10.1111/j.1742-1241.2006.00992.x. [DOI] [PMC free article] [PubMed] [Google Scholar]
- 62.Olefsky JM, Glass CK. Macrophages, inflammation, and insulin resistance. Annu Rev Physiol 72: 219–246, 2010. doi: 10.1146/annurev-physiol-021909-135846. [DOI] [PubMed] [Google Scholar]
- 63.Olsen NJ, Viselli SM, Shults K, Stelzer G, Kovacs WJ. Induction of immature thymocyte proliferation after castration of normal male mice. Endocrinology 134: 107–113, 1994. doi: 10.1210/endo.134.1.8275924. [DOI] [PubMed] [Google Scholar]
- 64.O’Reilly MW, House PJ, Tomlinson JW. Understanding androgen action in adipose tissue. J Steroid Biochem Mol Biol 143: 277–284, 2014. doi: 10.1016/j.jsbmb.2014.04.008. [DOI] [PubMed] [Google Scholar]
- 65.Paatela H, Wang F, Vihma V, Savolainen-Peltonen H, Mikkola TS, Turpeinen U, Hämäläinen E, Jauhiainen M, Tikkanen MJ. Steroid sulfatase activity in subcutaneous and visceral adipose tissue: a comparison between pre- and postmenopausal women. Eur J Endocrinol 174: 167–175, 2016. doi: 10.1530/EJE-15-0831. [DOI] [PubMed] [Google Scholar]
- 66.Page ST, Lin DW, Mostaghel EA, Hess DL, True LD, Amory JK, Nelson PS, Matsumoto AM, Bremner WJ. Persistent intraprostatic androgen concentrations after medical castration in healthy men. J Clin Endocrinol Metab 91: 3850–3856, 2006. doi: 10.1210/jc.2006-0968. [DOI] [PubMed] [Google Scholar]
- 67.Page ST, Plymate SR, Bremner WJ, Matsumoto AM, Hess DL, Lin DW, Amory JK, Nelson PS, Wu JD. Effect of medical castration on CD4+ CD25+ T cells, CD8+ T cell IFN-γ expression, and NK cells: a physiological role for testosterone and/or its metabolites. Am J Physiol Endocrinol Metab 290: E856–E863, 2006. doi: 10.1152/ajpendo.00484.2005. [DOI] [PubMed] [Google Scholar]
- 68.Pexman-Fieth C, Behre HM, Morales A, Kan-Dobrosky N, Miller MG. A 6-month observational study of energy, sexual desire, and body proportions in hypogonadal men treated with a testosterone 1% gel. Aging Male 17: 1–11, 2014. doi: 10.3109/13685538.2013.858113. [DOI] [PMC free article] [PubMed] [Google Scholar]
- 69.Qiu Y, Nguyen KD, Odegaard JI, Cui X, Tian X, Locksley RM, Palmiter RD, Chawla A. Eosinophils and type 2 cytokine signaling in macrophages orchestrate development of functional beige fat. Cell 157: 1292–1308, 2014. doi: 10.1016/j.cell.2014.03.066. [DOI] [PMC free article] [PubMed] [Google Scholar]
- 71.Ribas V, Drew BG, Le JA, Soleymani T, Daraei P, Sitz D, Mohammad L, Henstridge DC, Febbraio MA, Hewitt SC, Korach KS, Bensinger SJ, Hevener AL. Myeloid-specific estrogen receptor alpha deficiency impairs metabolic homeostasis and accelerates atherosclerotic lesion development. Proc Natl Acad Sci USA 108: 16457–16462, 2011. [Erratum. Proc Natl Acad Sci USA 109: 645, 2012.] doi: 10.1073/pnas.1104533108. [DOI] [PMC free article] [PubMed] [Google Scholar]
- 72.Rubinow KB, Wang S, den Hartigh LJ, Subramanian S, Morton GJ, Buaas FW, Lamont D, Gray N, Braun RE, Page ST. Hematopoietic androgen receptor deficiency promotes visceral fat deposition in male mice without impairing glucose homeostasis. Andrology 3: 787–796, 2015. doi: 10.1111/andr.12055. [DOI] [PMC free article] [PubMed] [Google Scholar]
- 73.Shaul ME, Bennett G, Strissel KJ, Greenberg AS, Obin MS. Dynamic, M2-like remodeling phenotypes of CD11c+ adipose tissue macrophages during high-fat diet–induced obesity in mice. Diabetes 59: 1171–1181, 2010. doi: 10.2337/db09-1402. [DOI] [PMC free article] [PubMed] [Google Scholar]
- 74.Snyder PJ, Peachey H, Hannoush P, Berlin JA, Loh L, Lenrow DA, Holmes JH, Dlewati A, Santanna J, Rosen CJ, Strom BL. Effect of testosterone treatment on body composition and muscle strength in men over 65 years of age. J Clin Endocrinol Metab 84: 2647–2653, 1999. [DOI] [PubMed] [Google Scholar]
- 75.Spencer M, Yao-Borengasser A, Unal R, Rasouli N, Gurley CM, Zhu B, Peterson CA, Kern PA. Adipose tissue macrophages in insulin-resistant subjects are associated with collagen VI and fibrosis and demonstrate alternative activation. Am J Physiol Endocrinol Metab 299: E1016–E1027, 2010. doi: 10.1152/ajpendo.00329.2010. [DOI] [PMC free article] [PubMed] [Google Scholar]
- 76.Suganami T, Ogawa Y. Adipose tissue macrophages: their role in adipose tissue remodeling. J Leukoc Biol 88: 33–39, 2010. doi: 10.1189/jlb.0210072. [DOI] [PubMed] [Google Scholar]
- 77.Thirumalai A, Cooper LA, Rubinow KB, Amory JK, Lin DW, Wright JL, Marck BT, Matsumoto AM, Page ST. Stable intraprostatic dihydrotestosterone in healthy medically castrate men treated with exogenous testosterone. J Clin Endocrinol Metab 101: 2937–2944, 2016. doi: 10.1210/jc.2016-1483. [DOI] [PMC free article] [PubMed] [Google Scholar]
- 78.Toda K, Hayashi Y, Saibara T. Deletion of tumor necrosis factor-alpha receptor type 1 exacerbates insulin resistance and hepatic steatosis in aromatase knockout mice. Biochim Biophys Acta 1801: 655–664, 2010. doi: 10.1016/j.bbalip.2010.03.002. [DOI] [PubMed] [Google Scholar]
- 79.Trigunaite A, Dimo J, Jørgensen TN. Suppressive effects of androgens on the immune system. Cell Immunol 294: 87–94, 2015. doi: 10.1016/j.cellimm.2015.02.004. [DOI] [PubMed] [Google Scholar]
- 80.Vandesompele J, De Preter K, Pattyn F, Poppe B, Van Roy N, De Paepe A, Speleman F. Accurate normalization of real-time quantitative RT-PCR data by geometric averaging of multiple internal control genes. Genome Biol 3: research0034.1, 2002. doi: 10.1186/gb-2002-3-7-research0034. [DOI] [PMC free article] [PubMed] [Google Scholar]
- 81.Wang C, Cunningham G, Dobs A, Iranmanesh A, Matsumoto AM, Snyder PJ, Weber T, Berman N, Hull L, Swerdloff RS. Long-term testosterone gel (AndroGel) treatment maintains beneficial effects on sexual function and mood, lean and fat mass, and bone mineral density in hypogonadal men. J Clin Endocrinol Metab 89: 2085–2098, 2004. doi: 10.1210/jc.2003-032006. [DOI] [PubMed] [Google Scholar]
- 82.Wang F, Vihma V, Soronen J, Turpeinen U, Hämäläinen E, Savolainen-Peltonen H, Mikkola TS, Naukkarinen J, Pietiläinen KH, Jauhiainen M, Yki-Järvinen H, Tikkanen MJ. 17β-Estradiol and estradiol fatty acyl esters and estrogen-converting enzyme expression in adipose tissue in obese men and women. J Clin Endocrinol Metab 98: 4923–4931, 2013. doi: 10.1210/jc.2013-2605. [DOI] [PubMed] [Google Scholar]
- 83.Wang H, Ye J. Regulation of energy balance by inflammation: common theme in physiology and pathology. Rev Endocr Metab Disord 16: 47–54, 2015. doi: 10.1007/s11154-014-9306-8. [DOI] [PMC free article] [PubMed] [Google Scholar]
- 84.Weisberg SP, McCann D, Desai M, Rosenbaum M, Leibel RL, Ferrante AW Jr. Obesity is associated with macrophage accumulation in adipose tissue. J Clin Invest 112: 1796–1808, 2003. doi: 10.1172/JCI200319246. [DOI] [PMC free article] [PubMed] [Google Scholar]
- 85.Wentworth JM, Naselli G, Brown WA, Doyle L, Phipson B, Smyth GK, Wabitsch M, O’Brien PE, Harrison LC. Pro-inflammatory CD11c+CD206+ adipose tissue macrophages are associated with insulin resistance in human obesity. Diabetes 59: 1648–1656, 2010. doi: 10.2337/db09-0287. [DOI] [PMC free article] [PubMed] [Google Scholar]
- 86.Xu H, Barnes GT, Yang Q, Tan G, Yang D, Chou CJ, Sole J, Nichols A, Ross JS, Tartaglia LA, Chen H. Chronic inflammation in fat plays a crucial role in the development of obesity-related insulin resistance. J Clin Invest 112: 1821–1830, 2003. doi: 10.1172/JCI200319451. [DOI] [PMC free article] [PubMed] [Google Scholar]
- 87.Xu X, Grijalva A, Skowronski A, van Eijk M, Serlie MJ, Ferrante AW Jr. Obesity activates a program of lysosomal-dependent lipid metabolism in adipose tissue macrophages independently of classic activation. Cell Metab 18: 816–830, 2013. doi: 10.1016/j.cmet.2013.11.001. [DOI] [PMC free article] [PubMed] [Google Scholar]
- 88.Ye J, McGuinness OP. Inflammation during obesity is not all bad: evidence from animal and human studies. Am J Physiol Endocrinol Metab 304: E466–E477, 2013. doi: 10.1152/ajpendo.00266.2012. [DOI] [PMC free article] [PubMed] [Google Scholar]
- 89.Yu G, Traish AM. Induced testosterone deficiency: from clinical presentation of fatigue, erectile dysfunction and muscle atrophy to insulin resistance and diabetes. Horm Mol Biol Clin Investig 8: 425–430, 2011. doi: 10.1515/HMBCI.2011.131. [DOI] [PubMed] [Google Scholar]