Abstract
We develop a mathematical model of a salivary gland acinar cell with the objective of investigating the role of two exchangers from the solute carrier family 4 (Slc4), Ae2 (Slc4a2) and Ae4 (Slc4a9), in fluid secretion. Water transport in this type of cell is predominantly driven by Cl− movement. Here, a basolateral Na+/K+ adenosine-triphosphatase pump (NaK-ATPase) and a Na+–K+–2Cl− cotransporter (Nkcc1) are primarily responsible for concentrating the intracellular space with Cl− well above its equilibrium potential. Gustatory and olfactory stimuli induce the release of Ca2+ ions from the internal stores of acinar cells, which triggers saliva secretion. Ca2+-dependent Cl− and K+ channels promote ion secretion into the luminal space thus creating an osmotic gradient that promotes water movement in the secretory direction. The current model for saliva secretion proposes that anion exchangers (Ae), coupled with a basolateral Na+/proton (H+) (Nhe1) antiporter, regulate intracellular pH and act as a secondary Cl− uptake mechanism (Nauntofte 1992, Melvin et al 2005). Recent studies demonstrated that Ae4 deficient mice exhibit an approximate 30% decrease in gland salivation (Peña-Münzenmayer et al 2015). Surprisingly, the same study revealed that absence of Ae2 does not impair salivation, as previously suggested. These results seem to indicate that the Ae4 may be responsible for the majority of the secondary Cl− uptake and thus a key mechanism for saliva secretion. Here, by using ‘in-silico’ Ae2 and Ae4 knockout simulations, we produced mathematical support for such controversial findings. Our results suggest that the exchanger’s cotransport of monovalent cations is likely to be important in establishing the osmotic gradient necessary for optimal transepithelial fluid movement.
Keywords: acinar cell, salivary gland, bicarbonate, mathematical physiology, anion exchanger 2, anion exchanger 4
1 Introduction
Saliva is an exocrine secretion composed of water, a combination of electrolytes, and proteins (Gordon, 1982). Among its many roles, saliva initiates digestion by facilitating mastication, swallowing, and appreciation of foods. A low salivary flow (hyposalivation) causes a subjective feeling of dry mouth, otherwise known as xerostomia (Locker, 1995). Oral pain, caries, mouth infections, problems with digestion and speech are associated with hyposalivation. Common pathologies that precede the latter include cystic fibrosis, pancreatitis, and Sjögren’s syndrome (Mignogna et al, 2005). Neck and head irradiation therapies to treat cancer have also been linked to hyposalivation (Niedermeier et al, 1998).
In humans the majority of saliva is secreted by three major pairs of glands situated at the side of the face, the submaxillary triangle, and underneath the tongue; i.e., the parotid, submandibular and sublingual glands, respectively. Saliva is also secreted in lesser quantities by a multitude of minor glands scattered around the oral cavity. Salivary glands are multi-lobular glands composed of different types of cells. For instance, secretory cells are arranged in clusters to form acini, which consist of a single layer of epithelial cells connected to a ductal system that ends in the oral cavity. The type of secretion produced by the different salivary glands varies: some glands produce a watery serous-like saliva, others a more dense viscous secretion, and some generate a mixture of both (Melvin et al, 2005).
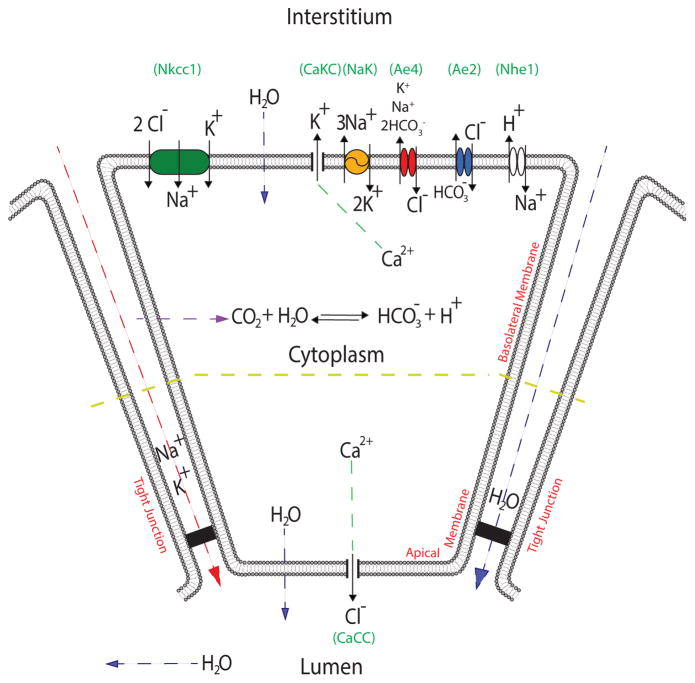
Saliva formation starts in the acinar epithelium where water is taken from the blood stream and transported to the luminal space. Water transport is driven by an osmotic gradient created by the transport of ions (Yusuke et al, 1973) (Fig. 1). To explain this Thaysen et al (1954) proposed a ‘two-stage secretion’ model. Studies in the rat submandibular gland demonstrated that acinar cells secrete a salt (NaCl)-rich ‘primary’ fluid (stage1). The fluid is then modified after its passage through a series of ducts; most of the NaCl is reabsorbed and potassium (K+) is secreted (stage 2) (Young and Schögel, 1966).
Fig. 1.
Schematic diagram of the salivary acinar cell model. We distinguish the basal and lateral sides (basolateral) to the apical side of the plasma membrane. Perfusion studies demonstrated different potentials on each portion of the acinar membrane (Young, 1968). In the diagram these are separated by a yellow line. The basolateral membrane portion contains Nkcc1 (green), NaK-ATPase (yellow), Ae4 (red), Ae2 (blue), Nhe1 (white), and Ca2+-activated K+ channels. The cell membrane is permeable to CO2; carbonic anhydrases in the cytoplasm catalyze the reaction of CO2 and water to form carbonic acid, which dissociates into and H+. The apical membrane contains a Ca2+-activated Cl− channel. Both apical and basolateral membranes are permeable to water. Finally, we have included paracellular K+ and Na+ currents along with a paracellular water flow. Although the apical membrane also contains Ca2+-activated K+ channels, these are omitted from the model for simplicity.
The molecular basis for epithelial fluid transport was first described by Silva et al (1977). According to this model secondary active Cl− transport is the driving force of fluid secretion. Transepithelial Cl− movement across acinar cells requires a 3Na+/2K+ adenosine-triphosphatase pump (NaK-ATPase) at the basolateral membrane for generating an inwardly directed Na+ electrochemical gradient that is used by a basolateral Na+ – K+ – 2Cl− cotransporter (Nkcc1) to accumulate intracellular Cl− above its equilibrium potential. Acetylcholine (ACh) released by parasympathetic nerve terminals binds to muscarinic receptors located at the plasma membrane of acinar cells. This triggers a complex intracellular cascade of events that culminates in the release of intracellular calcium (Ca2+) from internal stores. This increase in [Ca2+]i is responsible for the activation of Cl− and K+ membrane channels that extrude K+ ions into the interstitium and Cl− ions into the acinar lumen (A Catalán et al, 2009).
Novak and Young (1986) showed that the Na+ – K+ – 2Cl− (Nkcc1) cotransporter is the primary pathway involved in Cl− uptake by acinar cells. Martinez and Cassity (1983) demonstrated that loop diuretics furosemide and bumetanide severely impair Nkcc1-mediated ion transport and as a result salivary gland fluid secretion is decreased by approximately 65%. Later experiments by Evans et al (2000) showed that Nkcc1-deficient mice exhibit reduced salivation (approximately 70%).
It was then proposed that an additional -dependent transport system may be involved in the uptake of Cl− ions (Novak and Young, 1986). Acinar cells express a paired Na+/H+ (Nhe1) and exchanger system that regulates intracellular pH and at the same time supports intracellular accumulation of Cl−. This paired exchanger ion transport mechanism relies on intracellular carbonic anhydrase activity (Ogawa et al, 1998). Carbon dioxide (CO2) enters the cytoplasm through the membrane and is rapidly hydrated forming carbonic acid (H2CO3). This acid is dissociated into H+ and by intracellular carbonic anhydrases. Cholinergic receptor activation leads to Nhe1 transporter activation thus causing intracellular alkalinisation and consequently promoting intracellular accumulation. exchangers use this outward gradient to support Cl− uptake (Peña-Münzenmayer et al, 2015, 2016).
It has long been suspected that the anion exchanger (Ae2-Slc4a2), ubiquitous to almost all cell types, is responsible for the majority of the -dependent Cl− uptake in secretory epithelia (Evans et al, 2000; Frizzell and Hanrahan, 2012; Nguyen et al, 2004; Roussa, 2011). However, recent experiments have demonstrated expression in salivary gland acinar cells of another exchanger from the Slc4 family; a monovalent cation-dependent transporter (Ae4- Slc4a9) (Peña-Münzenmayer et al, 2016). Surprisingly this transporter, previously thought to be expressed primarily in ductal cells, appears to be an essential Cl− uptake pathway for the salivary gland acinar cell. Through a series of experiments Peña-Münzenmayer et al (2015) demonstrated that Ae4-deficient mice suffered an approximate 30% salivary reduced flow. In contrast, Ae2-deficient mice exhibited no reduction of salivary fluid. The exact reason behind the cellular preference for Ae4 over the Ae2 remains controversial.
In the present study we describe a mathematical model that extends the work of Gin et al (2007), Maclaren et al (2012) and Palk et al (2010) to include the two -dependent Cl− uptake mechanisms (Ae2 and Ae4) in question. Through computational simulations we investigate the effect of the absence of Ae2 and Ae4 on fluid secretion. Based on the model results we propose a theoretical explanation as to why the gland acinar cell may favor Ae4 over Ae2 as a main -dependent Cl− uptake mechanism in the secretory process.
2 Model
2.1 Assumptions and notation
The model is based on fluxes responsible for changes in ion concentrations of three main compartments: the interstitium, cytoplasm and the acinar lumen. We denote these by subscripts e, i and l, respectively (Fig. 1). Each flux, denoted by J, is represented by a mathematical sub-model based on experimental observations and previous mathematical models (refer to the Appendix for full details on each flux model).
The model assumes that the concentration of each ionic species is spatially homogeneous. In addition, the interstitial ionic concentrations are assumed to be constant. This is equivalent to placing a single homogeneous cell in an infinite bath of ions. Although we know this assumption to be incorrect (for example, interstitial [K+] rises as much as two-fold during stimulation), our model here provides a necessary first step towards the construction of a more complex model that includes dynamic variation of extracellular concentrations.
2.2 Ion channels and fluxes
The osmotic gradient needed for passive water movement in the secretory direction is maintained primarily by transcellular Cl− transport. In our model, the primary Cl− uptake mechanism is the Nkcc1. We use the model of Palk et al (2010) to describe Nkcc1-related ion fluxes. It consists of a two-state model simplification based on an earlier model constructed by Benjamin and Johnson (1997) (Appendix 1).
Along with the Nkcc1, the Ae2 exchanger supports Cl− influx but at the expense of intracellular efflux. We use the model of Falkenberg and Jakobsson (2010) (Appendix 5). The Nhe1 antiporter model is also based on Falkenberg and Jakobsson (2010) (Appendix 6).
In addition to the Nkcc1 and Ae2, the model includes another mechanism that supports Cl− influx. The Ae4 is a exchanger that is non-selective for monovalent cations (Peña-Münzenmayer et al, 2016). In our model, K+ and Na+ are extruded by the mechanism to accommodate for this feature. Its stoichometry is 1:1:2; that is, one Cl− ion in exchange for 2 and one monovalent cation per cycle (Appendix 7).
To maintain a Na+ electrochemical gradient and energize secondarily active transports the NaK-ATPase pump extrudes 3 Na+ ions in exchange for 2 K+ ions. We use the model of Palk et al (2010), which is a simplification of the model of Smith and Crampin (2004) (Appendix 2).
The efflux of intracellular K+ ions to the interstitial compartment occurs via basolateral membrane Ca2+-activated K+ channels (Fig. 1). In our model, these generate a current that is dependent on the channel’s open probability. Such probability is assumed to be directly proportional to the [Ca2+]i (Takahata et al, 2003) (Appendix 3).
The efflux of Cl− from the cellular compartment to the acinar lumen occurs via apical membrane Ca2+-activated Cl− channels (Fig. 1). Their current is dependent on the channel’s open probability, which in turn, is assumed to be directly proportional to the [Ca2+]i (Takahata et al, 2003) (Appendix 4).
2.3 Intracellular ionic concentrations
In our model Cl− enters the cell via the Nkcc1 cotransporter and the Ae2 and Ae4 exchangers, and is extruded through an apical Ca2+-activated-Cl− current (CaCC):
| (1) |
The factor of 2 in the (JNkcc1) term, reflects the stoichiometry of the cotransporter. The variable ωi denotes the cell volume, while zCl=−1 denotes the valence of Cl−. Note that the units of the left hand side of this equation are moles per unit time. Thus, all fluxes must be expressed in moles per unit time, i.e., each flux describes the total number of moles of an ion entering or leaving the cell per unit time.
Na+ enters the cell via Nkcc1 cotransporter activity and the Nhe1 antiporter, and is extruded through the Ae4 exchanger and the NaK-ATPase pump:
| (2) |
The factor of 3 in the ATPase pump flux expression indicates the hydrolysis of 1 ATP molecule to extrude three Na+ in exchange for 2 K+ per cycle. The expression determines the amount of Ae4 flux due to Na+ transport.
The rate at which [K+] varies depends on the Nkcc1 cotransporter, Ca2+- activated-K+ current (CaKC), NaK-ATPase pump, and Ae4 cotransporter.
| (3) |
The factor of 2 in the NaK-ATPase pump flux expression accounts for the stoichiometry of the mechanism. The parameter zK=+1 represents the valence of K+ ions. The expression determines the amount of Ae4 flux due to K+ transport.
In our model and H+ are a product of the dissociation of carbonic acid (H2CO3). We include an intracellular buffer term, whose activity is directly proportional to the influx of CO2 across the plasma membrane (Appendix 8). Efflux of is a direct consequence of Ae2 and Ae4 transporter activity. Exit of H+ ions is a result of Nhe1 Na+ exchange. No other H+ or transport mechanisms are included.
| (4) |
| (5) |
| (6) |
2.4 Two-membrane model and the tight junction
Observations by Young (1968) revealed the presence of two different membrane potentials on portions of the same cellular membrane; the apical and the basolateral (Fig. 1). To obtain the potential at each membrane portion we use Kirchhoff’s current law for a simple resistor-capacitor circuit:
| (7) |
| (8) |
The right hand side of equations (7) and (8) represent the sum of the currents for each ion species through the respective membrane segment. In equation (8) the term ICaCC, represents the apical Ca2+-activated Cl− channel current. The terms ICaKC and INaK in equation (7) represent the current due to Ca2+-activated K+ channels and NaK-ATPase pumps located in the basolateral plasma membrane of the cell, respectively. The terms and in eqs. (7) and (8), represent the Na+ and K+ currents through the tight junctions (Appendix 10). The latter are driven by the negative transepithelial potential generated upon Cl− secretion into the luminal space and contribute to changes in both membrane potentials (Va and Vb). Finally, Cm is the capacitance of the cell membrane.
We used the convention that the apical membrane potential is negative as it is measured from the lumen to the cytoplasm. The basolateral membrane potential, on the other hand, is measured from the interstitium to the cytoplasm.
2.5 Fluid transport
In salivary gland acinar cells water moves across the plasma membrane through water-specific channels called aquaporins. Parotid gland acinar cells express the aquaporin 5 gene (AQP5) which has been shown to be involved in selective membrane water transport (Delporte and Steinfeld, 2006). We model the water fluxes due to aquaporins as a direct consequence of the osmotic gradient between the three neighbouring compartments (intersititum, cellular, and the acinar lumen) and assume that the plasma membrane cannot withstand hydrostatic pressure gradients. The difference between the apical and basolateral fluid flow drives a change in cellular volume (ωi):
| (9) |
The terms qa and qb represent the water fluxes across the basolateral membrane and the apical membrane; subscripts a and b, respectively. These are defined by:
| (10) |
| (11) |
where, Pi (i = a or b) represents the permeability of the respective plasma membrane portion (Appendix 11), and
The value xi in eqs. (10) and (11) represent the moles of negatively charged particles with with valence (zx) ≤ −1 in the cellular media that are impermeable to the plasma membrane. To obtain its value, we used the electroneutrality condition described in Appendix 9. The term Ψl in eq. (10) accounts for the uncharged impermeable ionic species and proteins (e.g. amylase) present in the acinar lumen that we do not keep track of in the model but contribute to the osmolarity of the compartment. This term is a parameter of the model and its value was found by solving eq. (9) at steady state. In doing so, we are ensuring the correct volume and fluid flow.
According to these equations, the osmolarity of the interstitium is 292.6 mM, the osmolarity in the cell is 296.6 mM, and the osmolarity in the acinar lumen is 297.4 mM (see table 1). Thus, at rest there is a small flux from the interstitium into the cell, and from the cell into the lumen.
Table 1.
Comparison of steady-state results.
| Ion | Experimental Values | Model Result | Reference | |
|---|---|---|---|---|
| [Ca2+]i | 58 (nM) | - | Foskett and Melvin (1989) | |
| [Cl−]i | 50.1 (mM) | 50 (mM) | Peña-Münzenmayer et al (2015) | |
| [K+]i | 120 (mM) | 120 (mM) | Pedersen and Petersen (1973) | |
| [Na+]i | 20 (mM) | 25 (mM) | Grinstein and Foskett (1990) | |
|
|
12 (mM) | 12.1 (mM) | Crampin et al (2006) | |
| pHi | 6.8 | 6.91 | Peña-Münzenmayer et al (2015) | |
| [CO2]i | - | 6.6 (mM) | Determined from model | |
| xi/ωi0 | - | 82.8 (mM) | Determined from model | |
| Va | −50.2 (mV) | −50.24 (mV) | Lau and Case (1988) | |
| Vb | −61.8 (mV) | −62.8 (mV) | Lau and Case (1988) | |
| [Cl−]l | 124.3 (mM) | 124.3 (mM) | Palk et al (2010) | |
| [K+]l | 5.6 (mM) | 5.6 (mM) | Mangos et al (1973) | |
| [Na+]l | 118.7 (mM) | 118.7 (mM) | Palk et al (2010) | |
|
|
- | 1.5×10⁻⁴ (mM) | Determined from model | |
| pHl | 6.81 | 6.81 (mM) | Jayaraman et al (2001) | |
| Ψl | - | 48.8 (mM) | Determined from model | |
| [Cl−]e | 102.6 (mM) | - | Mangos et al (1973) | |
| [K+]e | 5.3 (mM) | - | Mangos et al (1973) | |
| [Na+]e | 140.2 (mM) | - | Mangos et al (1973) | |
|
|
- | 42.9 (mM) | Determined from model | |
| pHe | 7.4 | - | Mangos et al (1973) | |
| [CO2]e | - | 1.9 (mM) | Determined from model | |
| ωi | 1.3 pL | - | Palk et al (2010) |
Similarly, the transport of fluid through the tight junctions (i.e. from the interstitial to the acinar lumen paracellularly) occurs as a consequence of the osmotic gradient between the two compartments,
| (12) |
Pt represents the tight junction’s permeability to water (Appendix 11). Finally, the total flux of water into the lumen (apical and paracellular) is given by:
| (13) |
Note that an important consequence of assuming a constant luminal volume (ωl) is that eq. (13) also represents the flux of water out of the lumen (into the salivary ducts).
2.6 Lumen ion concentrations
The ionic concentrations in the acinar lumen depend on the apical membrane and tight junction fluxes. For instance, Na+ and K+ enter the lumen through the tight junction whilst Cl− enters the lumen via a CaCC channel located on the apical membrane:
| (14) |
| (15) |
| (16) |
In equations (14)–(16), the term qtot removes the associated ion out of the acinar lumen and into the ductal passage. We use this expression because eq. (13), unlike eqs. (10)–(12), does not model water flow through a water selective channel (aquaporin). Here the expression qtot is a simple convective flux thus in addition to water, it removes the respective ions from the luminal compartment.
2.7 Summary of the model
2.8 Ca2+ signaling
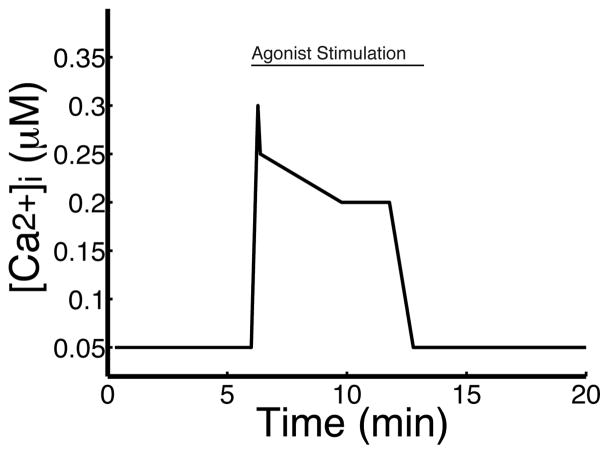
Salivary gland secretion can be achieved by stimulating the salivary glands with a variety of agonists that raise intracellular Ca2+ levels in an oscillatory manner. Previous models by Palk et al (2010) and Gin et al (2007) investigate the effects of Ca2+ oscillations on saliva secretion. Here, however, we do not consider the effects of Ca2+ oscillations. Instead, we assume that [Ca2+]i is a given function of time (Fig. 2), where this function is based on the overall qualitative behaviour of the oscillations observed by Foskett and Melvin (1989) and Soltoff et al (1989) and experimental data from Bruce et al (2002). This approach allows us to bypass the complicated dynamics of Ca2+ signaling and solely focus on membrane activity.
Fig. 2.
Theoretical curve that qualitatively reproduces the acinar cell [Ca2+]i response to agonist stimulation at room temperature (based on observations by Bruce et al (2002)). Stimulation occurs between minutes 6 and 12. Before and after this period, the [Ca2+]i lies at its resting concentration of 58 nM (Foskett and Melvin, 1989). This curve is a fixed input to the model, which thus, for simplicity, ignores the complexity of Ca2+ signaling.
2.9 Numerical simulations
The small membrane capacitance Cm renders the system stiff. Thus, we ignore the fast dynamics of the membrane potentials and use a quasi-steady-state (QSS) approximation to the membrane potentials:
The QSS approximation reduces the model to a system of 10 differential equations and 2 algebraic constraints. This type of problem is known as a differentialalgebraic- equation system or DAE. The MATLAB routine ‘ode15s’ is well equipped to handle DAE systems like this. A good review of the theory of DAEs is given by Kunkel and Mehrmann (2006).
3 Results
3.1 Ionic resting states and agonist stimulation
For the wild-type case (and in the absence of agonist), we determined values for the ion conductances and transporter densities by requiring a physiological reasonable steady state (Table 1).
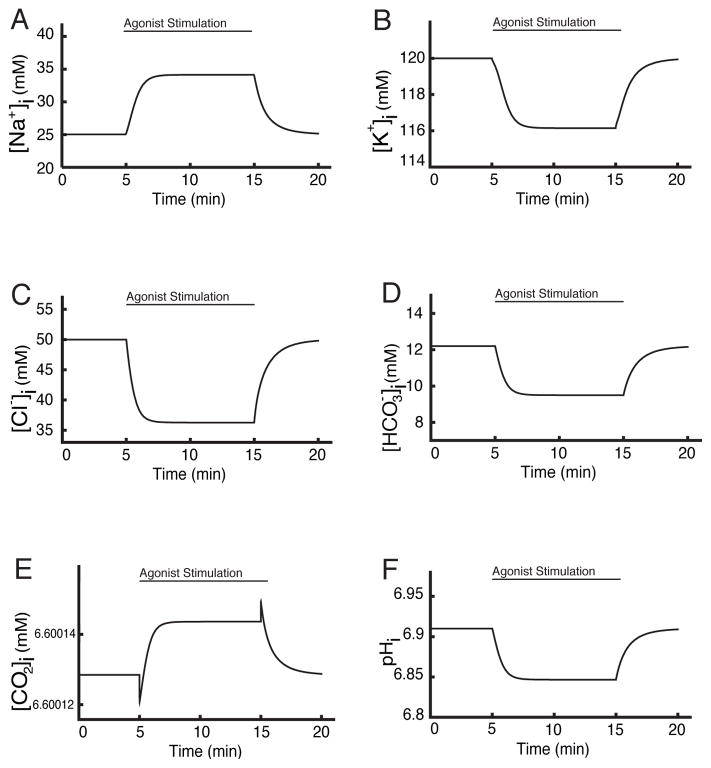
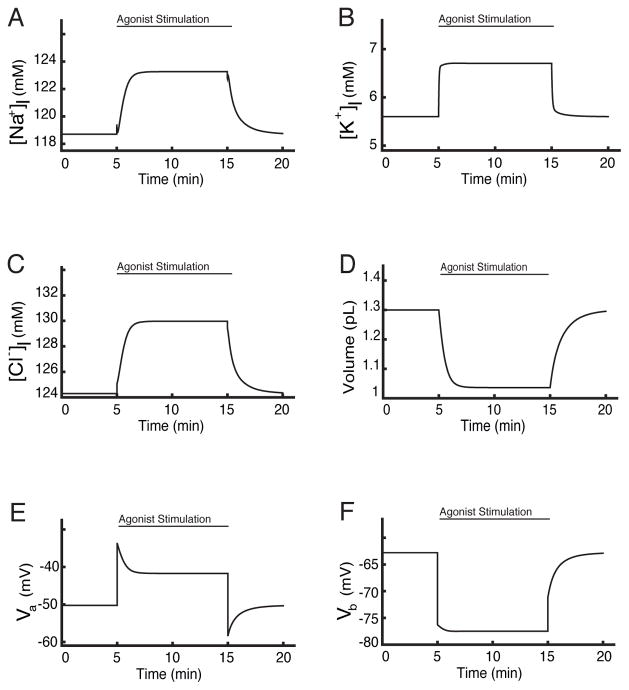
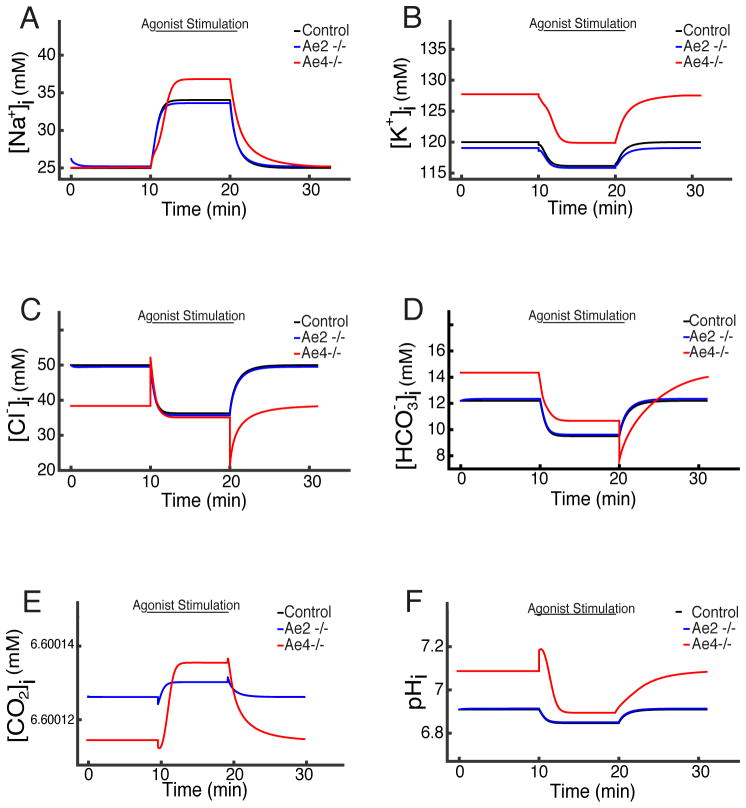
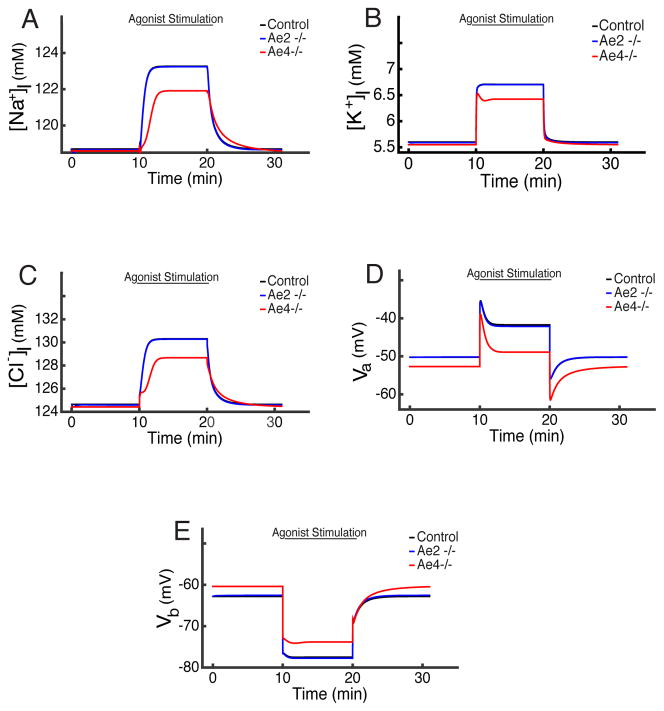
Addition of agonist was simulated by specifying [Ca2+]i as a given function of time (Section 2.8 and Fig. 2). The responses of the intracellular ion concentrations are shown in Fig. 3, while the response of the membrane potentials and the lumenal concentrations are shown in Fig. 4.
Fig. 3.
Response of intracellular ion concentrations to agonist stimulation. Cl−, K+ and concentrations all decrease significantly, while Na+ concentration increases. Neither [CO2]i nor pH change significantly.
Fig. 4.
A, B & C: Response of the luminal ion concentrations to agonist stimulation. D: In response to agonist stimulation, the cell volume shrinks by approximately 28%. E & F: Response of the membrane potentials to agonist stimulation.
In response to agonist stimulation there is a significant decline in [Cl−]i and [K+]i (Fig. 3. C & B), as Ca2+ opens Cl− and K+ channels to allow for efflux of those ions. This decline in [Cl−]i leads to an increased Cl− uptake through the Nkcc1, Ae4 and Ae2, which results in a rise in [Na+]i and a fall in (Fig. 3. A & D).
Nauntofte (1992) describes the Nhe1 exchanger as the main Na+ pathway of salivary gland acinar cells (approximately 70%). In our model this task is divided between the Nkcc1 and the Nhe1, where the principal pathway is the Nkcc1. Agonist stimulation promotes Cl− influx and efflux through Ae2 and Ae4. The resultant decrease in increases the activity of carbonic anhydrase, thus increasing CO2 influx and intracellular [H+]. This in turn increases the activity of the Nhe1, leading to an increase in [Na+]i (Fig. 3. A), as experimentally observed. This sequence highlights the model’s capability to regulate cellular pH (Fig. 3. E & F).
The increased basal K+ conductance hyperpolarizes the basolateral membrane (Fig. 4. F) while the increased apical Cl− conductance depolarizes the apical membrane (Fig. 4. E). The apical and basolateral membrane potentials agree with experimentally observed results. Pedersen and Petersen (1973) found that at rest the basolateral portion of the acinar cell has a potential of approximately −62.5 mV, our model reaches −62.5 mV. After agonist stimulation they observed a hyperpolarization of about (10–15 mV), while our model predicts that the basolateral membrane hyperpolarizes by 14.7 mV. Following stimulation, the apical membrane is depolarized from −50.24 mV to −41 mV followed by a hyperpolarisation to −55 mV (Fig. 4E & F).
Cl− current from the cell into the lumen increases the lumenal Cl− concentration (Fig. 4. C), which in turn increases the flow of cations through the tight junctions, leading to increases in lumenal Na+ and K+ concentrations also (Fig. 4. A & B).
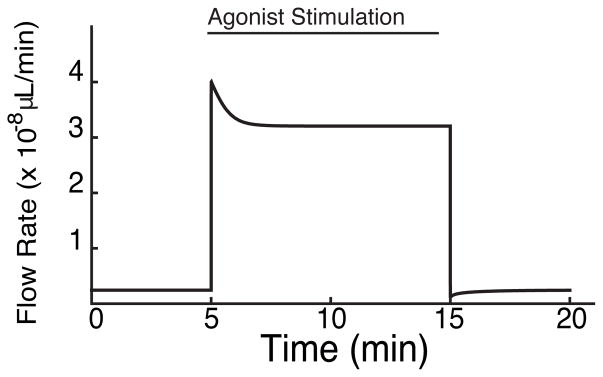
Finally, the ionic concentration dynamics of the cell lead to a 27.3% loss of cellular volume at maximal stimulation (Fig. 4. D), and an increase in the total flow rate. At maximal stimulation (by agonist) the model cell experiences a sharp increase in its total fluid flux from 0.24e-08 μL/min at rest, to 3.2e-08 μL/min. This is an approximate 13 fold increase (Fig. 5).
Fig. 5.
This figure depicts a sharp increase in total fluid flow rate from its resting state of 0.24e-08 μL/min to a maximal flow rate (under agonist stimulation) of 3.2e-08 μL/min, an approximate 13 fold increase. Upon removal of agonist (min. 15) the flow rate returns to its resting value. Note that at rest the flow rate is not zero. This is because the model is constructed in such a way that there is always an ionic concentration gradient between the 3 compartments, which drives fluid flow at rest.
These results validate the model’s qualitative behaviour allowing us to proceed with ‘in-silico’ experimentation (Melvin et al, 2005; Nauntofte, 1992).
3.2 Simulations of Ae2 and Ae4 Knockouts
Ae2 expression is ubiquitous in nearly all secretory epithelia (Frizzell and Hanrahan, 2012), and its activity has been linked to cellular pH regulation. Thus, in acinar cells, it has been suspected to support the secretion process (Evans et al, 2000; Nguyen et al, 2004; Roussa, 2011). Recent studies by Peña-Münzenmayer et al (2015) provided evidence for an alternative Cl− uptake mechanism dependent on the expression of the anion exchanger Ae4. Ae4, like Ae2, is -dependent. Saliva secretion experiments performed on Ae2 and Ae4 knock-out mice showed that Ae4 is important for saliva secretion. Surprisingly, saliva secretion rates were not affected in salivary glands lacking Ae2 exchangers. We use our mathematical model to try to understand the mechanism by which Ae4, but not Ae2, is important for saliva secretion.
To simulate the absence of either the Ae2 or Ae4 we set their respective transporter densities, GAe2 and GAe4, to zero (Appendix 11). Under such conditions the model reaches new steady states that reveal the dynamics associated with the loss of a particular transporter. These new steady states were compared to the complete model i.e., when there was no deletion of any flux (we call this ‘control’, see Figs. 3 to 5).
When the Ae2 flux term is removed, the model behaves qualitatively the same as the control cell. In Fig. 6 we compare intracellular ion concentrations in the model with either Ae2 or Ae4 removed (blue and red lines respectively). The control case is shown as a black line. Since, in each panel, the blue and black lines are very similar, we see that removal of Ae2 has no significant effect on intracellular ion concentrations, or on [CO2]i or pH.
Fig. 6.
Intracellular ion concentrations in the model with either Ae2 or Ae4 removed (blue and red, respectively) compared to the control cell (black). Knockout of Ae2 has no significant effect on the model responses (the blue and black lines are very similar in each panel). Knockout of Ae4 causes a significant decrease in [Cl−]i (panel C), and significant increases in [K+]i, [Na+]i and (panels A, B and D). For both knockouts, pH and [CO2]i remain almost unchanged (panels E and F).
Conversely, when the Ae4 flux term is removed, we see a drop in resting [Cl−]i (Fig. 6. C) and increases in [K+]i, [Na+]i and (Fig. 6. A, B & D respectively). As with Ae2 removal, there is no significant effect on [CO2]2 or pH (Fig. 6. E & F).
After application of agonist [Cl−]i reaches a significantly lower steady state than that of the control. This corresponds to the data shown in Fig. 1 C,D, of Peña-Münzenmayer et al (2015). These data show that recovery of [Cl−]i is slower in Ae4 knockout mice than in control mice or Ae2 knockout mice. Our model results (Fig. 6. C) show the same qualitative behaviour, with [Cl−]i recovery being the same speed in control and Ae2 knockout simulations, and being significantly slower in the Ae4 knockout case (mins 10 to 20).
A similar pattern is seen in the membrane potentials and the lumenal concentrations (Fig. 7). Removal of Ae2 makes no significant difference, while removal of Ae4 causes a hyperpolarisation of the apical membrane (Fig. 7. D), a small depolarisation of the basolateral membrane (Fig. 7. E), and significant decreases in all lumenal concentrations (Fig. 7. A, B & C).
Fig. 7.
Voltages and lumenal ion concentrations in the model with either Ae2 or Ae4 removed (blue and red, respectively) compared to the control cell (black). A, B & C: Removal of Ae4 causes less Cl− transport, and thus lower lumenal ion concentrations. D & E: Ae2 deletion does not result in changes of the membrane potentials. Ae4 deletion, which causes a decrease in Cl− concentration (lumenal and intracellular), leads to hyperpolarization of the apical membrane. At the basolateral membrane a decreased NaK-ATPase and CaKC flux results in a small membrane depolarisation.
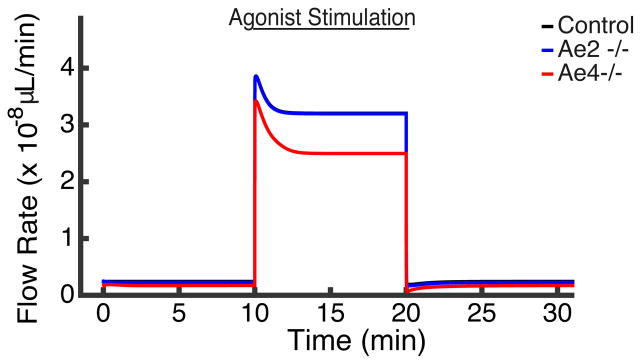
These differences in ion concentrations are reflected in the rates of secretion in the Ae2 or Ae4 knockout simulations (Fig. 8). Since Ae2 knockout has little effect on ion concentrations or membrane potentials, it has little effect on fluid transport also. However, the decreased lumenal Cl− concentration as a result of Ae4 knockout results in significantly decreased fluid transport. However, it is important to note that our model does not capture the correct kinetics of changes in fluid flow. According to Fig. 1 A,B of Peña-Münzenmayer et al (2015), upon agonist stimulation, fluid transport in Ae4 knockout mice first reaches a peak (of approximately the same magnitude as in control mice), but then gradually decreases, over a period of approximately 10 minutes, to a lower level. Our model displays the same qualitative behaviour, but the fluid flow rate in the model Ae4 knockout simulation reaches a new, lower, steady state after only about 2 minutes, considerably faster than what was observed experimentally. The reason for this discrepancy is unclear.
Fig. 8.
The Ae2 knockout cell (blue) displays no significant change in flow rate compared to the control (black), but the Ae4 knockout cell (red) displays around 24% reduction in salivary flow rate compared to the control cell.
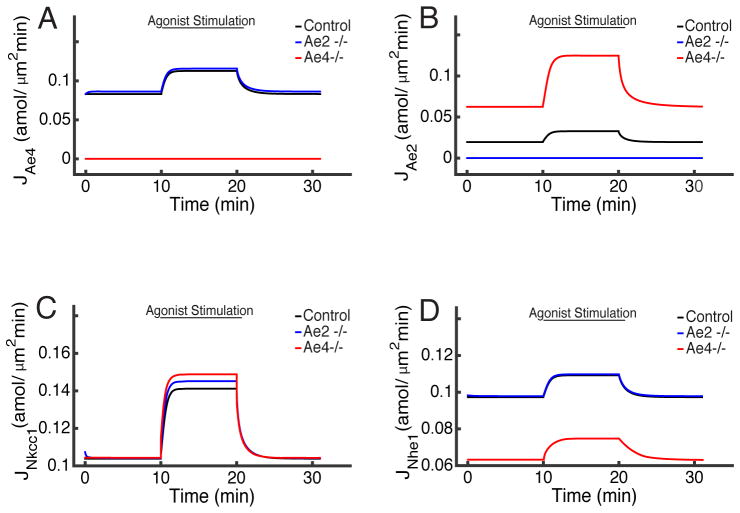
These results suggest that the cell is able to adapt well to loss of the Ae2, but not to loss of the Ae4. We tested the hypothesis that this difference is due to the fact that Ae4 transports cations as well as Cl− and .
In Fig. 9 we show the fluxes in the model in control conditions, and under Ae4 or Ae2 knockout. Knockout of Ae2 causes upregulation of Ae4 (Fig. 9. A) and vice versa (Fig. 9. B). However, and counterintuitively, the model indicates that neither Ae2 nor Ae4 knockout leads to significant activation of the Nkcc1 to compensate for the missing Cl− (Fig. 9. C). This result is in agreement with experimental observations by Peña-Münzenmayer et al (2015) who observed no difference in Nkcc1 activity between control cells and Ae knockouts.
Fig. 9.
Model fluxes under control conditions and Ae4 or Ae2 knockout. A: On Ae2 knockout, the Ae4 increases its activity. B: On Ae4 knockout, the Ae2 increases its activity. C: In Ae2 and Ae4 knockout cells up-regulation of the Nkcc1 is minimal. D: Loss of Ae2 causes an increase in Ae4 activity, which leads to a slight decrease in [Na+]i. As a response, the Nhe1 increases its activity slightly. In contrast, in the Ae4 knockout cell, a high [Na+]i causes a significant decrease in Nhe1 activity (red).
Instead, the rise in [Na+]i caused by Ae4 knockout causes a significant decrease in the Nhe1 flux (Fig. 9. D). Conversely, Ae2 knockout causes an increase in Ae4 activity, which decreases [Na+]i slightly (Fig. 6. A), which causes a slight increase in the Nhe1 flux.
Thus, in summary;
When Ae2 is knocked out, a rise in Ae4 activity increases the outward flow of Na+ and K+, which is offset by a very small rise in Nkcc1 activity, which not only brings in Na+ and K+, but also serves to increase Cl− uptake slightly. A slight rise in Nhe1 activity offsets the fall in [Na+]i and [K+]i, leading to a new steady state where the ion concentrations remain almost unchanged (as shown in Fig. 6).
On the other hand, when Ae4 is knocked out, [Na+]i and [K+]i rise, while [Cl−]i falls. The cell cannot compensate for the rise in [Na+]i and [K+]i by decreasing the Nkcc1, as this would decrease [Cl−]i even further. In fact Nkcc1 flux is raised slightly, exacerbating the problem of increased [Na+]i and [K+]i. This leads to a significant decline in Nhe1 flux, and changes to the acid-base balance. The cell finally reaches a steady state with high [Na+]i, [K+]i and , and low [Cl−]i, leading to a significant decline in fluid transport.
4 Discussion
We constructed a mathematical model with the aim of understanding the experimental results of Peña-Münzenmayer et al (2015). In salivary gland acinar cells transcellular movement of Cl− has been observed to be the rate-limiting step for gland fluid secretion. Ever since the observations of Silva et al (1977) it has been accepted that the Nkcc1 is responsible for the majority of the Cl− influx. Experiments by Evans et al (2000) demonstrated that an additional mechanism is partly responsible for introducing Cl− into the cell. The Ae2, a exchanger which has been identified as mainly involved in cellular pH regulation, was hypothesized to be responsible for supporting this influx as the mechanism can be found in nearly all secretory epithelia (Melvin et al, 2005; Nauntofte, 1992). However, the results of Peña-Münzenmayer et al (2015) demonstrate that the Ae2 might not be involved in the secretory process of acinar cells. Instead, a cation-dependent exchanger, the Ae4, may be the primary mechanism supporting Cl− influx through the Nkcc1, and hence a key mechanism in salivary gland acinar fluid secretion. Our model aimed to explore two basic questions:
Can a mathematical model explain these experimental results?
If so, can we explain the cell’s preference for Ae4 (as opposed to Ae2) involvement in the secretion process?
To answer these questions we constructed a mathematical model based on previous work by Gin et al (2007), Maclaren et al (2012), and Palk et al (2010). The Ae2 knockout model’s behaviour was similar to that of the control cell, while the Ae4 knockout model had a significantly decreased fluid flow. One of the most non-intuitive features of this simulation was the response of the Nkcc1. Given that the Nkcc1 is responsible for at least 70% of the cellular Cl− intake (Evans et al, 2000), we expected to see an increased response to account for the loss of a Cl− influx pathway, but no such increase was observed in the model, in either the Ae2 or Ae4 knockouts. This result is in agreement with observations by Peña- Münzenmayer et al (2015) which saw no difference in Nkcc1 activity between knockouts and control.
The Ae4 knockout cell is significantly different from the control cell. Again, we see no large difference in Nkcc1 activity. However, unlike the Ae4 in the absence of Ae2, the Ae2 is unable to increase its activity sufficiently to account for the loss of Ae4. In addition we see that higher concentrations of K+ and Na+ also prevent the Nkcc1 from increasing its activity. On one hand the Ae2 tries to extrude the required to prevent alkalinization of the cell, while the buffer rate slows down to support this. This leads to a decrease in Nhe1 activity which serves to prevent higher [Na+]i. Interestingly, this is consistent with the observations of Nauntofte (1992). On the other hand, there is a decreased NaK-ATPase activity which prevents higher [K+]i, and which comes at the expense of depolarising the basolateral membrane and preventing the efflux of K+. This result supports the observations of Peña-Münzenmayer et al (2015).
Thus our model results support the findings of Peña-Münzenmayer et al (2015), and provide a possible explanation for the difference in behavior seen in Ae4 knockout and Ae2 knockout mice. In particular, the model predicts that the cation dependence of Ae4 exchange is critical for its role in Cl− uptake.
Acknowledgments
This study was supported by the Marsden Fund of the Royal Society of New Zealand (ES and JS), NIDCR grant R01 DE019245-06A1 (ES and JS), the Intramural Research Program of the National Institute of Dental and Craniofacial Research, National Institutes of Health (JEM) and Grant FONDECYT # 11150454 (GPM).
Appendix
1. Na+-K+-2Cl− Co-transporter (Nkcc1)
The Nkcc1 cotransporter expression is ubiquitous in nearly all cells and secretory epithelia (Wang et al, 2003). The Nkcc1-mediated-Cl− uptake mechanism is a secondary active transport i.e., the energy required for its activity comes indirectly from ATP hydrolysis. The Nkcc1 model we use was first constructed by Benjamin and Johnson (1997). The model assumes equilibrium ion binding, binding symmetry, and identity of Cl− binding sites. This results in a 10 state model. Palk et al (2010) and Gin et al (2007) simplified it to a two state model that assumes simultaneous binding and unbinding of Cl−, K+ and Na+. The reaction occurs as follows:
The steady state flux is given by
| (17) |
where αNkcc1 is the density of the co-transporter.
| Nkcc1 | Description | Value | Units |
|---|---|---|---|
| α Nkcc1† | Membrane density | 2.15 | amol/μm3 |
| a1 | Rate | 157.5 | s−1 |
| a2 | Rate | 2.0096×10⁷ | mM−4 s−1 |
| a3 | Rate | 1.0306 | s−1 |
| a4 | Rate | 1.3852×10⁶ | mM−4 s−1 |
Parameter value determined from the model.
Parameter values taken from Palk et al (2010).
2. Na+/K+ ATPase Pump (NaK)
The Na+/K+ ATPase pump extrudes 3 Na+ ions whilst introducing 2 K+ ions against their electrochemical gradients at the expense of hydrolysing an ATP molecule per cycle. The net reaction for the pump cycle is
where Pi represents the intracellular concentration of phosphate (a result of ATP conversion to ADP). Smith and Crampin (2004) constructed a mathematical model of the NaK-ATPase pump intended to be used as a component in whole-cell myocyte modeling with the objective to predict pump function and whole myocyte behaviour when cellular metabolism is compromised. Palk et al (2010) reduced the model to two states:
where I refers to an ‘Inside’ state and O to an ‘Outside’ state. The simplification assumes that external Na+ and internal K+ ions simultaneously bind and unbind and are supplied at a constant rate. In addition, the forward reaction rates are higher than the reverse and that the steady state flux through the pump is given by
| (18) |
where αNaK is the density of the pump.
| NaK-ATPase | Description | Value | Units |
|---|---|---|---|
| α NaK† | Membrane density | 4.84 | amol/μm3 |
| r | Rate | 1.305×10⁶ | mM−3 s−1 |
| α1 | Half Saturation | 0.641 | mM−1 |
Parameter value determined from the model.
Parameter values taken from Palk et al (2010).
3. Ca2+-activated-K+ Channel (CaKC)
Takahata et al (2003) characterised the biophysical and pharmacological properties of native TEA-insensitive Ca2+ activated currents in bovine parotid acinar cells. In their study they developed a mathematical model that describes the basolateral CaKC current. The open probability of the channel is given by
| (19) |
where η2 = 2.54 is the Hill coefficient and KCaKC the dissociation constant (a function of the potential difference across the membrane). We used the value found by Palk et al (2010) of 0.182 μM, as we require a small open probability at steady-state Ca2+ concentrations. The flux is defined as
| (20) |
with Nernst potential
| (21) |
where zK = +1, the ion’s valence.
4. Ca2+-activated-Cl− Channel (CaCC)
Frizzell and Hanrahan (2012) demonstrated that the apical CaCC channels are activated at low Ca2+ concentrations by membrane depolarization and when Ca2+ reaches micromolar concentrations. As a simplification we used a model similar to that of Takahata et al (2003). Previous mathematical models for the acinar cell have used the model of Arreola et al (2002). We found that there is no qualitative difference between the models. The CaCC model predicts a large maximum single channel conductance. With a Hill coefficient of η1 = 1.46 and a dissociation constant of KCaCC = 0.26μM. The open probability is given by
| (22) |
In this way the flux is defined as
| (23) |
with Nernst potential
| (24) |
where zCl = −1, the ion’s valence.
5. SLC4A2 Anion exchanger (Ae2)
We use a model created by Falkenberg and Jakobsson (2010). It relies on a concentration gradient i.e., it uses the gradient to pump Cl− into the cell. The energy required for this exchange is derived from the NaK-ATPase activity (Roussa et al, 2001). Its flux depends on the ionic concentrations in the cytoplasm and interstitium, the number of binding sites, and the half saturation constants. The model evaluates the product of two terms and the exchanger’s conductance which is proportional to the density of active membrane proteins. The contribution from the concentrations and binding site properties, represented by the Michaelis-Menten terms. Additionally as a simplification, we include the difference of the transporter in reverse which renders the exchanger bidirectional.
| (25) |
| Ae2 | Description | Value | Units |
|---|---|---|---|
| GAe2† | Ae2 activity | 0.01807 | fmol/s |
| KCl | Half-saturation | 5.6 | mM |
| KB | Half-saturation | 104 | mM |
Parameter derived from the model.
Parameters from Falkenberg and Jakobsson (2010).
6. Na+/H+ exchanger (Nhe1)
Similarly to the Ae2 exchanger, our model for the Nhe1 exchanger is based on Falkenberg and Jakobsson (2010). Its flux is given by
| (26) |
| Nhe1 | Description | Value | Units |
|---|---|---|---|
| GNhe1† | Nhe1 activity | 0.0305 | fmol/s |
| KH | Half-saturation | 4.5×10⁻⁴ | mM |
| KNa | Half-saturation | 15 | mM |
Parameter derived from the model.
Parameters from Falkenberg and Jakobsson (2010).
7. SLC4A9 Anion Exchanger (Ae4)
The anion exchanger 4 transports interstitial Cl− into the cell whilst extruding 2 ions and Na+-like monovalent cations (per cycle). In our model the only monovalent cation, other than Na+, is K+. However, it has been suggested that Cs+, Li+, and Rb+ are also extruded through the Ae4 (Peña-Münzenmayer et al, 2016).
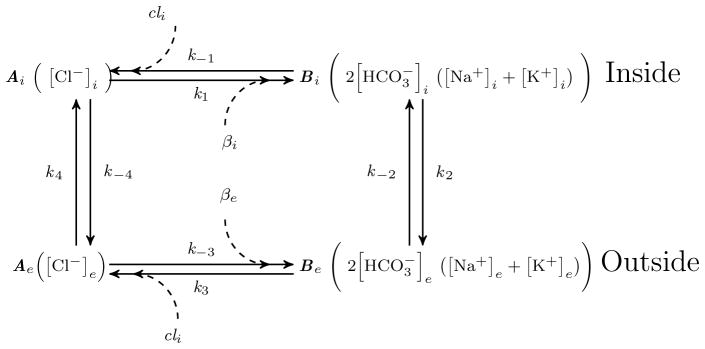
We modeled the Ae4 exchanger as a Markov state model for a single exchanger (Dupont et al, 2016). We assume 2 conformational states 1); the exchanger working forwards and the backward reaction with the binding site exposed in the interior (Ai and Bi) and 2); with the binding site exposed on the exterior (Ae and Be), respectively (Fig. 10). The lower-case notation cl, , na+, and k+ denotes the concentration of each ion respectively. As a simplification we have assumed simultaneous binding and unbinding of ions to the exchanger. The equations that describe the exchanger under this model are
Fig. 10.
Schematic diagram of the Markov state model of a bidirectional Ae4 exchanger.
| (27) |
| (28) |
| (29) |
| (30) |
Where ; for j = i, e. Eq. (30), is a conservation equation. The steady-state flux is
where Ki = k−i/ki, and i = 1, …, 4. The values γj, where j = 1, …, 7, are a condensed form to write the combination of the different parameters that make the equation. After some careful algebraic manipulation, it can be shown that the expression above simplifies to:
| (31) |
where GAe4 (with units of fmol) denotes the density of exchangers. Thus JAe4 has units of concentration/time. The parameters, k+ and k−, are the association and dissociation rates, respectively. These were found by solving the bicarbonate steady state equation (eq. 4).
| Ae4 | Description | Value | Units |
|---|---|---|---|
| GAe4 | Density of Ae4 | 0.66 | amol/μm3 |
| k+ | Rate | 1.92×10⁻² | mM−4 s−1 |
| k− | Rate | 1.3×10⁻⁵ | mM−4 s−1 |
Parameter values determined from the model.
8. CO2 transport and buffering
The acinar cell’s membrane is permeable to CO2 which diffuses down its concentration gradient into the cytoplasm where it combines with water to form carbonic acid (H2CO3). Carbonic anhydrases catalyze the reaction and dissociate the acid quickly into H+ ions and ions. For simplicity, we assume the reaction occurs as follows:
Using the law of mass action, and assuming chemical equilibrium, we have
Diffusion across both membranes is modeled as
PCO2 is the membrane permeability to CO2 (same for both membranes). From the reaction above, we can derive (using the law of mass action) a term for the production of and H+ that is proportionally dependent on the influx of CO2,
| Buffer | Description | Value | Units |
|---|---|---|---|
| k1 | Rate | 11 | s−1 |
| k−1 | Rate | 2.6×10⁴ | s−1 |
| PCO2 | Membrane CO2 transport rate | 1.97×10⁻¹³ | s−1 |
Parameter values taken from Sharp et al (2015).
9. Electroneutrality
It is a constraint of the model that the interstitium, the cellular media, and the acinar lumen must maintain electroneutrality. For instance, in the cellular compartment we keep track of 6 ionic species. However, in reality there are many more. The number of moles of large negatively charged molecules (with valence zx ≤ −1) that are impermeable to the cellular membrane and thus trapped inside the cell, is denoted xi. To find its value we note,
| (32) |
where ωi is the volume of the cell. We solve for xi,
| (33) |
Similarly, in the acinar lumen and the interstitium we must have:
| (34) |
| (35) |
10. Tight Junction
The tight junction currents are given by a linear current-voltage (I–V) relationship:
| (36) |
| (37) |
Here zNa = +1 and zK = +1, correspond to the valence of each ion species, respectively. and are their respective Nernst potentials:
The potential at the tight junction, Vt, is given as:
11. Other parameters of the model
Table 2.
Parameters of the model
| Parameter | Description | Value | Units | |
|---|---|---|---|---|
| GCaCC† | Max. conductance for CaCC | 71.3 | nS | |
| GCaKC† | Max. conductance for CaKC | 30.4 | nS | |
|
|
Max. conductance of paracellular Na+ | 12.46 | nS | |
|
|
Max. conductance of paracellular K+ | 0.9 | nS | |
| ωi0‡ | Cellular volume | 1.3 | pL | |
| ωl/ωi0‡ | Lumen to cell volume ratio | 0.02 | - | |
| Pa‡ | Apical membrane’s water permeabitlity | 4.32×10⁻¹² | L2 mol−1 s−1 | |
| Pb‡ | Basolateral membrane’s water permeability | 5.15 ×10⁻¹¹ | L2 mol−1 s−1 | |
| Pt‡ | Tight junction’s water permeability | 2.6×10⁻¹³ | L2 mol−1 s−1 | |
| R* | Universal gas constant | 8.3144621 | J mol−1 K−1 | |
| T | Temperature | 310 | K | |
| F★ | Faraday’s constant | 96485.3365 | C mol−1 |
Parameters determined from the model.
Parameter values taken from Palk et al (2010).
Parameter values taken from DeBiévre et al (1994).
Parameter values taken from Moldover et al (1988).
References
- Catalán AM, Nakamoto T, Melvin EJ. The salivary gland fluid secretion mechanism. The Journal of Medical Investigation. 2009;56(Supplement):192–196. doi: 10.2152/jmi.56.192. [DOI] [PubMed] [Google Scholar]
- Arreola J, Begenisich T, Nehrke K, Nguyen HV, Park K, Richardson L, Yang B, Schutte BC, Lamb FS, Melvin JE. Secretion and cell volume regulation by salivary acinar cells from mice lacking expression of the Clcn3 Cl− channel gene. The Journal of Physiology. 2002;545(1):207–216. doi: 10.1113/jphysiol.2002.021980. [DOI] [PMC free article] [PubMed] [Google Scholar]
- Benjamin B, Johnson E. A quantitative description of the Na-K-2Cl cotransporter and its conformity to experimental data. American Journal of Physiology-Renal Physiology. 1997;273(3):F473–F482. doi: 10.1152/ajprenal.1997.273.3.F473. [DOI] [PubMed] [Google Scholar]
- Bruce J, Shuttleworth T, Giovannucci D, Yule D. Phosphorylation of Inositol 1, 4, 5-Trisphosphate Receptors in Parotid Acinar Cells. A Mechanism For The Synergistic Effects of cAMP on Ca2+ Signaling. Journal of Biological Chemistry. 2002;277(2):1340–1348. doi: 10.1074/jbc.M106609200. [DOI] [PubMed] [Google Scholar]
- Crampin EJ, Smith NP, Langham AE, Clayton RH, Orchard CH. Acidosis in models of cardiac ventricular myocytes. Philosophical Transactions of the Royal Society of London A: Mathematical, Physical and Engineering Sciences. 2006;364(1842):1171–1186. doi: 10.1098/rsta.2006.1763. [DOI] [PubMed] [Google Scholar]
- DeBiévre P, Valkiers S, Schaefer F, Peiser H, Seyfried P. High-accuracy isotope abundance measurements for metrology. PTB-Mitteilungen. 1994;104(4):225–236. [Google Scholar]
- Delporte C, Steinfeld S. Distribution and roles of aquaporins in salivary glands. Biochimica et Biophysica Acta (BBA)-Biomembranes. 2006;1758(8):1061–1070. doi: 10.1016/j.bbamem.2006.01.022. [DOI] [PubMed] [Google Scholar]
- Dupont G, Falcke M, Kirk V, Sneyd J. Models of Calcium Signalling. Interdisciplinary Applied Mathematics. 2016:43. [Google Scholar]
- Evans RL, Park K, Turner RJ, Watson GE, Nguyen HV, Dennett MR, Hand AR, Flagella M, Shull GE, Melvin JE. Severe impairment of salivation in Na+/K+/2Cl− cotransporter (NKCC1)-deficient mice. Journal of Biological Chemistry. 2000;275(35):26,720–26,726. doi: 10.1074/jbc.M003753200. [DOI] [PubMed] [Google Scholar]
- Falkenberg C, Jakobsson E. A biophysical model for integration of electrical, osmotic, and ph regulation in the human bronchial epithelium. Biophysical Journal. 2010;98(8):1476–1485. doi: 10.1016/j.bpj.2009.11.045. [DOI] [PMC free article] [PubMed] [Google Scholar]
- Foskett JK, Melvin JE. Activation of salivary secretion: coupling of cell volume and [Ca2+]i in single cells. Science. 1989;244(4912):1582–1585. doi: 10.1126/science.2500708. [DOI] [PubMed] [Google Scholar]
- Frizzell R, Hanrahan J. Physiology of epithelial chloride and fluid secretion. Cold Spring Harbor Perspectives in Medicine. 2012;2(6):a009,563. doi: 10.1101/cshperspect.a009563. [DOI] [PMC free article] [PubMed] [Google Scholar]
- Gin E, Crampin EJ, Brown DA, Shuttleworth TJ, Yule DI, Sneyd J. A mathematical model of fluid secretion from a parotid acinar cell. Journal of Theoretical Biology. 2007;248(1):64–80. doi: 10.1016/j.jtbi.2007.04.021. [DOI] [PMC free article] [PubMed] [Google Scholar]
- Gordon R. Essentials of Human Physiology. Vol. 55. Year Book Medical Publishers; Chicago: 1982. [Google Scholar]
- Grinstein S, Foskett JK. Ionic mechanisms of cell volume regulation in leukocytes. Annual Review of Physiology. 1990;52(1):399–414. doi: 10.1146/annurev.ph.52.030190.002151. [DOI] [PubMed] [Google Scholar]
- Jayaraman S, Song Y, Vetrivel L, Shankar L, Verkman A. Noninvasive in vivo fluorescence measurement of airway-surface liquid depth, salt concentration, and pH. The Journal of Clinical Investigation. 2001;107(3):317–324. doi: 10.1172/JCI11154. [DOI] [PMC free article] [PubMed] [Google Scholar]
- Kunkel P, Mehrmann VL. Differential-algebraic equations: analysis and numerical solution. European Mathematical Society; 2006. [Google Scholar]
- Lau K, Case R. Evidence for apical chloride channels in rabbit mandibular salivary glands. Pflügers Archiv. 1988;411(6):670–675. doi: 10.1007/BF00580864. [DOI] [PubMed] [Google Scholar]
- Locker D. Xerostomia in older adults: a longitudinal study. Gerodontology. 1995;12(1):18–25. doi: 10.1111/j.1741-2358.1995.tb00125.x. [DOI] [PubMed] [Google Scholar]
- Maclaren OJ, Sneyd J, Crampin EJ. Efficiency of primary saliva secretion: an analysis of parameter dependence in dynamic single-cell and acinus models, with application to aquaporin knockout studies. The Journal of Membrane Biology. 2012;245(1):29–50. doi: 10.1007/s00232-011-9413-3. [DOI] [PMC free article] [PubMed] [Google Scholar]
- Mangos J, McSherry NR, Nousia-Arvanitakis S, Irwin K. Secretion and transductal fluxes of ions in exocrine glands of the mouse. American Journal of Physiology. 1973;225(1):18–24. doi: 10.1152/ajplegacy.1973.225.1.18. [DOI] [PubMed] [Google Scholar]
- Martinez J, Cassity N. Effect of transport inhibitors on secretion by perfused rat submandibular gland. The American journal of physiology. 1983;245(5 Pt 1):G711–6. doi: 10.1016/j.archoralbio.2010.06.012. [DOI] [PubMed] [Google Scholar]
- Melvin JE, Yule D, Shuttleworth T, Begenisich T. Regulation of fluid and electrolyte secretion in salivary gland acinar cells. Annual Review of Physiology. 2005;67:445–469. doi: 10.1146/annurev.physiol.67.041703.084745. [DOI] [PubMed] [Google Scholar]
- Mignogna M, Fedele S, Russo LL, Muzio LL, Wolff A. Sjögren’s syndrome: the diagnostic potential of early oral manifestations preceding hyposalivation/ xerostomia. Journal of Oral Pathology & Medicine. 2005;34(1):1–6. doi: 10.1111/j.1600-0714.2004.00264.x. [DOI] [PubMed] [Google Scholar]
- Moldover M, Trusler J, Edwards T, Mehl J, Davis R. Measurement of the universal gas constant R using a spherical acoustic resonator. Physical Review Letters. 1988;60(4):249. doi: 10.1103/PhysRevLett.60.249. [DOI] [PubMed] [Google Scholar]
- Nauntofte B. Regulation of electrolyte and fluid secretion in salivary acinar cells. American Journal of Physiology-Gastrointestinal and Liver Physiology. 1992;263(6):G823–G837. doi: 10.1152/ajpgi.1992.263.6.G823. 0193-1857/92. [DOI] [PubMed] [Google Scholar]
- Nguyen HV, Stuart-Tilley A, Alper SL, Melvin JE. exchange is acetazolamide sensitive and activated by a muscarinic receptor-induced [Ca2+]i increase in salivary acinar cells. American Journal of Physiology-Gastrointestinal and Liver Physiology. 2004;286(2):G312–G320. doi: 10.1016/j.ceca.2014.01.005. [DOI] [PubMed] [Google Scholar]
- Niedermeier W, Matthaeus C, Meyer C, Staar S, Müller RP, Schulze HJ. Radiation-induced hyposalivation and its treatment with oral pilocarpine. Oral Surgery Oral Medicine Oral Pathology Oral Radiology A and Endodontics. 1998;86(5):541–549. doi: 10.1016/S1079-2104(98)90343-2. [DOI] [PubMed] [Google Scholar]
- Novak I, Young J. Two independent anion transport systems in rabbit mandibular salivary glands. Pflügers Archiv. 1986;407(6):649–656. doi: 10.1007/BF00582647. [DOI] [PubMed] [Google Scholar]
- Ogawa Y, Fernley R, Ito R, Ijuhin N. Immunohistochemistry of carbonic anhydrase isozymes VI and II during development of the rat salivary glands. Histochemistry and Cell Biology. 1998;110(1):81–88. doi: 10.1007/s004180050268. [DOI] [PubMed] [Google Scholar]
- Palk L, Sneyd J, Shuttleworth TJ, Yule DI, Crampin EJ. A dynamic model of saliva secretion. Journal of Theoretical Biology. 2010;266(4):625–640. doi: 10.1016/j.jtbi.2010.06.027. [DOI] [PMC free article] [PubMed] [Google Scholar]
- Pedersen G, Petersen O. Membrane potential measurement in parotid acinar cells. The Journal of physiology. 1973;234(1):217. doi: 10.1113/jphysiol.1973.sp010342. [DOI] [PMC free article] [PubMed] [Google Scholar]
- Peña-Münzenmayer G, Catalán MA, Kondo Y, Jaramillo Y, Liu F, Shull GE, Melvin JE. Ae4 (Slc4a9) anion exchanger drives Cl− uptake-dependent fluid secretion by mouse submandibular gland acinar cells. Journal of Biological Chemistry. 2015;290(17):10,677–10,688. doi: 10.1074/jbc.M114.612895. [DOI] [PMC free article] [PubMed] [Google Scholar]
- Peña-Münzenmayer G, George TA, Shull EG, Melvin EJ, Catalàn AM. Ae4 (Slc4a9) is an electroneutral monovalent cation-dependent exchanger. Journal of General Physiology. 2016;147(5):423–436. doi: 10.1085/jgp.201611571. [DOI] [PMC free article] [PubMed] [Google Scholar]
- Roussa E. Channels and transporters in salivary glands. Cell and Tissue Research. 2011;343(2):263–287. doi: 10.1007/s00441-010-1089-y. [DOI] [PubMed] [Google Scholar]
- Roussa E, Alper S, Thévenod F. Immunolocalization of anion exchanger AE2, Na+/H+ exchangers NHE1 and NHE4, and vacuolar type H+-ATPase in rat pancreas. Journal of Histochemistry & Cytochemistry. 2001;49(4):463–474. doi: 10.1155/2013/840121. [DOI] [PubMed] [Google Scholar]
- Sharp K, Crampin E, Sneyd J. A spatial model of fluid recycling in the airways of the lung. Journal of Theoretical Biology. 2015;382:198–215. doi: 10.1016/j.jtbi.2015.06.050. [DOI] [PMC free article] [PubMed] [Google Scholar]
- Silva P, Stoff J, Field M, Fine L, Forrest J, Epstein F. Mechanism of active chloride secretion by shark rectal gland: role of Na-K-ATPase in chloride transport. American Journal of Physiology-Renal Physiology. 1977;233(4):F298–F306. doi: 10.1038/ki.1996.224. [DOI] [PubMed] [Google Scholar]
- Smith N, Crampin E. Development of models of active ion transport for whole-cell modelling: cardiac sodium–potassium pump as a case study. Progress in Biophysics and Molecular Biology. 2004;85(2):387–405. doi: 10.1016/j.pbiomolbio.2004.01.010. [DOI] [PubMed] [Google Scholar]
- Soltoff S, McMillian M, Cantley L, Cragoe E, Talamo B. Effects of muscarinic, alpha-adrenergic, and substance P agonists and ionomycin on ion transport mechanisms in the rat parotid acinar cell. the dependence of ion transport on intracellular calcium. The Journal of General Physiology. 1989;93(2):285–319. doi: 10.1085/jgp.93.2.285. [DOI] [PMC free article] [PubMed] [Google Scholar]
- Takahata T, Hayashi M, Ishikawa T. SK4/IK1-like channels mediate TEA-insensitive, Ca2+-activated K+ currents in bovine parotid acinar cells. American Journal of Physiology-Cell Physiology. 2003;284(1):C127–C144. doi: 10.1152/ajpcell.00250.2002. [DOI] [PubMed] [Google Scholar]
- Thaysen JH, Thorn NA, Schwartz IL. Excretion of sodium, potassium, chloride and carbon dioxide in human parotid saliva. American Journal of Physiology. 1954;178(1):155–159. doi: 10.1152/ajplegacy.1954.178.1.155. [DOI] [PubMed] [Google Scholar]
- Wang H, Yan Y, Kintner D, Lytle C, Sun D. GABA-mediated trophic effect on oligodendrocytes requires Na-K-2Cl cotransport activity. Journal of Neurophysiology. 2003;90(2):1257–1265. doi: 10.1523/JNEUROSCI.2569-04.2004. [DOI] [PubMed] [Google Scholar]
- Young J, Schögel E. Micropuncture investigation of sodium and potassium excretion in rat submaxillary saliva. Pflüger’s Archiv für die gesamte Physiologie des Menschen und der Tiere. 1966;291(1):85–98. doi: 10.1007/BF00362654. [DOI] [PubMed] [Google Scholar]
- Young JA. Microperfusion investigation of chloride fluxes across the epithelium of the main excretory duct of the rat submaxillary gland. Pflügers Archiv. 1968;303(4):366–374. doi: 10.1007/BF00596392. [DOI] [PubMed] [Google Scholar]
- Yusuke I, Hiroshi NC, Yoshizaki M, Gen P. Evidence for the osmotic flow across dog submaxillary gland epithelia as a cause of salivary secretion. The Japanese Journal of Physiology. 1973;23(6):635–644. doi: 10.2170/jjphysiol.23.635. [DOI] [PubMed] [Google Scholar]


