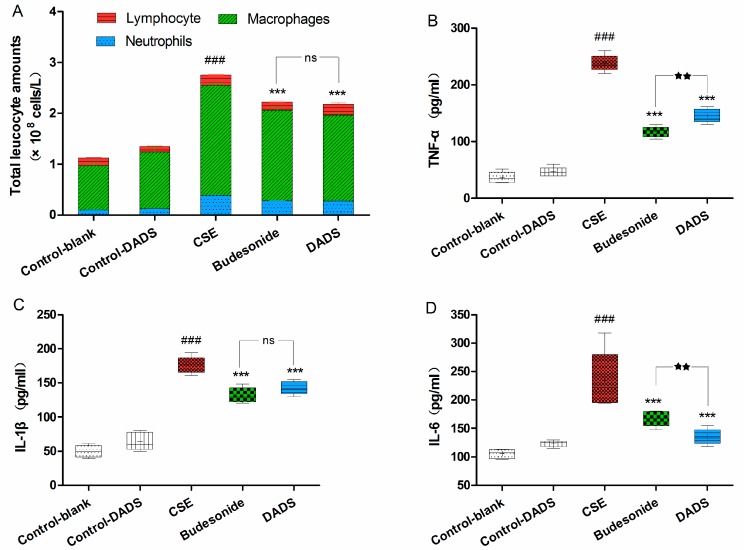
Figure 3.
Evaluation of cell influx in the bronchoalveolar lavage fluid (BALF) and the levels of inflammation cytokines in lung homogenate. (A) Total cell number and the percentage of macrophage, neutrophil, and lymphocyte count in BALF. Levels of TNF-α (B); IL-1β (C) and IL-6 (D). Data are expressed as mean ± SEM, n = 6 rats per group. ### p < 0.001 vs. the blank control group; *** p < 0.001 vs. the CSE group; ★★★ p < 0.001 vs. the budesonide group; ★★ p < 0.01 vs. budesonide group; ns not significantly p > 0.05.

