

Summary
Two-stage least squares estimation is popular for structural equation models with unmeasured confounders. In such models, both the outcome and the exposure are assumed to follow linear models conditional on the measured confounders and instrumental variable, which is related to the outcome only via its relation with the exposure. We consider data where both the outcome and the exposure may be incompletely observed, with particular attention to the case where both are censored event times. A general class of two-stage minimum distance estimators is proposed that separately fits linear models for the outcome and exposure and then uses a minimum distance criterion based on the reduced-form model for the outcome to estimate the regression parameters of interest. An optimal minimum distance estimator is identified which may be superior to the usual two-stage least squares estimator with fully observed data. Simulation studies demonstrate that the proposed methods perform well with realistic sample sizes. Their practical utility is illustrated in a study of the comparative effectiveness of colon cancer treatments, where the effect of chemotherapy on censored survival times may be confounded with patient status.
Keywords: Censored data, Endogeneity, Instrumental variable, Resampling, Unmeasured confounder
1. Introduction
Confounding is a leading cause of bias in observational studies. Regression adjustment or propensity score methods may be used to overcome confounding, but they require that all confounders be observed. Using econometric terminology, the exposure variable is said to be endogenous when the exposure is correlated with an error term due to sharing unmeasured confounders. Endogeneity may also occur in randomized trials when there is noncompliance, which may be related to unobserved variables that are risk factors for the outcome. In such cases, the usual regression estimators may not be consistent.
An instrumental variable methodology yields an unbiased estimator of the effect of an
endogenous exposure. Although the requirements of an instrumental variable depend on the
particular analytical method, the following three conditions are commonly used Brookhart et al., 2010: (i) an instrumental variable
 has a causal effect on an exposure
 ; (ii)
  affects an
outcome
affects an
outcome  only through the exposure
 ; (iii)
  is
unrelated to measured and unmeasured confounders
is
unrelated to measured and unmeasured confounders  and
and
 . In randomized trials, a randomization
assignment indicator is often used as an instrumental variable (Robins & Tsiatis, 1991; Loeys &
Goetghebeur, 2003; Loeys et al., 2005; Nie et al., 2011) to estimate causal treatment
effects.
. In randomized trials, a randomization
assignment indicator is often used as an instrumental variable (Robins & Tsiatis, 1991; Loeys &
Goetghebeur, 2003; Loeys et al., 2005; Nie et al., 2011) to estimate causal treatment
effects.
Structural linear equation modelling is popular for estimating causal effects in the
instrumental variable setting and provides the foundation for our instrumental variable
method. The outcome model of interest relates  to
to
 and
and  via a
linear model, and the exposure model relating
via a
linear model, and the exposure model relating  to
to
 and
and  is also
specified via a linear model. The regression parameters in the outcome model are identified
by the instrumental variable. In the absence of measured confounders, an instrumental
variable estimator may be obtained as the ratio of two covariance estimators. In the case
where there are confounders, the generalized method of moments (Hansen, 1982) or two-stage least squares estimation (Anderson & Rubin, 1950) may be used with complete
data. Our approach builds upon these earlier methods to accommodate missing data
set-ups.
is also
specified via a linear model. The regression parameters in the outcome model are identified
by the instrumental variable. In the absence of measured confounders, an instrumental
variable estimator may be obtained as the ratio of two covariance estimators. In the case
where there are confounders, the generalized method of moments (Hansen, 1982) or two-stage least squares estimation (Anderson & Rubin, 1950) may be used with complete
data. Our approach builds upon these earlier methods to accommodate missing data
set-ups.
Considerable work has been done in settings where both the outcome and the exposure are fully observed and assumed to satisfy either semiparametric linear or nonlinear or nonparametric structural equation models with unspecified error distributions (Anderson & Rubin, 1950; Amemiya, 1974; Newey, 1990; Newey & Powell, 2003). The popular two-stage least squares estimator has an explicit form, with a well-characterized sampling distribution and plug-in variance estimation, making inference straightforward (Bollen, 1996). However, if either outcome or exposure is incompletely observed, such methods are not applicable. There has been limited work addressing two-stage instrumental variable estimation in such settings.
While the two-stage methods we propose are generally applicable to cases with incomplete data, in this article our focus is on right-censored data. There have been attempts to extend classical two-stage instrumental variable estimators. Robins & Tsiatis (1991) developed instrumental variable methods for correcting noncompliance in randomized trials by using a rank-preserving structural failure time model. This model is an alternative to the usual two-stage model, which is tailored to failure time data. A limitation is that the semiparametric estimation methods require that censoring times always be known, as with fixed follow-up, and hence censoring due to drop-out is not permitted. Brännäs (2000) considered ad hoc two-stage instrumental variable estimators for linear structural equation models, which are adaptations of a symmetric trimmed least squares estimator (Powell, 1986) and a Buckley & James (1979) estimator for right-censored data. However, the theoretical properties of these procedures were not investigated and a rigorous investigation of two-stage instrumental variable estimation in linear models with right censoring does not seem to be available in the literature. Loeys & Goetghebeur (2003) proposed instrumental variable methods for the effect of treatment received in a randomized trial with all-or-nothing compliance based on a proportional hazards model. These methods were extended to permit other covariates in the proportional hazards model (Loeys et al., 2005). Li et al. (2015) and Tchetgen Tchetgen et al. (2015) developed two-stage least squares estimators for an additive hazard model. Nie et al. (2011) proposed an efficient instrumental variable estimator for comparing survival probabilities in randomized trials with noncompliance and administrative censoring, which is an extension of the estimator of Baker (1998).
In § 2, we propose a general framework for two-stage instrumental variable estimation of semiparametric linear structural equation models for outcome and exposure which accommodates incomplete data. The main requirement is that there exist semiparametric methods for fitting linear models to the outcome and exposure. Such methods are well developed for truncated and censored time-to-event outcomes. At stage 1, we fit the exposure model and a reduced form of the outcome model conditional on the instrumental variable. At stage 2, we estimate the regression parameters in the true outcome model using a weighted minimum distance method based on the stage 1 results. This yields a closed-form estimator, for which a particular choice of weight leads to the standard two-stage least squares estimator with fully observed data. For the case of right censoring, the procedure does not require that the censoring time be always observed. We prove that our estimators are consistent and asymptotically normal, and provide a theoretically justified resampling technique for making inferences. The optimal weight is characterized, resulting in a minimum variance estimator which may be superior to the usual two-stage estimator.
In § 3, we discuss details related to the implementation of our semiparametric estimator when either outcome or exposure may be censored, employing existing estimators for accelerated failure time models with right-censored event times. These methods perform well in simulations reported in § 4, where naïve estimation that ignores the unmeasured confounders may produce severely biased estimates of exposure effects. The practical utility of the proposed methods is illustrated by a study of the comparative effectiveness of colon cancer treatments.
2. A general two-stage estimation procedure
2.1. Model and estimation
For  , suppose that
 is an outcome,
 is an exposure variable,
 is a
is a  vector of instrumental
variables,
vector of instrumental
variables,  is a
is a  vector of measured confounders,
and
vector of measured confounders,
and  is an unmeasured confounder.
We consider the linear outcome model
 |
(1) |
where  ,
,
 and
and  .
The unmeasured confounder is captured by
.
The unmeasured confounder is captured by  , which is a
weighted sum of
, which is a
weighted sum of  and a pure error term
 , i.e.,
 ,
with
,
with  . The
linear exposure model is
. The
linear exposure model is
 |
(2) |
where  ,
,
 ,
,
 ,
,
 and
and 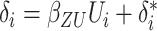 with
with
 . Models (1) and (2) do not permit interactions between observed covariates and the
unmeasured confounder.
. Models (1) and (2) do not permit interactions between observed covariates and the
unmeasured confounder.
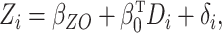
The implied model for  is
is
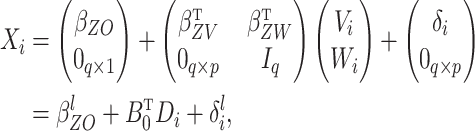 |
(3) |
where  is a
is a
 parameter matrix,
 is the
 zero matrix and
 is the
  -dimensional identity matrix. Substituting
(3) into (1) gives the reduced form of the outcome
model conditional on the instrumental variable and measured confounders but not the
exposure:
-dimensional identity matrix. Substituting
(3) into (1) gives the reduced form of the outcome
model conditional on the instrumental variable and measured confounders but not the
exposure:
 |
(4) |
where  ,
,
 is a
is a  parameter vector and
 .
.
The key to our two-stage estimation procedure is that the reduced-form model (4) is not subject to unmeasured
confounding. This assumption is closely connected to the usual exclusion restriction for
instrumental variable estimation (Angrist et al.,
1996), which implies that  and
hence
and
hence  . Clearly,
 . Since
 and
and  are sums of certain functions of
  and the pure error
terms, the condition
and the pure error
terms, the condition  is necessary for
 .
.
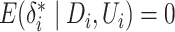
A two-stage estimator will be developed under the assumption that conditional on
 ,
,  are independent and
identically distributed with mean zero and covariance matrix
are independent and
identically distributed with mean zero and covariance matrix  .
A sufficient condition for this mean independence assumption on
.
A sufficient condition for this mean independence assumption on  is that
 , which we call the
instrumental variable independence condition. This implies that the mean of the unmeasured
confounder is the same across the categories generated by the instrumental variable and
the measured confounders.
, which we call the
instrumental variable independence condition. This implies that the mean of the unmeasured
confounder is the same across the categories generated by the instrumental variable and
the measured confounders.
Naïve estimation of model (1) may be
inconsistent because  and
and  are correlated through
 , so
, so  is not equal to zero
in general unless
is not equal to zero
in general unless  .
However, since
.
However, since  in model (4),
  can be consistently estimated using
  .
The proposed instrumental variable estimators require the assumptions below that
consistent and asymptotically normal estimators of
.
The proposed instrumental variable estimators require the assumptions below that
consistent and asymptotically normal estimators of  exist.
Assumption 1.
The estimator
converges in probability to
as
.
Assumption 2.
The random quantity
has a limiting normal distribution with mean zero and covariance matrix
.
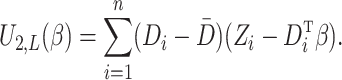
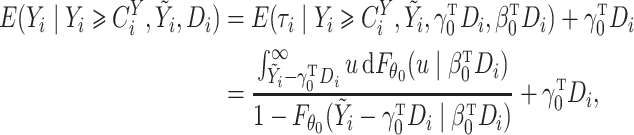
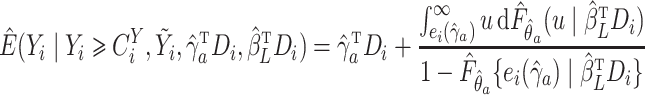
Consistent and asymptotically normal estimators may be obtained by a least squares method for fully observed data or by a Buckley–James method (Buckley & James, 1979) and a rank-based method (Prentice, 1978) for right-censored data. The asymptotic properties of the Buckley–James and rank estimators were studied by Tsiatis (1990), Lai & Ying (1991), Ying (1993) and Jin et al. (2006b). Other incomplete data settings may also be of interest, as discussed in § 6.
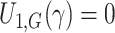
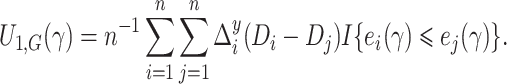
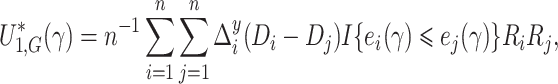
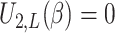
Given consistent estimators  and
and  ,
a consistent estimator for
,
a consistent estimator for  can be obtained by minimizing a
weighted quadratic distance criterion
can be obtained by minimizing a
weighted quadratic distance criterion
 |
where  is a
nonnegative-definite symmetric weight matrix which may be data-dependent, with
is a
nonnegative-definite symmetric weight matrix which may be data-dependent, with
 . The minimum
distance estimator is
. The minimum
distance estimator is
 |
For complete data, the two-stage least squares estimator is obtained by replacing the
exposure with its predicted value calculated from the least squares fit of the exposure
model. Let  and
and  denote matrices with
  th rows
  and
and
 ,
where
,
where  ,
,
 ,
,
 and
and
 . The
two-stage least squares estimator can be written as
. The
two-stage least squares estimator can be written as
 |
where  and
and  . It follows that
 |
which is equivalent to  with
with  and
and 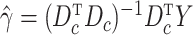 .
.
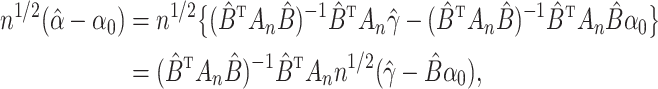
Next, we present the major theoretical results for our general two-stage estimator.
Theorem 1.
Under Assumption 1,
converges in probability to
as
.
Proof.
It follows from the continuous mapping theorem that
which establishes the assertion. □

Theorem 2.
Under Assumptions 1 and 2,
has a normal limiting distribution with mean zero and covariance matrix
, where
.
Proof.
Note that
and that
converges to a zero-mean multivariate normal distribution with covariance matrix
. Therefore, from a multivariate Slutsky’s theorem, with
the result follows easily. □
Although Theorems 1 and 2 may appear straightforward, their generality is useful in converting the problem of finding consistent and asymptotically normal instrumental variable estimators to that of finding well-established estimators for the exposure and reduced outcome linear models. While our focus here is on time-to-event applications with censored outcome or exposure, these theorems are broadly applicable. They accommodate, for example, more complicated time-to-event observation schemes such as left truncation and interval censoring of the outcome as well as missing confounders in either the exposure or the outcome model. In § 3 we present corollaries which give the asymptotic properties of the proposed instrumental variable estimators for right-censored data, based on the properties of existing estimation procedures for right-censored data. Additional corollaries could be established on a case-by-case basis for other missing-data scenarios where estimation methodology is available.
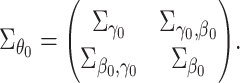
Following well-known results for generalized method of moments estimators, a lower bound
on the covariance matrix of  is
is
 .
This is obtained by taking
.
This is obtained by taking 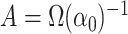 . The
corresponding
. The
corresponding  is obtained by using the
weight
is obtained by using the
weight 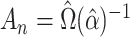 , which
is a consistent estimator for
, which
is a consistent estimator for  if
if
 is consistent for
 . In order to compute
 , we
need an initial estimator that is consistent for
, we
need an initial estimator that is consistent for  . In practice, we could use the initial
estimator
. In practice, we could use the initial
estimator 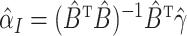 with an identity weight matrix
  . We remark that
this estimator is optimal only within the proposed class of estimators and may not be
fully efficient.
. We remark that
this estimator is optimal only within the proposed class of estimators and may not be
fully efficient.
One can write
 |
Then  .
For the two-stage least squares estimator with complete data,
.
For the two-stage least squares estimator with complete data,  where
where 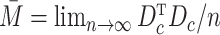 .
.
If the instrumental variable is univariate  and
and
 is nonsingular, then
 and
and
 does not depend on
 . The covariance matrix of
 with
univariate instrumental variable is
with
univariate instrumental variable is  ,
which matches the lower bound in the general case. If there are no confounders, then
,
which matches the lower bound in the general case. If there are no confounders, then
 reduces to
 , which
is the standard instrumental variable estimator (Angrist et
al., 1996).
, which
is the standard instrumental variable estimator (Angrist et
al., 1996).
2.2. A resampling method for variance estimation
Variance estimation for  is of practical importance.
Computational difficulties may arise if the estimation procedures for the exposure and
reduced-form models do not yield simple closed-form estimators for
is of practical importance.
Computational difficulties may arise if the estimation procedures for the exposure and
reduced-form models do not yield simple closed-form estimators for
 . For example, with
right-censored data, complicated nonparametric function estimation may be needed if the
estimating equation for the regression parameter is not smooth enough. This occurs with
rank-based estimators for the accelerated lifetime model, where the variance involves the
derivative of the hazard function of the error term in the linear model. To avoid such
difficulties, resampling methods may be used which require only that the estimating
equations for stage 1 estimation be consistent and asymptotically normal. These methods
are particularly useful when the stage 1 estimators can easily be computed, as is the case
for right-censored accelerated failure time models.
. For example, with
right-censored data, complicated nonparametric function estimation may be needed if the
estimating equation for the regression parameter is not smooth enough. This occurs with
rank-based estimators for the accelerated lifetime model, where the variance involves the
derivative of the hazard function of the error term in the linear model. To avoid such
difficulties, resampling methods may be used which require only that the estimating
equations for stage 1 estimation be consistent and asymptotically normal. These methods
are particularly useful when the stage 1 estimators can easily be computed, as is the case
for right-censored accelerated failure time models.
We propose a general resampling scheme for  which adapts
the work of Jin et al. (2001). The main idea is to
repeatedly perturb and optimize the objective function used for estimation. If the
objective function has a first derivative, then this approach is equivalent to perturbing
the corresponding estimating equation. In Jin et al.
(2001), the empirical variance of the bootstrap estimators is consistent for the
true variance if both the estimating equation and the perturbed estimating equation have
good quadratic approximations around the true parameter values. This assumption holds
quite generally under mild regularity conditions, e.g., complete data estimation under the
which adapts
the work of Jin et al. (2001). The main idea is to
repeatedly perturb and optimize the objective function used for estimation. If the
objective function has a first derivative, then this approach is equivalent to perturbing
the corresponding estimating equation. In Jin et al.
(2001), the empirical variance of the bootstrap estimators is consistent for the
true variance if both the estimating equation and the perturbed estimating equation have
good quadratic approximations around the true parameter values. This assumption holds
quite generally under mild regularity conditions, e.g., complete data estimation under the
 -norm and rank regression. The approach
has been carefully studied in the context of the accelerated lifetime model with
right-censored data, including rank estimation (Jin et
al., 2001, 2006a), Buckley–James
estimation (Jin et al., 2006b), and local
Buckley–James estimation (Pang et al., 2015).
Details for the right-censored instrumental variable estimators are given in the next
section.
-norm and rank regression. The approach
has been carefully studied in the context of the accelerated lifetime model with
right-censored data, including rank estimation (Jin et
al., 2001, 2006a), Buckley–James
estimation (Jin et al., 2006b), and local
Buckley–James estimation (Pang et al., 2015).
Details for the right-censored instrumental variable estimators are given in the next
section.
3. Inference
3.1. Estimating equation framework
We start by sketching our two-stage instrumental variable method, which involves solving
two separate estimating equations. To obtain  and
and
 , we find the roots of the
estimating functions, i.e., the solutions to
, we find the roots of the
estimating functions, i.e., the solutions to  and
and
 where
where
 |
are the estimating equations for models (4) and (2), respectively.
The joint distribution of  and
and  can be generated by iteratively
solving the perturbed estimating equations using the same positive multipliers, whose mean
and variance are 1 and which are independent of the data. Then the asymptotic covariance
matrix of
can be generated by iteratively
solving the perturbed estimating equations using the same positive multipliers, whose mean
and variance are 1 and which are independent of the data. Then the asymptotic covariance
matrix of  and
and  can be estimated by the sample
covariance matrix of the simulated estimators. Let
can be estimated by the sample
covariance matrix of the simulated estimators. Let  denote a vector of random variables used for perturbation. The perturbed estimating
equations are
denote a vector of random variables used for perturbation. The perturbed estimating
equations are
 |
(5) |
 |
(6) |
We perturb the estimating equations by multiplying the summands in the original
estimating equations by the same  , which
ensures that the covariance of the estimating equations is correctly accounted for in the
resampling. For
, which
ensures that the covariance of the estimating equations is correctly accounted for in the
resampling. For  , under mild conditions, the
conditional covariance matrix of
, under mild conditions, the
conditional covariance matrix of  and
and
 given the data
converges to the asymptotic covariance matrix of
given the data
converges to the asymptotic covariance matrix of  and
and
 (Jin et al., 2001). For the accelerated failure time model, the
resampling method used in (5) is
sufficient to generate the marginal distribution of
(Jin et al., 2001). For the accelerated failure time model, the
resampling method used in (5) is
sufficient to generate the marginal distribution of  or
or  (Jin et al., 2003). However, to generate the joint distribution of the
estimators, we need to modify (5), as
discussed later. The resampling of the local Buckley–James estimator is similar to that of
the rank estimator, but is more complex because perturbing the Kaplan–Meier estimator of
an error distribution is needed.
(Jin et al., 2003). However, to generate the joint distribution of the
estimators, we need to modify (5), as
discussed later. The resampling of the local Buckley–James estimator is similar to that of
the rank estimator, but is more complex because perturbing the Kaplan–Meier estimator of
an error distribution is needed.
Suppose that we repeatedly perturb the estimating equations a large number of times, say
 , while fixing the data. Let
 denote the variables used for the
  th perturbation, where
 . Denote by
 and
and
 the corresponding estimators.
Then the covariance matrix of
the corresponding estimators.
Then the covariance matrix of  and
and
 can be estimated by the sample
covariance matrix of
can be estimated by the sample
covariance matrix of  and
and
 . The optimal two-stage
instrumental variable estimator is obtained with the optimal weight
. The optimal two-stage
instrumental variable estimator is obtained with the optimal weight
 , which can be
estimated by taking the inverse of the sample variance of
, which can be
estimated by taking the inverse of the sample variance of  ,
where
,
where  is considered to be fixed. The
asymptotic variance of the optimal two-stage instrumental variable estimator is estimated
by
is considered to be fixed. The
asymptotic variance of the optimal two-stage instrumental variable estimator is estimated
by  or the empirical variance of
  ,
where
,
where 
 is the
 th generated
  .
.
In what follows, we assume that the outcome is right-censored, that is,
 is the log survival time. We consider
several scenarios of right-censored outcomes, which are distinguished by the type of
exposure. Case 1 involves a continuous exposure and Case 2 a binary exposure. Each main
case is divided into two subcases based on whether the exposure is observed via coarsening
or not. Case 1A is when the exposure is fully observed and Case 1B is when the exposure is
censored. Case 2A is when the observed exposure is modelled using a continuous latent
variable model, and Case 2B is when the observed exposure is modelled using a linear
model. Case 2B is important in applications, since the interpretation of the linear model
is more direct than for the latent variable model.
is the log survival time. We consider
several scenarios of right-censored outcomes, which are distinguished by the type of
exposure. Case 1 involves a continuous exposure and Case 2 a binary exposure. Each main
case is divided into two subcases based on whether the exposure is observed via coarsening
or not. Case 1A is when the exposure is fully observed and Case 1B is when the exposure is
censored. Case 2A is when the observed exposure is modelled using a continuous latent
variable model, and Case 2B is when the observed exposure is modelled using a linear
model. Case 2B is important in applications, since the interpretation of the linear model
is more direct than for the latent variable model.
3.2. Case 1A: fully observed continuous exposure
Model (4) is the accelerated failure
time model under the assumption that  are independent error terms with a common but unspecified distribution. Let
 be the vector of log censoring times. The data consist of
  ,
where
,
where  and
and
 . Here,
 takes the value 1 when
 is true and the value 0 otherwise. The
usual censoring assumption is that
is true and the value 0 otherwise. The
usual censoring assumption is that  and
and
 are independent conditionally on
 ,
,  and
and
 . For instrumental variable estimation,
under the exclusion restriction assumption it is necessary to assume that
. For instrumental variable estimation,
under the exclusion restriction assumption it is necessary to assume that
 and
and  are independent conditionally on
  .
.
Define  ,
,
 and
and  .
Note that
.
Note that  and
and  are the counting process and
at-risk process on the residual time scale. The Gehan-type rank estimator
are the counting process and
at-risk process on the residual time scale. The Gehan-type rank estimator
 is a root of
 , where
 |
(7) |
The perturbed version of (7) is
 |
(8) |
where  are
positive random variables with
are
positive random variables with  which are
independent of the data. The perturbation in (8) is more complex than in the usual approach, where each term in the estimating
equation is multiplied by a single
which are
independent of the data. The perturbation in (8) is more complex than in the usual approach, where each term in the estimating
equation is multiplied by a single  . Jin et al. (2006a) showed that the resampling technique
with (8) is valid for correlated
failure time data.
. Jin et al. (2006a) showed that the resampling technique
with (8) is valid for correlated
failure time data.
For fully observed exposure, one may use the least squares estimator. For simplicity, we
assume that  in model (2) are independent with a common
unspecified distribution. The least squares estimator of
in model (2) are independent with a common
unspecified distribution. The least squares estimator of  ,
denoted by
,
denoted by  , is obtained by solving
 , which is the normal
equation, with
, which is the normal
equation, with
 |
(9) |
The perturbed estimating equation is
 |
(10) |
where  are the
same random variables as in (8).
Employing the same perturbations is essential to generating the joint distribution of
are the
same random variables as in (8).
Employing the same perturbations is essential to generating the joint distribution of
 .
.
Below we present a corollary on the asymptotic properties of the two-stage instrumental variable estimator using estimating equations (7) and (9) and a theorem on the validity of the resampling method in (8) and (10) for approximating the asymptotic distribution of the estimator.
Corollary 1.
For Case 1A, the Gehan-type rank estimator from (7) for
, denoted by
, and the least squares estimator in (9) for
, denoted by
, satisfy Assumptions 1 and 2 under Conditions A1–A4 in the Supplementary Material. Therefore, the two-stage estimator
with
and
converges in probability to
and is asymptotically normal by Theorems 1 and 2.
Theorem 3.
For Case 1A, under Conditions A1–A4 in the Supplementary Material, the asymptotic distribution of
can be approximated by the empirical distribution of
from (8) and (10) conditionally on the data.
3.3. Case 1B: censored exposure
Left censoring often occurs in the measurement of biomarkers where assays may have lower limits of detection. A naïve approach to evaluating the association of these left-censored biomarker measurements with an outcome of interest which accounts for unmeasured confounding is to employ instrumental variable models discarding left-censored subjects (Smith et al., 2005). Such an approach was adopted in analysing the relationship between left-censored C-reactive protein levels and blood pressure, using Mendelian randomization as an instrumental variable. We propose a rigorous semiparametric analysis using rank-based methods that permit censoring of both exposure and outcomes, with perturbation resampling used for inference. The key point is that with left-censored data, one can use methods of estimation for accelerated failure time models with right-censored data, after reversing the signs of the event times (Klein & Moeschberger, 2003). In the Supplementary Material, a detailed construction of Gehan-type estimating equations is described, along with a proof of their theoretical validity, which follows Jin et al. (2006a, § 2]. The results are stated in the following corollary and theorem.
Corollary 2.
For Case 1B, the Gehan-type rank estimators for
and
, denoted by
and
, satisfy Assumptions 1 and 2 under Conditions A1–A4 in the Supplementary Material. Therefore, the two-stage estimator
converges in probability to
and is asymptotically normal by Theorems 1 and 2.
Theorem 4.
For Case 1B, under Conditions A1–A4 in the Supplementary Material, the asymptotic distribution of
can be estimated by the empirical distribution of
conditionally on the data.
3.4. Case 2A: dichotomous exposure with a latent variable model
In Case 2A, we assume that  in model (1) is a latent continuous variable that is not directly observed
and determines receipt of treatment via a binary choice model,
in model (1) is a latent continuous variable that is not directly observed
and determines receipt of treatment via a binary choice model,  , where
 is the observed treatment
variable. This modelling strategy measures the effect of the latent variable on the
outcome. Latent variable models are often employed for dummy variables in instrumental
variable methods with complete data (Heckman,
1978). Using this approach, we cannot make direct inference on the effect of
is the observed treatment
variable. This modelling strategy measures the effect of the latent variable on the
outcome. Latent variable models are often employed for dummy variables in instrumental
variable methods with complete data (Heckman,
1978). Using this approach, we cannot make direct inference on the effect of
 , unlike with the method of Case
2B discussed in the next subsection. After estimating the effect of the latent variable,
it may be of interest to determine the implied effect of the observed binary exposure. In
the Supplementary Material, we
investigate a method to determine the effect of the observed binary exposure from the
latent variable model. However, this method involves strong assumptions, which may not be
valid and which are challenging to verify in practice. Thus, latent variable methods are
most useful in settings where the effect of the underlying latent variable is of interest.
As an example, in psychological research, participants are often asked a binary question
(Bollen, 2002); the participant answers yes if the
underlying latent variable exceeds a certain threshold and no otherwise. It is common for
researchers to be interested in the underlying latent variable in addition to the observed
yes/no variable.
, unlike with the method of Case
2B discussed in the next subsection. After estimating the effect of the latent variable,
it may be of interest to determine the implied effect of the observed binary exposure. In
the Supplementary Material, we
investigate a method to determine the effect of the observed binary exposure from the
latent variable model. However, this method involves strong assumptions, which may not be
valid and which are challenging to verify in practice. Thus, latent variable methods are
most useful in settings where the effect of the underlying latent variable is of interest.
As an example, in psychological research, participants are often asked a binary question
(Bollen, 2002); the participant answers yes if the
underlying latent variable exceeds a certain threshold and no otherwise. It is common for
researchers to be interested in the underlying latent variable in addition to the observed
yes/no variable.
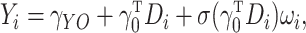
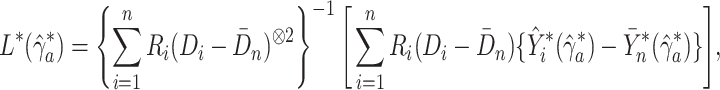
A probit regression model is considered for the observed binary exposure. For the
identification of the model, we assume that  are independent
standard normal random variates. The probit model is
are independent
standard normal random variates. The probit model is
 |
where  is the
standard normal cumulative distribution function. The maximum likelihood estimator for
is the
standard normal cumulative distribution function. The maximum likelihood estimator for
 ,
,  , is obtained by solving the
likelihood score equation
, is obtained by solving the
likelihood score equation
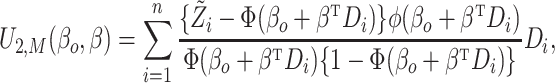 |
where  is an index for
an intercept,
is an index for
an intercept,  is an index for the parameter
 , and
, and  is the standard normal density
function. To generate the resampled maximum likelihood estimator for
is the standard normal density
function. To generate the resampled maximum likelihood estimator for
 , we solve the perturbed score
equation with the
, we solve the perturbed score
equation with the  used for
  ,
,
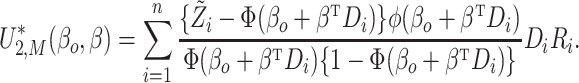 |
Corollary 3.
For Case 2A, the Gehan-type rank estimators for
, denoted by
, and the maximum likelihood estimator for
, denoted by
, satisfy Assumptions 1 and 2 under Conditions A1–A4 in the Supplementary Material. Therefore, the two-stage estimator
with
and
converges in probability to
and is asymptotically normal by Theorems 1 and 2.
Theorem 5.
For Case 2A, under Conditions A1–A4 in the Supplementary Material, the asymptotic distribution of
can be approximated by the empirical distribution of
conditionally on the data.
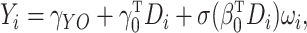
3.5. Case 2B: binary exposure
In Case 2B,  in models (1) and (2) is binary. Hence, we estimate the effect of the binary exposure
on the outcome. In this case, model (2) becomes a linear probability model and the variance of error terms depends on
the covariates. That is, by construction,
in models (1) and (2) is binary. Hence, we estimate the effect of the binary exposure
on the outcome. In this case, model (2) becomes a linear probability model and the variance of error terms depends on
the covariates. That is, by construction,  and
and
 ,
where
,
where  . Since
we fit the exposure model without
. Since
we fit the exposure model without  , a question arises as
to whether the model is still the linear probability model, i.e., whether
, a question arises as
to whether the model is still the linear probability model, i.e., whether
 is true, where
  . This is
addressed in the following remark.
. This is
addressed in the following remark.
Remark 1.
By a simple probability argument,
First we can show that
. From
and
, it follows that
is equal to
Since
, we have
. Based on these results, we obtain that
.


The error term of the reduced outcome model is 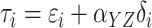 .
This implies that the variance of
.
This implies that the variance of  also depends on
 , as does that of
 . Since the rank and Buckley–James
methods assume equal variance, we adapt a recently developed method, the local
Buckley–James method (Pang et al., 2015), to
estimate the heteroscedastic accelerated failure time model. Pang et al. (2015) investigated models which assume that the residual
variance is a nonparametric function of the mean. In our setting, the model can be written
as
. Since the rank and Buckley–James
methods assume equal variance, we adapt a recently developed method, the local
Buckley–James method (Pang et al., 2015), to
estimate the heteroscedastic accelerated failure time model. Pang et al. (2015) investigated models which assume that the residual
variance is a nonparametric function of the mean. In our setting, the model can be written
as
 |
where  are independent and identically distributed random variables with mean zero and variance
one, and
are independent and identically distributed random variables with mean zero and variance
one, and  is a nonparametric function of
  .
Since the heteroscedastic variance of the reduced outcome model arises from that of the
linear exposure model, instead of
.
Since the heteroscedastic variance of the reduced outcome model arises from that of the
linear exposure model, instead of  ,
the variance of the reduced outcome model will depend on
,
the variance of the reduced outcome model will depend on  .
In other words, we have
.
In other words, we have
 |
(11) |
where  is a nonparametric function of
  .
Local Buckley–James estimation is directly applicable to model (11) because
.
Local Buckley–James estimation is directly applicable to model (11) because  can be consistently estimated by least squares. In the following remark, we discuss simple
sufficient conditions for
can be consistently estimated by least squares. In the following remark, we discuss simple
sufficient conditions for 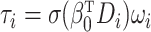 .
.
Remark 2.
The conditional variance of
given
is
If
and
are constants, which may be unknown, then one can write
. This happens when
,
,
,
and
are constants.

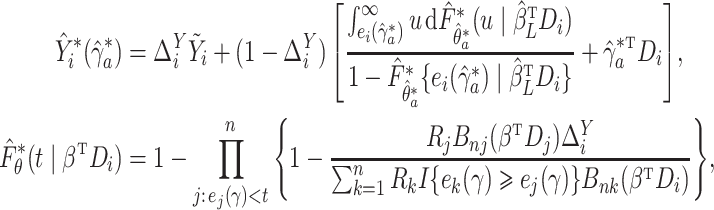
We now describe the local Buckley–James estimation procedure for model (11). The conditional mean of
 is
is
 |
where  is an unknown cumulative distribution function of
  conditional on
  .
Since
.
Since  depends on
  ,
it cannot be consistently estimated by the Kaplan–Meier method. Instead, a local
Kaplan–Meier estimator (Dabrowska, 1987) will be
used. The local Buckley–James estimation of model (11) can be implemented as follows.
,
it cannot be consistently estimated by the Kaplan–Meier method. Instead, a local
Kaplan–Meier estimator (Dabrowska, 1987) will be
used. The local Buckley–James estimation of model (11) can be implemented as follows.
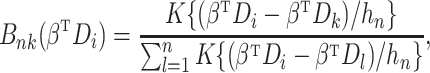
Step 1.
Obtain an initial estimator for
with the Buckley–James estimator or the rank estimator, and obtain an estimator for
with the least squares estimator
, as in Case 1A.
Step 2.
At the
th iteration, compute the imputed
by
where
with
and
. The local Kaplan–Meier estimate of
is
where
(
) is a sequence of nonnegative weights with
. For
, the Nadaraya–Watson-type weight may be used:
where
is a bandwidth satisfying
as
and
is a symmetric kernel function.

Step 3.
Apply least squares estimation to the imputed
(
) to obtain an updated estimator
:
where
.
Step 4.
Repeat Steps 2 and 3 until convergence is achieved. We denote by
the converged estimator for
.
Pang et al. (2015) adapted the resampling technique
of Jin et al. (2006b) to make inference using
 . Let
. Let

 be positive and have unit
mean and variance. One may use
be positive and have unit
mean and variance. One may use  as an
initial estimator for this resampling procedure. Let
as an
initial estimator for this resampling procedure. Let  denote the resampled estimator
at the
denote the resampled estimator
at the  th iteration. Define
 |
where
 |
 and
and  .
We denote the converged estimator by
.
We denote the converged estimator by  .
.
Corollary 4.
For Case 2B, the local Buckley–James estimator for
, denoted by
, and the least squares estimator for
, denoted by
, satisfy Assumptions 1 and 2 under Conditions B1–B9 in the Supplementary Material. Therefore, the two-stage estimator
with
and
converges in probability to
and is asymptotically normal by Theorems 1 and 2.
Theorem 6.
For Case 2B, under Conditions B1–B9 in Supplementary Material, the asymptotic distribution of
can be approximated by the empirical distribution of
conditionally on the data.
4. Simulation study
In this section, we report the results of numerical studies on the four data set-ups described in § 3. In Case 1A, we investigate how the skewness of the error distributions affects the performance of the estimators, including the proposed instrumental variable estimator and the naïve rank estimator based on fitting the accelerated failure time model directly to the exposure and measured confounders. In Case 1B, we consider a left-censored exposure and compare the instrumental variable method with the complete case analysis, which excludes the observations with left censoring of covariates and requires that the censoring be exogenous. In Case 2A, we examine the performance of the instrumental variable method with the latent variable. In Case 2B, we compare two instrumental variable methods: the method proposed in § 3.5 and the method proposed in § 3.2 that ignores heteroscedasticity.
The simulation models were
 |
(12) |
 |
(13) |
Each  and
and  was
two-dimensional in Cases 1A and 1B, and one-dimensional in Cases 2A and 2B. The parameter
values in model (12) were set equal to
1 for all cases considered. The parameter values in model (13) were equal to 1 for Cases 1A and 1B,
was
two-dimensional in Cases 1A and 1B, and one-dimensional in Cases 2A and 2B. The parameter
values in model (12) were set equal to
1 for all cases considered. The parameter values in model (13) were equal to 1 for Cases 1A and 1B,  for Case 2A, and
  for Case 2B where
 . In Case 2A,
 is a latent variable, with the observed
exposure defined as
is a latent variable, with the observed
exposure defined as  . In Case 2B,
 and the binary exposure was
generated from
and the binary exposure was
generated from  .
.
We assumed that covariates  were standard normal variates truncated at
  . The censoring times
for
. The censoring times
for  were generated from
 , where
 was chosen to yield a desired
right-censoring rate of 20%. In Case 1A, we used standard normal and standard Gumbel
distributions to generate
was chosen to yield a desired
right-censoring rate of 20%. In Case 1A, we used standard normal and standard Gumbel
distributions to generate  and
and  independently, and the standard Gumbel variate was standardized to have mean zero and
variance one. For the distribution of
independently, and the standard Gumbel variate was standardized to have mean zero and
variance one. For the distribution of  ,
four combinations were considered:
,
four combinations were considered:  ,
,
 ,
,  and
and
 , where
  and
and
 refer to
  and
and
 distributions, respectively. Only the
results for
distributions, respectively. Only the
results for  are presented here; results for the
other cases are given in the Supplementary Material. In Case 1B,
are presented here; results for the
other cases are given in the Supplementary Material. In Case 1B,  and
and  independently. The
censoring times for
independently. The
censoring times for  were generated from
 , where
 was chosen to yield a desired
left-censoring rate of 20%. In Case 2A, for the identification of the probit model, we
assumed that
was chosen to yield a desired
left-censoring rate of 20%. In Case 2A, for the identification of the probit model, we
assumed that  ,
,
 and
and
 , and this gave
 . In Case
2B,
. In Case
2B,  .
.
In the perturbation resampling, we generated  from the unit
exponential distribution, with 500 resampled analyses conducted. We used the R (R Development Core Team, 2017) package lss (Huang & Jin, 2006) to implement the methods. We
compared the proposed instrumental variable methods with the naïve rank method. For each
estimator, Tables 1–3 show the average bias, empirical standard error, average of the estimated
standard errors, and empirical coverage rate of the 95% Wald confidence intervals from 500
samples.
from the unit
exponential distribution, with 500 resampled analyses conducted. We used the R (R Development Core Team, 2017) package lss (Huang & Jin, 2006) to implement the methods. We
compared the proposed instrumental variable methods with the naïve rank method. For each
estimator, Tables 1–3 show the average bias, empirical standard error, average of the estimated
standard errors, and empirical coverage rate of the 95% Wald confidence intervals from 500
samples.
Table 1.
Simulation results for Case 1A with  and
and
 and for Case 1B:
the two-stage instrumental variable estimators with an identity matrix weight or an
optimal weight and the naïve rank estimator; all values have been multiplied by
and for Case 1B:
the two-stage instrumental variable estimators with an identity matrix weight or an
optimal weight and the naïve rank estimator; all values have been multiplied by

| Case 1A | Case 1B | |||||||||
|---|---|---|---|---|---|---|---|---|---|---|

|
Method | Parameter | Bias | ESE | ASE | ECR | Bias | ESE | ASE | ECR |
| 100 | Identity matrix |

|
–0.2 | 14.0 | 14.7 | 95.6 | 0.0 | 15.7 | 15.4 | 93.6 |

|
–0.1 | 23.1 | 25.4 | 95.0 | 1.2 | 25.5 | 25.5 | 93.6 | ||

|
1.7 | 24.3 | 25.2 | 96.2 | –1.7 | 27.1 | 25.5 | 93.6 | ||
| Optimal weight |

|
–0.4 | 14.2 | 14.5 | 96.0 | –0.1 | 15.8 | 15.2 | 93.7 | |

|
–0.2 | 23.5 | 24.9 | 94.4 | 1.2 | 25.6 | 25.0 | 93.7 | ||

|
1.5 | 24.7 | 24.8 | 94.8 | –1.8 | 27.2 | 25.1 | 93.7 | ||
| Naïve |

|
23.7 | 8.1 | 7.9 | 17.2 | 23.6 | 10.1 | 9.6 | 29.8 | |

|
–24.6 | 17.7 | 18.0 | 70.6 | –22.7 | 20.4 | 20.4 | 76.6 | ||

|
–22.9 | 18.3 | 17.8 | 71.2 | –24.6 | 20.4 | 20.6 | 74.4 | ||
| 200 | Identity matrix |

|
–0.2 | 9.7 | 9.9 | 95.4 | 0.1 | 9.9 | 10.4 | 95.1 |

|
0.8 | 16.4 | 17.0 | 95.0 | –0.4 | 17.2 | 17.5 | 95.1 | ||

|
0.7 | 15.9 | 17.0 | 95.6 | –0.3 | 18.2 | 17.5 | 95.1 | ||
| Optimal weight |

|
–0.3 | 9.8 | 9.8 | 95.4 | 0.1 | 9.9 | 10.3 | 94.5 | |

|
0.8 | 16.5 | 16.8 | 95.0 | –0.5 | 17.1 | 17.3 | 94.5 | ||

|
0.8 | 16.0 | 16.8 | 95.2 | –0.4 | 18.2 | 17.3 | 94.5 | ||
| Naïve |

|
23.2 | 5.6 | 5.5 | 1.8 | 23.3 | 6.3 | 6.6 | 4.6 | |

|
–23.0 | 12.7 | 12.5 | 54.2 | –24.1 | 13.4 | 14.2 | 61.6 | ||

|
–22.8 | 12.1 | 12.5 | 57.4 | –23.2 | 15.5 | 14.2 | 61.0 | ||
Bias, average bias; ESE, empirical standard error; ASE, average of the estimated standard errors; ECR, empirical coverage rate of the 95% Wald confidence intervals.
Table 3.
Simulation results for Case 2B: the instrumental variable estimators of Cases
2B and 1A and the naïve rank estimator; all values have been multiplied by


|

|
|||||||||
|---|---|---|---|---|---|---|---|---|---|---|

|
Method | Parameter | Bias | ESE | ASE | ECR | Bias | ESE | ASE | ECR |
| 800 | Case 2B IV |

|
–3.5 | 25.7 | 25.2 | 96.2 | –1.3 | 12.4 | 12.1 | 94.8 |

|
0.2 | 5.4 | 5.5 | 96.2 | –0.2 | 4.8 | 4.9 | 95.2 | ||
| Case 1A IV |

|
–15.2 | 26.4 | 26.1 | 92.0 | –2.4 | 14.3 | 13.8 | 92.6 | |

|
0.3 | 5.6 | 5.6 | 96.6 | –0.1 | 5.1 | 5.3 | 95.8 | ||
| Naïve |

|
28.8 | 5.7 | 5.9 | 0.2 | 23.4 | 5.3 | 5.3 | 0.6 | |

|
–2.7 | 4.4 | 4.6 | 90.6 | –2.3 | 4.4 | 4.6 | 92.6 | ||
| 1600 | Case 2B IV |

|
–1.0 | 17.7 | 17.3 | 94.9 | –0.4 | 8.7 | 8.5 | 93.6 |

|
0.1 | 3.8 | 3.8 | 94.7 | 0.0 | 3.4 | 3.5 | 95.9 | ||
| Case 1A IV |

|
–13.4 | 18.4 | 18.2 | 89.6 | –1.4 | 9.8 | 9.7 | 94.2 | |

|
0.2 | 3.8 | 3.9 | 95.2 | 0.0 | 3.6 | 3.7 | 96.4 | ||
| Naïve |

|
29.2 | 3.9 | 4.2 | 0.0 | 23.3 | 3.7 | 3.7 | 0.0 | |

|
–2.8 | 3.2 | 3.2 | 85.2 | –2.1 | 3.1 | 3.2 | 90.2 | ||
Bias, average bias; ESE, empirical standard error; ASE, average of the estimated standard errors; ECR, empirical coverage rate of the 95% Wald confidence intervals; Case 2B IV, instrumental variable method of Case 2B; Case 1A IV, instrumental variable method of Case 1A.
Table 2.
Simulation results for Case 2A: the two-stage instrumental variable estimator
and the naïve rank estimator; all values have been multiplied by


|
Method | Parameter | Bias | ESE | ASE | ECR |
|---|---|---|---|---|---|---|
| 100 | Two-stage |

|
–2.5 | 24.5 | 25.4 | 94.6 |

|
0.2 | 30.4 | 29.8 | 95.4 | ||
| Naïve |

|
28.9 | 10.1 | 10.1 | 18.6 | |

|
–28.8 | 18.1 | 17.6 | 62.2 | ||
| 200 | Two-stage |

|
–2.5 | 17.7 | 17.4 | 91.7 |

|
0.6 | 20.8 | 20.3 | 93.3 | ||
| Naïve |

|
28.5 | 6.8 | 7.1 | 1.2 | |

|
–28.1 | 12.3 | 12.3 | 37.8 | ||
| 400 | Two-stage |

|
–0.3 | 11.7 | 12.3 | 95.8 |

|
–0.5 | 13.7 | 14.2 | 97.0 | ||
| Naïve |

|
27.9 | 4.7 | 5.0 | 0.0 | |

|
–27.7 | 8.8 | 8.6 | 13.0 |
Bias, average bias; ESE, empirical standard error; ASE, average of the estimated standard errors; ECR, empirical coverage rate of the 95% Wald confidence intervals.
The results demonstrate that the proposed instrumental variable estimators are unbiased and
the proposed variance estimators perform well. The proposed estimators with the identity
matrix and with the optimal weight performed similarly in our simulation settings. The naïve
method gave biased estimators and their empirical coverage rates were far below the target
coverage rate of 95%. In Case 1A, the naïve estimator had much greater bias when
 than when
 . This suggests that
skewness of the exposure distribution may yield larger biases with unmeasured confounding.
The proposed estimators performed well across the range of error distributions we
considered. In Case 1B, the complete case estimator was biased because the censoring of the
exposure is not exogenous due to unmeasured confounding. Thus the method of Wang & Feng (2012), which requires exogenous
censoring, will not be applicable. The method in Case 2B gave unbiased estimators when
. This suggests that
skewness of the exposure distribution may yield larger biases with unmeasured confounding.
The proposed estimators performed well across the range of error distributions we
considered. In Case 1B, the complete case estimator was biased because the censoring of the
exposure is not exogenous due to unmeasured confounding. Thus the method of Wang & Feng (2012), which requires exogenous
censoring, will not be applicable. The method in Case 2B gave unbiased estimators when
 and
and  because it accounts for heteroscedasticity correctly. The method in Case 1A gave biased
estimators when
because it accounts for heteroscedasticity correctly. The method in Case 1A gave biased
estimators when  but unbiased estimators when
 . This suggests that a strong
instrumental variable may reduce the bias due to heteroscedasticity.
. This suggests that a strong
instrumental variable may reduce the bias due to heteroscedasticity.
5. Colon cancer data
We applied the proposed method to the Surveillance, Epidemiology and End Results data for elderly stage III colon cancer patients (Warren et al., 2002). Oxaliplatin is a chemotherapeutic agent that is used as part of a multi-agent adjuvant chemotherapy regimen for stage III colon cancer patients. Based on efficacy results from the MOSAIC trial in 2003 Andre et al., 2004, the U.S. Food and Drug Administration approved oxaliplatin for use in treatment of stage III colon cancer. After the Food and Drug Administration’s approval for this new indication, it was disseminated rapidly among stage III colon cancer patients to replace 5-fluorouracil, 5-FU, monotherapy as the standard of care. The objective of our analysis is to determine whether oxaliplatin, compared with 5-FU alone, improves survival in an older patient population, a question that was not addressed in the MOSAIC trial.
The cohort included individuals aged 65 and over who had been diagnosed with primary stage III colon cancer between 2003 and 2007, with follow-up through April 2010. Included patients were those who received surgical resection within 90 days of diagnosis, survived longer than 30 days, and initiated treatment with either oxaliplatin or 5-FU/capecitabine without oxaliplatin within 110 days of surgery and 120 days of diagnosis. Patients who received radiation, were diagnosed at autopsy, or had Health Maintenance Organization coverage or incomplete Medicare claims during the 12 months pre- and post-diagnosis or until death were excluded.
The outcome,  , is log survival time in years. The binary
exposure variable,
, is log survival time in years. The binary
exposure variable,  , was coded as 1 if the patient was treated
with oxaliplatin and 0 if treated with 5-FU. The instrumental variable was coded as 1 if the
patient was treated after the FDA’s approval of oxaliplatin for use in stage III colon
cancer and 0 otherwise (Mack et al., 2015). Further
details of the instrumental variable construction are provided in Mack et al. (2015). Three confounders were used: age in years, an
indicator of whether household median income in 2000 was greater than $50 000, and an
indicator for diabetes. To account for a possible nonlinear effect of age on survival, we
generated four groups based on quartiles of the age distribution and the corresponding three
dummy variables:
, was coded as 1 if the patient was treated
with oxaliplatin and 0 if treated with 5-FU. The instrumental variable was coded as 1 if the
patient was treated after the FDA’s approval of oxaliplatin for use in stage III colon
cancer and 0 otherwise (Mack et al., 2015). Further
details of the instrumental variable construction are provided in Mack et al. (2015). Three confounders were used: age in years, an
indicator of whether household median income in 2000 was greater than $50 000, and an
indicator for diabetes. To account for a possible nonlinear effect of age on survival, we
generated four groups based on quartiles of the age distribution and the corresponding three
dummy variables:  compares group
 with the baseline group for
 , where increasing
 indicates older groups. The sample size is
2879, with the resampling size equal to 200 when computing the standard errors of the
parameter estimates with unit exponential perturbations.
indicates older groups. The sample size is
2879, with the resampling size equal to 200 when computing the standard errors of the
parameter estimates with unit exponential perturbations.
We applied the method of Case 2B. The exogenous covariates are  (Time,
 ,
,  ,
,  , Income, Diabetes), where Time
is the instrumental variable. It was assumed that
, Income, Diabetes), where Time
is the instrumental variable. It was assumed that  has a Bernoulli
distribution with mean zero and variance
has a Bernoulli
distribution with mean zero and variance  .
Although the method of Case 1A may not be theoretically justified, for comparison we applied
the homoscedastic instrumental variable methods using either rank or Buckley–James
methodology. We also applied the naïve method based on fitting the outcome model to
.
Although the method of Case 1A may not be theoretically justified, for comparison we applied
the homoscedastic instrumental variable methods using either rank or Buckley–James
methodology. We also applied the naïve method based on fitting the outcome model to
 directly.
The results are given in Table 4. Since there is a
single instrumental variable, the two-stage estimators do not depend on
 . The naïve estimate of the treatment
effect is 0
. The naïve estimate of the treatment
effect is 0 149, with
  -value
0
-value
0 059, which is not significant at level
0
059, which is not significant at level
0 05. In contrast, the estimated effect
using the instrumental variable methods is between 0
05. In contrast, the estimated effect
using the instrumental variable methods is between 0 35
and 0
35
and 0 40, notably larger than the naïve
estimate and statistically significant. To summarize the effect of oxaliplatin, we use the
fact that the treatment effect parameter may be interpreted in terms of the differences in
median survival times for the two treatments. Specifically, there is a
40, notably larger than the naïve
estimate and statistically significant. To summarize the effect of oxaliplatin, we use the
fact that the treatment effect parameter may be interpreted in terms of the differences in
median survival times for the two treatments. Specifically, there is a
 increase for
oxaliplatin over 5-FU when
increase for
oxaliplatin over 5-FU when  is positive and a corresponding
decrease when
is positive and a corresponding
decrease when  is negative. The Case 2B method
gives a 49% increase with a 95% confidence interval ranging from 12% to 98% in median
survival with oxaliplatin, while the naïve rank method yields a 16% increase with a 95%
confidence interval ranging from
is negative. The Case 2B method
gives a 49% increase with a 95% confidence interval ranging from 12% to 98% in median
survival with oxaliplatin, while the naïve rank method yields a 16% increase with a 95%
confidence interval ranging from  1% to 36%.
Table 4.
Results for the colon cancer data analysis
| Method | Parameter | Est | SE |
 –value
 |
LB | UB |
|---|---|---|---|---|---|---|
| Case 1A IV (R) | Oxaliplatin | 0.368 | 0.142 | 0.010 | 0.089 | 0.647 |
Age
|
–0.140 | 0.102 | 0.171 | –0.340 | 0.060 | |
Age
|
–0.270 | 0.115 | 0.018 | –0.495 | –0.045 | |
Age
|
–0.650 | 0.108 | 0.000 | –0.863 | –0.438 | |
| Income | 0.151 | 0.072 | 0.035 | 0.011 | 0.292 | |
| Diabetes | –0.210 | 0.087 | 0.015 | –0.379 | –0.040 | |
| Case 1A IV (BJ) | Oxaliplatin | 0.392 | 0.147 | 0.008 | 0.105 | 0.679 |
Age
|
–0.122 | 0.106 | 0.250 | –0.329 | 0.086 | |
Age
|
–0.310 | 0.121 | 0.010 | –0.547 | –0.073 | |
Age
|
–0.656 | 0.117 | 0.000 | –0.886 | –0.426 | |
| Income | 0.152 | 0.076 | 0.045 | 0.003 | 0.300 | |
| Diabetes | –0.245 | 0.093 | 0.009 | –0.427 | –0.062 | |
| Case 2B IV | Oxaliplatin | 0.398 | 0.144 | 0.006 | 0.116 | 0.681 |
Age
|
–0.115 | 0.102 | 0.258 | –0.314 | 0.084 | |
Age
|
–0.312 | 0.121 | 0.010 | –0.549 | –0.075 | |
Age
|
–0.637 | 0.117 | 0.000 | –0.866 | –0.408 | |
| Income | 0.158 | 0.075 | 0.034 | 0.012 | 0.304 | |
| Diabetes | –0.244 | 0.093 | 0.009 | –0.425 | –0.062 | |
| Naïve | Oxaliplatin | 0.149 | 0.079 | 0.059 | –0.006 | 0.304 |
Age
|
–0.162 | 0.102 | 0.112 | –0.362 | 0.038 | |
Age
|
–0.294 | 0.114 | 0.010 | –0.517 | –0.071 | |
Age
|
–0.709 | 0.104 | 0.000 | –0.913 | –0.505 | |
| Income | 0.167 | 0.070 | 0.017 | 0.030 | 0.304 | |
| Diabetes | –0.220 | 0.085 | 0.010 | –0.387 | –0.053 |
Case 1A IV (R), Case 1A instrumental variable method with  estimated by the rank method;
Case 1A IV (BJ), Case 1A instrumental variable method with
estimated by the rank method;
Case 1A IV (BJ), Case 1A instrumental variable method with  estimated by the Buckley–James
method; Est, estimated coefficient; SE, standard error; LB, lower bound of the 95%
Wald confidence interval; UB, upper bound of the 95% Wald confidence interval.
estimated by the Buckley–James
method; Est, estimated coefficient; SE, standard error; LB, lower bound of the 95%
Wald confidence interval; UB, upper bound of the 95% Wald confidence interval.
Based on the instrumental variable analysis, we conclude that oxaliplatin is more
beneficial than 5-FU in treating colon cancer patients. The differences between the naïve
and instrumental variable results suggest that there may exist unmeasured confounders. The
partial F-test statistic for the instrumental variable in the exposure model is
1324 64, which is much larger than the rule
of thumb of 10 (Staiger & Stock, 1997), implying
that the variable Time is a strong instrument. The estimated treatment effects from the two
Case 1A methods are very similar to that from the Case 2B method. This similarity could be
due to the instrumental variable being strong so that the effect of heteroscedascity may not
be great, as evidenced in the simulations in § 4.
64, which is much larger than the rule
of thumb of 10 (Staiger & Stock, 1997), implying
that the variable Time is a strong instrument. The estimated treatment effects from the two
Case 1A methods are very similar to that from the Case 2B method. This similarity could be
due to the instrumental variable being strong so that the effect of heteroscedascity may not
be great, as evidenced in the simulations in § 4.
6. Discussion
While we have focused on censored outcomes and exposures in this paper, the instrumental variable methods in § 2 are generally applicable to scenarios that involve incomplete observation of either the outcome, the exposure, the instrumental variable, or the measured confounders. The setting of Case 2A, where the exposure in the outcome model is a latent variable defining the observed binary exposure, only partially illustrates this broad applicability. Other scenarios involving either missing or mismeasured variables can be handled by the proposed framework, as long as there exist estimation procedures for the linear exposure model and the reduced-form outcome model which accommodate the incompletely observed data. Additional applications are currently under investigation.
For the binary exposure, Case 2B, we used the linear probability model. One may be tempted to use other models such as logistic regression for the binary exposure. However, doing so would lead to the reduced models being nonlinear. For such nonlinear cases, it is not straightforward to derive minimum distance estimators without strong model assumptions. To obtain instrumental variable estimators under the logistic exposure model, one might consider alternative approaches, such as the two-stage predictor substitution method (Terza et al., 2008), where the binary exposure is replaced by its predicted value. This is beyond the scope of the present work.
The linear probability model can have fitted values very close to or outside
 , which may lead to unreliable
instrumental variable estimators. A possible remedy is to discretize continuous covariates
or reduce the number of measured confounders in the model. This approach is valid unless the
independence assumption does not hold.
, which may lead to unreliable
instrumental variable estimators. A possible remedy is to discretize continuous covariates
or reduce the number of measured confounders in the model. This approach is valid unless the
independence assumption does not hold.
There are two ways in which the censored exposure might occur: one where the exposure is the time to some event, which could be right-censored due to drop-out or loss to follow-up, and the other in which the censored exposure is a measured variable that is subject to a limit of detection. The latter is a good fit for the Case 1B methods. The former situation may involve both time-varying exposure and time-varying confounding, where it may not be straightforward to construct valid structural models using our approach. The development of such models and associated inferential procedures is complicated and merits further investigation.
An application of our method to longitudinal data is straightforward when responses are recorded at common time-points. Hogan & Lancaster (2004) developed instrumental variable methods in such a setting, but only considered completely observed data. Complications may arise either with missing data or with time-dependent measured and unmeasured confounding. Under the Markov independence assumption in Hogan & Lancaster (2004), our models and methods of estimation can be extended to such settings.
Supplementary Material
Acknowledgement
We thank William R. Carpenter, Christina D. Mack, and Anne-Marie Meyer for assistance in obtaining the data and for valuable insight based on their research studies examining innovation diffusion, which were supported by the National Cancer Institute. The current analysis is based on the data developed through their work.
Supplementary material
Supplementary material available at Biometrika online includes proofs and additional simulation results.
References
- Amemiya T. (1974). The nonlinear two-stage least-squares estimator. J. Economet. 2, 105–10. [Google Scholar]
- Anderson T. W. & Rubin H. (1950). The asymptotic properties of estimates of the parameters of a single equation in a complete system of stochastic equations. Ann. Math. Statist. 21, 570–82. [Google Scholar]
- Andre T., Boni C., Mounedji-Boudiaf L., Navarro M., Tabernero J., Hickish T., Topham C., Zaninelli M., Clingan P., Bridgewater J.. et al. (2004). Oxaliplatin, uorouracil, and leucovorin as adjuvant treatment for colon cancer. New Engl. J. Med 350, 2343–51. [DOI] [PubMed] [Google Scholar]
- Angrist J. D., Imbens G. W. & Rubin D. B. (1996). Identification of causal effects using instrumental variables. J. Am. Statist. Assoc. 91, 444–55. [Google Scholar]
- Baker S. G. (1998). Analysis of survival data from a randomized trial with all-or-none compliance: Estimating the cost-effectiveness of a cancer screening program. J. Am. Statist. Assoc. 93, 929–34. [Google Scholar]
- Bollen K. A. (1996). An alternative two stage least squares (2SLS) estimator for latent variable equations. Psychometrika 61, 109–21. [Google Scholar]
- Bollen K. A. (2002). Latent variables in psychology and the social sciences. Ann. Rev. Psychol. 53, 605–34. [DOI] [PubMed] [Google Scholar]
- Brännäs K. (2000). Estimation in a duration model for evaluating educational programs. IZA Discussion Paper no. 103, Institute for the Study of Labor (IZA), Bonn, Germany. [Google Scholar]
- Brookhart M. A., Rassen J. A. & Schneeweiss S. (2010). Instrumental variable methods in comparative safety and effectiveness research. Pharmacoepidemiol. Drug Safety 19, 537–54. [DOI] [PMC free article] [PubMed] [Google Scholar]
- Buckley J. & James I. (1979). Linear regression with censored data. Biometrika 65, 429–36. [Google Scholar]
- Dabrowska D. M. (1987). Non-parametric regression with censored survival time data. Scand. J. Statist. 14, 181–97. [Google Scholar]
- Hansen L. B. (1982). Large sample properties of generalized method of moment estimators. Econometrica 50, 1029–54. [Google Scholar]
- Heckman J. J. (1978). Dummy endogeneous variables in a simultaneous equation system. Econometrica 46, 931–59. [Google Scholar]
- Hogan J. W. & Lancaster T. (2004). Instrumental variables and inverse probability weighting for causal inference from longitudinal observational studies. Statist. Meth. Med. Res. 13, 17–48. [DOI] [PubMed] [Google Scholar]
- Huang L. & Jin Z. (2006). lss: The accelerated failure time model to right censored data based on least-squares principle. R package version 0.52. [DOI] [PubMed] [Google Scholar]
- Jin Z., Ying Z. & Wei L. J. (2001). A simple resampling method by perturbing the minimand. Biometrika 88, 381–90. [Google Scholar]
- Jin Z., Lin D. Y., Wei L. J. & Ying Z. (2003). Rank-based inference for the accelerated failure time model. Biometrika 90, 341–53. [Google Scholar]
- Jin Z., Lin D. Y. & Ying Z. (2006a). Rank regression analysis of multivariate failure time data based on marginal linear models. Scand. J. Statist. 33, 1–23. [Google Scholar]
- Jin Z., Lin D. Y. & Ying Z. (2006b). On least-squares regression with censored data. Biometrika 93, 147–61. [Google Scholar]
- Klein J. P. & Moeschberger M. L. (2003). Survival Analysis: Techniques for Censored and Truncated Data. New York: Springer. [Google Scholar]
- Lai T. L. & Ying Z. (1991). Large sample theory of a modified Buckley-James estimator for regression analysis with censored data. Ann. Statist. 19, 1370–402. [Google Scholar]
- Li J., Fine J. P. & Brookhart M. A. (2015). Instrumental variable additive hazards models. Biometrics 71, 122–30. [DOI] [PubMed] [Google Scholar]
- Loeys T. & Goetghebeur E. (2003). A causal proportional hazards estimator for the effect of treatment actually received in a randomized trial with all-or-nothing compliance. Biometrics 59, 100–5. [DOI] [PubMed] [Google Scholar]
- Loeys T., Goetghebeur E. & Vandebosch A. (2005). Causal proportional hazards models and time-constant exposure in randomized clinical trials. Lifetime Data Anal. 11, 435–49. [DOI] [PubMed] [Google Scholar]
- Mack C. D., Brookhart M., Glynn R., Carpenter W. & Sturmer T. (2015) Comparative effectiveness of oxaliplatin versus 5-flourouricil in older adults: An instrumental variable analysis. Epidemiology 26, 690–9. [DOI] [PMC free article] [PubMed] [Google Scholar]
- Nie H., Cheng J. & Small D. S. (2011). Inference for the effect of treatment on survival probability in randomized trials with noncompliance and administrative censoring. Biometrics 67, 1397–405. [DOI] [PubMed] [Google Scholar]
- Newey W. K. (1990). Efficient instrumental variables estimation of nonlinear models. Econometrica 58, 809–37. [Google Scholar]
- Newey W. K. & Powell J. L. (2003). Instrumental variable estimation of nonparametric models. Econometrica 71, 1565–78. [Google Scholar]
- Pang L., Lu W. & Wang H. J. (2015). Local Buckley-James estimation for heteroscedastic accelerated failure time model. Statist. Sinica 25, 863–77. [DOI] [PMC free article] [PubMed] [Google Scholar]
- Powell J. L. (1986). Symmetrically trimmed least squares estimation for tobit models. Econometrika 54, 1435–60. [Google Scholar]
- Prentice R. L. (1978). Linear rank tests with right censored data. Biometrika 65, 167–79. [Google Scholar]
- R Development Core Team (2017). R: A Language and Environment for Statistical Computing. Vienna, Austria: R Foundation for Statistical Computing.ISBN 3-900051-07-0, http://www.R-project.org. [Google Scholar]
- Robins J. M. & Tsiatis A. A. (1991). Correcting for non-compliance in randomized trials using rank preserving structural failure time models. Commun. Statist. A 20, 2609–31. [Google Scholar]
- Smith G. D., Lawlor D. A., Harbord R., Timpson N., Rumley A., Lowe G. D. O., Day I. N. M. & Ebrahim S. (2005). Association of C-reactive protein with blood pressure and hypertension: Life course confounding and Mendelian randomization tests of causality. Arterioscler. Thromb. Vasc. Biol. 25, 1051–6. [DOI] [PubMed] [Google Scholar]
- Staiger D. & Stock J. H. (1997). Instrumental variables regression with weak instruments. Econometrica 65, 557–86. [Google Scholar]
- Tchetgen Tchetgen E. J., Walter S., Vansteelandt S., Martinussen T. & Glymour M. (2015). Instrumental variable estimation in a survival context. Epidemiology 26, 402–10. [DOI] [PMC free article] [PubMed] [Google Scholar]
- Terza J. V., Basu A. & Rathouz P. J. (2008). Two-stage residual inclusion estimation: Addressing endogeneity in health econometric modeling. J. Health Econ. 27, 531–43. [DOI] [PMC free article] [PubMed] [Google Scholar]
- Tsiatis A. A. (1990). Estimating regression parameters using linear rank tests for censored data. Ann. Statist. 18, 354–72. [Google Scholar]
- Wang H. J. & Feng X. (2012). Multiple imputation for M-regression with censored covariates. J. Am. Statist. Assoc. 107, 194–204. [Google Scholar]
- Warren J. L., Klabunde C. N., Schrag D., Bach P. B. & Riley G. F. (2002). Overview of the SEER-Medicare data: content, research applications, and generalizability to the United States elderly population. Med. Care 40(8 Suppl), IV-3-18. [DOI] [PubMed] [Google Scholar]
- Ying Z. (1993). A large sample study of rank estimation for censored regression data. Ann. Statist. 21, 76–99. [Google Scholar]
Associated Data
This section collects any data citations, data availability statements, or supplementary materials included in this article.