Abstract
A novel composite photocatalyst based on Cu2ZnSnS4 (CZTS) powders was synthesized and investigated for use as a photocatalyst. CZTS powders were first made using a conventional hydrothermal method and were then used to grow silver nanoparticles hybridized onto the CZTS under various conditions through a microwave-assisted hydrothermal process. After the obtained samples were subsequently mixed with 1T-2H MoS2, the three synthesized component samples were characterized using X-ray diffractometry (XRD), scanning electron microscopy, transmission electron microscopy (FE-SEM, FE-TEM), UV-visible spectroscopy (UV-Vis), Brunauer-Emmet-Teller (BET), photoluminescence spectroscopy (PL), and X-ray photoelectron spectroscopy (XPS). The resulting samples were also used as photocatalysts for the degradation of methylene blue (MB) under a 300 W halogen lamp simulating sunlight with ~5% UV light. The photodegradation ability was greatly enhanced by the addition of Ag and 1T-2H MoS2. Excellent photodegradation of MB was obtained under visible light. The effects of material characteristics on the photodegradation were investigated and discussed.
Keywords: Cu2ZnSnS4 powders, silver nanoparticles, 1T-2H MoS2, photodegradation
1. Introduction
A photocatalytic technique is considered a promising method for treating organic dyes in wastewater [1,2]. I2-II-IV-VI4 quaternary chalcogenide semiconductors Cu2ZnSnS4 (CZTS) are non-toxic, Earth-abundant, and inexpensive, and they have a high absorption coefficient >10−4 cm2 for potential application as solar-cell absorbers [3,4,5]. However, due to the fact that their optimum band gap is ~1.5 eV, they easily recombine into photogenerated holes and electrons. Thus, it is necessary to reduce the recombination rate. TiO2 is a well-known n-type metal oxide photocatalyst in many photocatalytic applications, including hydrogen generation and water splitting in environmental and energy-related fields [1,6,7,8,9]. However, its relatively large band gap of 3.2 eV is only a small fraction (4%) of the solar spectrum. Several studies have investigated ways to achieve better absorption and charge carrier mobility under visible light through the use of a dopant [10,11,12,13]. Koichi Awazu et al. labeled this new phenomenon “plasmonic photocatalysis”, where silver (Ag) nanoparticles (NPs) are coated with a passive material such as SiO2 to prevent oxidation and to separate TiO2. Their work indicated effective surface plasmon resonance transfer of photogenerated holes on the surface enhanced photocatalytic reaction [14].
Recently, it has been shown that silver orthophosphate (Ag3PO4) has extremely high photo-oxidative capabilities for O2 generation from water splitting under visible light irradiation [15]. GO–Ag3PO4 nanocomposites have been synthesized as an excellent hybrid photocatalyst [16,17]. They not only exhibit enhanced visible light photocatalytic activity, but also show better stability and durability than their counterparts. Among them, molybdenum disulfide (MoS2) exhibits a graphene-like layered structure in which S–Mo–S covalent bonds exist within the plane, and van der Waals forces hold the plane [2,18]. MoS2 provides a high surface area, unique electrical conductivity consisting of 1T-2H hybridized phases, and a sheet-like morphology [19]. It has received attention for application in energy storage devices due to its unique nanostructure and electronic properties.
The photocatalysts of the I2-II-IV-VI4 quaternary group exhibit better absorption ability under visible light than TiO2. Therefore, Xuelian Yu et al. prepared CZTS-Pt and CZTS-Au heterostructured NPs using a synthesis route [20]. The results showed enhanced photocatalytic activity toward photodegradation and hydrogen generation by water splitting. Feng Jiang et al. reported a multilayer of Pt/In2S3/CdS/CZTS heterostrucures, where the obtained photocathode showed significant enhancement in terms of stability during photoirradiation for PEC water splitting [21]. Hybridized 1T-2H MoS2 was then added to provide higher electrical conductivity and the specific surface area necessary to achieve superior catalytic ability [22,23,24]. Importantly, Ag was added in the structure to extend the light absorption of the photocatalyst to the visible light region, which was due to the surface plasmon resonance of Ag NPs, which enabled the photocatalyst to absorb light in the visible spectrum. Owing to these outstanding characteristics, we report a novel design of three-component Ag/hybridized CZTS/1T-2H MoS2 heterojunction photocatalysts using a facile hydrothermal method. Since their appropriate band gap structures and stability enhance properties that include light harvesting, charge separation, and transfer photoactivity, it is essential to develop this method on a photocatalytic mechanism.
2. Results and Discussion
2.1. Crystal Structure
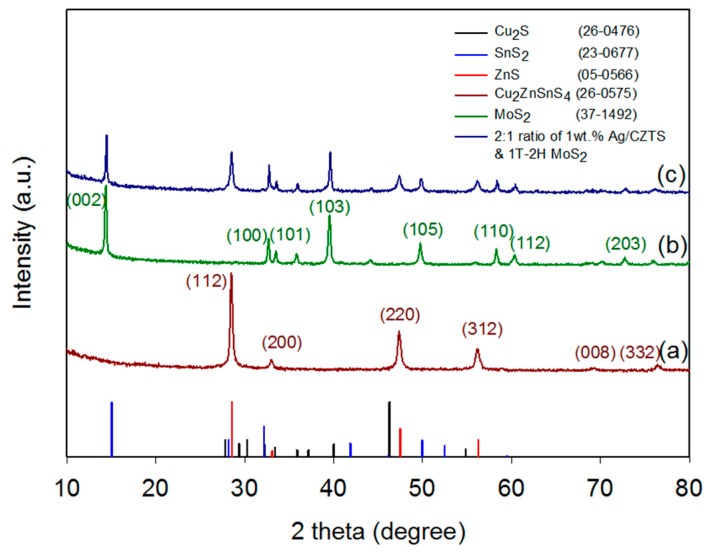
The XRD patterns of the Kesterite (KS) CZTS, 1T-2H MoS2, and 1 wt% Ag-CZTS/1T-2H MoS2 are shown in Figure 1. Figure 1a shows that the major CZTS diffraction peaks observed at 28.47°, 32.99°, 47.35°, 56.14°, 68.99°, and 76.42° can be indexed to the crystal planes of (112), (200), (220), (312), (008), and (332) of the KS structure (JCPDS no. 26-0575), respectively. The formation mechanisms of the CZTS powder are summarized as Cu2S + SnS2 + ZnS → Cu2ZnSnS4. It is necessary for the excess thiourea concentration to be a homogeneous solution in order to effectively induce a self-assembly reaction through the conventional hydrothermal (CHT) method [4]. No secondary phases of Cu2S, SnS2 or ZnS were detected [25]. Figure 1b shows that the CHT synthesized MoS2 microflower sample obtained the major diffraction peaks at 14.42°, 32.69°, 33.49°, 39.52°, 49.76°, and 58.3°, which correspond to the (002), (100), (101), (103), (105), and (110) crystalline planes of MoS2 (JCPDS no. 37-1492), respectively. In addition, the calculated interlayer spacing (d-002) using the Bragg equation was 0.66 nm, with the reported well-controlled expansion of the interlayer d-spacing in the hydrothermal/solvothermal approaches ranging from 0.62 to 1.1 nm [26]. In Figure 1c for the 1 wt% Ag/CZTS and 2:1 ratio of 1T-2H MoS2 composite, no peaks were observed for Ag probably due to the very small amount of Ag added onto the CZTS. The XRD pattern corresponding to both the CZTS and MoS2 peaks can be observed.
Figure 1.
XRD pattern of (a) CZTS powders using the conventional hydrothermal process (CHT) at 180 °C for 72 h; (b) MoS2 powder using the CHT process at 200 °C for 24 h; (c) 2:1 ratio of 1 wt% Ag/CZTS and 1T-2H MoS2.
2.2. Morphology
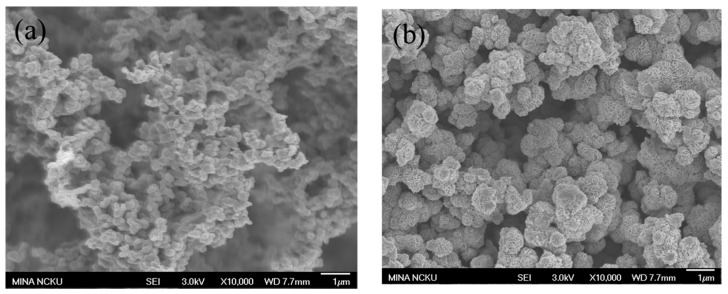
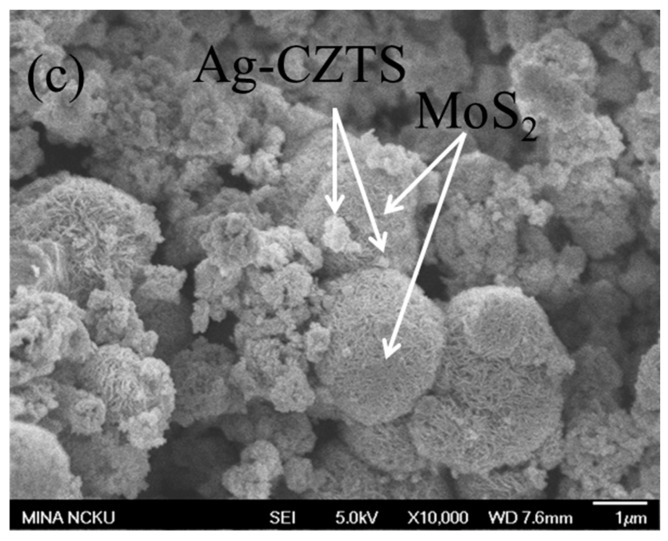
The morphology of Ag/CZTS/1T-2H MoS2 NPs based on the SEM results is shown in Figure 2. Figure 2a shows the SEM images of 1 wt% Ag hybridized KS CZTS NPs. Shapes with a minor amount of irregular particles were obtained, but the addition of Ag on the CZTS was not observed on the SEM images probably because the Ag particles were too small to be detected. Figure 2b shows the images of CHT-synthesized MoS2 microflowers obtained as the petals, which consist of several MoS2 nanosheets. On the other hand, Figure 2c shows that the morphologies of the as-prepared 2:1 ratio of 1 wt% Ag/CZTS and 1T-2H MoS2 are well grown on the surface of the MoS2 powder, thereby successfully forming the Ag/CZTS/1T-2H MoS2 heterostructure.
Figure 2.
Scanning electron microscopy (SEM) images of the prepared CZTS powders with the (a) 1 wt% Ag doped on CZTS powder; (b) 1T-2H MoS2 microflower; and (c) the 2:1 ratio of 1 wt% Ag/CZTS and 1T-2H MoS2.
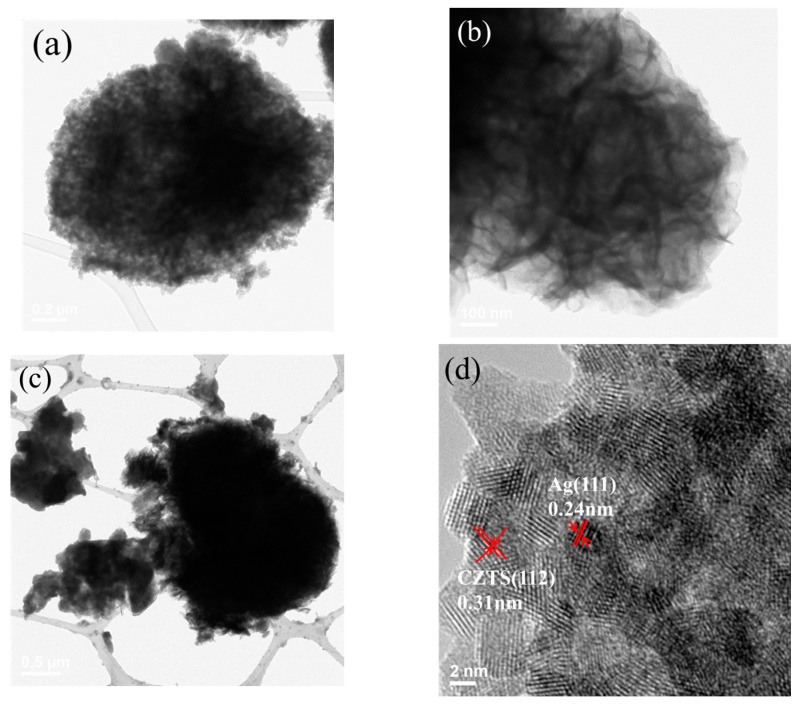
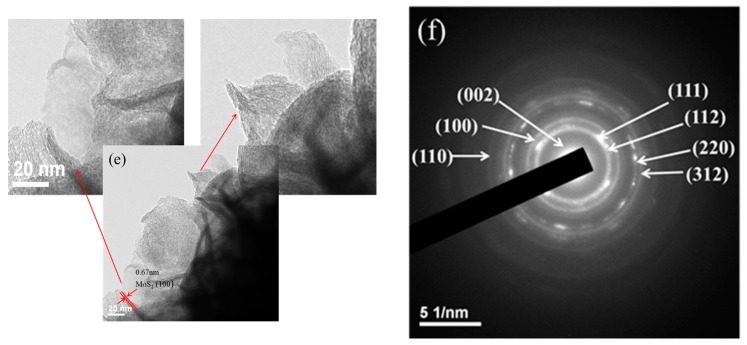
Figure 3a shows the TEM images of Ag/CZTS powders, where the Ag NPs with a darker contrast were hybridized on the CZTS powder. Figure 3d shows the high resolution TEM images wherein the interplannar lattice spacing of 0.31 nm corresponds to the (112) planes [5]. Meanwhile, the additional Ag corresponds to the face-centered cubic (FCC) Ag (111) [27], with a spacing of 0.24 nm. Figure 3b,e show that the microflower morphologies of MoS2 consist of a considerable number of single and few layer structures. The MoS2 lattice fringe spacing was also calculated, for which the corresponding d-spacing was 0.67 nm [22]. Figure 3c,f show the more aggregated nanoparticles of the 1 wt% Ag/CZTS and 2:1 ratio of 1T-2H MoS2 and the SAED image of the 1 wt% Ag/CZTS and 2:1 ratio of 1T-2H MoS2, which is consistent of with tetragonal KS CZTS, as it shows the major phases (112), (220), and (312), indicating that the hybridizing of the Ag NPs can be attributed to the diffraction from the (111) plane of FCC. The corresponding SAED results for the 1T-2H MoS2 microflower match the (002), (100), and (110) planes [23,24].
Figure 3.
TEM images (a) 1 wt% Ag doped on CZTS powders; (b) 1T-2H MoS2 microflower; (c) 2:1 ratio of 1 wt% Ag/CZTS and 1T-2H MoS2; HRTEM images of (d) 1 wt% Ag/CZTS; (e) 1T-2H MoS2 microflower; and (f) SAED micrographs of 2:1 ratio of 1 wt% Ag/CZTS and 1T-2H MoS2.
2.3. Surface Areas
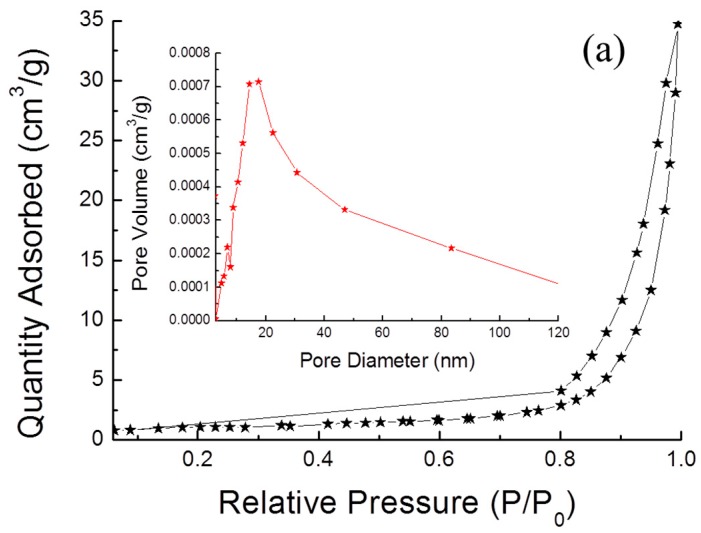
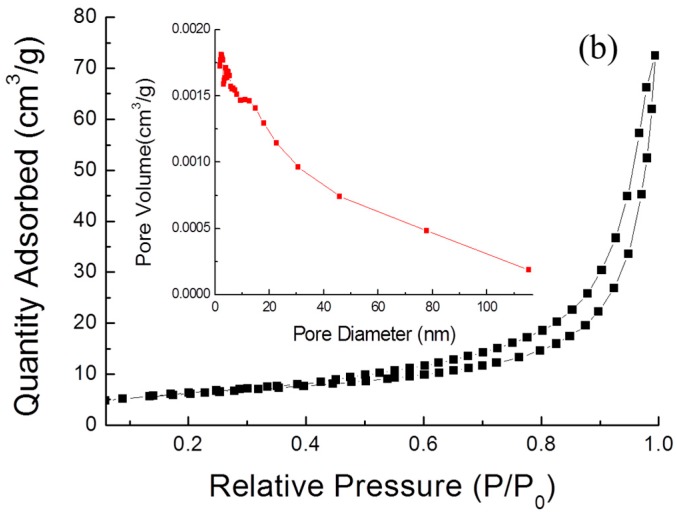
Figure 4 shows the Brunauer–Emmett–Teller (BET) analysis using N2 adsorption-desorption isotherms and the corresponding Barrett–Joyner–Halenda (BJH) pore size distributions curves (inset). The surface areas of the CZTS powders and 1T-2H MoS2 are measured as 3.38 and 21.39 m2 g−1, respectively. The insets are the BJH pore volume are 0.045 and 0.096 cm3 g−1, and the pore size distribution plot, for which the adsorption average pore diameters are 31.74 and 18.02 nm, respectively. It can be seen that there are differences in the morphology results in different specific surface areas (SSAs), which indicates that the MoS2 has a higher SSA than is the case for the CZTS powders due to the fact that the microflower shape provided a higher surface area. However, the pore size of the 1T-2H MoS2 is smaller than that of the CZTS powders. This may be because the alkaline solution of diethylenediamine (DETA) acted as an etchant and increased the excess thiourea, which is an intermolecular force and polarity molecule during the synthesis of the CZTS powders, resulting in the formation of more pits on the surface [28,29]. Therefore, the larger SSA and pore diameter in the Ag/CZTS/MoS2 contributed to active enhancement of photo-catalytic efficiency [24].
Figure 4.
N2 absorption/desorption isotherms of (a) CZTS powders, and (b) 1T-2H MoS2 microflower powders; insets are BJH pore size distribution plots, respectively.
2.4. Optical Absorption
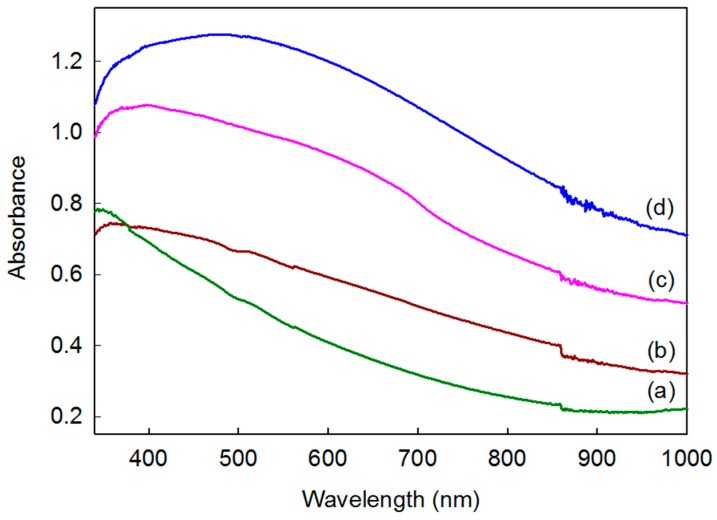
The UV-VIS absorption spectrum results for the tetragonal KS CZTS powders, 1 wt% Ag/CZTS, 1 wt% Ag/CZTS, and 10:1 and 2:1 ratios of 1T-2H MoS2 are shown in Figure 5. It can be seen that doping Ag enhanced the light absorption, and this fact can be ascribed to the charge transfer process from the valence band to the conduction band by board surface plasmon resonance (SPR) absorption in the visible region [30]. However, further increases in the 10 wt% and 50 wt% 1T-2H MoS2 microflower powder resulted in broad absorption due to a higher SSA. It is apparent that a high surface area enhances the visible light absorption. This is likely due to the strong monotonic absorption in the visible light region of the hybridized 1T-2H MoS2. Among the samples, the 2:1 ratio of 1 wt% Ag/CZTS and 1T-2H MoS2 exhibited the best enhancement.
Figure 5.
UV-VIS absorption spectra of (a) CZTS; (b) 1 wt% Ag/CZTS; (c) 10:1 ratio of 1 wt% Ag/CZTS and 1T-2H MoS2; and (d) 2:1 ratio of 1 wt% Ag/CZTS and 1T-2H MoS2.
2.5. PL Analysis
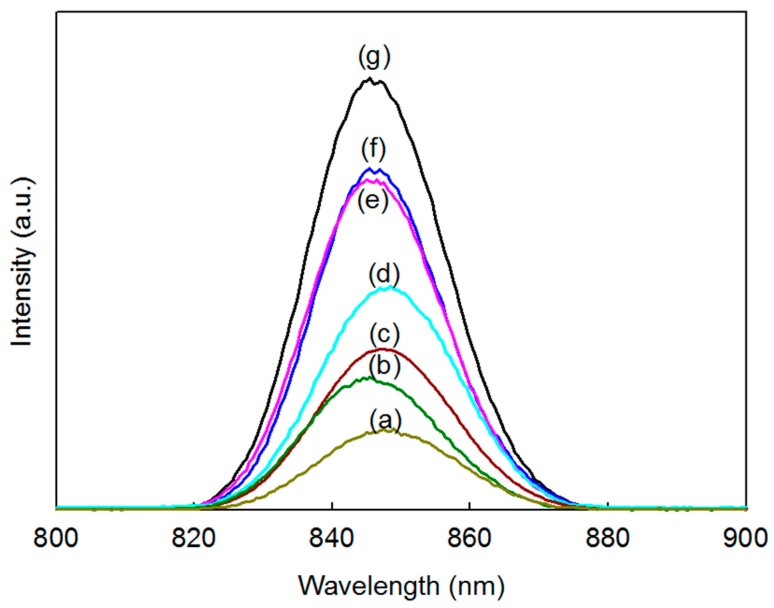
A PL analysis was then performed to determine the effect of Ag on the recombination rate of the photocatalyst. Figure 6 shows that the PL intensity was greatly increased when a 4 and 8 wt% of Ag was added to the CZTS photocatalyst, and a further decrease was observed when the amount was decreased to 2 and 1 wt%. This suggested that the electrons promoted in the conduction band of CZTS jump to the surface plasmon state of Ag, thus reducing the recombination rate of the structure. However, excessive amounts of electrons were generated in the structure, which caused the Ag nanoparticles to serve as a recombination site in the system [30]. On the other hand, 1 wt% Ag/CZTS hybridized a higher SSA of MoS2 that absorbed the visible light and efficiently transferred the photogenerated charge carriers. The CZTS nanoparticles generated excited electrons and holes from its valence band to its conduction band after which the electrons generated in the CZTS conduction band jumped to the surface plasmon state of the Ag nanoparticles to be either directly transferred to MoS2 or shuttled across the Ag to the MoS2. Finally, the presence of hybridized Ag and 1T-2H MoS2 microflower powders might indicate a decrease in the recombination rate necessary for photocatalysis.
Figure 6.
PL spectra of (a) 2:1 ratio of 1 wt% Ag/CZTS and 1T-2H MoS2; (b) 10:1 ratio of 1 wt% Ag/CZTS and 1T-2H MoS2; (c) 1 wt% Ag/CZTS; (d) 2 wt% Ag/CZTS; (e) CZTS; (f) 4 wt% Ag/CZTS; and (g) 8 wt% Ag/CZTS.
2.6. XPS Study
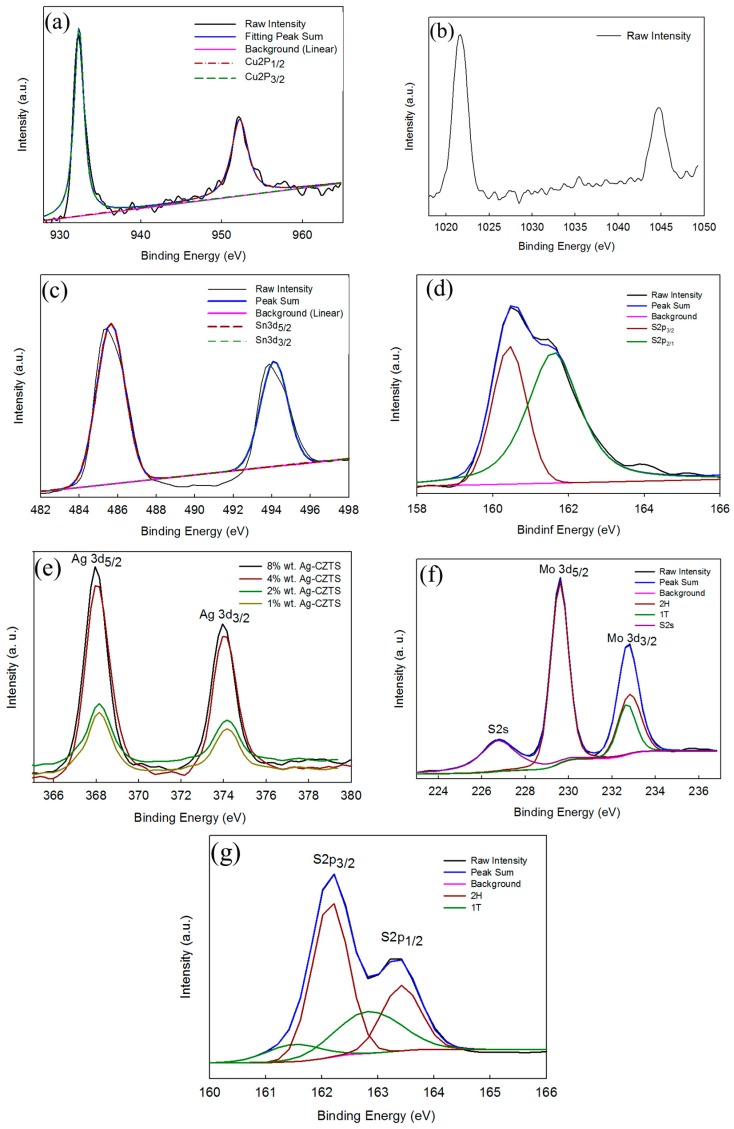
A calibration was made for each sample with respect to 284.6 eV of carbon C 1s. The XPS analysis carried out on the four constituent elements, copper 2p, zinc 2p, tin 3d, and sulfur 2p. (Figure 7a), showed the binding energy of the Cu 2p3/2 and Cu 2p1/2 peaks at 931.4 and 952.2 eV, respectively, with a peak splitting at 19.8 eV, suggesting Cu (I). Figure 7b showed the Zn 2p3/2 and Zn 2p1/2 peaks at 1021.8 and 1044.8 eV, respectively, with a peak splitting at 23 eV, corresponding to Zn (II). Figure 7c shows the Sn 3d5/2 and Sn 3d3/2 peaks at 485.8 and 494.2 eV, respectively, with peak splitting at 8.4 eV, which is in a good agreement with Sn (IV). Figure 7d shows the S 2p3/2, S 2p1/2 peaks at 161.1, 162.3 eV, respectively, from S (II) [5]. The Ag 3d XPS spectra of Ag/CZTS samples obtained from different weight percentages of AgNO3 precursor: 1, 2, 4, and 8 wt% are shown in Figure 7e. The high resolution spectra of the Ag 3d core level for the samples showed two peaks, which were located around 368.2 eV and 374.3 eV. These peaks proved that AgNO3 was successfully reduced to metallic Ag through the microwave-assisted hydrothermal process in water as a solvent [31]. Further confirmation of the existence of the hybridized 1T-2H phase of MoS2 is provided in Figure 7f, where a typical MoS2 microflower shows Mo 3d5/2 and Mo 3d3/2 peaks at 229.7 eV and 232.7 eV for the 2H phase, respectively, and an S 2s peak at 226.6 eV in the high resolution Mo 3d spectrum. Furthermore, a minor peak at 235.7 eV appears to the Mo6+ 3d5/2. However, the samples shift toward lower energy peaks at 228.7 and 231.9 eV for the 1T phase, which shifts toward a lower binding energy with a difference of ~0.8 eV with respect to the peaks in the 1T-2H phase [18,19]. Similarly, Figure 7g shows the S 2p XPS spectra of the MoS2 samples indicating that two additional signatures at 161.7 eV and 162.8 eV appear beside the two S 2p3/2 and S 2p1/2 2H MoS2 peaks at 162.6 eV and 163.7 eV, respectively. These two peaks also shift to the lower binding energy side and are associated with the 1T phase [19].
Figure 7.
High-resolution XPS characterization of as-synthesized (a) Cu 2p; (b) Zn 2p; (c) Sn 3d; (d) S 2p; (e) Ag NPs; (f) Mo 3d; and (g) S 2p.
2.7. Photocatalytic Activity
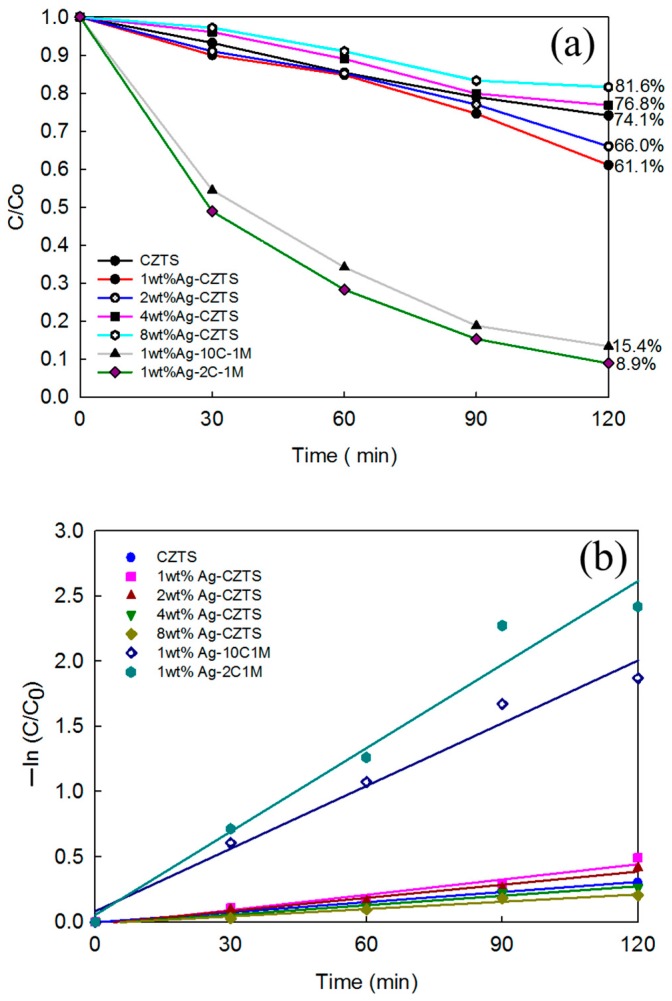
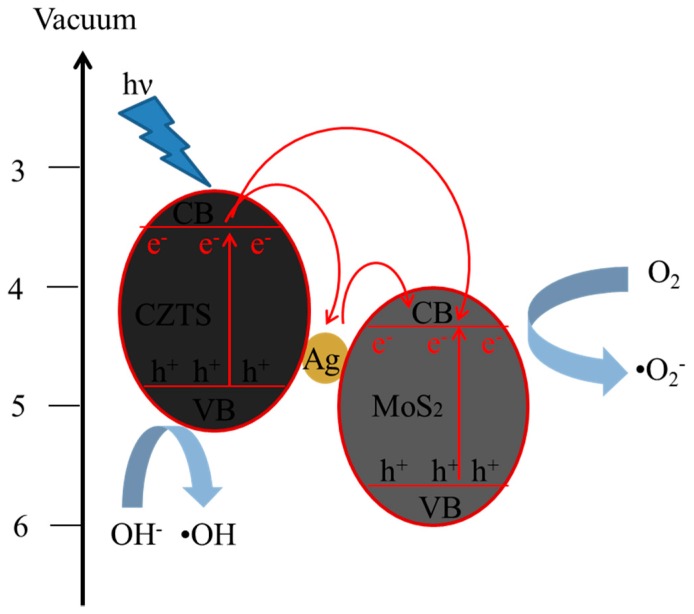
The photocatalytic performance of all of the Ag/CZTS and hybridized 1T-2H MoS2 photocatalysts were measured and compared with the photocatalytic performance. The curves of C/C0, where C0 is the initial concentration of MB, and C is the reaction concentration of MB at time t are shown in Figure 8a. It can be seen that the hybridized Ag decreased as the Ag content increased. In the case of the addition of 1T-2H MoS2, regardless of whether the ratio was lower (10 wt%) or was 1 wt%, Ag doped on the CZTS greatly enhanced the photocatalytic performance. Figure 8b shows the first order linear transform, which was determined by plotting –ln (C/Co) versus irradiation time. The corresponding k values for the CZTS, 1, 2, 4, 8 wt% Ag, the 1 wt% Ag/CZTS, and the 10:1 and 2:1 ratios of the 1T-2H MoS2 microflower powders samples were estimated to be 0.0025, 0.0039, 0.0033, 0.0024, 0.0019, 0.016, and 0.0213 min−1, respectively. The photodegradation rate constant of the three component Ag/CZTS/1T-2H MoS2 sample was faster than that for the CZTS and Ag/CZTS samples. A schematic diagram of the proposed mechanism is provided in Figure 9. The results were attributed to the combined effects of enhanced visible light absorption by Ag and the efficient charge separation due to the MoS2 in the photocatalyst system. Due to the surface plasmon resonance, electrons below the Fermi level of the Ag nanoparticles excited to their plasmonic state. Then, the electrons generated in the CZTS conduction band jumped to the surface plasmon state of the Ag nanoparticles, thus reducing the recombination rate. The electrons generated in and transferred to the Ag nanoparticles reacted to O2 gas to form superoxide radicals (•O2−). These active radicals reacted with the methylene blue solution to degrade it into H2O and CO2. On the other hand, the holes generated in the system reacted with the adsorbed H2O to form hydroxyl radicals (•OH). These active radicals also reacted with the methylene blue solution to degrade it into H2O and CO2.
Figure 8.
Photocatalytic activity under solar irradiation through the hybridized various weight percentages of AgNO3 precursor: 1, 2, 4, and 8 wt% Ag/CZTS and the ratios of 10:1 and 2:1 of 1 wt% Ag/CZTS and 1T-2H MoS2; (a) the degradation of MB; and (b) the photocatalytic degradation kinetics evolution.
Figure 9.
Schematic diagram for proposed photodegradation mechanism of methylene blue solution in the presence of the Ag/CZTS hybridized 1T-2H MoS2 photocatalyst.
3. Materials and Characterization
3.1. Materials
All chemicals were used as received without further purification. Analytical grade materials included copper (II) chloride anhydrous (CuCl2, Choneye pure chemicals Co., Ltd., Taipei City, Taiwan, 98%), zinc chloride (ZnCl2, Merck, Kenilworth, NJ, USA, 98%), stannous chloride dehydrate (SnCl2∙2H2O, Shimakyu, Osaka, Japan, 98%), thiourea (NH2CSNH2, Riedel-de Haën, Mexico City, Mexico, 99%), diethylenediamine (C4H13N3, Panerac quimica sa, Barcelona, Spain, 98%), silver nitrate (AgNO3, Aencore, Surrey Hills, Australia, 99.8%), sodium molybdate dihydrate (NaMoO4∙2H2O, J.T. Baker, Center Valley, PA, USA, 99.5%), and oxalic acid (Riedel-de Haën, 99.5%), and the deionized water (DI water) used was from EMD Millipore Corporation.
3.2. CZTS Convental Hydrothermal Process
Deionized water was used as the solvent. In a typical aqueous synthesis, 30 mmol of thiourea was dissolved in 20 mL of deionized water in a 50 mL Teflon-lined autoclave and stirred for 15 min. 2.5 mmol of ZnCl2 and SnCl2·2H2O were dissolved in 5 mL of deionized water, and 5 mmol of CuCl2 (anhydrous) was used in 10 mL of deionized water. All of the precursors were stirred for 10 min individually and were then poured into the 50 mL Teflon-lined stainless-steel autoclave, with the addition 0.543 mL diethylenediamine (DETA) as the chelating agent. The autoclave was sealed and maintained at 180 °C for 72 h and then allowed to cool down to room temperature naturally. After hydrothermal synthesis, the solution was washed and centrifuged with dimethylformamide and deionized water three times to remove the byproducts and DETA. Black particles were then obtained by drying in an oven at 80 °C for 8 h.
3.3. Ag/CZTS Microwave-Assisted Hydrothermal Process
The obtained CZTS powers were charged 0.75 g then various amounts of AgNO3 solution were added (1 wt%, 2 wt%, 4 wt%, and 8 wt% in 20 mL deionized water). The solution was then loaded into a Teflon-lined autoclave at 200 °C for 1 h in a microwave-assisted system for the hydrothermal process. Finally, the products were washed three times with ethanol and DI water, centrifuged, and dried overnight in a vacuum oven at 60 °C to obtain the 1, 2, 4, and 8 wt% Ag/CZTS powders.
3.4. MoS2 Conventional Hydrothermal Process
MoS2 synthesized from 5 mmol NaMoO4·2H2O and 5 mmol oxalic acid were dissolved in 20 mL DI water and then stirred for 20 min. Then, 20 mmol thiourea was added and dissolved in 10 mL DI water separately. The solutions were then loaded into a 50 mL Teflon-lined autoclave for the hydrothermal process at 200 °C for 24 h. The MoS2 powders were then collected and washed three times with ethanol and DI water. They were then dried at 60 °C overnight in a vacuum oven.
3.5. Ag/CZTS/MoS2 Hybridized Process
Finally, three components of the Ag/CZTS/MoS2 composite were mixed in 20 mL of ethanol with the varying weight ratios of 1 wt% Ag/CZTS and MoS2 powder 10:1 and 2:1 for 1 h. The products were washed three times with DI water and ethanol and then dried at 60 °C overnight in a vacuum oven.
3.6. Characterization
The crystalline structure of the powders was examined using X-ray diffraction (XRD Bruker D8 advance, Billerica, MA, USA). The morphology was determined using field emission scanning electron microscopy (FESEM, JEOL JSM-6701F, Tokyo, Japan). The microstructure was investigated using transmission electron microscopy (TEM, JEOL JEM-2100F, Tokyo, Japan). X-ray photoelectron spectroscopy (XPS, ULVAC-PHI, Inc. PHI 5000 VersaProbe, Chigasaki-shi, Japan) spectra were obtained using a 1486.6 eV Al anode X-ray source. XPS peak 4.1 software was used for the peak fitting, where the resulting peak components were pure Gaussian. The surface area was measured according to Brunauer-Emmet-Teller (BET, Micromeritics Instrument Corp. Tristar II, Norcross, GA, USA). The optical properties of particle suspensions were determined using a UV-VIS absorption spectrum (PerkinElmer Lambda 7500, Waltham, MA, USA). The PL spectra were obtained using a LS-55 fluorescence spectrometer (PerkinElmer, Waltham, MA, USA).
3.7. Photocatalytic Behavior
Methylene blue (MB), which is widely utilized in organic dye textile industries, is typically used in photocatalytic dye degradation studies. All the samples were carried out using 20 mg of the photocatalysts in 60 mL of 20 ppm methylene blue solution. The solution was stirred in the dark for 30 min to achieve the adsorption-desorption equilibrium. Furthermore, stirring was continued under a 300 W halogen lamp intended to simulate sunlight with ~5% UV light. Then, ~4 mL of the charged solution was collected every 30 min and centrifuged for 15 min to remove the photocatalyst completely. The concentration of MB solution was measured with the absorbance at 664 nm with the UV–VIS spectrophotometer (PerkinElmer Lambda 7500, Waltham, MA, USA).
4. Conclusions
In this paper, we discuss the use of a conventional hydrothermal method for the synthesis of Cu2ZnSnS4 powders well indexed into a high-purity KS phase. Furthermore, hybridized Ag/CZTS was successfully synthesized through a microwave-assisted hydrothermal process using water as the solvent for such processes as ultrasound and microwave irradiation to facilitate chemical reactions. It was found that the photocatalytic performance of the CZTS powders was greatly improved by the addition 1 and 2 wt% of Ag NPs deposited on the surface of the CZTS acting as the electron traps of the matrix. This prevented the recombination of electron-hole pairs and improved the charge transfer processes by hybridizing the 1T-2H MoS2 in the structure, thus increasing the light harvesting in photocatalysis due to the broad light absorption range. This technique was attributed to the strong enhancement of visible light absorption and efficient charge separation, leading to reduced recombination. A maximum of 91.1% MB degradation occurred in under 2 h, where the photocatalyst containing a 2:1 ratio of 1 wt% Ag/CZTS and 1T-2H MoS2 exhibited the highest photodegradation.
Acknowledgments
The authors thank the Ministry of Science and Technology of Taiwan for financial support under grant no. NSC 106-2221-E-006-170-MY3.
Author Contributions
All of the authors contributed to this work, discussed the results and implications, and commented on the manuscript. Jyh-Ming Ting conceived the strategies and designed the experiments. Shih-Jen Lin performed the experiments and wrote the paper. Kuo-Chin Hsu assisted with the analytical tools. Yaw-Shyan Fu reviewed and contributed to the final manuscript.
Conflicts of Interest
The authors declare no conflict of interest.
References
- 1.Ratna, Padhi B.S. Pollution due to synthetic dyes toxicity & carcinogenicity studies and remediation. Int. J. Environ. Sci. 2012;3:940–955. doi: 10.6088/ijes.2012030133002. [DOI] [Google Scholar]
- 2.Kochuveedu S.T., Jang Y.H., Kim D.H. A study on the mechanism for the interaction of light. Chem. Soc. Rev. 2013;42:8467–8493. doi: 10.1039/c3cs60043b. [DOI] [PubMed] [Google Scholar]
- 3.ITO K., Nakazawa T. Electrical and optical properties of sannite-type quaternary semiconductor thin film. Jpn. J. Appl. Phys. 1988;11:2094–2097. doi: 10.1143/JJAP.27.2094. [DOI] [Google Scholar]
- 4.Katagiri H., Jimbo K., Maw W.S., Oishi K., Yamazaki M., Araki H., Takeuchi A. Development of CZTS-based thin film solar cells. Thin Solid Films. 2009;517:2455–2460. doi: 10.1016/j.tsf.2008.11.002. [DOI] [Google Scholar]
- 5.Riha S.C., Parkinson B.A., Prieto A.L. Solution-based synthesis and characterization of Cu2ZnSnS4 Nanocrystals. J. Am. Chem. Soc. 2009;131:12054–12055. doi: 10.1021/ja9044168. [DOI] [PubMed] [Google Scholar]
- 6.Akpan U.G., Hameed B.H. Parameters affecting the photocatalytic degradation of dyes using TiO2-based photocatalysts: A review. J. Hazard. Mater. 2009;170:520–529. doi: 10.1016/j.jhazmat.2009.05.039. [DOI] [PubMed] [Google Scholar]
- 7.Pelaez M., Nolan N.T., Pillai S.C., Seery M.K., Falaras P., Kontos A.G., Dunlop S.M., Hamilton J.W., Byrne J.A., O’Shea K., et al. A review on the visible light active titanium dioxide photocatalysts for environmental applications. Appl. Catal. B Environ. 2012;125:331–349. doi: 10.1016/j.apcatb.2012.05.036. [DOI] [Google Scholar]
- 8.Gaya U.I., Abdullah A.H. Heterogeneous photocatalytic degradation of organic contaminants over titanium dioxide: A review of fundamentals, progress and problems. J. Photochem. Photobiol. A Rev. 2008;9:1–12. doi: 10.1016/j.jphotochemrev.2007.12.003. [DOI] [Google Scholar]
- 9.Kumar A., Mathur N. Photocatalytic degradation of aniline at the interface of TiO2 suspensions containing carbonate ions. J. Colloid Interface Sci. 2006;300:244–252. doi: 10.1016/j.jcis.2006.03.046. [DOI] [PubMed] [Google Scholar]
- 10.Asahi R., Morikawa T., Ohwaki T., Aoki K., Taga Y. Visible-Light Photocatalysis in Nitrogen-Doped Titanium Oxides. Science. 2001;293:269–271. doi: 10.1126/science.1061051. [DOI] [PubMed] [Google Scholar]
- 11.Sathish M., Viswanathan B., Viswanath R.P., Gopinath C.S. Synthesis, characterization, electronic structure, and photocatalytic activity of nitrogen-Doped TiO2 nanocatalyst. Chem. Mater. 2005;17:6349–6353. doi: 10.1021/cm052047v. [DOI] [Google Scholar]
- 12.Chen X., Burda C. The electronic origin of the visible-light absorption properties of C-, N- and S-doped TiO2 nanomaterials. J. Am. Chem. Soc. 2008;130:5018–5019. doi: 10.1021/ja711023z. [DOI] [PubMed] [Google Scholar]
- 13.Williams G., Seger B., Kamat P.V. TiO2-graphene nanocomposites uv-assisted photocatalytic reduction of graphene oxide. Am. Chem. Soc. Nano. 2008;7:1487–1491. doi: 10.1021/nn800251f. [DOI] [PubMed] [Google Scholar]
- 14.Awazu K., Fujimaki M., Rockstuhl C., Tominaga J., Murakami H., Ohki Y., Yoshida N., Watanabe T. A plasmonic photocatalyst consisting of silver nanoparticles embedded in titanium dioxide. J. Am. Chem. Soc. 2008;130:1676–1680. doi: 10.1021/ja076503n. [DOI] [PubMed] [Google Scholar]
- 15.Yi Z., Ye J., Kikugaw N., Kako T., Ouyang S., Stuart-Williams H., Cao J., Luo W., Li Z., Liu Y., et al. An orthophosphate semiconductor with photooxidation properties under visible-light irradiation. Nat. Mater. 2010;9:559–564. doi: 10.1038/nmat2780. [DOI] [PubMed] [Google Scholar]
- 16.Yang X., Cui H., Li Y., Qin J., Zhang R., Tang H. Fabrication of Ag3PO4-Graphene composites with highly efficient and stable visible light photocatalytic performance. ACS Catal. 2013;3 doi: 10.1021/cs3008126. [DOI] [Google Scholar]
- 17.Liang Q., Shi Y., Ma W., Li Z., Yang X. Enhanced photocatalytic activity and structural stability by hybridizing Ag3PO4 nanospheres with graphene oxide sheets. Phys. Chem. Chem. Phys. 2012;14:15657–15665. doi: 10.1039/c2cp42465g. [DOI] [PubMed] [Google Scholar]
- 18.Geng X., Sun W., Wu W., Chen B., Al-Hilo A., Benamara M., Zhu H., Watanabe F., Cui J., Chen T.P. Pure and stable metallic phase molybdenum disulfide nanosheets for hydrogen evolution reaction. Nat. Commun. 2016;7:1–7. doi: 10.1038/ncomms10672. [DOI] [PMC free article] [PubMed] [Google Scholar]
- 19.Jiang L., Zhang S., Kulinich S.A., Song X., Zhu J., Wang X., Zeng H. Optimizing hybridization of 1t and 2h phases in mos2 monolayers to improve capacitances of supercapacitors. Mater. Res. Lett. 2015;3:177–183. doi: 10.1080/21663831.2015.1057654. [DOI] [Google Scholar]
- 20.Yu X., Shavel A., An X., Luo Z., Ibáñez M., Cabot A. Cu2ZnSnS4-Pt and Cu2ZnSnS4-Au heterostructured nanoparticles for photocatalytic water splitting and pollutant degradation. J. Am. Chem. Soc. 2014;130:9236–9239. doi: 10.1021/ja502076b. [DOI] [PubMed] [Google Scholar]
- 21.Jiang F., Gunawan, Harada T., Kuang Y., Minegishi T., Domen K., Ikeda S. Pt/In2S3/CdS/Cu2ZnSnS4 thin film as an efficient and stable photocathode for water reduction under sunlight radiation. J. Am. Chem. Soc. 2015;137:13691–13697. doi: 10.1021/jacs.5b09015. [DOI] [PubMed] [Google Scholar]
- 22.Xia Y., Wanga B., Zhaoa X., Wang G., Wang H. Core-shell composite of hierarchical MoS2 nanosheets supported on graphitized hollow carbon microspheres for high performance lithium-ion batteries. Electrochim. Acta. 2016;187:55–64. doi: 10.1016/j.electacta.2015.11.047. [DOI] [Google Scholar]
- 23.Ha E., Liu W., Wang L., Man H.W., Hu L., Tsang E.S.C., Chan C.T.L., Kwok W.M., Lee L.Y.S., Wong K.Y. Cu2ZnSnS4/MoS2-Reduced graphene oxide heterostructure: Nanoscale interfacial contact and enhanced photocatalytic hydrogen generation. Sci. Rep. 2017;7:1–8. doi: 10.1038/srep39411. [DOI] [PMC free article] [PubMed] [Google Scholar]
- 24.Gogoi G., Arora S., Vinothkumar N., De M., Qureshi M. Quaternary semiconductor Cu2ZnSnS4 loaded with MoS2 as a co-catalyst for enhanced photo-catalytic activity. R. Soc. Chem. 2015;5:40475–40783. doi: 10.1039/C5RA03401A. [DOI] [Google Scholar]
- 25.Turnbull M.J., Khoshmashrab S., Wang Z., Harbottle R., Sham T.K., Ding Z. Controlling Cu2ZnSnS4 photocatalytic ability through alterationsin sulfur availability. Catal. Today. 2016;260:119–125. doi: 10.1016/j.cattod.2015.05.028. [DOI] [Google Scholar]
- 26.Rasamani K.D., Alimohammadi F., Sun Y. Interlayer-expanded MoS2. Mater. Today. 2017;20:83–91. doi: 10.1016/j.mattod.2016.10.004. [DOI] [Google Scholar]
- 27.Wang X., Tang Y., Chen Z., Lim T.T. Highly stable heterostructured Ag–AgBr/TiO2 composite: A bifunctional visible-light active photocatalyst for destruction of ibuprofen and bacteria. J. Mater. Chem. 2012;22:23149–23158. doi: 10.1039/c2jm35503e. [DOI] [Google Scholar]
- 28.Mackinnon D.J., Brannen J.M., Morrison R.M. The effect of thiourea on zinc electrowinning from industrial acid sulphate electrolyte. J. Appl. Electrochem. 1988;18:252–256. doi: 10.1007/BF01009272. [DOI] [Google Scholar]
- 29.Cheong W.J., Luan B.L., Shoesmith D.W. The effects of stabilizers on the bath stability of electroless Ni deposition and the deposit. Appl. Surf. Sci. 2004;229:282–300. doi: 10.1016/j.apsusc.2004.02.003. [DOI] [Google Scholar]
- 30.Pugazhenthiran N., Murugesan S., Anandan S. High surface area Ag-TiO2 nanotubes for solar/visible-light photocatalytic degradation of ceftiofur sodium. J. Hazard. Mater. 2013;263:541–549. doi: 10.1016/j.jhazmat.2013.10.011. [DOI] [PubMed] [Google Scholar]
- 31.Dallinger D., Kappe C.O. Microwave-Assisted Synthesis in Water as Solvent. Chem. Rev. 2007;107:2563–2591. doi: 10.1021/cr0509410. [DOI] [PubMed] [Google Scholar]


