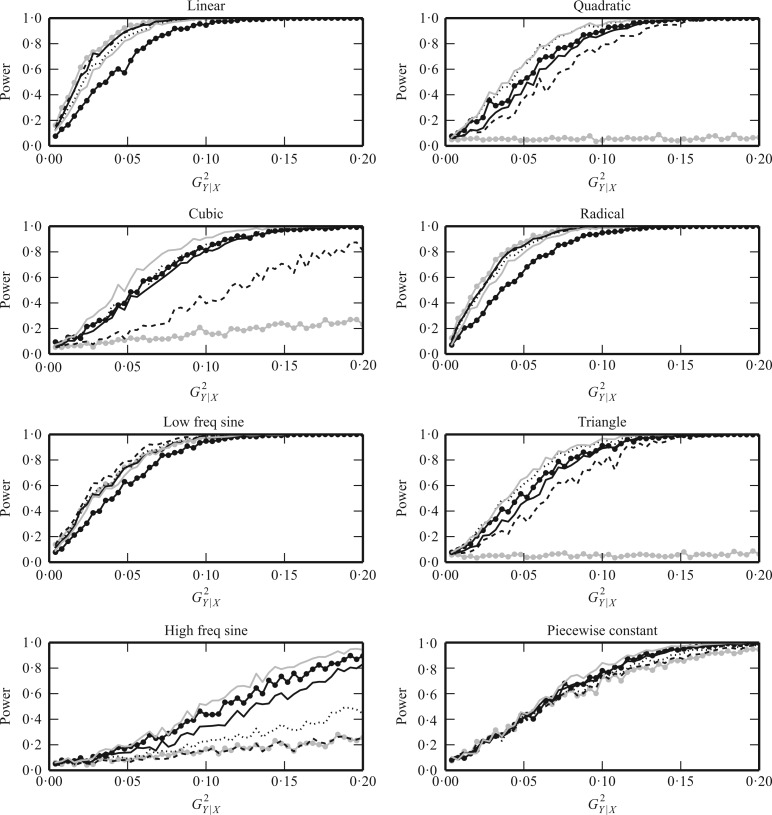
Fig. 2.
The powers of  (black solid),
 (grey solid), Pearson
correlation (grey circles), distance correlation (black dashed), the method of Heller et al. (2016) (black dotted) and
 (black circles)
for testing independence between
  and
and
 when the underlying true functional
relationships are linear, quadratic, cubic, radical, low-frequency sine, triangle,
high-frequency sine, and piecewise constant. The horizontal axis represents
 , a monotone function of
the signal-to-noise ratio, and the vertical axis is the power. We chose
 and performed 1000 replications
for each relationship and each
  value.

