Figure 5.
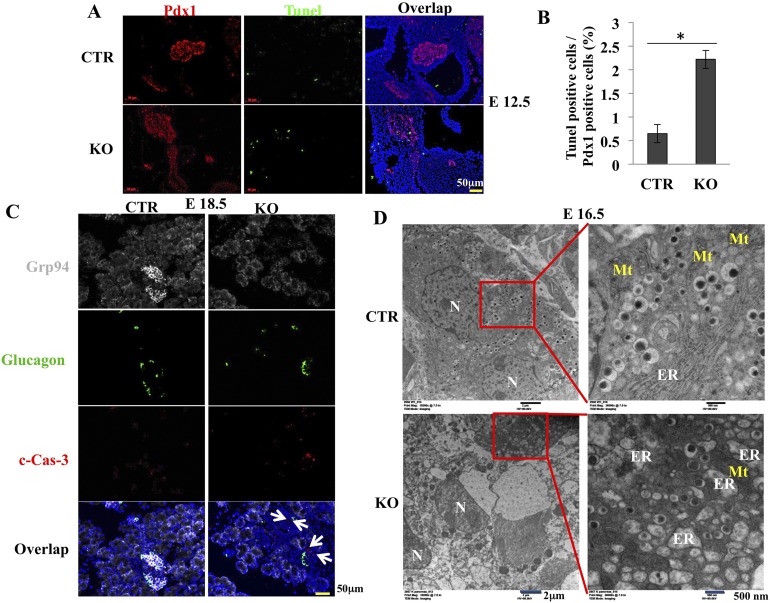
Deletion of GRP94 leads to more cell death and ER structural changes in KO mice compared with CTR. (A) Immunohistochemical staining and (B) quantification of TUNEL+ (green) cells among Pdx1+ (red) cells in embryos from CTR (n = 4) and KO (n = 5) mice at E12.5. Nuclei are stained blue. Scale bar = 50 μm. (C) Cleaved caspase-3 (c-Cas-3) staining in pancreatic islets from CTR (n =3) and KO (n = 3) mice at E18.5. GRP94 (gray), glucagon (green), and c-Cas-3 (red). Nuclei are stained blue. White arrows point to c-Cas-3+ cells. Scale bar = 50 μm. (D) Transmission electron microscopy of pancreatic β cells from CTR and KO mice at E16.5. Islets are identified by the presence of insulin-containing granules with a typical electron-dense core, readily seen at higher magnification (right panels). Mt, mitochondria; N, nucleus. Scale bar: left = 2 μm and right = 500 nm. *P < 0.05, Student t test.

