Abstract
The cannabinoid receptor 1 (CB1) is the principal target of the psychoactive constituent of marijuana, the partial agonist Δ9-tetrahydrocannabinol (Δ9-THC)1. Here we report two agonist-bound crystal structures of human CB1 in complex with a tetrahydrocannabinol (AM11542) and a hexahydrocannabinol (AM841) at 2.80 Å and 2.95 Å resolution, respectively. The two CB1–agonist complexes reveal important conformational changes in the overall structure, relative to the antagonist-bound state2, including a 53% reduction in the volume of the ligand-binding pocket and an increase in the surface area of the G-protein-binding region. In addition, a ‘twin toggle switch’ of Phe2003.36 and Trp3566.48 (superscripts denote Ballesteros–Weinstein numbering3) is experimentally observed and appears to be essential for receptor activation. The structures reveal important insights into the activation mechanism of CB1 and provide a molecular basis for predicting the binding modes of Δ9-THC, and endogenous and synthetic cannabinoids. The plasticity of the binding pocket of CB1 seems to be a common feature among certain class A G-protein-coupled receptors. These findings should inspire the design of chemically diverse ligands with distinct pharmacological properties.
Cannabis sativa L., commonly known as marijuana, has been used for medicinal and recreational purposes across different cultures for more than 5,000 years4,5. The principal Cannabis constituent, Δ9-THC, exerts its psychotropic effects by activating CB1, which is also the primary target of the endocannabinoids, anandamide (AEA) and 2-arachidonoyl glycerol (2-AG)1,6. Structural examination of CB1 in complex with the antagonist AM65382 and taranabant7 provides molecular insights into the inactive state of the receptor, yet does not inform us as to how CB1 elicits its diverse physiological effects.
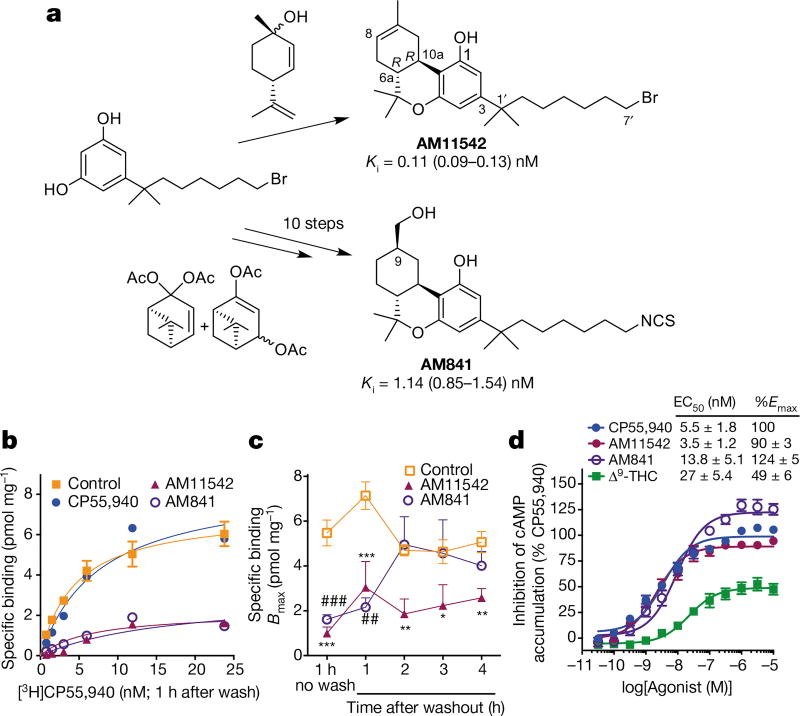
To facilitate CB1 crystallization in agonist-bound form, two potent CB1 agonists, AM11542 and AM841, were designed to introduce a tricyclic terpenoid ring system, the 6aR, 10aR stereochemistry at the junction of the B- and C-rings and the phenolic hydroxyl group at C1, all of which also characterize the Δ9-THC tricyclic ring system (Fig. 1a, Methods and Extended Data Fig. 1). The two ligands used in this study differ from Δ9-THC by possessing a pivotal 1′,1′ -gem-dimethylheptyl (DMH) alkyl chain at the C3 position as well as bromo and isothiocy-anato groups as ω -substituents for AM11542 and AM841, respectively (Fig. 1a). Having high affinity for CB1 and binding in a wash-resistant manner to the receptor (Fig. 1a–c), both AM11542 and AM841 are potent, full agonists of CB1 as determined by their ability to inhibit forskolin-stimulated accumulation of cAMP compared to CP55,940, whereas Δ9-THC acts as a partial agonist in this assay (Fig. 1d).
Figure 1. Synthesis and pharmacological characterization of AM11542 and AM841.
a, Synthesis of AM11542 and AM841 (Extended Data Fig. 1) with radioligand binding affinity against [3H]CP55,940. Ki, inhibition constant. b, Cell membranes were pretreated with CP55,940 (4 nM), AM11542 (1 nM), AM841 (10 nM) or buffer (control) for 1 h, washed, and then subjected to [3H]CP55,940 binding for 1 h. c, Bmax values (maximal binding capacity) were calculated from b and in experiments where the incubation time of radioligand was increased following the washing. Pretreatment with either AM11542 or AM841 prevents radioligand binding after 1 h incubation (control: versus AM841: ##P < 0.01; versus AM11542 * * * P < 0.001), while AM11542 prevents radioligand binding at all later time points tested (control versus AM11542: * P < 0.05, * * P < 0.01). Displacement of [3H]CP55,940 binding in the presence of AM11542 (versus control: * * * P < 0.001) and AM841 (versus control: ###P < 0.001) are shown for comparison. (Student’s t-test versus control at each time point; data are mean ± s.e.m.; n = 3–6.) d, Agonist activity measured as the inhibition of forskolin-stimulated cAMP accumulation. Data are mean ± s.e.m. of n ≥ 6 independent experiments. %Emax, percentage of maximum response; EC50, half-maximum effective concentration.
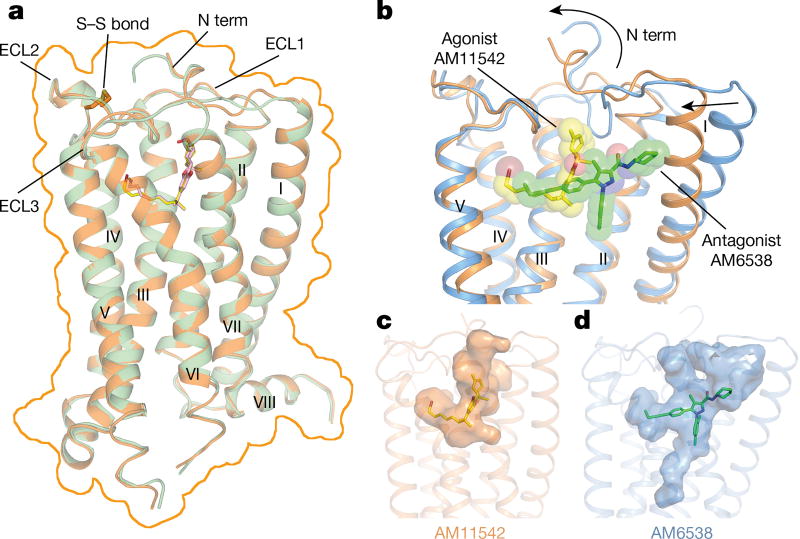
The two agonist-bound CB1 structures were determined using a thermostabilizing construct as previously described2 for CB1–AM6538 (Extended Data Fig. 2, Extended Data Table 1). The receptor conformations of the AM11542- and AM841-bound complexes are very similar (Cα root mean square deviation (r.m.s.d.) = 0.66 Å), and both ligands overlay well in the same binding pocket (Fig. 2a, Extended Data Fig. 3a). Thus, we focus our discussions mainly on the higher resolution CB1–AM11542 structure, while mentioning specific differences of the AM841-bound complex where relevant. In contrast to a V-shaped loop in the CB1–AM6538 structure, the truncated N terminus resides over the ligand-binding pocket where it is not directly involved in agonist binding (Fig. 2b), although it does not preclude the possibility that there may be conformational changes in a full-length N-terminal domain. A cholesterol molecule, which is absent in the antagonist-bound structure, is observed between the cytoplasmic portion of helices II, III and IV in the agonist-bound complexes (Extended Data Fig. 3b). This cholesterol binding cavity is revealed through a rotation of helix II coupled with conformational changes of the side chain of Leu1652.52 (superscript denotes Ballesteros–Weinstein numbering3).
Figure 2. Overall structures of CB1–AM11542 and CB1–AM841 complexes.
a, Superposition of CB1–AM11542 and CB1–AM841 structures with the surface outlined by an orange line. CB1 is shown in orange and green cartoon with ligands AM11542 (yellow sticks) and AM841 (pink sticks). b, Comparison of agonist-bound (orange cartoon) and antagonist-bound (blue cartoon) CB1 ligand-binding pockets. AM11542 (yellow) and AM6538 (green) are shown in sticks and sphere representations. c, d, The shape of AM11542 (c) and AM6538 (d) binding pockets are shown in surface representation.
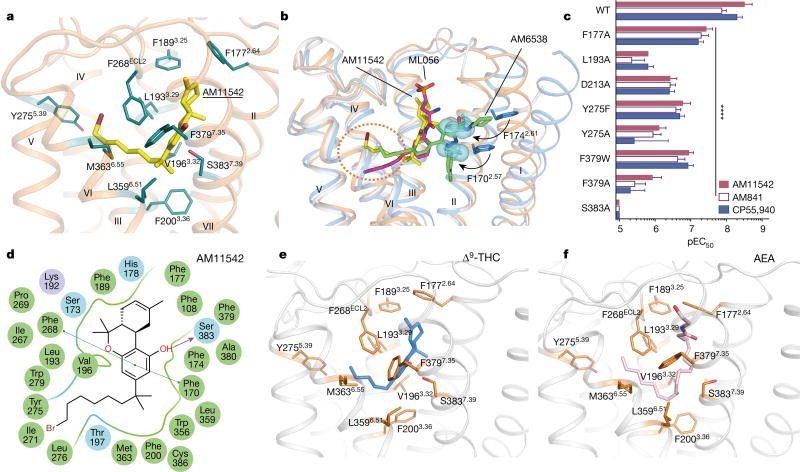
The agonist AM11542 adopts an L-shape conformation in the orthosteric-binding pocket, which is much smaller than the more expanded binding domain in the antagonist AM6538-bound structure (Fig. 2b–d). The interactions between AM11542 and CB1 are mainly hydrophobic and aromatic, consisting of residues from extracellular loop 2 (ECL2), helices III, V, VI and VII (Fig. 3a, d). The tricyclic tetrahydrocannabinol ring system of AM11542 forms π–π interactions with Phe268ECL2, Phe3797.35, Phe1893.25 and Phe1772.64, and the phenolic hydroxyl at C1 forms a hydrogen bond with Ser3837.39. In agreement, mutations of Ser3837.39Ala or Phe3797.35Ala greatly reduce CB1 agonist potency of cannabinoid-like agonists, such as AM11542, AM841 and CP55,940, respectively (Fig. 3c, Extended Data Fig. 4b, Extended Data Table 2). Of note, the hydroxyl group at the C11 position of AM841 forms an additional hydrogen bond with Ile267ECL2.
Figure 3. AM11542 binding pocket analysis and molecular docking of Δ9-THC and AEA.
a, Key residues (deepteal sticks) involved in AM11542 (yellow sticks) binding. b, Binding pose comparison of AM11542 (yellow), AM6538 (green) and ML056 (magenta) in their receptors, which are shown in orange, blue and grey cartoon, respectively. Phe1702.57 and Phe1742.61 in AM11542 and AM6538 complexes are shown in blue sphere and blue sticks, respectively. c, Certain mutations on CB1 significantly decreased potency in the cAMP assay compared to agonist-response at the wild-type (WT) receptor as determined by comparison of negative logarithm of the EC50 (pEC50) values by two-way analysis of variance (ANOVA) without repeated measures followed by Dunnett’s post hoc test (comparing each drug to its effect in the wild type: * * * * P < 0.0001, data are mean ± s.e.m., n ≥ 3) (Extended Data Table 2). d, Summary of receptor interactions of AM11542. Purple ball (positive charged interaction); cyan ball (polar interaction); green ball (hydrophobic interaction); purple arrow (H-bond); green line (π–π stacking) e, f, The docking pose of Δ9-THC (e, blue sticks) and AEA (f, pink sticks).
The alkyl chain of the agonist extends into the long channel formed by helices III, V and VI, undergoing hydrophobic interactions with Leu1933.29, Val1963.32, Tyr2755.39, Leu2765.40, L3596.51 and Met3636.55 (Fig. 3a, d). In addition, the isothiocyanate moiety of AM841 forms a hydrogen bond with Tyr2755.39. Notably, Leu1933.29Ala and Tyr2755.39Ala mutations markedly decrease the potency of the agonists (Fig. 3c, Extended Data Fig. 4b, Extended Data Table 2). Structure–activity relationship (SAR) studies with classical cannabinoids have shown that the C3 alkyl chain lengths and ω -substitutions modulate ligand affinity. Also, incorporation of a C1′ -gem-dimethyl group affects the conformational properties of the alkyl chain and leads to notable enhancement in potency and efficacy8–11. Unlike Δ9-THC, which has a shorter alkyl chain (n-pentyl), our results show that longer alkyl chains coupled with a C1′ -gem-dimethyl group allow extended interactions with CB1, while the C1′ -gem-dimethyl group forms hydrophobic interactions with Phe2003.36, Leu3596.51 and Met3636.55 (Fig. 3a, d). Taken together, these data provide important insights into the key role of the DMH moiety in activating CB1.
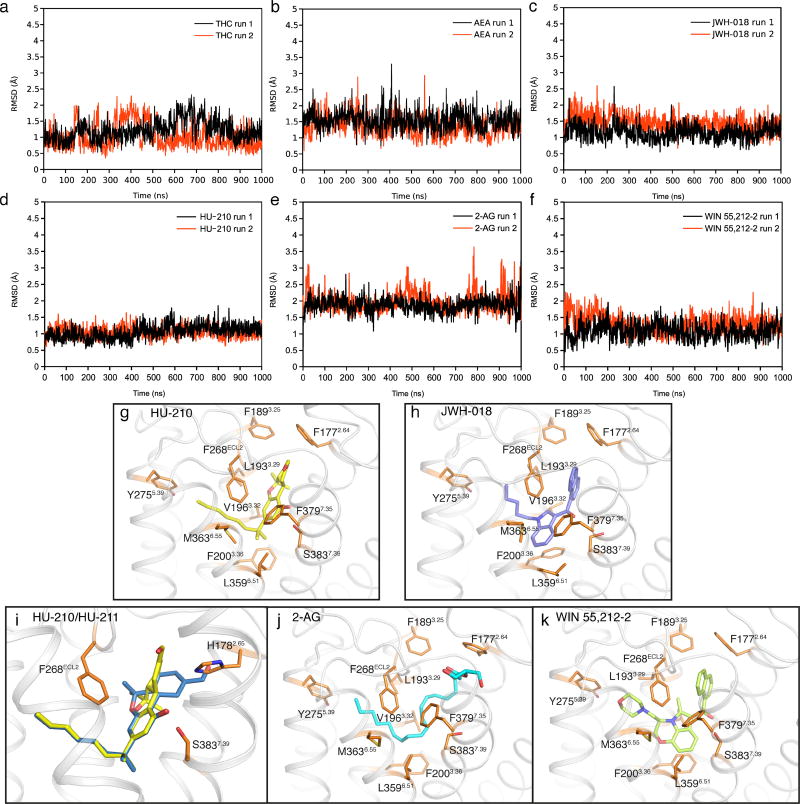
On the basis of the AM11542-bound CB1 structure and mutagenesis data12, we investigated the interactions of representative agonists from three different scaffolds (classical cannabinoids, endocannabinoids and aminoalkylindoles) with CB1 through docking and molecular dynamics validation (Fig. 3e, f, Extended Data Fig. 5). The predicted binding mode of the classical cannabinoids Δ9-THC (Fig. 3e) and HU-210 (Extended Data Fig. 5g) resembles that of AM11542 in the CB1 crystal structure. HU-211, the enantiomer of HU-210, does not activate CB113,14 as it exhibits severe clashes when superimposed with its active enantiomer HU-210 (Extended Data Fig. 5i). The endocannabinoids AEA (Fig. 3f) and 2-AG (Extended Data Fig. 5j) adopt a C-shaped conformation and their long tails extend into the long channel. In comparison with other lipid receptors, such as sphingosine-1-phosphate receptor 1 (S1P1), the alkyl chain of AM11542 and AM841 occupies a similar position as in ‘arm 2’ of the antagonist AM65382, as well as the alkyl chain of ML056 in the S1P1 receptor15 (Fig. 3b), indicating that this could be a conserved binding pocket for alkyl chains within lipid-binding receptors. The structurally distinct aminoalkylindoles WIN 55,212-2 (Extended Data Fig. 5k) and JWH-018 (Extended Data Fig. 5h) occupy the same position in the pocket as AM11542 and AM841, exhibiting major π–π interactions with aromatic residues instead of hydrogen-bond interactions as observed in most classical cannabinoid–CB1 interactions.
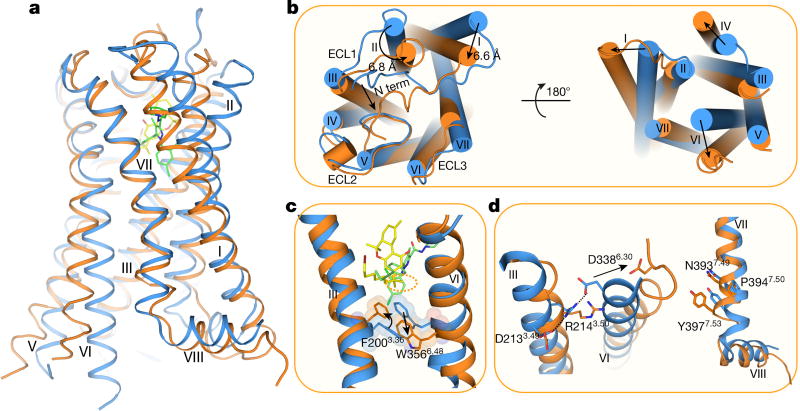
Comparisons between the agonist- and antagonist-bound CB1 reveal marked structural rearrangements (Cα r.m.s.d. of the overall structure without fusion protein: 3.52 Å; Fig. 4a). Compared with the AM6538-bound CB1, the notable conformational change occurs in helices I and II. The extracellular part of helix I bends inwards by 6.6 Å and helix II rotates in by about 6.8 Å, respectively in the AM11542-bound structure (Fig. 4b). Similarly, important conformational changes are also observed in the cytoplasmic part of the receptor, in which helix VI moves outwards by about 8 Å (Fig. 4b), resembling the β 2 adrenergic receptor (β 2AR)–Gs complex16. This is the largest structural change, especially within the extracellular portion, observed in the solved agonist/antagonist-bound pairs of class A G-protein-coupled receptors (GPCRs) (Extended Data Table 3). Consequently, owing to the inward shifts of helices I/II, and the subsequent inward rotation of the side chains of Phe1702.57 and Phe1742.61 that occupy the gap pocket2 (Fig. 3b), the volume of the ligand-binding pocket shrinks from 822 Å3 in the antagonist-bound structure to 384 Å3 in the agonist-bound complex, representing a 53% reduction (Fig. 2c, d, Extended Data Table 3).
Figure 4. Structural comparison of agonist-and antagonist-bound CB1.
a, Side view of the CB1–AM11542 complex (receptor as orange and ligand as yellow) and CB1–AM6538 complex (receptor in blue and ligand as green). b, The extracellular (left) and intracellular (right) views of the compared receptors. c, The ‘twin toggle switch’, Phe2003.36/Trp3566.48, is shown in sticks and spheres. Colour scheme as in a. d, Rearrangement of DRY (left) and NPXXY motifs (right) in agonist- and antagonist-bound CB1 structures.
The agonist-induced conformational changes, discussed above, probably trigger the activation and downstream signalling associated with CB1. From a more granular perspective, CB1 seems to use an extended molecular toggle switch involving a synergistic conformational change between Phe2003.36 and Trp3566.48, which we refer to as the ‘twin toggle switch’ (Fig. 4c). In the AM6538-bound structure, Phe2003.36 points away from the ligand-binding pocket and forms an aromatic stacking interaction with Trp3566.48, which may contribute to stabilization of the receptor in the inactive state (Fig. 4c). While in the AM11542-bound structure, the cooperative rotation of helix III and the side-chain flipping of Phe2003.36 lead the phenyl ring to point towards the ligand and form hydrophobic interactions with the C1′-gem-dimethyl group of AM11542 (Fig. 4c). Simultaneously, the outwards rotation of helix VI leads the side chain of Trp3566.48 to swing away from the ligands (Fig. 4c), disrupting the π–π stacking of the side chains of Phe2003.36 and Trp3566.48. Comparing previously proposed ‘toggle switch’ of Trp3566.48, the synergistic movement of two residues, Phe2003.36 and Trp3566.48, during the activation of receptors has never been observed before and we speculate that this twin toggle switch is related to CB1 activation, a structural observation that is in agreement with a previous modelling study17,18.
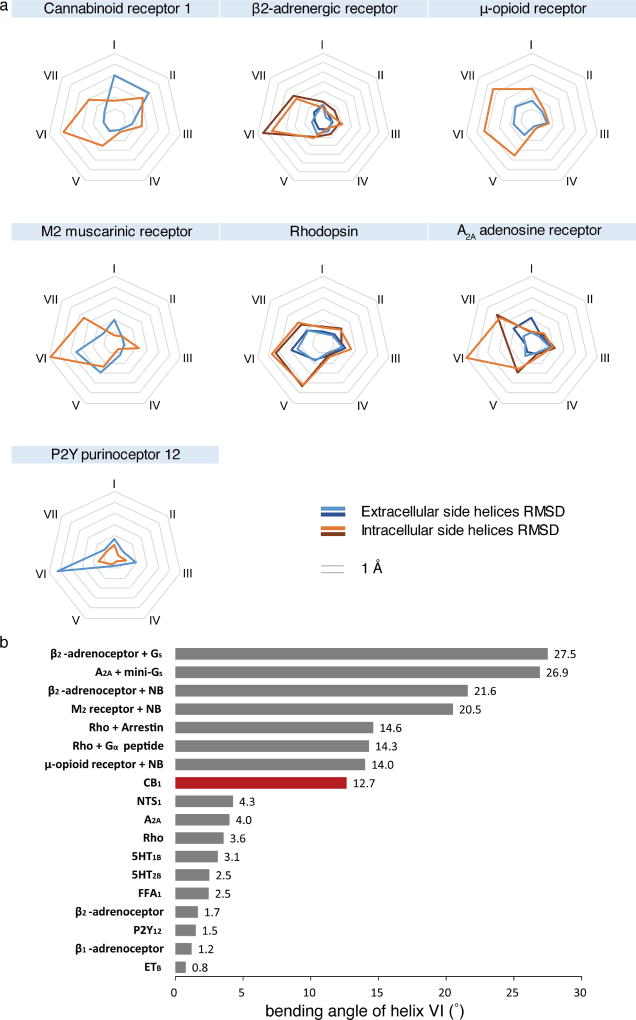
To investigate whether the twin toggle switch concept exists in other receptors, we performed a sequence analysis among class A GPCRs that shows that CB2 as well as certain chemokine receptors (such as CCR2 and CCR5), possess an aromatic residue at the appropriate position (Phe/Tyr3.36) to synergize with the highly conserved tryptophan on helix VI (Trp6.48). In addition, the highly conserved E/DRY motif and NPXXY motif are also rearranged in the AM11542 agonist-bound CB1 structure. The polar network around the DRY motif is disrupted during activation (Fig. 4d). Arg2143.50 adopts an extended conformation, the intra-helical salt bridge between Asp2133.49 and Arg2143.50 as well as the ‘ionic lock’ between Arg2143.50 and Asp3386.30 are broken, resulting in rotamer shift of Asp3386.30 and movement of helix VI away from helix III (Fig. 4d). Notably, CB1 shows the largest helix VI bending angle among all known agonist-bound (without G protein or G-protein mimics) class A GPCRs (Extended Data Fig. 6b). Similarly, the most important rearrangement around NPXXY region is a partial ‘unwinding’ of helix VII around Tyr3977.53 (Fig. 4d).
A notable feature of the CB1 agonist bound structure is the large (53%) reduction in volume in the ligand-binding pocket between agonist- and antagonist-bound structures, and subsequent volume increase in the intracellular G-protein-binding site. Such plasticity in the orthosteric binding pocket enables CB1 to respond to a diverse array of ligands with considerably different sizes, shapes and associated functions, consistent with the repertoire of CB1 to modulate such varied physiological and psychological activities.
To investigate whether a similar feature exists in other receptors, the ligand-binding volume of all agonist- and antagonist-bound structural pairs in class A GPCRs are compared (Extended Data Table 3). Related to the ligand-binding volume change, we analysed the helices movement between antagonist- and agonist-bound structures in extracellular and intracellular halves. In most structural pairs, the extracellular half undergoes small changes while larger conformational changes in the intracellular half occur due to movements of helices VI, V and VII (Extended Data Fig. 6a). As an exception to this minimal trigger, CB1 has the largest ligand-binding pocket volume change, contributed mainly by the movements of the extracellular half of helices I and II. Large inwards bending (over 4 Å) of helix VI is also observed in the purinergic receptor P2Y12 structure19,20 (Extended data Fig. 6a). The balloon-like flexibility of CB1 in the extracellular region may also occur in other GPCRs. Therefore, while designing GPCR agonists and antagonists using structure-based strategies, multiple, structurally varied receptor models should be considered.
Methods
No statistical methods were used to predetermine sample size. However, for mutants in the cAMP accumulation assays, after an n = 3 was obtained, an additional power analysis was performed (alpha = 0.05; power = 80%) to determine the n required to have confidence in the values produced; additional curves were added as indicated.
Synthesis of AM11542 and AM841: experimental procedures and spectroscopic data
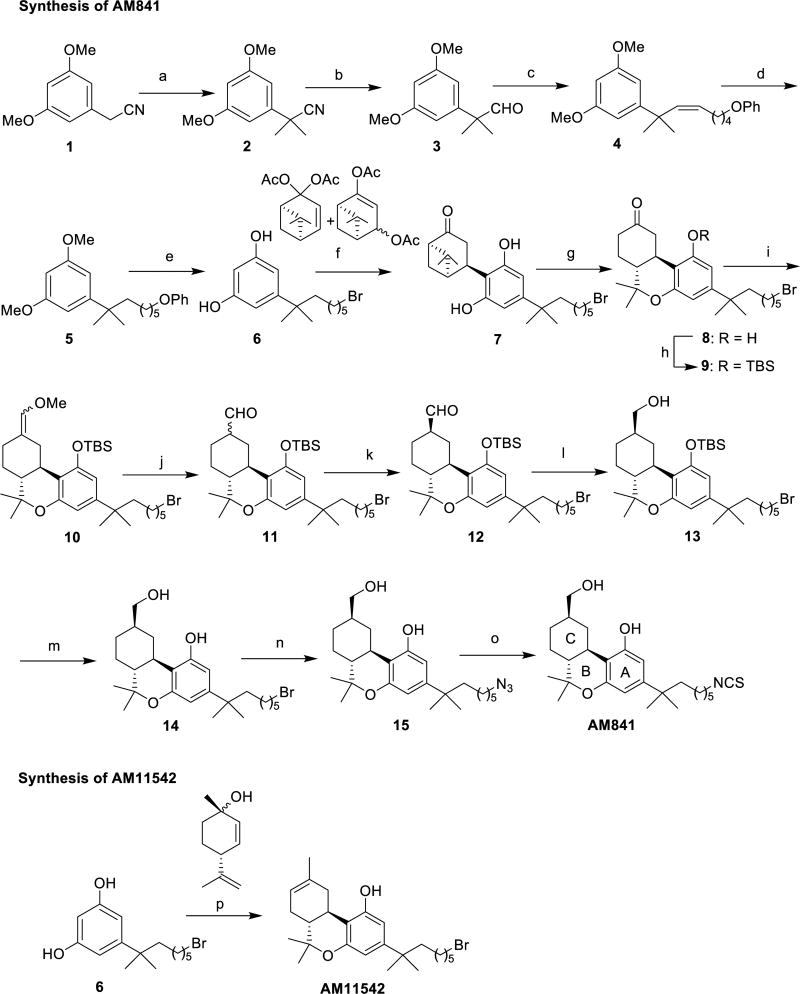
Experimental procedures for steps a–m (Extended Data Fig. 1) are similar to those we reported earlier for closely related systems9,21,22.
(6aR,9R,10aR)-3-(8-bromo-2-methyloctan-2-yl)-1-((tert-butyldimethylsilyl)oxy)-6,6-dimethyl-6a,7,8,9,10,10a-hexahydro-6H-benzo[c]chromene-9-carbaldehyde (12)
Colourless oil. 1H NMR (500 MHz, CDCl3) δ 9.63 (d, J = 1.5 Hz, 1H, 9β -CHO), 6.38 (d, J = 2.0 Hz, 1H, Ar-H), 6.32 (d, J = 2.0 Hz, 1H, Ar-H), 3.52–3.46 (t and m as br d overlapping, t, J = 6.5 Hz, 2H, -CH2Br, m as br d, J = 13.5 Hz, 1H, C-ring), 2.46–2.33 (m, 2H, C-ring), 2.14–2.06 (m, 1H, C-ring), 2.02–1.96 (m, 1H, C-ring), 1.69 (sextet, J = 6.7 Hz, 2H, 6′-H), 1.52–1.42 (m, 4H, 2′-H, C-ring), 1.42–130 (m and s, overlapping, 5H, -CH2- of the side chain and 1.39, s, 6-Me), 1.26–1.10 (m, 10H, -CH2- of the side chain, C-ring and -C(CH3)2-), 1.09–1.00 (m, s and s, overlapping, 14H as follows: 2H, -CH2- of the side chain, 1.08, s, 3H, 6-Me, 1.01, s, 9H, -Si(Me)2CMe3), 0.26 (s, 3H, Si(Me)2CMe3), 0.15 (s, 3H, Si(Me)2CMe3). 13C NMR (100 MHz, CDCl3) δ 203.5, 154.5, 154.2, 149.5, 112.5, 109.5, 108.4, 50.5, 49.0, 45.0, 44.4, 37.3, 35.4, 32.6, 30.2, 29.5, 28.8, 28.6, 27.6, 26.9, 26.8, 25.9, 24.5, 18.8, 18.2, − 3.6− −4.2. HRMS (m/z): [M + H]+ calculated for C31H52O3 79BrSi, 579.2869; found, 579.2862; calculated for C31H52O3 81BrSi, 581.2849; found, 581.2850.
{(6aR,9R,10aR)-3-(8-Bromo-2-methyloctan-2-yl)-1-[(tert-butyldimethylsilyl)oxy]-6,6-dimethyl-6a,7,8,9,10,10a-hexahydro-6H-benzo[c]chromen-9-yl}methanol (13)
Colourless viscous oil. 1H NMR (500 MHz, CDCl3) δ 6.37 (d, J = 2.0 Hz, 1H, Ar-H), 6.30 (d, J = 2.0 Hz, 1H, Ar-H), 3.54 (dd, J = 10.5 Hz, J = 5.5 Hz, half of an AB system, 1H, -CH2OH), 3.50–3.43 (dd and t overlapping, especially, 3.48, t, J = 6.5, 7′-H, dd, J = 10.0 Hz, J = 6.5 Hz, half of an AB system, 1H, -CH2OH), 3.18–3.16 (m as br d, J = 13.0 Hz, 1H, C-ring), 2.40–2.32 (m as td, J = 11.0 Hz, J = 3.0 Hz, 1H, C-ring), 2.04–1.97 (m, 1H, C-ring), 1.94–1.88 (m, 1H, C-ring), 1.8–1.64 (m, 1H, C-ring, 2H, 6′-H), 1.52–1.44 (m, 3H, 2′-H, C-ring), 1.4–1.3 (m and s overlapping, 5H, -CH2- of the side chain, 6-Me, especially 1.25, s, 3H, 6-Me), 1.24–1.1 (m, s, and s overlapping, 10H, -C(CH3)2-, -CH2- of the side chain, C-ring, especially, 1.20, s, 3H, -C(CH3)2-, and 1.19, s, 3H, -C(CH3)2-), 1.09–1.02 (s and m overlapping, 5H, 6-Me, -CH2- of the side chain, especially, 1.06, s, 3H, 6-Me), 1.0 (s, 9H, Si(Me)2CMe3), 0.82–0.7 (m, 1H, C-ring), 0.23 (s, 3H, Si(Me)2CMe3), 0.12 (s, 3H, Si(Me)2CMe3). 13C NMR (100 MHz, CDCl3) δ 154.5, 154.3, 149.0, 113.5, 109.7, 108.4, 68.5, 49.6, 45.1, 44.4, 40.5, 37.2, 35.5, 33.2, 32.6, 29.8, 29.5, 28.8, 28.6, 27.6, 27.5, 26.8, 25.9, 24.5, 18,8, 18.2, − 3.6, − 4.3. HRMS (m/z): [M + H]+ calculated for C31H54O3 79BrSi, 581.3026; found, 581.3018; calculated for C31H54O3 81BrSi, 583.3005; found, 583.3007.
(6aR,9R,10aR)-3-(8-Bromo-2-methyloctan-2-yl)-9-(hydroxymethyl)-6,6-dimethyl-6a,7,8,9,10,10a-hexahydro-6H-benzo[c]chromen-1-ol (14)
To a solution of 13 (210 mg, 0.36 mmol) in anhydrous THF (9 ml) at − 40 °C, under an argon atmosphere, was added tetra-n-butylammonium fluoride (0.72 ml, 0.72 mmol, 1 M solution in anhydrous THF). The reaction mixture was stirred for 30 min at the same temperature, and then quenched using a saturated aqueous NH4Cl solution. Extractive isolation with diethyl ether, and purification by flash column chromatography on silica gel (20–50% ethyl acetate in hexane) gave 14 (164 mg, 96% yield) as a white solid. Melting point = 68–70 °C. 1H NMR (500 MHz, CDCl3) δ 6.35 (d, J = 1.0 Hz, 1H, Ar-H), 6.18 (d, J = 1.5 Hz, 1H, Ar-H), 4.75 (br s, 1H, ArOH), 3.61–3.42 (m and t overlapping, 4H, -CH2OH, 7′-H, especially, 3.49, t, J = 6.5 Hz, 2H, -CH2OH), 3.23–3.16 (m as br d, J = 13.0 Hz, 1H, C-ring), 2.52–2.44 (m as td, J = 11.0 Hz, J = 2.5 Hz, 1H, C-ring), 2.02–1.91 (m, 2H, C-ring), 1.82–1.74 (m, 1H, C-ring), 1.72–1.64 (m, 1H, 6′-H), 1.54–1.46 (m, 3H, 2′-H, C-ring), 1.44–1.31 (s and m overlapping, 5H, 6-Me, -CH2- of the side chain, especially, 1.39, s, 3H, 6-Me), 1.29–1.15 (s, and m overlapping, 10H, -C(CH3)2-, -CH2- of the side chain, C-ring, especially, 1.20, s, 6H, -C(CH3)2-), 1.10–1.01 (s and m overlapping, 5H, 6-Me, -CH2- of the side chain, especially, 1.09, s, 3H, 6-Me), 0.89–0.78 (m as q, J = 11.5 Hz, 1H, C-ring). 13C NMR (100 MHz, CDCl3) δ 154.7, 154.4, 149.7, 109.6, 107.9, 105.4, 68.5, 49.3, 45.2, 44.2, 40.5, 37.2, 34.9, 33.1, 32.6, 29.7, 29.5, 28.7, 28.6, 27.7, 27.4, 26.7, 24.4, 19.0. HRMS (m/z): [M + H]+ calculated for C25H40O3 79Br, 467.2161; found, 467.2162; calculated for C25H40O3 81Br, 469.2140; found, 469.2144.
(6aR,9R,10aR)-3-(8-Azido-2-methyloctan-2-yl)-9-(hydroxymethyl)-6,6-dimethyl-6a,7,8,9,10,10a-hexahydro-6H-benzo[c]chromen-1-ol (15)
To a stirred solution of 14 (160 mg, 0.34 mmol) in anhydrous CH3Cl/CH3NO2 (1:1 mixture, 6 ml) at room temperature, under an argon atmosphere was added N,N,N′,N′-tetramethylguanidinium azide (1.6 g, 10.2 mmol) and stirring was continued for 1 day. On completion, the reaction was quenched with water and diluted with CH2Cl2. The organic phase was washed with brine, dried over MgSO4 and concentrated in vacuo. Purification by flash column chromatography on silica gel (50–80% diethyl ether in hexanes) gave 124 mg of 15 as a white solid in 84% yield. Melting point = 59–61 °C; IR (neat) 3343 (br, OH), 2931, 2860, 2093 (s, N3), 1713, 1621, 1537, 1413, 1331, 1268, 1138, 1011, 967, 839 cm−1; 1H NMR (500 MHz, CDCl3) δ 6.35 (d, J = 1.0 Hz, 1H, Ar-H), 6.19 (d, J = 1.5 Hz, 1H, Ar-H), 4.81 (br s, 1H, ArOH), 3.57–3.47 (m, 2H, -CH2OH), 3.23–3.17 (m and t overlapping 3H, C-ring, 7′-H, especially, 3.21, t, J = 6.5 Hz, 2H, 7′-H), 2.52–2.44 (m as td, J = 11.0 Hz, J = 2.5 Hz, 1H, C-ring), 2.02–1.91 (m, 2H, C-ring), 1.82–1.74 (m, 1H, C-ring), 1.56–1.46 (m 5H, 6′-H, 2′-H, C-ring), 1.38 (s, 3H, 6-Me), 1.35–1.26 (m, 2H, -CH2- of the side chain), 1.25–1.11 (s and m overlapping, 10H, -C(CH3)2-, -CH2- of the side chain, C-ring, especially, 1.20, s, 6H, -C(CH3)2-), 1.10–1.02 (s and m overlapping, 5H, 6-Me, -CH2- of the side chain, especially, 1.09, s, 3H, 6-Me), 0.87–0.78 (m as q, J = 12 Hz, 1H, C-ring). 13C NMR (100 MHz, CDCl3) δ 154.6, 154.5, 149.7, 109.6, 107.8, 105.4, 68.5, 51.5, 49.3, 44.2, 40.5, 37.2, 34.9, 33.1, 29.7, 29.6, 28.8, 28.7, 27.7, 27.4, 26.5, 24.4, 19.0. HRMS (m/z): [M]+ calculated for C25H40N3O3, 430.3070; found, 430.3065.
(6aR,9R,10aR)-9-(Hydroxymethyl)-3-(8-isothiocyanato-2-methyloctan-2-yl)-6,6-dimethyl-6a,7,8,9,10,10a-hexahydro-6H-benzo[c]chromen-1-ol (AM841)
To a solution of 15 (120 mg, 0.28 mmol), in anhydrous THF (5.6 ml) at room temperature, was added triphenyl phosphine (365 mg, 1.4 mmol). Carbon disulfide (0.55 ml, 8.4 mmol) was then added dropwise and the reaction mixture was stirred for an additional 10 h at the same temperature. Upon completion, the reaction mixture was concentrated under reduced pressure and purified by flash column chromatography on silica gel (50–80% diethyl ether in hexanes) to give 95 mg of AM841 as white solid in 76% yield. Melting point = 63–65 °C. IR (neat) 3332 (br, OH), 2931, 2860, 2093 (s, NCS), 1620, 1537, 1451, 1413, 1331, 1269, 1137, 1037, 966, 838 cm−1; 1H NMR (500 MHz, CDCl3) δ 6.35 (d, J = 1.5 Hz, 1H, Ar-H), 6.19 (d, J = 2.0 Hz, 1H, Ar-H), 4.76 (br s, 1H, ArOH), 3.52 (m, 2H, -CH2OH), 3.46 (t, J = 6.5 Hz, 2H, 7′-H), 3.22–3.16 (m as d, J = 13 Hz, 1H, C-ring), 2.51–2.44 (m as td, J = 11.0 Hz, J = 2.5 Hz, 1H, C-ring), 2.02–1.91 (m, 2H, C-ring), 1.82–1.74 (m, 1H, C-ring), 1.65–1.56 (m, 2H, 6′-H), 1.54–1.46 (m, 3H, 2′-H, C-ring), 1.39 (s, 3H, 6-Me), 1.37–1.29 (m, 2H, -CH2- of the side chain group), 1.26–1.11 (s and m overlapping, 10H, -C(CH3)2-, -CH2- of the side chain, C-ring, especially, 1.20, s, 6H, -C(CH3)2-), 1.10–1.03 (s and m overlapping, 5H, 6-Me, -CH2- of the side chain, especially, 1.09, s, 3H, 6-Me), 0.87–0.7 (m as q, J = 12 Hz, 1H, C-ring); 13C NMR (100 MHz, CDCl3) δ 154.6 (ArC-1 or ArC-5), 154.5 (ArC-5 or ArC-1), 130.1 (NCS), 149.6 (tertiary aromatic), 109.7 (tertiary aromatic), 107.8 (ArC-2 or ArC-4), 105.3 (ArC-4 or ArC-2), 68.5 (-CH2OH), 49.3, 45.0, 44.1, 40.5, 37.2, 35.0, 33.1, 29.8, 29.7, 29.3, 28.7, 28.6, 27.7, 27.4, 26.3, 24.3, 19.0. HRMS (m/z): [M]+ calculated for C26H40NO3S, 446.2729; found, 446.2726.
(−)-7′-Bromo-1′,1′-dimethylheptyl-Δ8-tetrahydrocannabinol (AM11542)
Experimental procedures for the synthesis and purification, along with spectroscopic and analytical data were reported earlier from our laboratory8.
Purification of CB1–flavodoxin protein and crystallization in lipidic cubic phase
CB1–flavodoxin construction, expression and membrane preparation were performed using the same procedure as descried before2. In brief, the construct has truncations of residues 1–98, 307–331 and 415–472, the flavodoxin (PDB accession 1I1O, molecular mass 14.9 kDa, with Y98W mutation) fusion protein was fused to the truncated third intracellular loop of the human CNR1 (also known as CB1) gene. The resulting CB1–flavodoxin chimaera sequence was subcloned into a modified mammalian expression vector pTT5 that contains a haemagglutinin (HA) signal sequence, a Flag tag and 10×His tag, followed by a tobacco etch virus (TEV) protease cleavage site, before the N terminus of the chimaera sequence. The CNR1 gene was further modified by introducing four rationally designed mutations23, Thr2103.46Ala, Glu2735.37Lys, Thr2835.47Val and Arg3406.32Glu, using standard QuickChange PCR. The protein was expressed using the FreeStyle 293 Expression system (Invitrogen) in HEK293F cells for 48 h, and the membrane was washed repeatedly using hypotonic buffer with low and high salt. Notably, the receptor used for crystallization was capable of binding to [3H]CP55,940 and this binding could be replaced by AM11542 (Ki = 0.29 (0.17–0.50) nM); AM841 (Ki = 0.53 (0.36–0.80) nM) as the wild-type receptor, and cold CP55,940 (Ki = 2.0 (1.2–3.5) nM). This CB1 construct yielded no signalling in signalling assays (not shown), which is probably due to the flavodoxin insert that prevents coupling secondary effectors. However, the individual point mutations did not interfere with agonist activity except for Thr2103.46Ala, which has been previously reported23. These controls are summarized in Extended Data Fig. 4c and Extended Data Table 2.
Purified membranes were thawed at room temperature and then incubated with 20 µM corresponding ligand (AM11542 or AM841) in the presence of 1.0 mg ml−1 iodoacetamide, and EDTA-free protease inhibitor cocktail (Roche) for 30 min at room temperature, and then further incubated at 4 °C for 3 h. The membranes were then solubilized with 50 mM HEPES (pH 7.5), 500 mM NaCl, 1% (w/v) lauryl maltose neopentyl glycol (LMNG, Anatrace) and 0.2% (w/v) cholesterol hemisucinate (CHS, Sigma-Aldrich) at 4 °C for 2.5–3.0 h. The supernatants containing the solubilized CB1 proteins were isolated by high-speed centrifugation, and then incubated with TALON IMAC resin (Clontech) and 20 mM imidazole, at 4 °C overnight. The resin was washed with 15 column volumes of washing buffer I containing 25 mM HEPES (pH 7.5), 500 mM NaCl, 10% (v/v) glycerol, 0.1% (w/v) LMNG, 0.02% (w/v) CHS, 30 mM imidazole and 20 µM AM11542 or AM841, and 5 column volumes of washing buffer II containing 25 mM HEPES (pH 7.5), 500 mM NaCl, 10% (v/v) glycerol, 0.03% (w/v) LMNG, 0.015% (w/v) CHS, 50 mM imidazole and 20 µM AM11542 or AM841. The proteins were eluted by 2.5 column volumes of eluting buffer containing 25 mM HEPES (pH 7.5), 500 mM NaCl, 10% (v/v) glycerol, 0.01% (w/v) LMNG, 0.002% (w/v) CHS, 250 mM imidazole and 20 µM AM11542 or AM841. PD MiniTrap G-25 column (GE Healthcare) was used to remove imidazole. The protein was then treated overnight with TEV protease to cleave the N-terminal Flag/His tags from the proteins. Finally, the purified CB1 protein together with TEV protease was concentrated to about 35 mg ml−1 with a 100 kDa cutoff concentrator (Sartorius) and used in crystallization trials. The protein yield and monodispersity were tested by analytical size exclusion chromatography.
Protein samples were reconstituted into lipidic cubic phase (LCP) by mixing with molten lipid (90% (w/v) monoolein and 10% (w/v) cholesterol) at a protein/lipid ratio of 2:3 (v/v) using a mechanical syringe mixer24. LCP crystallization trials were performed using an NT8-LCP crystallization robot (Formulatrix). 96-well glass sandwich plates were incubated and imaged at 20 °C using an automatic incubator/ imager (RockImager 1000, Formulatrix). For the CB1–AM11542 complex, the crystals grew in conditions of 0.1 M sodium cacodylate trihydrate pH 6.4, 300–350 mM C4H4KNaO6, 30% PEG400 and grew to the full size within 1 week. For the CB1–AM841 complex, the crystals appeared after 2 days in 0.1 M sodium cacodylate trihydrate pH 6.2, 120 mM C6H5Na3O7·2H2O, 30% PEG400 and 100 mM glycine and reached their full size after 1 week. The crystals were harvested using micromounts (MiTeGen) and flash-frozen in liquid nitrogen.
Data collection, structure solution and refinement
X-ray diffraction data were collected at GM/CA-CAT beamline 23ID-B at the Advanced Photon Source (APS), Argonne National Laboratory IL, using an Eiger 16 M detector (X-ray wavelength 1.0000 Å) and at beamline X06SA of the Swiss Light Source. The crystals were exposed with a 10 µm minibeam for 0.2 s and 0.2° oscillation per frame, a rastering system was applied to find the best diffracting parts of single crystals25,26. XDS27 was used for integrating and scaling data from the 16 crystals for the CB1–AM11542 complex and 10 crystals for the CB1–AM841 complex. Initial phase information was obtained by molecular replacement with Phaser28 using the receptor portion of CB1 (PDB code 5TGZ) and flavodoxin structure (PDB code 1I1O) as search models. Refinement was performed with Phenix29 and Buster30 followed by manual examination and rebuilding of the refined coordinates in the program COOT31 using both |2Fo|− |Fc|and |Fo|− |Fc|maps.
Radioligand binding assay
Radioligand binding to determine agonist affinity and wash resistant residency was determined as previously described2 using [3H]CP55,940 (specific activity: 81.1 Ci mmol−1, NDSP, NIDA) and an excess of CP55,940 to determine nonspecific binding. Specifically for wash out experiments at the wild-type CB1, membranes were incubated at 37 °C for 1 h in the presence of vehicle (buffer with 1% DMSO), 1 nM AM11542, 10 nM AM841 or 4 nM CP55,940 followed by resuspension in assay buffer containing 1% BSA and incubated at 37 °C for 30 min (to remove non-specifically bound ligand); this was repeated twice to wash away bound ligands before the saturation radioligand binding assay on membranes (37 °C for 1–4 h as indicated). Ki and Bmax calculations were performed by nonlinear regression analysis using GraphPad Prism 7.0, n = 3–6.
Wild-type and mutant CB1–CHO cell line generation for functional studies
Cell line generation and maintenance was conducted as described previously2 and briefly described here. The N terminus 3×HA -tagged CB1 cDNA was obtained from http://cDNA.org and subcloned into a mouse stem-cell virus for cell line transduction (pMSCV-puro, Clontech). Point mutations were introduced to the N terminus 3×HA-tagged CB1 cDNA in MSCV retroviral vector by using Q5 Site-Directed Mutagenesis kit (New England Biolabs) (F177A, L193A, D213A, Y275A, Y275F, F379A, F379W, S383A). Generation of F379 mutants was described previously2. Wild-type and mutant CB1 constructs were packaged into retrovirus via Phoenix package system (Allele Biotechnology cat. no. ABP-RVC-10001), and the produced retroviruses were applied to CHO-K1 (ATCC cat. no. CCL-61) cells for gene transduction. Cells were maintained in DMEM/F-12 media supplemented with 10% fetal bovine serum, 1% penicillin/streptomycin, and 5 mg ml−1 puromycin (Invitrogen) for stable line selection at 37 °C (5% CO2 and 95% relative humidity). Cell lines were negative for mycoplasma. See Extended Data Fig. 4a for primers used to make mutant CB1 receptors.
Quantitative flow cytometry
Validation of cell-surface expression of the HA-tagged wild-type and mutant CB1 receptors expressed in CHO-K1 cells was obtained by anti-HA antibody staining followed by quantitative flow cytometry and visually confirmed by confocal imaging. In brief, cells were serum-starved 30 min at 37 °C and collected in 5 mM EDTA and fixed with 4% paraformaldehyde for 10 min at 4 °C. Cells were washed twice with PBS and resuspended in PBS containing 1% FBS and 5 mM EDTA. Cells were incubated with anti-HA AlexaFluor488-conjugated antibody (1:1,000) for 30 min at 4 °C, washed twice with PBS and again resuspended in PBS containing 1% FBS and 5 mM EDTA. Fluorescence was recorded using a BD Canto flow cytometer (excitation/emission: 488/525 nm). Approximately 50,000 events were recorded for each cell line. Data are expressed as the percentage of positive-fluorescent cells from 50,000 events recorded (3×HA–CB1 CHO wild-type = 65%) and relative to 3×HA-CB1 wild-type CHO (100%). Untransfected CHO cells had 0% fluorescence. See Extended Data Fig. 4a for primers used to make mutant CB1 receptors and surface expression comparisons of all mutants reported herein. See Supplementary Fig. 1 for flow cytometry graphs.
cAMP accumulation assay
Inhibition of forskolin-stimulated cAMP was determined using the CISBIO cAMP Homogeneous Time-Resolved Fluorescence resonance energy transfer (FRET) (HTRF) (Cisbio Assays) as previously described2.
Docking and molecular dynamics simulations
Prediction of ligand binding to CB1 was carried out with Schrödinger Suite 2015-4. Processing of the protein structure was performed with the ‘Protein Preparation Wizard’. Converting of ligands from 2D to 3D structures was performed using ‘LigPrep’. Rigid protein docking in extra precision was used with Glide 6.932–34 (induced fit docking protocol 2015-4, Glide v.6.4, Primer v.3.7, Schrödinger LLC; https://www.schrodinger.com/induced-fit) for molecular docking.
Molecular dynamics simulation was performed using GROMACS 5.1.235, using force field Amber 14 (AMBER 2017; http://ambermd.org/). CB1 in complex with each agonist in the pocket (binding modes predicted by molecular docking) was embedded into a pre-equilibrated POPC (1-palmytoil-2-oleoyl-sn-glycerol-3-phosphatidylcholine) lipid bilayerusing the membed tool in GROMACS program. The topology files of ligands and POPC molecules were generated using AmberTools in UCSF Chimera program36 version 1.10.2 and converted to GROMACS format with ACPYPE tool37. The systems were solvated with water, sodium ions were added to 0.15 M in water, and chloride ions were added to neutralize the system. Molecular dynamics simulations were performed in the NPT ensemble, at a temperature of 310 K and pressure of 1 atm using semi-isotropic coupling. First, each system was balanced position-restrained MD for 15 ns (total energy was stable). Then 1 µs molecular dynamics simulations with no position restraints were performed to each system for two independent runs, and these trajectories are used for analysis. Ligand r.m.s.d. value was calculated with protein Cα atoms superimposed to the starting structure.
Comparison of agonist- and antagonist-bound class A GPCRs structures
Seventeen crystal structures of seven GPCRs that have both agonist- and antagonist- bound structures were selected from the PDB38. Among them, there are 24, 32 and 21 structures for the β2-adrenergic receptor, rhodopsin and A2A adenosine receptor, respectively. To pick representative structures of the three GPCRs, their PDB structures were clustered by R package Bio3D39 based on r.m.s.d. differences. The following structures from each cluster were manually picked. Agonist/arrestin-bound structures include CB1 (this study; PDB code 5XRA), β2-adrenergic receptor (PDB codes 3SN6, 4LDL), µ-opioid receptor (PDB code 5C1M), M2 muscarinic receptor (PDB code 4MQS), rhodopsin (PDB codes 2X72, 4ZWJ (arrestin-bound)), A2A adenosine receptor (PDB codes 3QAK, 5G53) and P2Y purinoceptor 12 (PDB code 4PXZ). Antagonist-bound structures include CB1 (PDB code 5TGZ), β2-adrenergic receptor (PDB code 3NY8), µ-opioid receptor (PDB code 4DKL), M2 muscarinic receptor (PDB code 3UON), rhodopsin (PDB code 1U19), A2A adenosine receptor (PDB code 4EIY) and P2Y purinoceptor 12 (PDB code 4NTJ).
Binding pocket volume calculation
These structures were processed by ‘Protein Preparation Wizard’ in Schrödinger Suite 2015-4 (https://www.schrodinger.com/protein-preparation-wizard). The volume of binding pockets was calculated by ‘Sitemap’ (https://www.schrodinger.com/sitemap).
The r.m.s.d. values of extracellular/intracellular transmembrane helices
Seven conserved residues close to the middle point of each helix with Ballesteros–Weinstein numbering 1.50, 2.50, 3.39, 4.50, 5.50, 6.50 and 7.49 were used to divide the seven transmembrane helices into extracellular and intracellular parts. The whole structures of each pair of agonist/antagonist-bound structures were aligned in UCSF Chimera36, then the r.m.s.d. values of Cα atoms in the extracellular and intracellular parts were calculated in UCSF Chimera.
Quantification and statistical analysis
Concentration–response curves expressed as fold over basal, were fit to a nonlinear regression (three parameter) model in Prism (v.7.0, GraphPad Software Inc.). For functional analysis of wild-type and CB1 mutants, pEC50 and Emax values were calculated from nonlinear regression (three parameter) analysis of mean data from independent experiments performed in duplicate. In Fig. 1d, CP55,940 served as an assay control and was assayed in parallel with all compounds; n = 11 for CP55,940, n = 6 for AM11542, n = 5 for AM841 and n = 6 for THC. In Extended Data Table 2, n = 3 independent experiments performed in duplicate for all mutants except F177A (n = 4), T210A (n = 4 for AM841 and CP55,940) and wild type (n = 7 for AM841 and CP55,940; n = 6 for AM11542). Statistical analyses comparing pEC50 between CB1 wild-type and mutant lines were conducted using two-way ANOVA followed by Dunnett’s post hoc test in the Prism software, v.7.0.
Data availability
Atomic coordinates and structures have been deposited in the Protein Data Bank (PDB) with accession codes 5XRA (CB1–AM11542) and 5XR8 (CB1–AM841). All other data are available from the corresponding authors upon reasonable request.
Extended Data
Extended Data Figure 1. Synthesis of AM841 and AM11542.
Reagents and conditions: (a) CH3I, NaH, DMF, 0 °C to room temperature, 2 h, 95%; (b) DIBAL-H, CH2Cl2, − 78 °C, 0.5 h, 87%; (c) Br− P+Ph3(CH2)5OPh, (Me3Si)2NK, THF, 0–10 °C, 30 min, then addition to 3, 0 °C to room temperature, 2 h, 96%; (d) H2, 10% Pd/C, AcOEt, room temperature, 2.5 h, 89%; (e) BBr3, CH2Cl2, −78 °C to room temperature, 6 h, 85%; (f) diacetates, p-TSA, CHCl3, 0 °C to room temperature, 4 days, 64%; (g) TMSOTf, CH2Cl2/MeNO2, 0 °C to room temperature, 3 h, 71%; (h) TBDMSCl, imidazole, DMAP, DMF, room temperature, 12 h, 85%; (i) Cl− Ph3P+CH2OMe, (Me3Si)2NK, THF, 0 °C to room temperature, 1 h, then addition to 9, 0 °C to room temperature, 1.5 h, 73%; (j) Cl3CCOOH, CH2Cl2, room temperature, 50 min, 95%; (k) K2CO3, EtOH, room temperature, 3 h, 84%; (l) NaBH4, EtOH, 0 °C, 30 min, 98%; (m) TBAF, THF, −40 °C, 30 min, 96%; (n) TMG-N3, CHCl3/MeNO2, room temperature, 18 h, 84%; (o) PPh3, CS2, THF, room temperature, 10 h, 76%; (p) (+)-cis/trans-p-mentha-2,8-dien-1-ol, p-TSA, benzene, reflux 4 h, 65%.
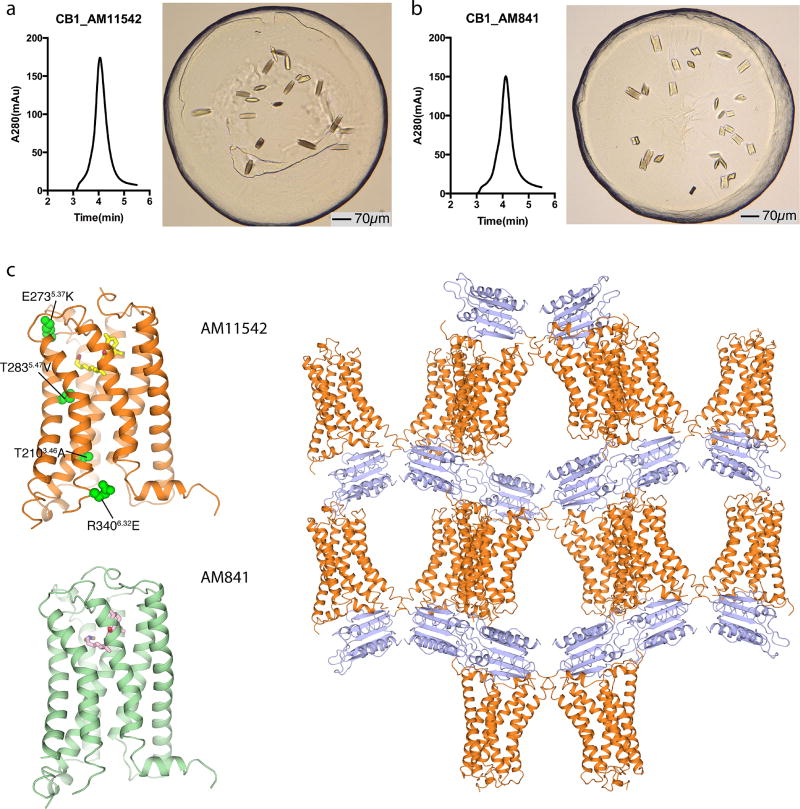
Extended Data Figure 2. Analytical size exclusion chromatography profile and crystals of CB1–AM11542/AM841 complex.
a, Analytical size exclusion chromatography and crystal image of the CB1–AM11542 complex. Scale bar, 70 µm. b, Analytical size exclusion chromatography and crystal image of the CB1–AM841 complex. Scale bar, 70 µm. c, The overall structures of CB1–AM11542 and CB1–AM841 complexes and crystal packing of CB1–AM11542; receptor is in orange (AM11542)/green (AM841) colour and the flavodoxin fusion protein is in purple-blue colour. The agonists AM11542 (yellow) and AM841 (pink) are shown in sticks representation. The four single mutations T2103.46A, E2735.37K, T2835.47V and R3406.32E are shown as green spheres in the CB1–AM11542 structure.
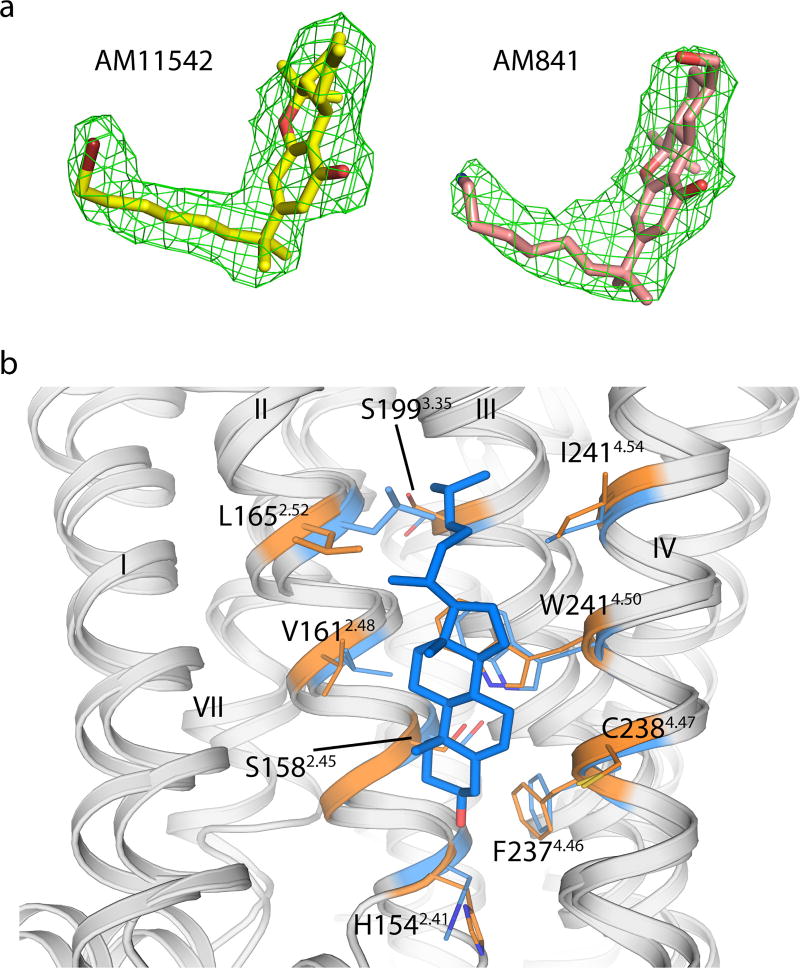
Extended Data Figure 3. Representative electron density of the CB1 agonists-bound structures and cholesterol binding sites.
a, The |Fo| − |Fc| omit maps of AM11542 and AM841 contoured at 3.0σ at 2.80 Å and 2.95 Å, respectively. b, The cholesterol binding site in the CB1–AM11542 structure (orange) with CB1–AM6538 structure (blue) superposed.
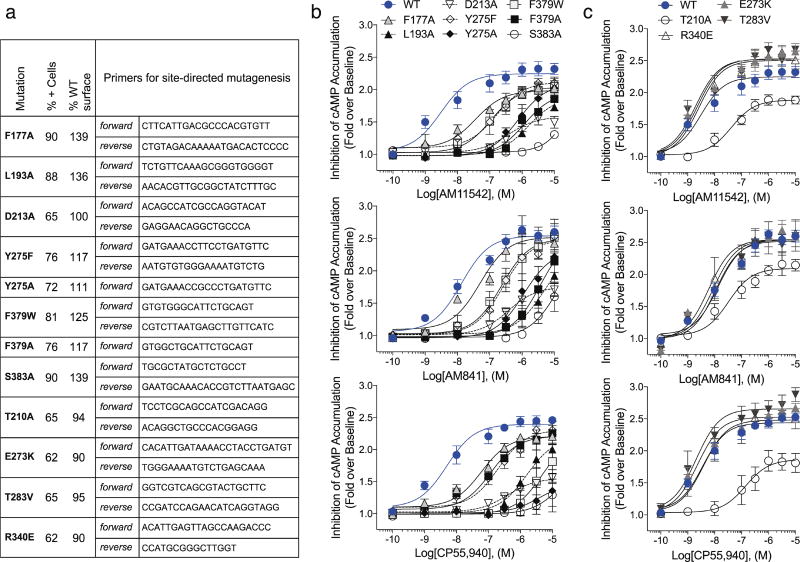
Extended Data Figure 4. Mutations of the CB1 receptor and the effects on agonist-induced activity as assessed by the forskolin-stimulated accumulation of cAMP.
a, Primers used to generate mutations in 3×HA–CB1 and validation of cell-surface expression of wild-type and mutant CB1 in CHO-K1 cell lines quantitative flow cytometry. b, Dose response studies of agonist (AM11542, AM841 and CP55,940) activity for each mutant compared to wild type (in blue filled circles) from Fig. 3c. c, Assessment of the effect of the individual point mutations that were made to stabilize the receptor, in absence of the flavodoxin insert, on receptor activity. All experiments were repeated at least three times, and error bars denote s.e.m. of duplicate measurements (parameters are in Extended Data Table 2).
Extended Data Figure 5. Docking poses of different cannabinoid receptor agonists and MD validation.
a–f, The r.m.s.d. values of ligand heavy atoms show that the docked poses are stable during the 1 µs molecular dynamics simulations: Δ9-THC (a), AEA (b), JWH-018 (c), HU-210 (d), 2-AG (e), WIN 55,212-2 (f). g, h, j, k, The poses of HU-210 (g), JWH-018 (h), 2-AG (j) and WIN 55,212-2 (k) are shown. i, The superimposition of HU-210 (yellow sticks) and HU-211 (blue sticks) in the binding pocket. The binding pose of HU-210 explains why HU-211, the enantiomer of HU-210, failed to stimulate CB1 because superimposed HU-211 on HU-210 shows severe clashes with H1782.65 in CB1.
Extended Data Figure 6. Structural conformation changes of solved agonist- and antagonist-bound class A GPCRs.
a, The pattern of r.m.s.d. values of transmembrane helices between agonist- and antagonist-bound class A GPCR structures. The structures used for analysis are the same as described in Extended Data Table 3. b, Measurement of the degree of helix VI bending observed in class A GPCRs structures. All structures were superimposed onto inactive-state β2-adrenergic receptor by UCSF Chimera. The direction of helices VI were defined by vectors ηi which starts from the centre of Cα of residues 6.45–6.48 to the centre of Cα of residues 6.29–30–6.32–33. The two vectors η0 and η1 of helices VI in the inactive-state and active-state β2-adrenergic receptor were selected as reference to form a plane α. The vector ηi of helix VI of other structure was projected to the plane α as a new vector . The bending angle of each helix VI was then defined by the angle between and η0. The structures are: ETB (PDB code 5GLH), β1-adrenergic receptor (PDB code 2Y02), P2Y12 (PDB code 4PXZ), β2-adrenergic receptor (PDB code 3PDS), FFA1 (PDB code 4PHU), 5HT2B (PDB code 4IB4), 5HT1B (PDB code 4IAR), Rho (PDB code 2HPY), A2A (PDB code 3QAK), NTS1 (PDB code 4BUO), CB1 (bound to AM11542; PDB code 5XRA), µ-opioid receptor + nanobody (NB) (PDB code 5C1M), Rho + NB (PDB code 2X72), Rho + arrestin (PDB code 4ZWJ), M2R + NB (PDB code 4MQS), β2-adrenergic receptor + NB (PDB code 4LDL), A2A + mini-Gs (PDB code 5G53), β2-adrenergic receptor + Gs (PDB code 3SN6).
Extended Data Table 1.
Data collection and structure refinement statistics
| CB1-AM11542 (PDB: 5XRA) |
CB1-AM841 (PDB: 5XR8) |
|
|---|---|---|
| Data collection | ||
| Number of crystals | 16 | 10 |
| Space group | P21221 | P21221 |
| Cell dimensions | ||
| a, b, c (Å) | 66.05, 75.87, 138.90 | 66.83, 73.61, 139.64 |
| Number of reflections measured | 102213 | 84586 |
| Number of unique reflections | 16685 | 13367 |
| Resolution (Å)a | 37.91–2.80 (2.90–2.80) | 49.48–2.95 (3.05–2.95) |
| Rmerge, | 0.101 (0.562) | 0.081 (0.490) |
| Mean I/σ(I) | 10.41 (2.07) | 11.06 (1.97) |
| CC1/2 | 1 (0.62) | 1 (0.54) |
| Completeness (%) | 93.50 (90.03) | 88.18 (77.30) |
| Redundancy | 6.1 (4.8) | 6.3 (3.6) |
| Refinement | ||
| Resolution (Å) | 37.91–2.80 | 49.48–2.95 |
| No. reflections | 16669 | 13329 |
| Rwork / Rfree (%) | 23.4/25.2 | 25.5/27.4 |
| No. atoms | ||
| Protein | 3311 | 3314 |
| Ligand | 28 (AM11542) | 29 (AM841) |
| Lipid and other | 122 | 66 |
| Average B factors (Å2) | ||
| Wilson / Overall | 79.6/90.0 | 110.0/130.7 |
| CB1 | 82.9 | 121.6 |
| Flavodoxin | 105.9 | 152.0 |
| Ligand | 62.4 | 93.3 |
| Lipids and other | 81.9 | 106.3 |
| R.m.s. deviations | ||
| Bond lengths (Å) | 0.003 | 0.002 |
| Bond angles (°) | 0.732 | 0.484 |
| Ramachandran Plot Statistics (%) | ||
| Favored regions | 97.88 | 96.02 |
| Allowed regions | 2.12 | 3.98 |
| Disallowed regions | 0 | 0 |
Values in parentheses are for highest-resolution shell.
Extended Data Table 2.
Mutations analysis of changes in pEC50 and Emax
| CB1 | AM11542 | AM841 | CP55,940 | |||
|---|---|---|---|---|---|---|
| pEC50 | Emax (Fold) | pEC50 | Emax (Fold) | pEC50 | Emax (Fold) | |
| WT | 8.5 ± 0.21 | 2.3 ± 0.05 | 7.9 ± 0.12 | 2.5 ± 0.04 | 8.3 ± 0.15 | 2.3 ± 0.05 |
| F177A | 7.4 ± 0.17**** | 2.0 ± 0.04 | 7.3 ± 0.20**** | 2.5 ± 0.08 | 7.2 ± 0.14**** | 2.2 ± 0.05 |
| L193A | 5.8 ± 0.06**** | 1.9 ± 0.10 | 5.4 ± 0.35**** | 2.3 ± 0.42 | 5.8 ± 0.15**** | 2.2 ± 0.12 |
| D213A | 6.4 ± 0.18**** | 1.6 ± 0.05*** | 6.4 ± 0.14**** | 1.8 ± 0.05**** | 6.4 ± 0.14**** | 1.6 ± 0.04**** |
| Y275A | 6.1 ± 0.19**** | 2.1 ± 0.12 | 5.9 ± 0.22**** | 2.3 ± 0.18 | 5.4 ± 0.95**** | 1.5 ± 0.40**** |
| Y275F | 6.8 ± 0.21**** | 2.1 ± 0.09 | 6.6 ± 0.13**** | 2.5 ± 0.09 | 6.7 ± 0.13**** | 2.3 ± 0.07 |
| F379A | 5.9 ± 0.25**** | 2.0 ± 0.15 | 5.4 ± 0.30**** | 2.6 ± 0.42 | 5.3 ± 0.40**** | 2.2 ± 0.50 |
| F379W | 7.0 ± 0.12**** | 2.0 ± 0.05 | 6.6 ± 0.20**** | 2.5 ± 0.13 | 7.0± 0.15**** | 2.2 ± 0.07 |
| S383A | <5 | 1.0 ± 0.02**** | <5 | 1.6±0.51**** | <5 | 1.3 ± 0.12**** |
| T210A | 7.5 ± 0.32** | 1.9 ± 0.07** | 7.4 ± 0.22 | 2.1 ± 0.06**** | 6.9 ± 0.32*** | 1.9 ± 0.09**** |
| E273K | 8.7 ± 0.14 | 2.5 ± 0.05* | 8.1 ± 0.12 | 2.5 ± 0.06 | 8.7 ± 0.09 | 2.5 ± 0.04 |
| T283V | 8.8 ± 0.17 | 2.5 ± 0.06* | 7.9 ± 0.16 | 2.5 ± 0.07 | 8.7 ± 0.25 | 2.7 ± 0.07** |
| R340E | 8.6 ± 0.15 | 2.5 ± 0.05* | 8.1 ± 0.17 | 2.5 ± 0.09 | 8.5 ± 0.30 | 2.5 ± 0.06 |
Inhibition of forskolin-stimulated cAMP accumulation in wild-type and mutant CB1 CHO cells. Data are mean pEC50 and Emax values ± s.e.m. from fitting concentration–response data to nonlinear regression (3 parameter) analysis; n = 3 independent experiments performed in duplicate for all mutants except F177A (n = 4), T210A (n = 4 for AM841 and CP55,940) and wild type (n = 7 for AM841 and CP55,940; n = 6 for AM11542).
Compared to wild type with agonist treatment: *P < 0.05,
P < 0.01,
P < 0.0001 as determined by two-way ANOVA without repeated measures followed by Dunnett’s post hoc test. Statistical analyses were not performed on S383A as the pEC50 values were estimated at > 5 µM due to lack of response and non-convergence of the data to nonlinear regression analysis. The last four mutations represent those appearing in the crystal structure CB1 construct.
Extended Data Table 3.
Binding pocket volume comparison and r.m.s.d. analysis of solved representative agonist- and antagonist-bound pairs of seven class A GPCRs
| GPCRs | Agonist-bound Structures |
Binding Pocket Volume (Å3) |
Antagonist-bound Structures |
Binding Pocket Volume (Å3) |
RMSD (Å) of transmembrane helices |
|
|---|---|---|---|---|---|---|
| Cannabinoid receptor 1 (CB1) | Agonist (PDB:5XRA) | 383.5 | Antagonist (PDB:5TGZ) | 821.8 | E | 2.50 |
| I | 3.07 | |||||
|
| ||||||
| β2-adrenergic receptor | Agonist (PDB:3SN6) | 469.7 | Inverse agonist (PDB:3NY8) | 670.9 | E | 1.13 |
| I | 3.40 | |||||
|
|
|
|||||
| Agonist (PDB:4LDL) | 670.9 | E | 1.19 | |||
| I | 2.96 | |||||
|
| ||||||
| µ-opioid receptor | Agonist (PDB:5C1M) | 576.6 | Antagonist (PDB:4DKL) | 586.5 | E | 1.49 |
| I | 3.04 | |||||
|
| ||||||
| M2 muscarinic receptor | Agonist (PDB:4MQS) | 114.6 | Antagonist (PDB:3UON) | 320.7 | E | 1.99 |
| I | 3.17 | |||||
|
| ||||||
| Rhodopsin | Agonist (PDB:2X72) | 342.3 | Antagonist (PDB:1U19) | 214.7 | E | 1.72 |
| I | 3.19 | |||||
|
|
|
|||||
| Arrestin (PDB:4ZWJ) | 373.8 | E | 1.56 | |||
| I | 3.24 | |||||
|
| ||||||
| A2A adenosine receptor | Agonist (PDB:3QAK) | 445.2 | Antagonist (PDB:4EIY) | 461.0 | E | 1.58 |
| I | 2.23 | |||||
|
|
|
|||||
| Agonist (PDB:5G53) | 288.8 | E | 1.12 | |||
| I | 3.28 | |||||
|
| ||||||
| P2Y purinoreceptor 12 (P2Y12) | Agonist (PDB:4PXZ) | 298.8 | Antagonist (PDB:4NTJ) | 392.7 | E | 2.13 |
| I | 0.93 | |||||
E: RMSD of extracellular side helices I: RMSD of intracellular side helices
Supplementary Material
Acknowledgments
This work was supported by the NSF of China grant 31330019 (Z.-J.L.), the MOST of China grants 2014CB910400 (Z.-J.L.) and 2015CB910104 (Z.-J.L.), NSF of Shanghai 16ZR1448500 grant (S.Z.), Key R&D Program of China grant 2016YCF0905902 (S.Z.), NIH grants R01DA041435 (R.C.S., A.M.), P01DA009158 (A.M., L.M.B.), R37DA023142 (A.M.), NSF grants, Shanghai Municipal Government, ShanghaiTech University and GPCR Consortium. The diffraction data were collected at GM/CA@APS of Argonne National Laboratory, X06SA@SLS of the Paul Scherrer Insitute, and BL41XU@Spring-8 with JASRI proposals 2015B1031 and 2016A2731. We thank M. Wang, C.-Y. Huang, V. Olieric, M. Audet and M.-Y. Lee for their help with data collection, A. Walker for critical review of the manuscript, and F. Sun for high-resolution mass spectrometry analysis.
Footnotes
Supplementary Information is available in the online version of the paper.
Author Contributions T.H.: crystallization, data collection, structure determination and analysis; K.V., S.P.N., S.J.: design, synthesis and characterization of ligands; Y.W.: docking, molecular dynamics simulation; L.Q., M.P.: data collection and processing, structure refinement; G.W.H., M.A.H.: structure refinement and data analysis. R.B.L. and J.-H.H.: functional studies, mutations; A.K.: radioligand binding assays; K.D.: structure analysis; X.L. and H.L.: molecular dynamics simulations; S.Z.: supervision of structure and simulation analysis; L.M.B.: design and supervision of functional and kinetic studies; A.M.: supervision on agonist conceptual design, synthesis and characterization; R.C.S.: project conception, data analysis supervision; Z.J.L.: design and supervision of experiments, data analysis; Z.J.L., T.H., R.C.S., A.M., L.M.B. and S.Z. wrote the manuscript with discussions and improvements from M.A.H., K.V., S.P.N. and Y.W.
The authors declare competing financial interests: details are available in the online version of the paper.
Reviewer Information Nature thanks G. Kunos and the other anonymous reviewer(s) for their contribution to the peer review of this work.
References
- 1.Mechoulam R, Hanuš LO, Pertwee R, Howlett AC. Early phytocannabinoid chemistry to endocannabinoids and beyond. Nat. Rev. Neurosci. 2014;15:757–764. doi: 10.1038/nrn3811. [DOI] [PubMed] [Google Scholar]
- 2.Hua T, et al. Crystal structure of the human cannabinoid receptor CB1. Cell. 2016;167:750–762. e714. doi: 10.1016/j.cell.2016.10.004. [DOI] [PMC free article] [PubMed] [Google Scholar]
- 3.Ballesteros JA, Weinstein H. In: Methods in Neurosciences. Sealfon Stuart C, editor. Vol. 25. Academic; 1995. pp. 366–428. [Google Scholar]
- 4.Lemberger L. Potential therapeutic usefulness of marijuana. Annu. Rev. Pharmacol. Toxicol. 1980;20:151–172. doi: 10.1146/annurev.pa.20.040180.001055. [DOI] [PubMed] [Google Scholar]
- 5.Li H-L. An archaeological and historical account of cannabis in China. Econ. Bot. 1973;28:437–448. [Google Scholar]
- 6.Makriyannis A. 2012 Division of Medicinal Chemistry Award Address. Trekking the cannabinoid road: a personal perspective. J. Med. Chem. 2014;57:3891–3911. doi: 10.1021/jm500220s. [DOI] [PMC free article] [PubMed] [Google Scholar]
- 7.Shao Z, et al. High-resolution crystal structure of the human CB1 cannabinoid receptor. Nature. 2016;540:602–606. doi: 10.1038/nature20613. [DOI] [PMC free article] [PubMed] [Google Scholar]
- 8.Nikas SP, et al. The role of halogen substitution in classical cannabinoids: a CB1 pharmacophore model. AAPS J. 2004;6:e30. doi: 10.1208/aapsj060430. [DOI] [PMC free article] [PubMed] [Google Scholar]
- 9.Nikas SP, et al. Novel 1′,1′ -chain substituted hexahydrocannabinols: 9β-hydroxy-3-(1-hexyl-cyclobut-1-yl)-hexahydrocannabinol (AM2389) a highly potent cannabinoid receptor 1 (CB1) agonist. J. Med. Chem. 2010;53:6996–7010. doi: 10.1021/jm100641g. [DOI] [PMC free article] [PubMed] [Google Scholar]
- 10.Xie XQ, Melvin LS, Makriyannis A. The conformational properties of the highly selective cannabinoid receptor ligand CP-55,940. J. Biol. Chem. 1996;271:10640–10647. doi: 10.1074/jbc.271.18.10640. [DOI] [PubMed] [Google Scholar]
- 11.Makriyannis A, Rapaka RS. The medicinal chemistry of cannabinoids: an overview. NIDA Res. Monogr. 1987;79:204–210. [PubMed] [Google Scholar]
- 12.Ahn KH, Bertalovitz AC, Mierke DF, Kendall DA. Dual role of the second extracellular loop of the cannabinoid receptor 1: ligand binding and receptor localization. Mol. Pharmacol. 2009;76:833–842. doi: 10.1124/mol.109.057356. [DOI] [PMC free article] [PubMed] [Google Scholar]
- 13.Feigenbaum JJ, et al. Nonpsychotropic cannabinoid acts as a functional N-methyl-d-aspartate receptor blocker. Proc. Natl Acad. Sci. USA. 1989;86:9584–9587. doi: 10.1073/pnas.86.23.9584. [DOI] [PMC free article] [PubMed] [Google Scholar]
- 14.Mechoulam R, et al. Enantiomeric cannabinoids: stereospecificity of psychotropic activity. Experientia. 1988;44:762–764. doi: 10.1007/BF01959156. [DOI] [PubMed] [Google Scholar]
- 15.Hanson MA, et al. Crystal structure of a lipid G protein-coupled receptor. Science. 2012;335:851–855. doi: 10.1126/science.1215904. [DOI] [PMC free article] [PubMed] [Google Scholar]
- 16.Rasmussen SG, et al. Crystal structure of the β2 adrenergic receptor–Gs protein complex. Nature. 2011;477:549–555. doi: 10.1038/nature10361. [DOI] [PMC free article] [PubMed] [Google Scholar]
- 17.Singh R, et al. Activation of the cannabinoid CB1 receptor may involve a W6.48/F3.36 rotamer toggle switch. J. Pept. Res. 2002;60:357–370. doi: 10.1034/j.1399-3011.2002.21065.x. [DOI] [PubMed] [Google Scholar]
- 18.Tiburu EK, et al. Structural biology of human cannabinoid receptor-2 helix 6 in membrane-mimetic environments. Biochem. Biophys. Res. Commun. 2009;384:243–248. doi: 10.1016/j.bbrc.2009.04.099. [DOI] [PMC free article] [PubMed] [Google Scholar]
- 19.Zhang K, et al. Structure of the human P2Y12 receptor in complex with an antithrombotic drug. Nature. 2014;509:115–118. doi: 10.1038/nature13083. [DOI] [PMC free article] [PubMed] [Google Scholar]
- 20.Zhang J, et al. Agonist-bound structure of the human P2Y12 receptor. Nature. 2014;509:119–122. doi: 10.1038/nature13288. [DOI] [PMC free article] [PubMed] [Google Scholar]
- 21.Nikas SP, et al. A concise methodology for the synthesis of (−)-Δ9-tetrahydrocannabinol and (−)-Δ9-tetrahydrocannabivarin metabolites and their regiospecifically deuterated analogs. Tetrahedron. 2007;63:8112–8113. [Google Scholar]
- 22.Kulkarni S, et al. Novel C-ring-hydroxy-substituted controlled deactivation cannabinergic analogues. J. Med. Chem. 2016;59:6903–6919. doi: 10.1021/acs.jmedchem.6b00717. [DOI] [PMC free article] [PubMed] [Google Scholar]
- 23.D’Antona AM, Ahn KH, Kendall DA. Mutations of CB1 T210 produce active and inactive receptor forms: correlations with ligand affinity, receptor stability, and cellular localization. Biochemistry. 2006;45:5606–5617. doi: 10.1021/bi060067k. [DOI] [PMC free article] [PubMed] [Google Scholar]
- 24.Caffrey M, Cherezov V. Crystallizing membrane proteins using lipidic mesophases. Nat. Protocols. 2009;4:706–731. doi: 10.1038/nprot.2009.31. [DOI] [PMC free article] [PubMed] [Google Scholar]
- 25.Cherezov V, et al. Rastering strategy for screening and centring of microcrystal samples of human membrane proteins with a sub-10 microm size X-ray synchrotron beam. J. R. Soc. Interface. 2009;6(suppl. 5):S587–S597. doi: 10.1098/rsif.2009.0142.focus. [DOI] [PMC free article] [PubMed] [Google Scholar]
- 26.Chun E, et al. Fusion partner toolchest for the stabilization and crystallization of G protein-coupled receptors. Structure. 2012;20:967–976. doi: 10.1016/j.str.2012.04.010. [DOI] [PMC free article] [PubMed] [Google Scholar]
- 27.Kabsch W. Xds. Acta Crystallogr. D. 2010;66:125–132. doi: 10.1107/S0907444909047337. [DOI] [PMC free article] [PubMed] [Google Scholar]
- 28.McCoy AJ, et al. Phaser crystallographic software. J. Appl. Crystallogr. 2007;40:658–674. doi: 10.1107/S0021889807021206. [DOI] [PMC free article] [PubMed] [Google Scholar]
- 29.Adams PD, et al. PHENIX: a comprehensive Python-based system for macromolecular structure solution. Acta Crystallogr. D. 2010;66:213–221. doi: 10.1107/S0907444909052925. [DOI] [PMC free article] [PubMed] [Google Scholar]
- 30.Smart OS, et al. Exploiting structure similarity in refinement: automated NCS and target-structure restraints in BUSTER. Acta Crystallogr. D. 2012;68:368–380. doi: 10.1107/S0907444911056058. [DOI] [PMC free article] [PubMed] [Google Scholar]
- 31.Emsley P, Lohkamp B, Scott WG, Cowtan K. Features and development of Coot. Acta Crystallogr. D. 2010;66:486–501. doi: 10.1107/S0907444910007493. [DOI] [PMC free article] [PubMed] [Google Scholar]
- 32.Friesner RA, et al. Glide: a new approach for rapid, accurate docking and scoring. 1. Method and assessment of docking accuracy. J. Med. Chem. 2004;47:1739–1749. doi: 10.1021/jm0306430. [DOI] [PubMed] [Google Scholar]
- 33.Friesner RA, et al. Extra precision glide: docking and scoring incorporating a model of hydrophobic enclosure for protein-ligand complexes. J. Med. Chem. 2006;49:6177–6196. doi: 10.1021/jm051256o. [DOI] [PubMed] [Google Scholar]
- 34.Halgren TA, et al. Glide: a new approach for rapid, accurate docking and scoring. 2. Enrichment factors in database screening. J. Med. Chem. 2004;47:1750–1759. doi: 10.1021/jm030644s. [DOI] [PubMed] [Google Scholar]
- 35.Abraham MJ, et al. GROMACS: High performance molecular simulations through multi-level parallelism from laptops to supercomputers. SoftwareX. 2015;1–2:19–25. [Google Scholar]
- 36.Pettersen EF, et al. UCSF Chimera—a visualization system for exploratory research and analysis. J. Comput. Chem. 2004;25:1605–1612. doi: 10.1002/jcc.20084. [DOI] [PubMed] [Google Scholar]
- 37.Sousa da Silva AW, Vranken WF. ACPYPE – AnteChamber PYthon Parser interfacE. BMC Res. Notes. 2012;5:367. doi: 10.1186/1756-0500-5-367. [DOI] [PMC free article] [PubMed] [Google Scholar]
- 38.Berman HM, et al. The Protein Data Bank. Nucleic Acids Res. 2000;28:235–242. doi: 10.1093/nar/28.1.235. [DOI] [PMC free article] [PubMed] [Google Scholar]
- 39.Skjærven L, Yao XQ, Scarabelli G, Grant BJ. Integrating protein structural dynamics and evolutionary analysis with Bio3D. BMC Bioinformatics. 2014;15:399. doi: 10.1186/s12859-014-0399-6. [DOI] [PMC free article] [PubMed] [Google Scholar]
Associated Data
This section collects any data citations, data availability statements, or supplementary materials included in this article.
Supplementary Materials
Data Availability Statement
Atomic coordinates and structures have been deposited in the Protein Data Bank (PDB) with accession codes 5XRA (CB1–AM11542) and 5XR8 (CB1–AM841). All other data are available from the corresponding authors upon reasonable request.


