Abstract
Objective
The aim of this study was to assess the feasibility of 18F-fluorodeoxyglucose (FDG)-positron emission tomography/computed tomography (PET/CT) to systematically detect and quantify differential effects of chronic tobacco use in organs of the whole body.
Methods
20 healthy male subjects (10 non-smokers and 10 chronic heavy smokers) were enrolled. Subjects underwent whole-body FDG-PET/CT, diagnostic unenhanced chest CT, mini-mental state examination (MMSE), urine testing for oxidative stress and serum testing.
Organs of interest (thyroid, skin, skeletal muscle, aorta, heart, lung, adipose tissue, liver, spleen, brain, lumbar spinal bone marrow, and testis) were analyzed from FDG-PET/CT images to determine their metabolic activities using standardized uptake value (SUV) or metabolic volumetric product (MVP). Measurements were compared between subject groups using 2-sample t-tests or Wilcoxon rank-sum tests as determined by tests for normality. Correlational analyses were also performed.
Results
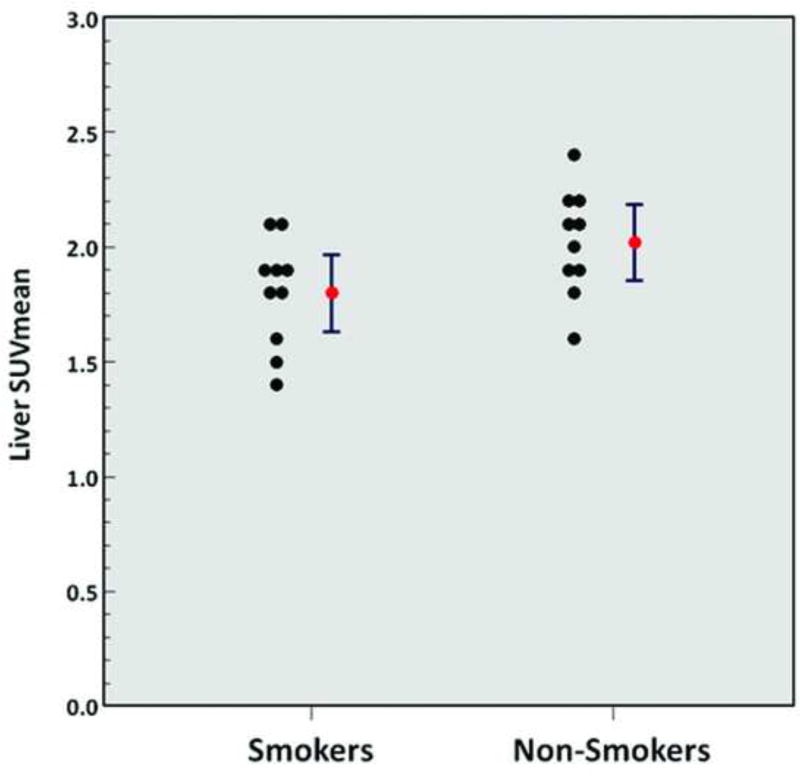
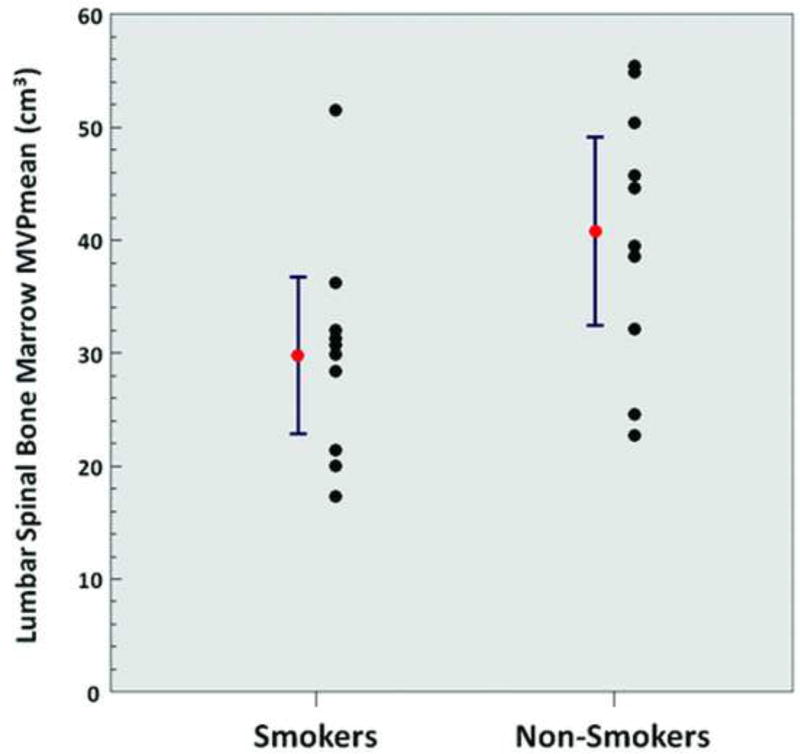
FDG-PET/CT revealed significantly decreased metabolic activity of lumbar spinal bone marrow (MVPmean 29.8±9.7 cc vs. 40.8±11.6 cc, p=0.03) and liver (SUVmean 1.8±0.2 vs. 2.0±0.2, p=0.049), and increased metabolic activity of visceral adipose tissue (VAT) (SUVmean 0.35±0.10 vs. 0.26±0.06, p=0.02) in chronic smokers compared to non-smokers. Normalized VAT volume was also significantly decreased (p=0.04) in chronic smokers. There were no statistically significant differences in the metabolic activity of other assessed organs.
Conclusions
Subclinical organ effects of chronic tobacco use are detectable and quantifiable on FDG-PET/CT. FDG-PET/CT may therefore play a major role in the study of systemic toxic effects of tobacco use in organs of the whole body for clinical or research purposes.
Keywords: fluorodeoxyglucose (FDG), positron emission tomography/computed tomography (PET/CT), CT, tobacco use, smoking, metabolism, inflammation
Introduction
Smoking is one of the most important sources of toxic exposure in humans, and is a major cause of morbidity and mortality worldwide. It is associated with a wide variety of disease conditions that affect multiple organ systems of the body secondary to increased levels of cellular oxidative stress, receptor binding, genetic mutations, and release of pro-inflammatory chemical substances. However, the subclinical metabolic and pro-inflammatory effects of chronic tobacco use have not been systematically assessed body wide at the organ level in humans, largely due to the lack of available robust quantitative diagnostic techniques for this purpose. The ability to detect and to quantify the severity of the subclinical organ effects of chronic tobacco use may be important to determine individualized risk for development of various disease conditions, to foster smoking cessation, and to monitor the effects of interventions utilized to mitigate the adverse effects of smoking.
18F-2-fluorodeoxyglucose (FDG)-positron emission tomography (PET)/computed tomography (CT) is a molecular imaging technique that is available for accurate quantitative assessment of cellular metabolism in the whole body. Although FDG-PET/CT is predominantly used to assess patients with cancer in clinical practice, it is also useful to non-invasively detect and quantify inflammation, infection, and other etiologies of altered tissue metabolism in organs of the body [1–3]. As such, it is reasonable to hypothesize that FDG-PET/CT can be used to assess the subclinical metabolic and pro-inflammatory effects of smoking. Yet, to our knowledge, no human studies with FDG-PET/CT have been performed to systematically study the effects of chronic tobacco use upon organs of the whole body. Therefore, in this pilot study, we assessed the feasibility of FDG-PET/CT to quantitatively assess the differential metabolic and inflammatory changes in organs of the whole body in relation to chronic tobacco use.
Materials and Methods
This prospective pilot study was conducted following approval from the Institutional Review Board at the Hospital of the University of Pennsylvania, and following approval for an investigational new drug (IND) exemption from the Radioactive Drug Research Committee (RDRC) at the University of Pennsylvania.
Study sample
Twenty healthy volunteer male subjects were enrolled in this prospective pilot study between January 2010 and August 2011. Ten were non-smokers (i.e., never smokers) and 10 were chronic heavy cigarette smokers. Informed consent was obtained for experimentation with human subjects.
Inclusion criteria were as follows: (i) male sex; (ii) age 30–50 years inclusive; and (iii) no significant health problems as per subject report and available medical records (although chronic obstructive pulmonary disease (COPD) was allowable in smokers). Additionally, inclusion criteria for smokers required a ≥ 15 pack-year smoking history and no recent tobacco quit attempt. We arbitrarily selected only male subjects for participation in this study to eliminate confounding of the results by the potential differential effects of sex (male, female) upon organ metabolism. A relatively older subject sample was selected for participation in this study in order to maximize the likelihood of detecting differences in organ metabolism on FDG-PET/CT secondary to chronic tobacco use.
Nicotine dependence was assessed in chronic heavy smokers using the Fagerström Test of Nicotine Dependence (FTND) [4]. The FTND is a six-item self-report measure of nicotine dependence (with a score range of 0 to 10, where > 4 is considered to indicate moderate nicotine dependence) with satisfactory internal consistency and high test-retest reliability [5].
Exclusion criteria were as follows: (i) chronic disease requiring ongoing medical treatment (with exception of COPD in smokers); (ii) acute illness within the last 3 months; (iii) heavy alcohol use defined as more than 2 drinks per day on average; (iv) known diabetes mellitus or fasting blood glucose level > 130 mg/dl; (v) obesity defined by a body mass index (BMI) > 30 kg/m2; (vi) a history of hypertension or blood pressure > 140/90; (vii) a history of any neuropsychiatric disorder; (viii) inability to withhold cigarette usage for a minimum of 3 hours (in smokers); and (ix) inability to tolerate all imaging and non-imaging test procedures.
Whole-body FDG-PET/CT and Thoracic Diagnostic CT Image Acquisition
Subjects fasted for a minimum of 6 hours and were confirmed to have fingerstick blood glucose levels of ≤ 130 mg/dL prior to FDG administration. A 16 multidetector row LYSO whole-body PET/CT scanner with time-of-flight capabilities (Gemini TF, Philips Healthcare, Bothell, WA) was used to acquire whole-body FDG-PET/CT images. Approximately 15 mCi MBq (range 14.41–16.49 mCi) of FDG were administered intravenously to subjects while they were quietly resting in a chair. Subsequently, 3D PET emission data were acquired from the skull vertex to the toes in supine position beginning 60 ± 15 minutes later for 3 minutes per bed position. The subjects' arms were down by the torso during image acquisition from the skull vertex to the base of the neck, and raised above the torso during image acquisition from the base of the neck to the toes. A list-mode maximum-likelihood expectation-maximization (ML-EM) algorithm was utilized to perform image reconstruction. The system model included time-of-flight, normalization, randoms, attenuation, and scatter corrections. Attenuation correction of PET images was done utilizing rescaled low-dose CT. PET and CT images were reconstructed at 5 mm slice thickness.
Diagnostic quality unenhanced thin-section high-resolution CT (HRCT) of the chest during full inspiratory breath hold was subsequently performed on the PET/CT scanner in the same session to accurately quantify the degree of pulmonary emphysema using semi-automated computer-assisted techniques. Acquisition parameters were as follows: kVp 120, effective mAs 100–260, gantry rotation time 0.5 seconds, slice collimation 16 × 0.75 mm. Axial CT images were then reconstructed with slice thickness 1 mm, slice interval 1 mm, and reconstruction kernel L to provide high spatial resolution images of the lung.
Non-Imaging Based Assessments
Mini-mental state examination (MMSE) testing was performed in all subjects to assess mental status via testing of 5 areas of cognitive function: orientation, registration, attention and calculation, recall, and language [6]. The maximum score achievable was 30.
Urine laboratory testing was performed in all subjects for the following 8 nicotine metabolites: nicotine, cotinine, 5'-hydroxycotinine, nicotine N'-oxide, cotinine N-oxide, norcotinine, nornicotine, and 4-hydroxy-4-(3-pyridyl)-butanoic acid. In addition, urine testing for 1-hydroxypyrene (1-HOP), a biomarker of polycyclic aromatic hydrocarbons (PAH) that is not specific for tobacco, and 8-oxo-2'-deoxyguanosine (8-oxo-dGuo), a biomarker of tobacco smoke induced oxidative stress, was also performed. Serum laboratory testing for complete blood count, metabolic panel (including glucose and calcium), liver function tests, lipid panel, erythrocyte sedimentation rate (ESR), high sensitivity C-reactive protein (hs-CRP), thyroid stimulating hormone (TSH), and total testosterone was also performed in all subjects.
Whole-body FDG-PET/CT and Thoracic Diagnostic CT Image Analysis
Organs of interest were analyzed from FDG-PET/CT and thoracic diagnostic CT images to determine their metabolic activities, based on mean standardized uptake value (SUVmean) or mean metabolic volumetric product (MVPmean) (defined as the product of organ SUVmean and volume) measurements, and, for some organs, their volumes. Although multiple observers performed and recorded the image-based measurements for all of the organs of interest, each particular organ of interest was analyzed in similar fashion across subjects only by a single observer in order to eliminate interobserver variability of measurements for individual organs.
For the thyroid gland, skin, skeletal muscle, aorta, and heart (including the left and right ventricles separately), average SUVmean measurements were obtained from 2D or 3D regions of interest (ROIs) manually placed on transverse PET slices passing through these structures using low-dose CT images for anatomic guidance on a dedicated PET/CT analysis workstation (Extended Brilliance Workstation, Philips Healthcare, Bothell, WA).
For the liver and spleen, average SUVmean measurements were obtained from 3D ROIs manually placed within these organs using dedicated PET/CT analysis software with default settings (ROVER, ABX GmbH, Radeberg, Germany) [7–9]. For the brain (including the cerebral cortex, basal ganglia, and cerebellum), lumbar spinal bone marrow (for an average single lower lumbar vertebral level), and testes, 3D ROIs were manually placed around these organs using the same software. Automatic 3D delineation of the FDG avid portions of these structures was then performed using an initial threshold setting of 40% of the maximum with other settings left on default, and average organ MVPmean measurements (in units of cm3) were obtained.
The lungs (excluding pulmonary vessels and any parenchymal opacities) were automatically segmented from diagnostic unenhanced CT images using the iterative relative fuzzy connectedness (IRFC) method of the CAVASS software system [10, 11]. The fraction of emphysema per lung (F) was calculated using a −950 HU threshold. Subsequently, the lungs were segmented from low-dose CT images from PET/CT using the IRFC method, and the 3D lung ROIs were transferred to the coregistered PET images from PET/CT. The average fraction of emphysema per lung and the average partial volume corrected SUVmean per lung were then calculated as previously reported [12].
The subcutaneous adipose tissue (SAT) and visceral adipose tissue (VAT) in the torso were segmented from low-dose CT images from PET/CT using the Live Wire method of the CAVASS software system along with a thresholding operation [10, 13]. The SAT-VAT interface was defined via Live Wire along the interior surface of the rib cage (in the thorax) and along the interior surface of the body wall musculature (in the abdomen and pelvis). Adipose tissue external to this interface and internal to the skin surface was considered to be SAT, whereas adipose tissue internal to this interface was considered to be VAT as previously described [14, 15]. SAT and VAT volumes were measured, and SAT and VAT normalized volumes were calculated (where normalized volume (unitless) = un-normalized volume / (diagonal length of the smallest rectangular box enclosing osseous structures of torso)3) to correct for intersubject differences in body habitus. Subsequently, the 3D SAT and VAT ROIs were transferred to the coregistered PET images from PET/CT. Average SAT and VAT SUVmean measurements were then obtained.
Statistical Analysis
Summary statistics such as means and standard deviations were calculated for all response variables (imaging and non-imaging assessments) by subject group (smokers vs. non-smokers). Two-sided 2-sample t tests were performed to assess statistically significant differences between the two subject groups with regard to imaging and non-imaging assessments. Additionally, regression analyses were performed and Pearson correlation coefficients were calculated to examine associations between selected response variables. All analyses were performed using SAS statistical software (Version 9.4, SAS Institute, Cary, NC).
Results
Twenty participants (10 chronic heavy smokers, 10 never smokers) completed all assessments. Participants were 43 ± 6 years old with BMI of 26.2 ± 2.9 kg/m2, and systolic blood pressure and diastolic blood pressure of 126 ± 12.5 mm Hg and 78 ± 9 mm Hg, respectively. Smokers had a mean tobacco pack-year history of 30 ± 15 and a mean FTND score of 6 ± 2. There were no statistically significant differences in age, BMI, or systolic or diastolic blood pressure between the two subject groups.
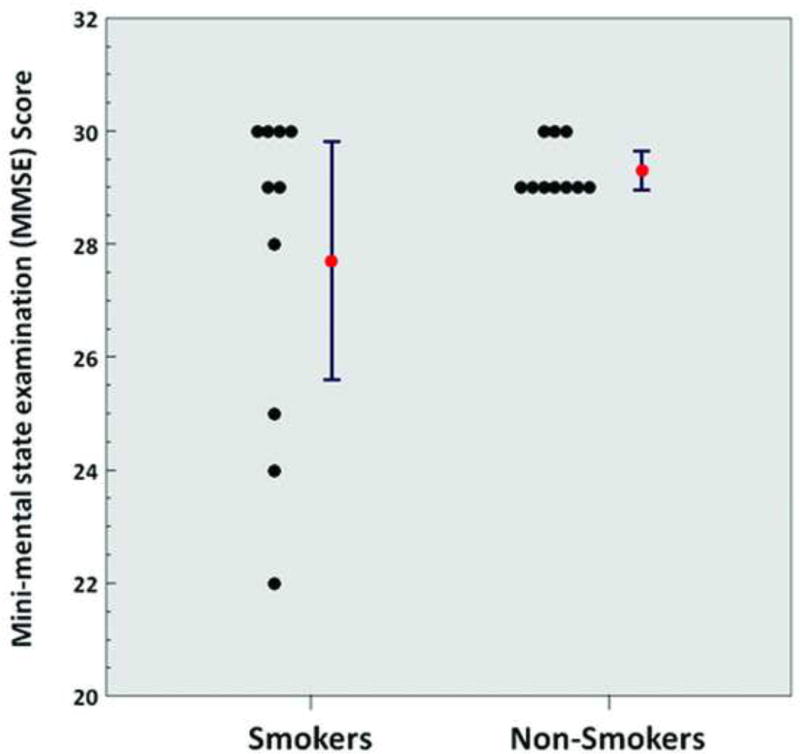
MMSE scores did not significantly differ between chronic heavy smoker and non-smoker subject groups (Table 1). However, 4 of 10 chronic heavy smoker subjects had MMSE scores of less than 29 (ranging from 22–28), whereas all MMSE scores ranged from 29–30 in non-smokers (Figure 1).
Table 1.
Subject MMSE and urinary laboratory test results based on smoking status.
| Variable | Smokers | Non-Smokers | p value |
|---|---|---|---|
| Mini-mental state examination (MMSE) score | 27.7 ± 3.0 | 29.3 ± 0.5 | 0.11 |
| Urine nicotine (µg/mL) | 1.2 ± 1.6 | 0.0 ± 0.0 | 0.04 |
| Urine cotinine (µg/mL) | 3.2 ± 2.0 | 0.0 ± 0.0 | < 0.01 |
| Urine 5'-hydroxycotinine (µg/mL) | 8.4 ± 8.3 | 0.0 ± 0.0 | 0.01 |
| Urine nicotine N'-oxide (µg/mL) | 0.7 ± 0.5 | 0.0 ± 0.0 | < 0.01 |
| Urine cotinine N-oxide (µg/mL) | 7.5 ± 13.6 | 0.0 ± 0.0 | < 0.01 |
| Urine norcotinine (µg/mL) | 0.1 ± 0.0 | 0.0 ± 0.0 | < 0.01 |
| Urine nornicotine (µg/mL) | 0.1 ± 0.1 | 0.0 ± 0.0 | < 0.01 |
| Urine 4-hydroxy-4-(3-pyridyl)-butanoic acid (µg/mL) | 7.8 ± 11.2 | 0.0 ± 0.0 | 0.04 |
| Urine 1-hydroxypyrene (pg/mL) | 115.2 ± 145.7 | 37.6 ± 59.1 | 0.14 |
| Urine 8-oxo-2'-deoxyguanosine | 2.2 ± 1.6 | 1.6 ± 1.5 | 0.34 |
Results are displayed as mean ± standard deviation with significant p values (< 0.05) in last column highlighted in gray.
Figure 1.
Mini-mental state examination score (smokers vs. non-smokers; p = 0.11). Red points and error bars represent mean values ± standard error of the mean (SEM).
Urinary laboratory testing confirmed detectable levels of all eight nicotine metabolites in chronic heavy smokers but not in non-smokers. There were no statistically significant differences in urine levels of 1-hydroxypyrene (1-HOP) and 8-oxo-2'-deoxyguanosine between chronic heavy smokers and non-smokers (Table 1).
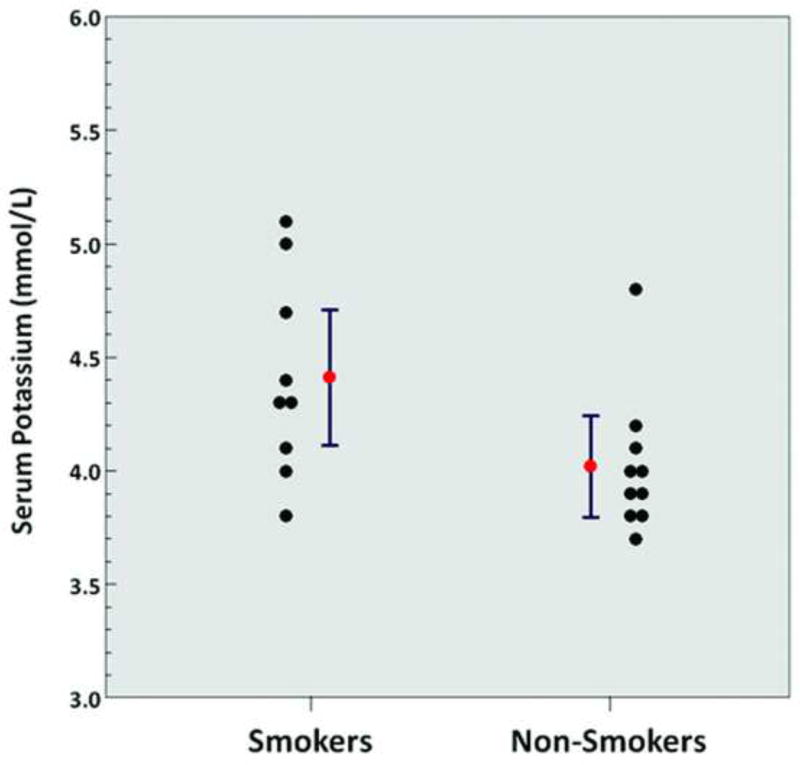
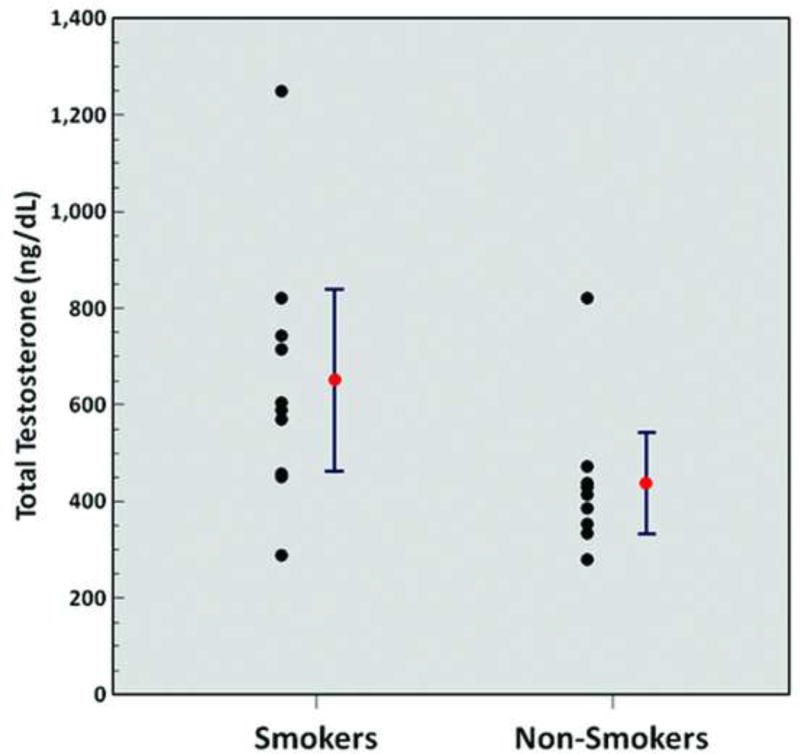
Significantly higher levels of serum potassium (4.4 ± 0.4 mmol/L vs. 4.0 ± 0.3 mmol/L, p = 0.03) (Figure 2) and significantly higher levels of serum total testosterone (651.2 ± 263.0 ng/dL vs. 438.2 ± 147.2 ng/dL, p = 0.04) (Figure 3) were observed in chronic heavy smokers compared to non-smokers. However, there were no statistically significant differences in serum complete blood count, metabolic panel, liver function tests, lipid panel, ESR, hs-CRP, or TSH between chronic heavy smokers and non-smokers (Table 2).
Figure 2.
Serum potassium levels (smokers vs. non-smokers; p = 0.03). Red points and error bars represent mean values ± SEM.
Figure 3.
Serum total testosterone levels (smokers vs. non-smokers; p = 0.04). Red points and error bars represent mean values ± SEM.
Table 2.
Subject serum laboratory test results based on smoking status.
| Variable | Smokers | Non-Smokers | p value |
|---|---|---|---|
| Complete blood count | |||
| White blood cell (WBC) count (× 103/µL) | 5.8 ± 1.1 | 6.0 ± 2.3 | 0.83 |
| Red blood cell (RBC) count (× 106/µL) | 4.6 ± 0.7 | 4.5 ± 0.2 | 0.48 |
| Hemoglobin (Hgb) (g/dL) | 13.8 ± 1.6 | 14.2 ± 1.0 | 0.55 |
| Hematocrit (Hct) (%) | 40.7 ± 4.3 | 41.30 ± 2.50 | 0.71 |
| Red cell distribution width (RDW) (%) | 13.5 ± 0.8 | 13.1 ± 0.8 | 0.26 |
| Mean corpuscular hemoglobin (MCH) (pg) | 30.2 ± 3.8 | 31.8 ± 1.0 | 0.22 |
| Mean corpuscular hemoglobin concentration (MCHC) (g/dL) | 34.2 ± 1.0 | 34.4 ± 0.8 | 0.64 |
| Mean corpuscular volume (MCV) (fL) | 88.4 ± 9.1 | 92.4 ± 2.4 | 0.20 |
| Platelet count (× 103/µL) | 255.0 ± 74.3 | 214.3 ± 60.2 | 0.20 |
| Metabolic panel | |||
| Sodium (mmol/L) | 138.8 ± 1.9 | 138.2 ± 2.5 | 0.55 |
| Potassium (mmol/L) | 4.4 ± 0.4 | 4.0 ± 0.3 | 0.03 |
| Chloride (mmol/L) | 103.9 ± 2.5 | 103.2 ± 3.2 | 0.59 |
| Bicarbonate (mmol/L) | 27.6 ± 3.0 | 27.1 ± 1.8 | 0.66 |
| Blood urea nitrogen (mg/dL) | 9.9 ± 3.0 | 10.6 ± 3.6 | 0.64 |
| Creatinine (mg/dL) | 0.9 ± 0.1 | 0.9 ± 0.1 | 0.21 |
| Fingerstick glucose (mg/dL) | 89.8 ± 96.0 | 96.0 ± 11.5 | 0.29 |
| Calcium (mg/dL) | 9.4 ± 0.4 | 9.4 ± 0.2 | 0.72 |
| Liver function tests | |||
| Total protein (g/dL) | 7.1 ± 0.5 | 6.9 ± 0.5 | 0.51 |
| Albumin (g/dL) | 4.1 ± 0.3 | 4.1 ± 0.2 | 0.46 |
| Alanine aminotransferase (ALT) (U/L) | 25.4 ± 15.5 | 29.7 ± 19.4 | 0.59 |
| Aspartate aminotransferase (AST) (U/L) | 26.5 ± 9.6 | 31.0 ± 14.4 | 0.42 |
| Alkaline phosphatase (U/L) | 68.5 ± 20.8 | 61.1 ± 24.6 | 0.48 |
| Total bilirubin (mg/dL) | 0.9 ± 0.2 | 0.9 ± 0.3 | 0.93 |
| Direct bilirubin (mg/dL) | 0.1 ± 0.0 | 0.1 ± 0.1 | 0.18 |
| Indirect bilirubin (mg/dL) | 0.8 ± 0.2 | 0.8 ± 0.3 | 0.85 |
| Lipid panel | |||
| Total cholesterol (mg/dL) | 185.0 ± 23.0 | 192.6 ± 33.0 | 0.56 |
| High-density lipoprotein cholesterol (HDL-C) (mg/dL) | 54.3 ± 17.6 | 50.5 ± 13.6 | 0.60 |
| Low-density lipoprotein cholesterol (LDL-C) (mg/dL) | 113.1 ± 27.1 | 119.1 ± 35.7 | 0.68 |
| Triglycerides (mg/dL) | 88.2 ± 57.3 | 115.0 ± 91.7 | 0.44 |
| Other | |||
| Erythrocyte sedimentation rate (ESR) (mm/hr) | 6.7 ± 5.4 | 8.8 ± 9.9 | 0.56 |
| High-sensitivity C-reactive protein (hs-CRP) (mg/L) | 2.4 ± 2.7 | 1.1 ± 1.0 | 0.18 |
| Thyroid stimulating hormone (TSH) (µIU/mL) | 1.4 ± 0.6 | 1.4 ± 0.7 | 0.98 |
| Total testosterone (ng/dL) | 651.2 ± 263.0 | 438.2 ± 147.2 | 0.04 |
Results are displayed as mean ± standard deviation with significant p values (< 0.05) in last column highlighted in gray.
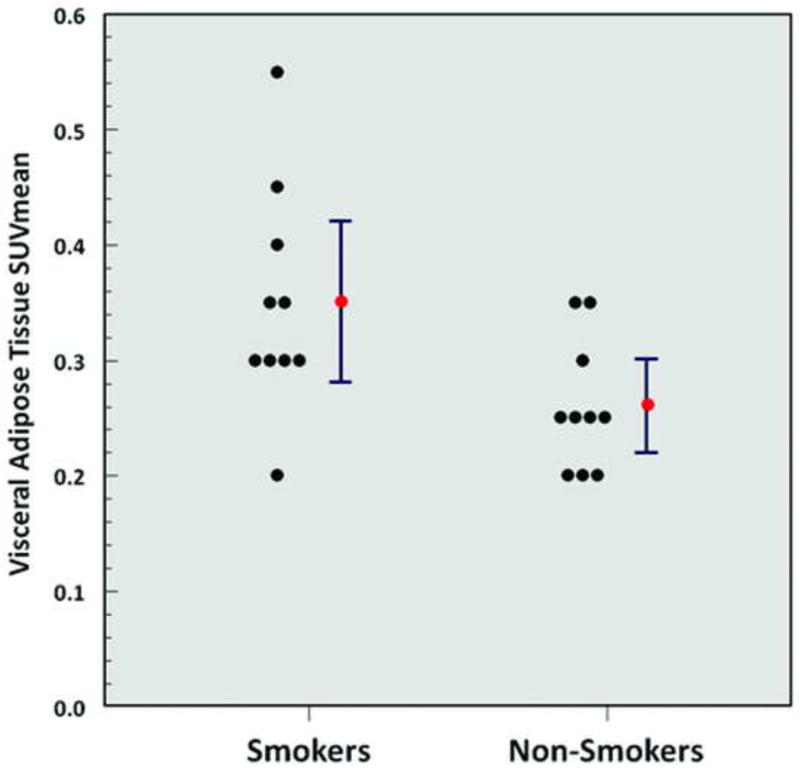
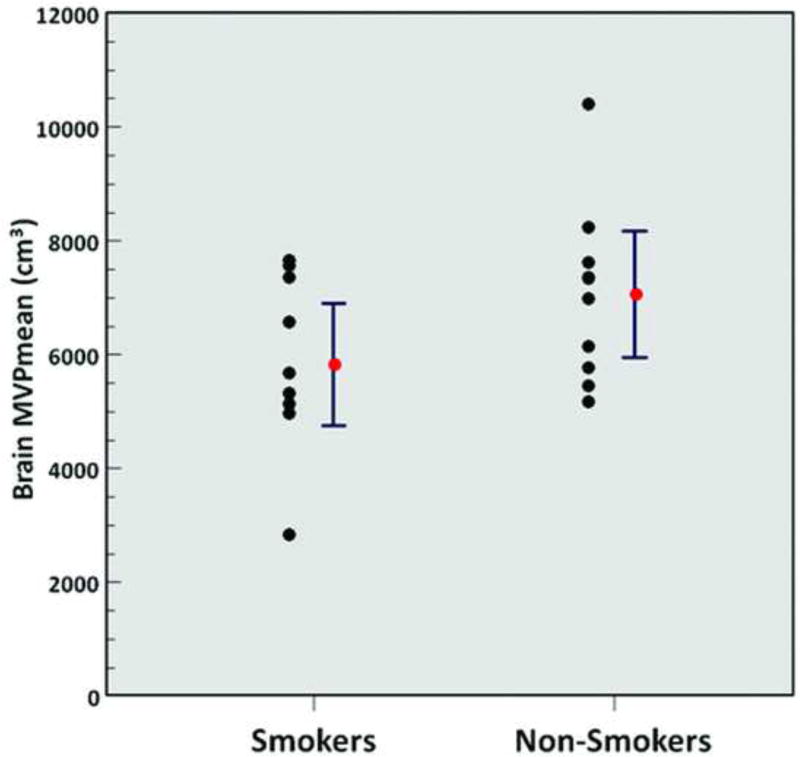
A significantly higher metabolic activity of VAT (SUVmean 0.35 ± 0.10 vs. 0.26 ± 0.06, p = 0.02) (Figure 4), a significantly lower normalized volume of VAT (0.04 ± 0.01 vs. 0.05 ± 0.02, p = 0.04), a significantly lower metabolic activity of the liver (SUVmean 1.8 ± 0.2 vs. 2.0 ± 0.2, p = 0.049) (Figure 5), and a significantly lower metabolic activity of the lumbar spinal bone marrow (MVPmean 29.8 ± 9.7 cm3 vs. 40.8 ± 11.6 cm3, p = 0.03) (Figure 6) were observed from FDG-PET/CT images in chronic heavy smokers compared to non-smokers. There were no other statistically significant differences in organ metabolism, normalized SAT volume, or fraction of emphysema per lung between chronic heavy smokers and non-smokers (Table 3). In particular, no significant difference in global brain metabolic activity was observed (Figure 7).
Figure 4.
Visceral adipose tissue SUVmean (smokers vs. non-smokers; p = 0.02). Red points and error bars represent mean values ± SEM.
Figure 5.
Liver SUVmean (smokers vs. non-smokers; p = 0.049). Red points and error bars represent mean values ± SEM.
Figure 6.
Lumbar spinal bone marrow MVPmean (smokers vs. non-smokers; p = 0.03). Red points and error bars represent mean values ± SEM.
Table 3.
Subject organ properties measured on PET/CT and diagnostic thoracic CT based on smoking status.
| Variable | Smokers | Non-Smokers | p value |
|---|---|---|---|
| Thyroid SUVmean | 1.1 ± 0.3 | 1.2 ± 0.2 | 0.92 |
| Skin SUVmean | 0.30 ± 0.12 | 0.31 ± 0.09 | 0.67 |
| Skeletal muscle SUVmean | 0.56 ± 0.11 | 0.59 ± 0.14 | 0.14 |
| Aorta SUVmean | 1.4 ± 0.1 | 1.4 ± 0.4 | 0.74 |
| Left ventricle SUVmean | 4.0 ± 2.5 | 3.5 ± 2.6 | 0.66 |
| Right ventricle SUVmean | 1.7 ± 0.5 | 1.6 ± 0.6 | 0.74 |
| Lung cSUVmean | 0.51 ± 0.17 | 0.54 ± 0.09 | 0.61 |
| Subcutaneous adipose tissue (SAT) SUVmean | 0.25 ± 0.12 | 0.22 ± 0.09 | 0.46 |
| Visceral adipose tissue (VAT) SUVmean | 0.35 ± 0.10 | 0.26 ± 0.06 | 0.02 |
| Liver SUVmean | 1.8 ± 0.2 | 2.0 ± 0.2 | 0.049 |
| Spleen SUVmean | 1.6 ± 0.3 | 1.7 ± 0.3 | 0.65 |
| Brain MVPmean (cm3) | 5815.7 ± 1499.0 | 7044.7 ± 1552.9 | 0.09 |
| Lumbar spinal bone marrow MVPmean (cm3) | 29.8 ± 9.7 | 40.8 ± 11.6 | 0.03 |
| Testis MVPmean (cm3) | 42.4 ± 17.4 | 50.0 ± 14.6 | 0.31 |
| Fraction of emphysema per lung | 0.01 ± 0.01 | 0.02 ± 0.01 | 0.56 |
| SAT normalized volume | 0.07 ± 0.03 | 0.09 ± 0.03 | 0.11 |
| VAT normalized volume | 0.04 ± 0.01 | 0.05 ± 0.02 | 0.04 |
Results are displayed as mean ± standard deviation with significant p values (< 0.05) in last column highlighted in gray.
FDG = 18F-fluorodeoxyglucose; SUVmean = mean standardized uptake value; cSUVmean = partial volume corrected mean standardized uptake value; MVPmean = mean metabolic volumetric product.
Figure 7.
Brain MVPmean (smokers vs. non-smokers; p = 0.09). Red points and error bars represent mean values ± SEM.
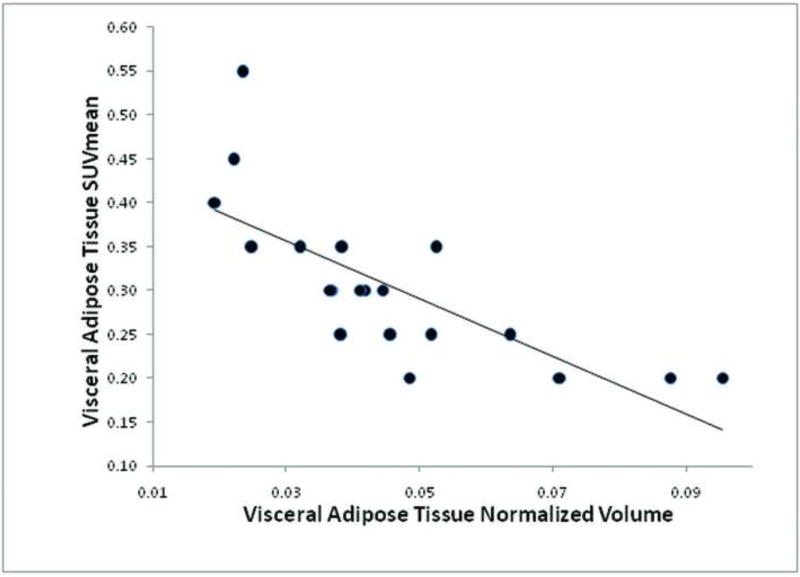
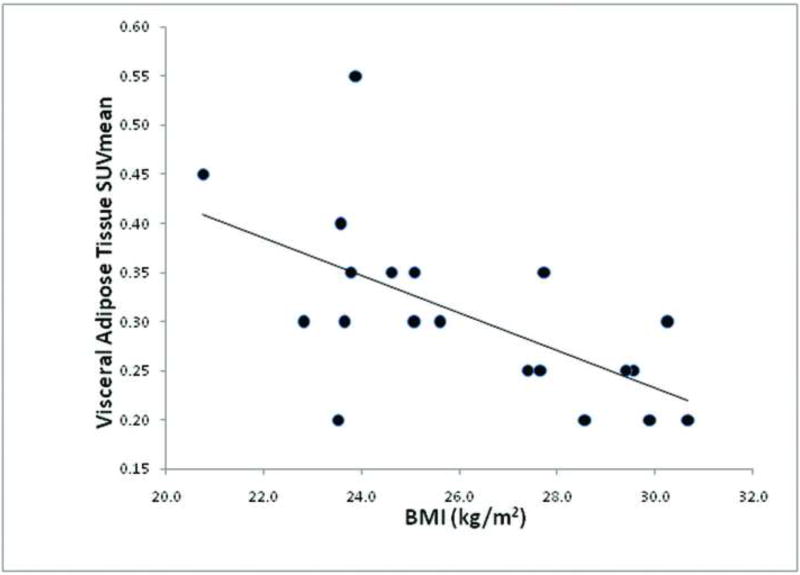
Across the entire group of 20 subjects, VAT SUVmean was statistically significantly inversely correlated with VAT normalized volume (r = −0.75, p = 0.0001) (Figure 8), and VAT SUVmean was statistically significantly inversely correlated with BMI (r = −0.62, p = 0.0037) (Figure 9).
Figure 8.
Correlation between visceral adipose tissue SUVmean and visceral adipose tissue normalized volume (r = −0.75, p = 0.0001) amongst all 20 subjects.
Figure 9.
Correlation between visceral adipose tissue SUVmean and BMI (r = −.062, p = 0.0037) amongst all 20 subjects.
Discussion
Smoking is one of the most significant sources of toxic chemical exposure in humans, and is the leading preventable cause of death and disability worldwide. The World Health Organization (WHO) estimates that there are more than 1 billion smokers worldwide, that cigarette smoking kills around 6 million people per year globally, and that smoking causes over $500 billion in economic damage each year [16, 17]. In the United States, approximately 1 in 5 adults currently smoke (equivalent to an estimated 40 million people), and approximately 1 in 5 deaths (equivalent to more than 480,000 deaths per year) are due to smoking [18]. Smoking is associated with an increased incidence of pulmonary disease, cardiovascular disease, cerebrovascular disease, vascular disease, gastrointestinal disease, musculoskeletal disease, skin disease, periodontal disease, adverse reproductive effects, transplant rejection, and malignant neoplasms [19–22]. This is because tobacco smoke contains more than 7000 chemical compounds, including nicotine, cyanide, benzene, benzopyrene, formaldehyde, ammonia, and nitrogen oxide amongst others, which lead to cellular oxidative stress, receptor binding, genetic mutations, release of pro-inflammatory cytokines and chemokines, and subsequent development of disease conditions in various organ systems of the body [23–25].
In our study, we observed that chronic tobacco use is significantly associated with increased metabolic activity of VAT as measured on FDG-PET/CT. This is consistent with the notion that chronic tobacco use induces a pro-inflammatory effect in VAT, as adipose tissue is known to be a major source of inflammatory molecules that are associated with adverse clinical effects. Similarly, Vanfleteren et al reported in a retrospective study that patients with COPD had significantly increased levels of FDG uptake in abdominal VAT based on PET/CT compared to non-COPD controls, whereas abdominal SAT did not significantly differ in the level of FDG uptake. In addition, FDG uptake in abdominal VAT was significantly correlated with FDG uptake in the abdominal aorta, independent of patient age and BMI [26]. However, Christen et al reported in a retrospective study that VAT exhibited higher FDG uptake compared to SAT independent of age, sex, BMI, comorbidities, smoking history, and medications [27].
Chronic tobacco use was significantly associated with decreased VAT volumes as measured on the low dose unenhanced CT portion of PET/CT. This is similar to other studies in the literature that report that smoking is associated with a decreased volume of VAT. For example, based on data from the China Health and Nutrition Survey from 1991–2011, Wang et al reported that smoking was positively associated with the likelihood of being underweight or healthy weight, but negatively associated with the likelihood of being overweight or obese in China [28]. However, other studies in the literature have reported that smoking is associated with increased VAT volumes as measured by CT. For example, Molenaar et al studied the cross-sectional association between smoking and SAT and VAT volumes based on abdominal CT in 2,926 Framingham Heart Study participants (mean age 50 ± 10 years; mean of 26 pack-years in female current smokers, 28 pack-years in male current smokers, 13 pack-years in female former smokers, and 19 pack-years in male former smokers). They reported that former smoking was associated with a higher SAT volume compared with current or non-smokers in men, and that former and current smoking were associated with a higher VAT volume compared to non-smokers in both women and men [29]. A potential explanation for such discrepant results in the literature is that the precise mechanisms for the effects of tobacco use upon body weight are not fully understood and are often contradictory. Decreased appetite, enhanced resting metabolism, increased thermogenesis, and reduced fat accumulation may occur secondary to effects of tobacco compounds such as nicotine upon the brain and endocrine system [30–32] as well as due to pro-inflammatory effects in the body [33, 34], whereas decreases in exercise activity secondary to the adverse cardiopulmonary effects of chronic tobacco use (including COPD and coronary artery disease), unhealthy diet, or hormonal effects may lead to weight gain [35]. Other co-factors may also play an important role in determining the effect of tobacco use upon VAT. For instance, Onat et al reported in a prospective study that smoking selectively inhibited VAT accumulation in women but not in men, suggesting an interactive sex effect [36].
Chronic tobacco use was also significantly associated with decreased hepatic metabolic activity as measured on FDG-PET/CT, which suggests that smoking induces an adverse hepatotoxic effect. In a retrospective study of 96 consecutive patients who underwent FDG-PET/CT for cancer screening, Pak et al reported that hepatic FDG uptake was strongly correlated with VAT volume [37]. In light of these reported results, our observed results may alternatively be related indirectly to the effects of tobacco use upon VAT volume.
Furthermore, we observed that chronic tobacco use is significantly associated with decreased spinal bone marrow metabolic activity as measured on FDG-PET/CT. This suggests that smoking induces an adverse toxic effect upon the bone marrow, which is consistent with other reports in the literature. For example, Beyth et al reported in a prospective study of 13 smokers and 13 non-smokers who underwent iliac crest bone marrow aspiration that cigarette smoking was associated with a significantly decreased concentration of bone marrow progenitor cells [38]. Zhou et al reported that cigarette smoke extract decreased the number of erythrocyte and granulocyte colony-forming units, up-regulated toll-like receptor expression, and induced IL-8 and TGF-β1 production in bone marrow specimens from healthy donors, indicating that cigarette smoke profoundly inhibits the growth of erythroid and granulocyte-macrophage progenitors in the bone marrow, induces inflammation, and may impair bone marrow hematopoiesis [39]. In a prospective study of 54 healthy volunteers who underwent iliac crest bone marrow aspiration, Fernandez-Ferrero et al reported that smokers showed in their bone marrow a 3.73% higher percentage of dyserythropoietic features and a 0.28% higher percentage of blast cells at any age relative to non-smokers [40].
Chronic tobacco use was significantly associated with increased serum potassium levels and serum total testosterone levels. Other studies in the literature have also reported alterations in the blood as a result of smoking. For example, Wannamethee et al in a prospective study of 7636 middle-aged British men reported that increased serum potassium levels were strongly positively associated with smoking, and that the increased risk of mortality associated with elevated potassium levels was seen only among current smokers [41]. Kung et al reported in a prospective study of 297 young male smokers and 872 young male non-smokers (mean age 19.4 years, 2–15 cigarettes/day) that smoking was significantly associated with increased white blood cell (WBC) count, hemoglobin, hematocrit, mean corpuscular volume (MCV), mean corpuscular hemoglobin (MCH), carboxyhemoglobin concentration, albumin/globulin ratio, and triglyceride levels. In addition, smokers had a significantly increased risk of hypertriglyceridemia, hyperglycemia, neutrophilia, red blood cell (RBC) macrocytosis, hyperchromia, and polycythemia [42].
We also observed that although MMSE scores did not significantly differ between chronic heavy smokers and non-smokers, 4 of 10 chronic heavy smokers had decreased MMSE scores of less than 29, whereas non-smokers had scores ranging from 29–30. This observation is consistent with other studies that report that smoking is associated with neurocognitive impairments including deficiencies in executive functions, cognitive flexibility, general intellectual abilities, learning and/or memory processing speed, and working memory [43, 44]. However, we did not observe a significant difference in global brain metabolism as measured on FDG-PET/CT due to chronic smoking, although other studies in the literature have reported adverse neurobiological effects of smoking upon the brain. Studies using MRI have reported that chronic tobacco use is generally associated with decreases in gray matter volume or density in various portions of the cerebral cortex, subcortical structures, and cerebellum, along with regional alterations in white matter volumes or microstructure [45, 46]. Furthermore, studies using magnetic resonance spectroscopy (MRS) have reported alterations in regional brain metabolite levels due to chronic tobacco use [44, 47]. Costello et al reported in a prospective study of 54 tobacco-dependent cigarette smokers (≥ 10 cigarettes/day) that there was a positive correlation between the number of cigarettes smoked per day and glucose metabolism in the left posterior occipital gyrus and left parietal-temporal junction extending to the left superior temporal gyrus based on FDG-PET using statistical parametric mapping [48].
In our study, we did not encounter other statistically significant differences in organ metabolism as measured on FDG-PET/CT between chronic heavy smokers and non-smokers. However, a few other studies in the literature have reported detectable effects of smoking upon some other organs of the body (namely the lungs, muscles, and aorta) as measured with FDG-PET imaging. Schroeder et al studied the effects of unilateral acute lung exposure to cigarette smoke upon 5 mechanically ventilated sheep using FDG-PET, and demonstrated significantly increased FDG uptake in smoke-exposed lungs relative to control lungs [49]. Jones et al reported in a prospective study that average FDG uptake in the lungs as measured through PET and kinetic analyses was significantly higher in 6 patients with COPD compared to that of 6 asthmatic patients (a 235% increase) and 6 normal controls (a 266% increase), most likely due to increased pulmonary localization and metabolic activation of neutrophils in COPD patients [50–52]. Torigian et al performed a retrospective study of 49 subjects with variable amounts of centrilobular emphysema who previously underwent FDG-PET or FDG-PET/CT imaging along with diagnostic thoracic CT imaging, and reported that the degree of pulmonary inflammation, as measured on FDG-PET images using partial volume correction, was significantly positively correlated with the severity of emphysema [12]. Jacene et al reported in a retrospective study of 61 smokers and 35 non-smokers that increased FDG uptake in intercostal muscles is significantly more frequently seen in smokers relative to non-smokers on PET/CT [53]. Similarly, other investigators have observed increased FDG uptake on PET images in thoracic and abdominal muscles as well as in the right heart in patients with COPD [54–57]. Coulson et al prospectively assessed 7 male ex-smokers with COPD and 7 male ex-smoker control patients without COPD using FDG-PET/CT, and reported that presence of COPD was associated with significantly increased aortic FDG uptake compared to controls [58].
Our study has several limitations. Firstly, the main limitation of this study is the small sample size, likely resulting in underpowering for detection of some chronic tobacco effects upon some organs of the body. Despite this limitation, we have demonstrated detectable, quantifiable, and biologically plausible subclinical differences in the metabolism of some organs of the body due to chronic tobacco use on FDG-PET/CT. In particular, the significantly increased VAT metabolic activity and serum potassium levels related to chronic tobacco use are consistent with the increased risk of cardiovascular disease that smokers have, which may need to be further evaluated in larger scale studies. Second, our study enrolled "healthy" smokers to eliminate confounding variables such as systemic hypertension, obesity, diabetes mellitus, or other disease conditions or risk factors, likely leading to underestimation of the potentially synergistic effects of chronic tobacco use and comorbid conditions upon organ metabolism. In fact, although we did not exclude chronic heavy smokers with COPD from enrollment in the study, the amount of emphysema per lung in the chronic heavy smoker group was observed to be very mild (ranging up to 3.8%), and did not significantly differ from the non-smoker group. As such, the metabolic effects upon organs of the body observed in this study likely underestimate the true metabolic effects that actually occur in smokers who have one or more existing comorbid conditions including moderate or severe COPD. Third, our study only enrolled men between the ages of 30 and 50 years of age. As a result, we did not study the effects of sex or age in conjunction with chronic tobacco use upon organ metabolism.
Conclusion
In this study, we report, for the first time, prospective data regarding quantitative assessment of the differential effects of chronic tobacco use upon organs of the whole body, demonstrating the feasibility of FDG-PET/CT for this purpose. In particular, we have shown that chronic tobacco use is significantly associated with increased visceral adipose tissue metabolic activity, decreased visceral adipose tissue volume, decreased hepatic metabolic activity, and decreased spinal bone marrow metabolic activity as measured on FDG-PET/CT. We also observed that chronic tobacco use is significantly associated with increased serum potassium levels and serum total testosterone levels. The combined increased visceral adipose tissue metabolic activity and increased serum potassium levels are consistent with the increased risk of cardiovascular disease that is generally observed with smoking.
We believe that the methodologies and data presented here will serve as a useful template for those interested in conducting future prospective clinical translational research on tobacco use. Such research may include larger scale quantitative assessment of the alterations in organ metabolism while accounting for other cofactors including patient sex, patient age, and presence of comorbid conditions, as well as quantitative assessment of the metabolic effects of various interventions used to modify smoking behavior or to mitigate the effects of tobacco smoke upon individual organs of the body and ultimately upon individual risk for associated chronic disease.
Acknowledgments
This publication was made possible by a pilot grant from the Center of Excellence in Environmental Toxicology, grant IP30 ES013508-05 from the National Institute of Environmental Health Sciences (NIEHS), National Institutes of Health (NIH), to Drs. Torigian and Green-McKenzie. It was supported in part by a training grant from the National Institute of Occupational Safety and Health (NIOSH) grant 5-TO1-0H008628. Its contents are solely the responsibility of the authors and do not necessarily represent the official views of the NIEHS, NIH or NIOSH.
We would like to thank Ian A. Blair, PhD, from the Penn Superfund and Research Training Program (SRP) and Center of Excellence in Environmental Toxicology, Department of Systems Pharmacology and Translational Therapeutics, University of Pennsylvania, Philadelphia, PA for facilitating urine laboratory testing.
Footnotes
The authors have no conflicts of interest to declare.
References
- 1.Kwee TC, Torigian DA, Alavi A. Overview of positron emission tomography, hybrid positron emission tomography instrumentation, and positron emission tomography quantification. J Thorac Imaging. 2013;28(1):4–10. doi: 10.1097/RTI.0b013e31827882d9. [DOI] [PubMed] [Google Scholar]
- 2.Kwee TC, Torigian DA, Alavi A. Oncological applications of positron emission tomography for evaluation of the thorax. J Thorac Imaging. 2013;28(1):11–24. doi: 10.1097/RTI.0b013e318279449b. [DOI] [PubMed] [Google Scholar]
- 3.Kwee TC, Torigian DA, Alavi A. Nononcological applications of positron emission tomography for evaluation of the thorax. J Thorac Imaging. 2013;28(1):25–39. doi: 10.1097/RTI.0b013e31827882a9. [DOI] [PubMed] [Google Scholar]
- 4.Heatherton TF, Kozlowski LT, Frecker RC, et al. The Fagerstrom Test for Nicotine Dependence: a revision of the Fagerstrom Tolerance Questionnaire. Br J Addict. 1991;86(9):1119–27. doi: 10.1111/j.1360-0443.1991.tb01879.x. [DOI] [PubMed] [Google Scholar]
- 5.Pomerleau CS, Carton SM, Lutzke ML, et al. Reliability of the Fagerstrom Tolerance Questionnaire and the Fagerstrom Test for Nicotine Dependence. Addict Behav. 1994;19(1):33–9. doi: 10.1016/0306-4603(94)90049-3. [DOI] [PubMed] [Google Scholar]
- 6.Tombaugh TN, McIntyre NJ. The mini-mental state examination: a comprehensive review. J Am Geriatr Soc. 1992;40(9):922–35. doi: 10.1111/j.1532-5415.1992.tb01992.x. [DOI] [PubMed] [Google Scholar]
- 7.Hofheinz F, Dittrich S, Potzsch C, et al. Effects of cold sphere walls in PET phantom measurements on the volume reproducing threshold. Phys Med Biol. 2010;55(4):1099–113. doi: 10.1088/0031-9155/55/4/013. [DOI] [PubMed] [Google Scholar]
- 8.Torigian DA, Lopez RF, Alapati S, et al. Feasibility and performance of novel software to quantify metabolically active volumes and 3D partial volume corrected SUV and metabolic volumetric products of spinal bone marrow metastases on 18F-FDG-PET/CT. Hell J Nucl Med. 2011;14(1):8–14. [PubMed] [Google Scholar]
- 9.Hofheinz F, Langner J, Petr J, et al. A method for model-free partial volume correction in oncological PET. EJNMMI research. 2012;2(1):16. doi: 10.1186/2191-219X-2-16. [DOI] [PMC free article] [PubMed] [Google Scholar]
- 10.Grevera G, Udupa J, Odhner D, et al. CAVASS: a computer-assisted visualization and analysis software system. J Digit Imaging. 2007;20(Suppl 1):101–18. doi: 10.1007/s10278-007-9060-5. [DOI] [PMC free article] [PubMed] [Google Scholar]
- 11.Udupa JK, Odhner D, Zhao L, et al. Body-wide hierarchical fuzzy modeling, recognition, and delineation of anatomy in medical images. Med Image Anal. 2014;18(5):752–71. doi: 10.1016/j.media.2014.04.003. [DOI] [PMC free article] [PubMed] [Google Scholar]
- 12.Torigian DA, Dam V, Chen X, et al. In vivo quantification of pulmonary inflammation in relation to emphysema severity via partial volume corrected F-FDG-PET using computer-assisted analysis of diagnostic chest CT. Hell J Nucl Med. 2013;16(1):12–8. doi: 10.1967/s0024499100066. [DOI] [PubMed] [Google Scholar]
- 13.Falcao AX, Udupa JK, Miyazawa FK. An ultra-fast user-steered image segmentation paradigm: live wire on the fly. IEEE Trans Med Imaging. 2000;19(1):55–62. doi: 10.1109/42.832960. [DOI] [PubMed] [Google Scholar]
- 14.Tong Y, Udupa JK, Torigian DA. Optimization of abdominal fat quantification on CT imaging through use of standardized anatomic space: a novel approach. Med Phys. 2014;41(6) doi: 10.1118/1.4876275. 063501-1-11. [DOI] [PMC free article] [PubMed] [Google Scholar]
- 15.Tong Y, Udupa JK, Wu C, et al. Fat segmentation on chest CT images via fuzzy models. Proc SPIE. 2016;9786 978609-1-6. [Google Scholar]
- 16.World Health Organization Fact Sheet. 2015 http://www.who.int/mediacentre/factsheets/fs339/en/
- 17.World Health Organization report on the global tobacco epidemic. Enforcing bans on tobacco advertising, promotion and sponsorship. 2013 http://www.who.int/tobacco/global_report/2013/en/
- 18.Centers for Disease Control and Prevention Fact Sheet. Current cigarette smoking among adults in the United States. 2015 http://www.cdc.gov/tobacco/data_statistics/fact_sheets/adult_data/cig_smoking/index.htm.
- 19.Yanbaeva DG, Dentener MA, Creutzberg EC, et al. Systemic effects of smoking. Chest. 2007;131(5):1557–66. doi: 10.1378/chest.06-2179. [DOI] [PubMed] [Google Scholar]
- 20.Metelitsa AI, Lauzon GJ. Tobacco and the skin. Clin Dermatol. 2010;28(4):384–90. doi: 10.1016/j.clindermatol.2010.03.021. [DOI] [PubMed] [Google Scholar]
- 21.Khanna AK, Xu J, Uber PA, et al. Tobacco smoke exposure in either the donor or recipient before transplantation accelerates cardiac allograft rejection, vascular inflammation, and graft loss. Circulation. 2009;120(18):1814–21. doi: 10.1161/CIRCULATIONAHA.108.840223. [DOI] [PubMed] [Google Scholar]
- 22.Samet JM. Tobacco smoking: the leading cause of preventable disease worldwide. Thorac Surg Clin. 2013;23(2):103–12. doi: 10.1016/j.thorsurg.2013.01.009. [DOI] [PubMed] [Google Scholar]
- 23.DeMarini DM. Genotoxicity of tobacco smoke and tobacco smoke condensate: a review. Mutat Res. 2004;567(2–3):447–74. doi: 10.1016/j.mrrev.2004.02.001. [DOI] [PubMed] [Google Scholar]
- 24.Hammond D, O'Connor RJ. Constituents in tobacco and smoke emissions from Canadian cigarettes. Tob Control. 2008;17(Suppl 1):i24–31. doi: 10.1136/tc.2008.024778. [DOI] [PubMed] [Google Scholar]
- 25.National Center for Chronic Disease Prevention and Health Promotion (US); Office on Smoking and Health (US) How Tobacco Smoke Causes Disease: The Biology and Behavioral Basis for Smoking-Attributable Disease: A Report of the Surgeon General. Atlanta (GA): Centers for Disease Control and Prevention (US); 2010. http://www.ncbi.nlm.nih.gov/books/NBK53017/ [PubMed] [Google Scholar]
- 26.Vanfleteren LE, van Meerendonk AM, Franssen FM, et al. A possible link between increased metabolic activity of fat tissue and aortic wall inflammation in subjects with COPD. A retrospective 18F-FDG-PET/CT pilot study. Respir Med. 2014;108(6):883–90. doi: 10.1016/j.rmed.2014.04.001. [DOI] [PubMed] [Google Scholar]
- 27.Christen T, Sheikine Y, Rocha VZ, et al. Increased glucose uptake in visceral versus subcutaneous adipose tissue revealed by PET imaging. JACC Cardiovascular imaging. 2010;3(8):843–51. doi: 10.1016/j.jcmg.2010.06.004. [DOI] [PMC free article] [PubMed] [Google Scholar]
- 28.Wang Q. Smoking and body weight: evidence from China health and nutrition survey. BMC Public Health. 2015;15(1):1238. doi: 10.1186/s12889-015-2549-9. [DOI] [PMC free article] [PubMed] [Google Scholar]
- 29.Molenaar EA, Massaro JM, Jacques PF, et al. Association of lifestyle factors with abdominal subcutaneous and visceral adiposity: the Framingham Heart Study. Diabetes Care. 2009;32(3):505–10. doi: 10.2337/dc08-1382. [DOI] [PMC free article] [PubMed] [Google Scholar]
- 30.Stadler M, Tomann L, Storka A, et al. Effects of smoking cessation on beta-cell function, insulin sensitivity, body weight, and appetite. Eur J Endocrinol. 2014;170(2):219–7. doi: 10.1530/EJE-13-0590. [DOI] [PubMed] [Google Scholar]
- 31.Chen H, Vlahos R, Bozinovski S, et al. Effect of short-term cigarette smoke exposure on body weight, appetite and brain neuropeptide Y in mice. Neuropsychopharmacology. 2005;30(4):713–9. doi: 10.1038/sj.npp.1300597. [DOI] [PubMed] [Google Scholar]
- 32.Yoshida T, Yoshioka K, Hiraoka N, et al. Effect of nicotine on norepinephrine turnover and thermogenesis in brown adipose tissue and metabolic rate in MSG obese mice. J Nutr Sci Vitaminol (Tokyo) 1990;36(2):123–30. doi: 10.3177/jnsv.36.123. [DOI] [PubMed] [Google Scholar]
- 33.McEvoy JW, Nasir K, DeFilippis AP, et al. Relationship of cigarette smoking with inflammation and subclinical vascular disease: the Multi-Ethnic Study of Atherosclerosis. Arterioscler Thromb Vasc Biol. 2015;35(4):1002–10. doi: 10.1161/ATVBAHA.114.304960. [DOI] [PMC free article] [PubMed] [Google Scholar]
- 34.Shiels MS, Katki HA, Freedman ND, et al. Cigarette smoking and variations in systemic immune and inflammation markers. J Natl Cancer Inst. 2014;106(11) doi: 10.1093/jnci/dju294. [DOI] [PMC free article] [PubMed] [Google Scholar]
- 35.Chiolero A, Faeh D, Paccaud F, et al. Consequences of smoking for body weight, body fat distribution, and insulin resistance. Am J Clin Nutr. 2008;87(4):801–9. doi: 10.1093/ajcn/87.4.801. [DOI] [PubMed] [Google Scholar]
- 36.Onat A, Ayhan E, Hergenc G, et al. Smoking inhibits visceral fat accumulation in Turkish women: relation of visceral fat and body fat mass to atherogenic dyslipidemia, inflammatory markers, insulin resistance, and blood pressure. Metabolism. 2009;58(7):963–70. doi: 10.1016/j.metabol.2009.02.029. [DOI] [PubMed] [Google Scholar]
- 37.Pak K, Kim SJ, Kim IJ, et al. Hepatic FDG Uptake is not Associated with Hepatic Steatosis but with Visceral Fat Volume in Cancer Screening. Nuclear medicine and molecular imaging. 2012;46(3):176–81. doi: 10.1007/s13139-012-0143-y. [DOI] [PMC free article] [PubMed] [Google Scholar]
- 38.Beyth S, Mosheiff R, Safran O, et al. Cigarette Smoking Is Associated with a Lower Concentration of CD105(+) Bone Marrow Progenitor Cells. Bone marrow research. 2015;2015:914935. doi: 10.1155/2015/914935. [DOI] [PMC free article] [PubMed] [Google Scholar]
- 39.Zhou J, Eksioglu EA, Fortenbery NR, et al. Bone marrow mononuclear cells up-regulate toll-like receptor expression and produce inflammatory mediators in response to cigarette smoke extract. PLoS ONE. 2011;6(6):e21173. doi: 10.1371/journal.pone.0021173. [DOI] [PMC free article] [PubMed] [Google Scholar]
- 40.Fernandez-Ferrero S, Ramos F. Dyshaemopoietic bone marrow features in healthy subjects are related to age. Leukemia research. 2001;25(2):187–9. doi: 10.1016/s0145-2126(00)00109-0. [DOI] [PubMed] [Google Scholar]
- 41.Wannamethee SG, Lever AF, Shaper AG, et al. Serum potassium, cigarette smoking, and mortality in middle-aged men. Am J Epidemiol. 1997;145(7):598–606. doi: 10.1093/oxfordjournals.aje.a009156. [DOI] [PubMed] [Google Scholar]
- 42.Kung CM, Wang HL, Tseng ZL. Cigarette smoking exacerbates health problems in young men. Clinical and investigative medicine Medecine clinique et experimentale. 2008;31(3):E138–49. doi: 10.25011/cim.v31i3.3471. [DOI] [PubMed] [Google Scholar]
- 43.Wagner M, Schulze-Rauschenbach S, Petrovsky N, et al. Neurocognitive impairments in non-deprived smokers--results from a population-based multi-center study on smoking-related behavior. Addict Biol. 2013;18(4):752–61. doi: 10.1111/j.1369-1600.2011.00429.x. [DOI] [PubMed] [Google Scholar]
- 44.Durazzo TC, Meyerhoff DJ, Nixon SJ. Chronic cigarette smoking: implications for neurocognition and brain neurobiology. Int J Environ Res Public Health. 2010;7(10):3760–91. doi: 10.3390/ijerph7103760. [DOI] [PMC free article] [PubMed] [Google Scholar]
- 45.Wang C, Xu X, Qian W, et al. Altered human brain anatomy in chronic smokers: a review of magnetic resonance imaging studies. Neurol Sci. 2015;36(4):497–504. doi: 10.1007/s10072-015-2065-9. [DOI] [PubMed] [Google Scholar]
- 46.Karama S, Ducharme S, Corley J, et al. Cigarette smoking and thinning of the brain's cortex. Mol Psychiatry. 2015;20(6):778–85. doi: 10.1038/mp.2014.187. [DOI] [PMC free article] [PubMed] [Google Scholar]
- 47.Durazzo TC, Meyerhoff DJ, Mon A, et al. Chronic Cigarette Smoking in Healthy Middle-Aged Individuals Is Associated with Decreased Regional Brain N-acetylaspartate and Glutamate Levels. Biol Psychiatry. 2015 doi: 10.1016/j.biopsych.2015.03.029. [DOI] [PMC free article] [PubMed] [Google Scholar]
- 48.Costello MR, Mandelkern MA, Shoptaw S, et al. Effects of treatment for tobacco dependence on resting cerebral glucose metabolism. Neuropsychopharmacology. 2010;35(3):605–12. doi: 10.1038/npp.2009.165. [DOI] [PMC free article] [PubMed] [Google Scholar]
- 49.Schroeder T, Vidal Melo MF, Musch G, et al. PET imaging of regional 18F-FDG uptake and lung function after cigarette smoke inhalation. J Nucl Med. 2007;48(3):413–9. [PubMed] [Google Scholar]
- 50.Jones HA, Marino PS, Shakur BH, et al. In vivo assessment of lung inflammatory cell activity in patients with COPD and asthma. Eur Respir J. 2003;21(4):567–73. doi: 10.1183/09031936.03.00048502. [DOI] [PubMed] [Google Scholar]
- 51.Jones HA, Clark RJ, Rhodes CG, et al. In vivo measurement of neutrophil activity in experimental lung inflammation. Am J Respir Crit Care Med. 1994;149(6):1635–9. doi: 10.1164/ajrccm.149.6.7516252. [DOI] [PubMed] [Google Scholar]
- 52.Jones HA, Cadwallader KA, White JF, et al. Dissociation between respiratory burst activity and deoxyglucose uptake in human neutrophil granulocytes: implications for interpretation of (18)F-FDG PET images. J Nucl Med. 2002;43(5):652–7. [PubMed] [Google Scholar]
- 53.Jacene HA, Patel PP, Chin BB. 2-Deoxy-2-[18F] fluoro-D-glucose uptake in intercostal respiratory muscles on positron emission tomography/computed tomography: smokers versus nonsmokers. Mol Imaging Biol. 2004;6(6):405–10. doi: 10.1016/j.mibio.2004.08.002. [DOI] [PubMed] [Google Scholar]
- 54.Osman MM, Tran IT, Muzaffar R, et al. Does (1)(8)F-FDG uptake by respiratory muscles on PET/CT correlate with chronic obstructive pulmonary disease? J Nucl Med Technol. 2011;39(4):252–7. doi: 10.2967/jnmt.111.089961. [DOI] [PubMed] [Google Scholar]
- 55.Basu S, Alzeair S, Li G, et al. Etiopathologies associated with intercostal muscle hypermetabolism and prominent right ventricle visualization on 2-deoxy-2[F-18]fluoro-D-glucose-positron emission tomography: significance of an incidental finding and in the setting of a known pulmonary disease. Mol Imaging Biol. 2007;9(6):333–9. doi: 10.1007/s11307-007-0102-7. [DOI] [PubMed] [Google Scholar]
- 56.Aydin A, Hickeson M, Yu JQ, et al. Demonstration of excessive metabolic activity of thoracic and abdominal muscles on FDG-PET in patients with chronic obstructive pulmonary disease. Clin Nucl Med. 2005;30(3):159–64. doi: 10.1097/00003072-200503000-00003. [DOI] [PubMed] [Google Scholar]
- 57.Duarte PS, Zhuang H, Machado C, et al. Increased FDG uptake in the right cardiac chambers in a patient with pulmonary emphysema. Clin Nucl Med. 2002;27(8):605–6. doi: 10.1097/00003072-200208000-00017. [DOI] [PubMed] [Google Scholar]
- 58.Coulson JM, Rudd JH, Duckers JM, et al. Excessive aortic inflammation in chronic obstructive pulmonary disease: an 18F-FDG PET pilot study. J Nucl Med. 2010;51(9):1357–60. doi: 10.2967/jnumed.110.075903. [DOI] [PubMed] [Google Scholar]


