

Abstract
The lack of standardization of tissue handling and processing hinders the development and validation of new biomarkers in research and clinical settings. We compared the histomorphology and the quality and quantity of biomolecules in paraffin-embedded mouse tissues, followed by fixation with neutral buffered formalin (NBF), 70% ethanol, and buffered ethanol (BE70) fixative. The quality of the histomorphology and immunohistochemistry in BE70 was relatively time-independent, whereas those in NBF rapidly decreased after 1 week of fixation. Protein recovered from tissue fixed in 70% ethanol and BE70 was compatible with Western blot and protein array using AKT and GAPDH antibodies, regardless of the fixation time. In addition, the quality and quantity of RNA extracted from tissue in ethanol-based fixative showed minimal changes from 4 hr to 6 months, whereas NBF had a dramatic detrimental change in RNA quality after 1 week of fixation. Furthermore, ethanol-based fixative offers a superior DNA template for PCR amplification–based molecular assays than NBF. In conclusion, coagulative, ethanol-based fixatives show a broader time spectrum than the aldehyde crosslinking fixative NBF in their histomorphological features and the quantity and quality of the biomolecules from paraffin-embedded tissue, and they may facilitate the use of fixative-fixed paraffin-embedded tissues in research and clinical laboratories, avoiding overfixation.
Keywords: alcohol, fixation, formaldehyde, histology, immunohistochemistry, protein, RNA integrity
Introduction
Quality of tissue preservation and fixation is an important issue in biomedical research. Although widely applied, the process of tissue fixation and impregnation is poorly understood. Numerous studies have demonstrated that tissue handling and processing affects the quality of tissue morphology, proteins, and nucleic acids.1–5 The elements of this preanalytical phase primarily consist of warm ischemia, fixation, and tissue processing. These processes are poorly appreciated and have an urgent need for standardization. Surgical specimens are routinely fixed in 10% neutral buffered formalin (NBF), an aldehyde-based crosslinking fixative which has been the gold standard for decades. However, formalin is a harmful carcinogen6 which nicks and crosslinks DNA, RNA, and proteins, negatively impacting many assays. Thus, a number of alternative fixatives have been developed and applied to histological and molecular diagnostics with the aim of replacing NBF.7–14
Formalin fixation is achieved by crosslinking of proteins and nucleic acids via forming methylene bridges between reactive groups,15,16 whereas alcohol-based fixatives produce coagulated proteinaceous substances through the removal of water from proteins.17 In addition, excessive shrinkage and microscopic distortion have been reported in long-term alcohol-based fixative preservation.18 To overcome the disadvantages of alcohol-based fixatives, previous studies have proposed additives to the fixative mixture and demonstrated improved quality in histological and molecular analyses.11,12,19,20 Recently, we described a buffered ethanol (BE70) fixative, which improves biomolecular preservation and has a histomorphological similarity to NBF fixative.6 The development of BE70 came about during studies on the contribution of buffers and methanol to NBF. We pursued the development of BE70 to address the shortcomings identified with other fixatives, most notably, high acid content, flammability, tissue hardening, complex application, and cost.
It is well known that the solutions used and fixation times impact on biomolecule quality, despite adequate histomorphology. Under- and overfixation are known to result in specimens that perform poorly on immunohistochemical assays21,22 and have poor RNA quality.3 Many studies have previously reported inconsistent results on the length of overfixation,23–25 while minimum fixation time is poorly understood.26,27 Previous studies by this group28 did not previously identify fixation duration as a primary factor in antigen degradation; however, the authors were not able to prevent degradation, such that its contribution may be secondary. Thus, the optimization and/or examination of the fixation period is a fundamental factor in creating new fixatives for use in research and clinical environments.
In the present study, we expanded our previous analysis of the effects of fixation time comparing the most common aldehyde-based crosslinking fixative, NBF,3 with two coagulative fixatives, based on ethanol: BE70 and 70% ethanol. This provides a baseline comparison of crosslinking and coagulative fixatives. We evaluated fixation times from 4 hr to 6 months with respect to histomorphology, immunohistochemistry, Western blotting and protein array, RNA extraction yield and integrity, and DNA quantity and quality.
Materials and Methods
Specimens and Fixation
We acquired 8-week-old female Balb/c mice from the Small Animals Section, Veterinary Resources Branch, National Institutes of Health (NIH). They were housed and euthanized in accordance with NIH guidelines for the care and use of laboratory animals. The tissues were collected within 5 min of euthanasia. The livers, kidneys, and spleens were each cut into three equal pieces and were fixed in one of the three different fixatives (70% ethanol, BE70, or 10% NBF) for varying fixation times (4 hr, 12 hr, 1 day, 1 week, 1 month, 3 months, and 6 months). Mouse kidneys and spleens were fixed as whole organs. Liver was dissected to a 2- to 3-mm thickness before fixation. In addition, we used fixative volume at least 25–30 times greater than the tissue volume. After fixation, the tissues were rinsed in 70% alcohol, processed overnight in a standard processing machine with a 30 min/station protocol3 (Leica ASP300; Leica Biosystems Inc., Buffalo Grove, IL), and embedded in paraffin as described previously.6 After paraffin embedding, the blocks were stored at room temperature.
Histochemical and Immunohistochemical Assessments
Four 1.5-mm-diameter tissue cores were obtained from differently fixed specimens of each tissue and were assembled into a tissue array in a single paraffin block using a manual tissue arrayer (Pathology Device, Westminster, MD). Hematoxylin and eosin (H&E) staining was performed according to standard protocol in the Leica Auto Stainer XL (Leica Biosystems Inc.).
Immunohistochemistry was performed on 5-µm-thick tissue microarray (TMA) sections as previously described.6 Briefly, TMA sections were deparaffinized and rehydrated through xylenes and decreasing alcohol gradient. Slides were incubated for 10 min in 3% H2O2 to block for endogenous peroxidase. The slides were incubated at room temperature with antibodies against aquaporin 1 (AQP1), Histone H3, and Ki-67. The detailed immunohistochemistry conditions are described in Table 1. The antigen–antibody reaction was detected with DAKO Envision+ peroxidase kit and visualized with 3,3′-diaminobenzidine (Dako, Carpinteria, CA). Then, the slides were lightly counterstained with hematoxylin, dehydrated in serial ethanols, cleared in xylene, and coverslipped. Negative controls (IgG and omission of primary antibody) were concurrently performed. Positive controls included human colon, spleen, and kidney for Histone H3, Ki-67 and AQP1, respectively.
Table 1.
Antibodies Used for Immunohistochemistry.
| Antibody | Vendor | Clonality | Cat. No. | Incubation | Dilution | Antigen Retrieval |
|---|---|---|---|---|---|---|
| AQP1 | Santa Cruz Biotechnology (Dallas, TX) | Poly rabbit | Sc-20810 | 30 min at RT | 1:250 | Not applied |
| Histone H3 | Abcam (Cambridge, MA) | Poly rabbit | ab70550 | 30 min at RT | 1:2000 | 20 min, pressure cooker, pH 6 |
| Ki-67 | Sigma-Aldrich (St. Louis, MO) | Mono rabbit (SP6) | 275R | 30 min at RT | Ready to use | 20 min, pressure cooker, pH 6 |
Abbreviations: AQP1, aquaporin 1; RT, room temperature.
The stained sections were digitized utilizing the NanoZoomer 2.0 HT (Hamamatsu Photonics K.K., Hamamatsu, Japan) at 40× objective magnification (0.23 µm/pixels resolution). The quantification of digital pathology was accomplished using Visiopharm image analysis software (Visiopharm, Hørsholm, Denmark). An algorithm for quantifying cytoplasmic stain intensity was developed and utilized for quantitative measures. The staining intensity of AQP1 and Histone H3 was categorized as 0 (none), 1+ (weak), 2+ (moderate), and 3+ (strong), and the final score was calculated by multiplying the intensity and percentage of staining (possible range, 0–300). The Ki-67 expressional signal was evaluated by the percentage of labeled cells. The relative AQP1 and Ki-67 expressional signals for each entity were normalized to BE70-fixed tissue at 1 day of fixation (1.00). We also interpreted AQP1 manually in a semiquantitative manner, using the intensity plus proportion modified from the Allred scoring system29 in breast cancer. The intensity was graded as negative, 0; weak, 1; intermediate, 2; or strong, 3. The proportion was categorized as 0, no positive cells; 1, 0% to <10% positive cells; 2, 10% to less than 33% positive cells; 3, 33% to less than 67%; and 4, 67%–100%.
Protein Extraction and Western Blotting
Protein extraction from differently fixed and paraffin embedded tissues was performed as described previously.6,30 Protein extraction yield was determined using a BCA Protein Assay kit (Pierce Biotechnology, Rockford, IL).
For Western blotting, 20-µg protein/lane was resolved by 4%–12% NuPAGE Novex Bis-Tris polyacrylamide gel electrophoresis, and electroblotted onto a nitrocellulose membrane using the iBlot dry blotting system (Invitrogen, Carlsbad, CA). The membranes were blocked with 5% nonfat dry milk in TBST (50-mM Tris, pH 7.5, 150-mM NaCl, and 0.05% Tween-20) for 1 hr, washed, and incubated overnight at 4°C in TBST with rabbit anti-AKT polyclonal antibody (cat no. 9272; dilution 1:1000; Cell signaling, Denver, MA) and mouse anti-GAPDH monoclonal antibody (clone no. 6C5; dilution 1:3000; Calbiochem, Gibbstown, NJ). An immunoreactive band was developed using the SuperSignal Chemiluminescence Kit (Pierce Biotechnology), and the signals were detected using Kodak Biomax MR X-ray film (Kodak, Rochester, NY). The intensity of the Western blot signals was quantified using ImageQuant version 5.2 (Molecular Dynamics, Sunnyvale, CA).
To further evaluate the protein quality of the fixed tissues, we performed well-based reverse-phase protein array (RPPA), as described previously.28,30 Protein lysates (2 µg/well) of the fixative tissues were immobilized on MSD Multi-Spot plates (MA2400 96 HB Plate; Meso Scale Diagnostics, Gaithersburg, MD), the plate was allowed to dry at room temperature for 90 min, and the plates were subsequently further incubated for 30 min at 37°C. The antigen-coated plates were blocked with 3% nonfat dry milk in PBST (3.2-mM Na2HPO4, 0.5-mM KH2PO4, 1.3-mM KCl, 135-mM NaCl, 0.05% Tween-20, and pH 7.4) for 1 hr, washed, and incubated overnight at 4C in PBST with rabbit anti-AKT polyclonal antibody (cat no. 9272; dilution 1:500; Cell signaling) and mouse anti-GAPDH monoclonal antibody (clone no. 6C5; dilution 1:2000; Calbiochem). After being washed with PBST, the plates were incubated for 90 min with goat anti-rabbit or anti-mouse SULFO-TAG antibodies at a dilution 1:2000 (0.5 µg/mL, Meso Scale Diagnostics). The electrochemiluminescence signals were detected using MSD-T read buffer on the MSD Sector Imager 2400 (Meso Scale Diagnostics). BSA-coated wells were included on each plate as a control for nonspecific binding effects.
RNA Quantity and Quality
Total RNA was extracted from two 1-mm tissue cores as described previously.6,31 RNA extraction yield was assessed using the NanoDrop ND-1000 UV spectrophotometer (NanoDrop Technologies, Wilmington, DE). In addition, RNA quality was evaluated using the Agilent 2100 bioanalyzer (Agilent Technologies, Palo Alto, CA) with the RNA 6000 LabChip kit (Agilent Technologies). We also measured RNA integrity with the paraffin-embedded RNA metric (PERM) number, which is a metric for FFPE (formalin-fixed paraffin-embedded)-derived RNA quality.32,33
The extracted RNA was treated with 2-μl TURBO DNase buffer, 4 units of TURBO DNase (Invitrogen), and 40 units of RNase inhibitor (Promega, Madison, WI) in a 100-μl reaction volume to remove possible contaminating genomic DNA. The mixture was incubated at 37C for 30 min and was purified by phenol/chloroform extraction.
Approximately 4-μg DNase-treated RNA was transcribed into complementary DNA (cDNA) by reverse transcriptase using the SuperScript-II RT kit (Invitrogen) according to the manufacturer’s recommended protocol. All samples were reverse transcribed under the same conditions. The synthesized cDNA was stored at −20°C and used in quantitative real-time PCR reactions as a template. We performed quantitative real-time PCR using the TaqMan Gene Expression reagent (Applied Biosystems, Foster City, CA). Briefly, quantitative real-time PCR was performed with 1- and 2-μg cDNA for housekeeping genes (beta-actin, ACTB) and insulin-like growth factor 1 (IGF1), respectively. We examined the cycle threshold (Ct) values for ACTB and IGF1 genes to assess RNA integrity in triplicate.
DNA Quantity and Quality
DNA extraction from differently fixed and paraffin-embedded tissues was performed as described previously.6,33 Briefly, DNA was extracted from two 1-mm tissue cores using the QIAamp DNA FFPE Tissue kit (Qiagen, Valencia, CA) according to the manufacturer’s instructions. DNA extraction yield was assessed using the NanoDrop ND-1000 UV spectrophotometer (NanoDrop Technologies), and DNA quality was evaluated by amplified DNA amounts using a Bioscore Screening and Amplification kit (Enzo Life Sciences, Farmingdale, NY), as previously reported.33,34
Statistical Analysis
All the data were processed and analyzed using Microsoft Excel version 2016 (Redmond, WA) and SPSS version 21.0 (SPSS Inc., Chicago, IL). Statistical differences were tested using ANOVA and the Student’s t-test. The Mann–Whitney U-test was used to evaluate RNA integrity for each fixative condition. Values of p<0.05 were considered statistically significant.
Results
Histomorphologies in Different Fixative Conditions
As was found in our previous study,6 the histomorphological features of BE70 fixative–fixed paraffin-embedded tissue with H&E staining are similar to those of 70% ethanol-fixed tissue but slightly different from NBF-fixed tissue. We performed H&E staining using both BE70- and NBF-fixed tissue specimens and compared their histological features according to fixation time (Fig. 1). A notable change in NBF was that the intensity of the H&E staining began to weaken at 1 week of fixation and gradually decreased to 6 months of fixation, showing a characteristic loss of eosinophilic staining in the cytoplasm. In addition, the contours of the cellular and nuclear membranes became blurred and the chromatin became hazy. Although the histomorphology of the liver is not identical to that of NBF at the original reference time point of 24 hr fixation,5 the staining intensity of hematoxylin or eosin of BE70-fixed tissue was not altered by fixation time.
Figure 1.
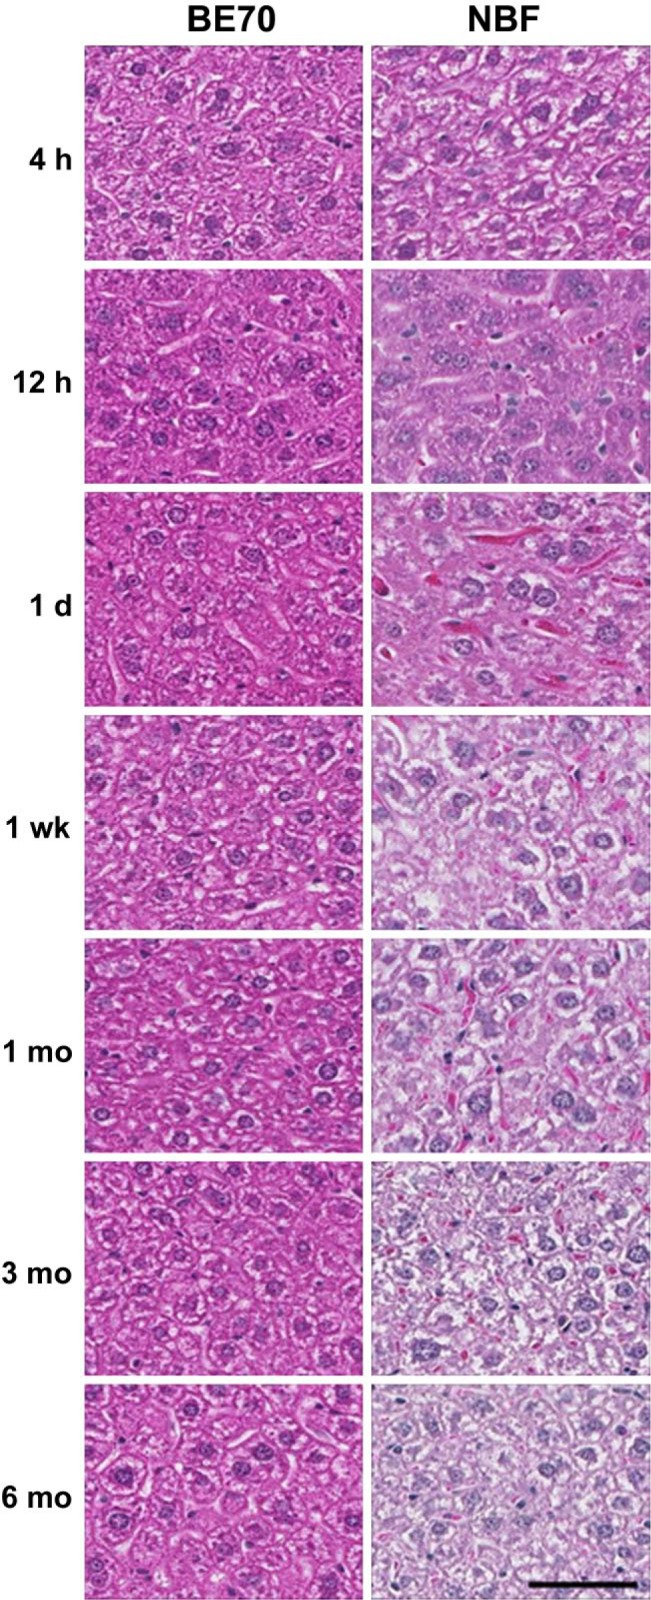
Representative histology of hematoxylin and eosin (H&E) staining according to the fixation time in both BE70 and NBF fixatives. Mouse liver tissue sections were stained with H&E at the same time. Scale bar, 50 µm. Abbreviations: BE70, buffered ethanol; NBF, neutral buffered formalin.
Evaluation of Antigenicity in Different Fixative Conditions
Next, we assessed the quality of immunohistochemistry in both BE70- and NBF-fixed paraffin-embedded tissue. In this study, we performed immunohistochemistry for AQP1, Histone H3, and Ki-67 on BE70-fixed and NBF-fixed paraffin-embedded sections of normal mouse kidney and spleen tissue, respectively. Representative immunohistochemical stains of AQP1, Histone H3, and Ki-67 are shown in Figs. 2A and 3A and Supplementary Fig. S1A, respectively. AQP1 staining was observed in the proximal tubule and the glomeruli of the kidney. The immunostaining condition was optimized for 24 hr of fixation based on our prior studies,6 where BE70-fixed specimens showed stronger immunoreactivity than NBF-fixed specimens. In detail, the histoscore of 1-day-old BE70-fixed tissue (mean: 266.25 ± 20.516) was significantly higher than that of 1-day-old NBF-fixed tissues (mean: 169.75 ± 40.086, p=0.009; Fig. 2B). The AQP1 immunostaining pattern is relatively well maintained from 4 hr to 3 months in BE70 fixative, except for a modest decrease in intensity at 6 months (mean: 181.75 ± 20.097, p=0.048). Meanwhile, the intensity and proportion of the immunoreactivity of AQP1 decreased according to fixation time in NBF-fixed tissue section. In addition, the results showed a similar pattern in manual scoring. BE70 was scored constantly as 7 from 4 hr to 3 months, whereas the NBF fixative gradually decreased as time passed, scoring 7 at 4 hr, 6 at 12 hr and 1 day, 5 at 1 week, and 3 at 1 month, and finally at 6 months, the fixation was scored 0.
Figure 2.
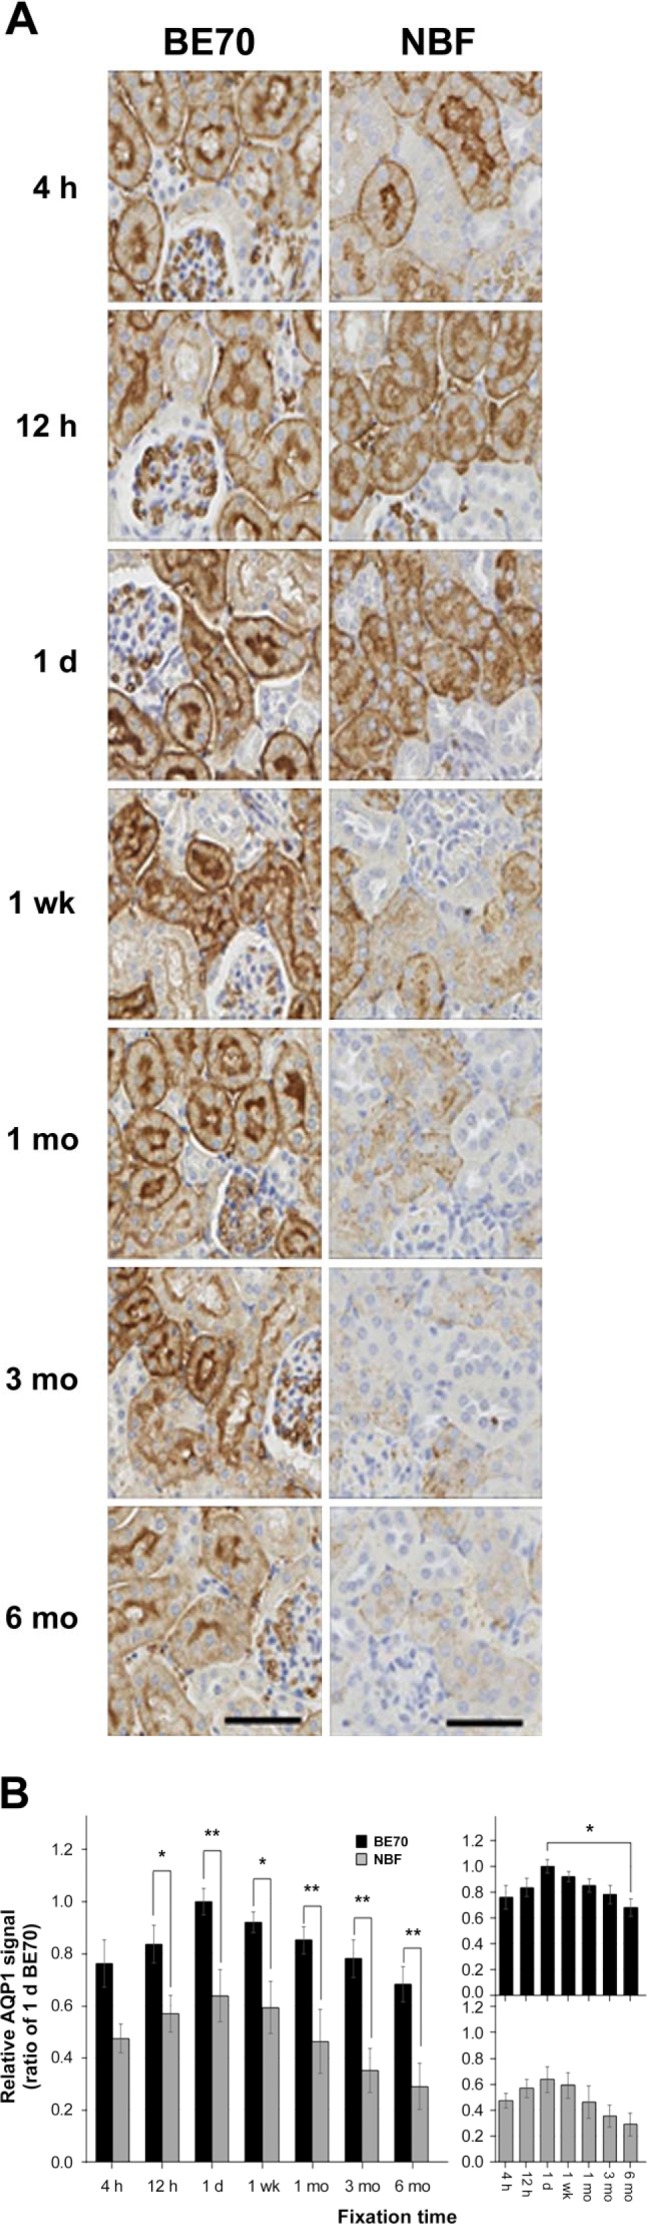
Immunohistochemical assessment for the fixatives BE70 and NBF according to the fixation time. Tissue sections were reacted with rabbit polyclonal anti-AQP1 antibodies. (A) Representative images of IHC staining of AQP1 expression in mouse kidney tissue. Scale bar, 50 µm. (B) IHC images were analyzed using digital image analyses. The IHC histoscore was generated by multiplying the mean intensity and percentage scores (overall score range, 0–300). The right panel shows the relative AQP1 expressional signal according to the fixation time in the BE70 or NBF fixatives. The bar graph shows the relative averages of the histoscores. The relative AQP1 expressional signal of each entity was normalized to 1 day BE70-fixed tissue (1.00). Abbreviations: BE70, buffered ethanol; NBF, neutral buffered formalin; AQP1, aquaporin 1. *p<0.05, **p<0.01, ***p<0.001.
Figure 3.
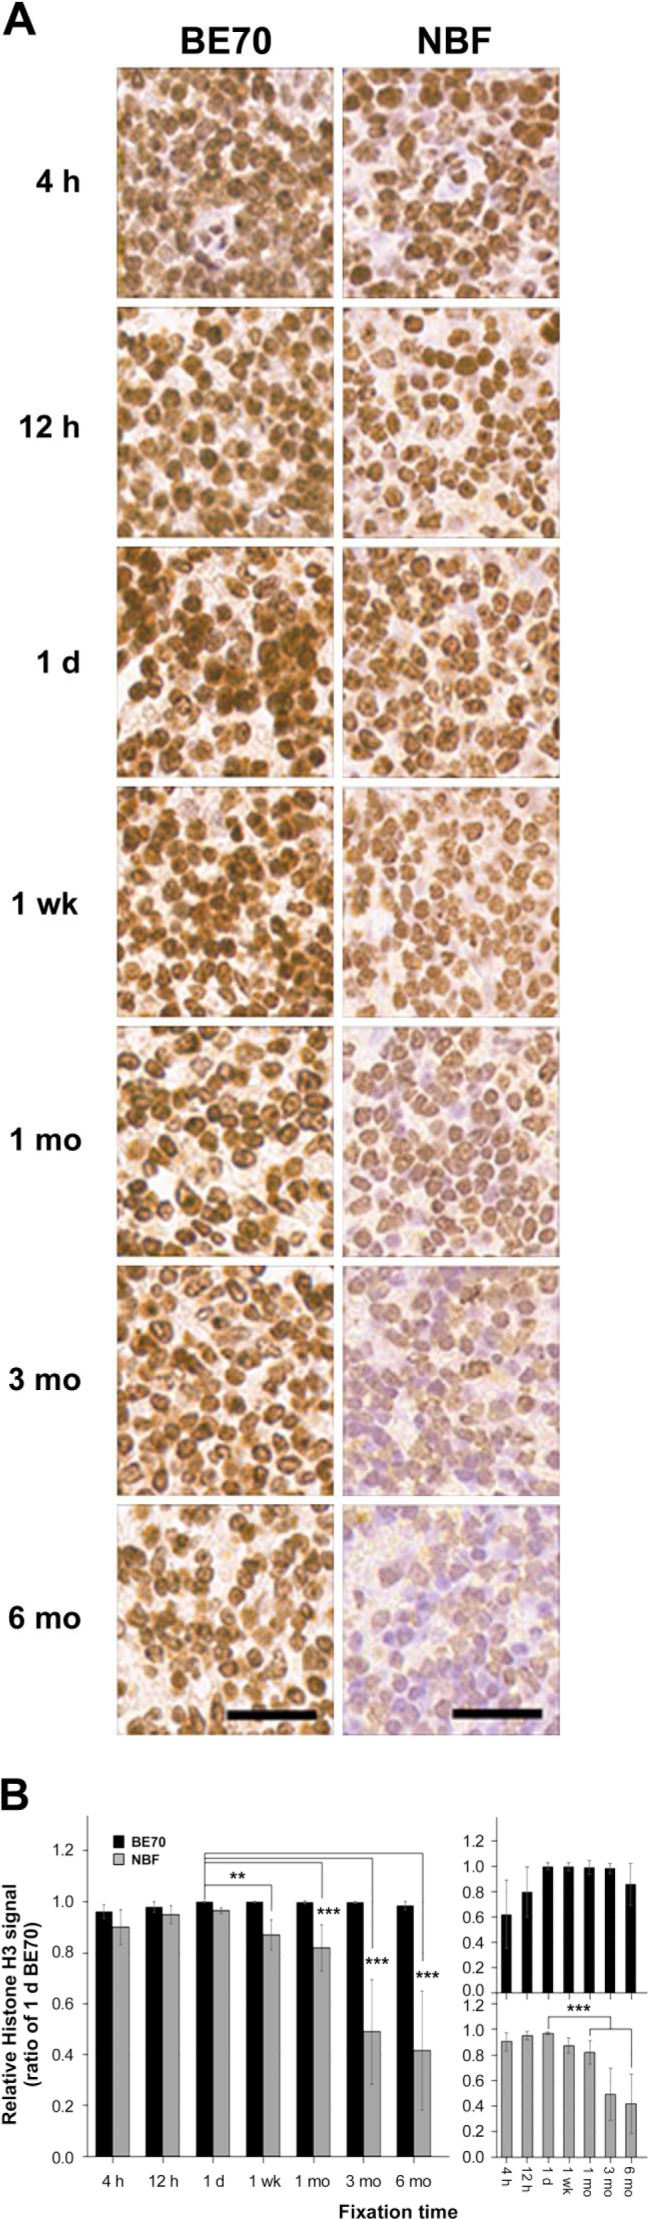
Immunohistochemical assessment for the fixatives BE70 and NBF according to the fixation time. Tissue sections were reacted with rabbit polyclonal Histone H3 antibodies. (A) Representative images of IHC staining of Histone H3 expression in mouse spleen tissue. Scale bar, 50 µm. (B) IHC images were analyzed using digital image analyses. The right panel shows the relative Histone H3 expressional signal according to the fixation time in the BE70 or NBF fixatives. The bar graph shows the relative averages of the histoscores. The relative Histone H3 expressional signal of each entity was normalized to 1 day BE70-fixed tissue (1.00). Abbreviations: BE70, buffered ethanol; NBF, neutral buffered formalin; AQP1, aquaporin 1. *p<0.05, **p<0.01, ***p<0.001.
The Histone H3 immunostaining pattern in tissue is relatively well preserved from 4 hr (mean: 287.73 ± 8.010) to 6 months (mean: 294.78 ± 1.246) in BE70 fixative (Fig. 3B), whereas the histoscores of 1-day-old NBF-fixed tissue (mean: 289.12 ± 3.203) were significantly higher than those of 1-month-old (mean: 245.10 ± 26.982, p<0.001), 3-month-old (mean: 167.51 ± 17.562, p<0.001), and 6-month-old (mean: 142.34 ± 51.793, p<0.001) NBF-fixed tissues (Fig. 3A). In addition, the immunoreactivity of Ki-67 was detected in the proliferating lymphocytes of spleen (Supplementary Fig. S1A). The pattern of immunostaining for Ki-67 according to fixatives and fixation times was similar to those found in AQP1 (Supplementary Fig. S1). These data suggest that the antigenicity of AQP1, Histone H3, and Ki-67 antigens is better preserved for prolonged fixation times in BE70 fixative, in contrast to the degradation observed with NBF fixation.
Protein Quantity and Quality After Long-Term Storage Under Different Fixative Conditions
Mouse liver tissues were fixed in 70% ethanol, BE70, or NBF for various time periods. After paraffin embedding, we extracted protein from the mouse liver tissue cores fixed in the three different fixatives to determine the impact of fixative and storage period on quantity. Protein extraction yields from 70% ethanol- and BE70-fixed tissues were in similar amounts between 4 hr (70% ethanol vs. BE70; mean: 4.41 ± 0.582 vs. 4.20 ± 0.346 μg/mm3) and 3 months (70% ethanol vs. BE70; mean: 4.47 ± 0.257 vs. 3.93 ± 0.539 μg/mm3), while there was a modest decrease in tissue stored for 6 months in both 70% ethanol (mean: 2.80 ± 0.192 μg/mm3) and BE70 (mean: 2.60 ± 0.589 μg/mm3). On the other hand, the protein quantity of 1-day NBF-fixed tissue was the greatest (mean: 4.97 ± 0.245 μg/mm3) among the tested fixation times; there was also a significant decrease in 3- (mean: 1.92 ± 0.136 μg/mm3) and 6-month (mean: 1.24 ± 0.112 μg/mm3) storage (Fig. 4A).
Figure 4.

Protein quantity and quality according to the fixation time in 70% ethanol, BE70, and NBF. (A) Protein extraction yield from each condition. The protein was extracted from mouse liver in 70% ethanol-, BE70-, or NBF-fixed and paraffin-embedded tissue cores. The bar graph shows the relative means of protein extraction yields. (B) Relative AKT expression signal under each condition. The quality of proteins in different fixatives according to fixation time was assessed by Western blotting. (C) Relative GAPDH expression signal according to the fixation time in 70% ethanol, BE70, and NBF. Quantitative analyses were performed using ImageQuant version 5.2. Protein quantity and quality according to the fixation time in a single fixative are presented as miniature graphs in the right panel. The relative protein extraction yield and expression signal of each entity were normalized to 1 day BE70-fixed tissue (1.00). Data are presented as the mean ± standard deviation (SD) from three independent experiments. Abbreviations: BE70, buffered ethanol; NBF, neutral buffered formalin; AKT, serine/threonine protein kinase; GAPDH, glyceraldehyde 3-phosphate dehydrogenase. *p<0.05, **p<0.01, ***p<0.001.
Next, we assessed the integrity of the protein extracted from tissue cores stored from 4 hr to 6 months in 70% ethanol, BE70, and NBF fixatives using Western blot assay. AKT and GAPDH expression were detectable at all storage times in 70% ethanol and BE70, whereas both signals disappeared from 1 week to 6 months for tissues stored in NBF (Fig. 4B and C). AKT expression had the highest signal at 1 day storage in all three fixatives. As shown in Fig. 4B, the AKT signal was stronger in BE70 (1.64-fold increase, p<0.01) and 70% ethanol (0.9-fold increase, p<0.01) than in NBF (Fig. 4B). In addition, we found that GAPDH was better preserved in 70% ethanol- and BE70-fixed tissue than in NBF-fixed tissue. In detail, the intensity of the GAPDH band decreased according to fixation time in all three fixatives, while the GAPDH signal in the NBF-fixed tissue was only detected until 1 day of fixation, among tested times (Fig. 4C).
Because the results of the Western blot data were not in agreement with the immunohistochemical assays, with reference to degradation, we further evaluated the immunoreactivity of the proteins using a well-based RPPA. As described in previous studies,3,30 a well-based RPPA is a non-denatured protein array and a quantitative and sensitive assay for protein lysates extracted from FFPE tissues. The AKT signals of 70% ethanol- and NBF- fixed tissues were little less at 6 months of storage than they were at 1 day (70% ethanol and BE70; 36.93% and 48.41% decreases, respectively; Fig. 5A). Similarly, BE70-fixed tissues showed little decrease in GAPDH signal at 6 months of fixation (39.12% less than at 1 day, p<0.001). Surprisingly, the GAPDH signal in the 70% ethanol-fixed tissue was well-preserved until 6 months of fixation (Fig. 5B). However, NBF-fixed tissues showed considerable decreases in both AKT and GAPDH signals after 1 week of fixation (all p<0.001; Fig. 5A and B).
Figure 5.

Protein immunoreactivity according to the fixation time in 70% ethanol, BE70, and NBF. The protein signals were measured by well-based reverse-phase protein array. The protein was extracted from mouse liver in 70% ethanol-, BE70-, or NBF-fixed and paraffin-embedded tissue cores. (A) Relative AKT signal. (B) Relative GAPDH signal. (C) Relative AKT/GAPDH signal. Relative expression signals of AKT, GAPDH, and AKT/GAPDH according to the fixation time in a single fixative are presented as miniature graphs in the right panel. The relative protein expression signal of each entity was normalized to BE70-fixed tissue at 1 day of fixation (1.00). Data are depicted as the mean ± SD from three independent experiments. Abbreviations: BE70, buffered ethanol; NBF, neutral buffered formalin; AKT, serine/threonine protein kinase; GAPDH, glyceraldehyde 3-phosphate dehydrogenase. *p<0.05, **p<0.01, ***p<0.001.
Next, we explored quantification methods such as the traditional Western blot. The AKT signal was normalized to GAPDH expression, and the relative AKT/GAPDH expressional signal of each entity was normalized to BE70-fixed tissue at 1 day (1.00). The AKT/GAPDH signal had minimal changes from 4 hr to 6 months of fixation, whereas this ratio signal significantly increased after 1 month of fixation (all p<0.001) in NBF (Fig. 5C).
RNA Quantity and Quality After Long-Term Storage Under Different Fixative Conditions
We assessed the quantity and quality of the RNA extracted from fixed tissues in 70% ethanol, BE70, or NBF fixatives according to fixation times. RNA was successfully extracted from all fixed mouse kidney tissues. The RNA extraction yield from BE70-fixed and 70% ethanol-fixed tissues did not undergo substantial changes until 6 months of fixation. The RNA recovery yield from BE70-fixed tissues (mean: 6.27 ± 0.331 μg/mm3) was higher than both 70% ethanol (mean: 5.07 ± 0.513 μg/mm3) and NBF (mean: 4.39 ± 0.210 μg/mm3) (Fig. 6A). The A260/A280 ratio of BE70 (mean: 1.83) was similar to that of 70% ethanol (mean: 1.89) from 4 hr to 6 months. Meanwhile, there was a little decrease in NBF-overfixed tissues (from 3 to 6 months, mean: 1.69) in RNA purity as measured by spectrophotometer (data not shown). We also calculated the PERM number, a metric for FFPE-derived RNA quality.32,33 As shown in Fig. 6B, RNA extracted from BE70-fixed tissue at 1 day (mean: 114.96) showed the greatest PERM value among the tested fixation conditions. In detail, the BE70 fixative had greater values of PERM than 70% ethanol until 1 week of fixation, but there is no significant difference between BE70 and the 70% over-fixed conditions (from 1 to 6 months). Furthermore, the PERM number of BE70 was significantly less in long-term-stored fixations (from 1 to 6 months; Fig. 6B, right panel). As expected, the NBF had the lowest PERM number (mean: 24.51), with a significant decrease in long-term-stored NBF (both 3 and 6 months; Fig. 6B).
Figure 6.

RNA quantity and quality according to the fixation time in 70% ethanol, BE70, and NBF. (A) RNA extraction yield under each condition. The RNA was extracted from mouse kidney in 70% ethanol-, BE70-, or NBF-fixed and paraffin-embedded tissue cores. (B) Quality of each RNA entity, which is presented as the PERM. (C) Integrity of RNA samples derived from each fixative condition. The mean cycle threshold (Ct) value of the ACTB was determined in kidney tissue under different fixative conditions. Gene expression levels are shown as box plots. Relative RNA extraction yield, PERM number, and Ct values according to fixation time in a single fixative are presented as miniature graphs in the right panel. Data are depicted as the mean ± SD from three independent experiments. Abbreviations: BE70, buffered ethanol; NBF, neutral buffered formalin; PERM, paraffin-embedded RNA metric; ACTB, beta-actin; Ct, cycle threshold. *p<0.05, **p<0.01, ***p<0.001.
Furthermore, we performed quantitative real-time RT-PCR using primers detecting ACTB and IGF1 transcripts to evaluate RNA integrity. The endogenous control ACTB generally had lower Ct values (Fig. 6C and Supplementary Fig. S2). The ACTB showed lower Ct values in BE70- and 70% ethanol-fixed tissue samples than in the NBF-fixed tissue specimens (Fig. 6C). The Ct value of ACTB in BE70 was lowest for 1-day storage (mean: 24.07) among the tested fixation periods, with little increases in Ct values for long-term storage conditions (from 1 to 6 months). In addition, the results for 70% ethanol were similar to those of BE70. The Ct values for ACTB were significantly greater in samples generated from long-term-stored NBF (Fig. 6C). The Ct values for IGF1 showed a similar pattern to that of ACTB (Supplementary Fig. S2). These data suggest that RNA integrity was more protectively retained in BE70 fixative than in NBF fixative.
DNA Quantity and Quality After Long-Term Storage Under Different Fixative Conditions
DNA extraction yield was similar in all three tested fixatives (70% ethanol, BE70, and NBF; mean: 2.40 ± 0.274, 2.80 ± 0.326, and 2.88 ± 0.291 μg/mm3, respectively), regardless of fixation periods (Fig. 7A). In addition, the quality of the isolated DNA was determined using values indicating co-purification of protein (A260/A280) with a spectrophotometer (data not shown). The ratio of BE70-fixed tissue (mean: 1.841) was similar to that of 70% ethanol (mean: 1.849) and NBF (mean: 1.801). Then, we further evaluated DNA quality using a Bioscore Screening and Amplification Kit.33,34 DNA extracted from 70% ethanol- and BE70-fixed mouse kidney tissues was successfully amplified and was revealed to be high-quality DNA for nucleic acid analysis. As expected, DNA was as well-preserved within 70% ethanol until 6 months of fixation (mean: 10.63 ± 0.551 μg) as it was at 1 day of fixation (mean: 11.99 ± 0.305 μg), whereas there was little diminution of amplified DNA amount at 1 month (mean: 9.76 ± 0.505 μg, p<0.05), 3 months (mean: 8.57 ± 0.251 μg, p<0.05), and 6 months (mean: 6.05 ± 0.136 μg, p<0.01) in the BE70-fixed tissue compared with its level at 1 day of fixation (mean: 12.12 ± 0.614 μg). However, the DNA prepared from NBF-fixed tissues at 1 day of fixation (mean: 4.98 ± 0.135 μg) was of intermediate quality for the microarray application (Fig. 7B). In addition, the DNA amplification of NBF-fixed tissues rapidly dropped at 1 month (mean: 1.47 ± 0.110 μg), 3 months (mean: 0.89 ± 0.056 μg), and 6 months (mean: 0.69 ± 0.017 μg) (Fig. 7B). These data suggest that DNA within the BE-70 fixative is well-preserved, as with 70% ethanol, while DNA within NBF rapidly fragmented.
Figure 7.

DNA quantity and quality according to the fixation time in 70% ethanol, BE70, and NBF. (A) Quantity of RNA extracted under each condition. The DNA was extracted from mouse kidney in 70% ethanol-, BE70-, or NBF-fixed and paraffin-embedded tissue cores. The relative DNA extraction yield of each entity was normalized to BE70-fixed tissue at 1 day of extraction (1.00). (B) Amplification of DNA derived from each condition. DNA quality was assessed using the Bioscore Screening and Amplification Kit. The amount of DNA amplification according to fixation time in a single fixative is presented as miniature graphs in the right panel. Data are the mean ± SD from three independent experiments. Abbreviations: BE70, buffered ethanol; NBF, neutral buffered formalin. *p<0.05, **p<0.01, ***p<0.001.
Discussion
In this study, we have evaluated fixation time, comparing crosslinking and coagulative fixatives with the comparators of NBF to 70% ethanol and our recently described fixative BE70.6 To the best of our knowledge, the present study is the first comprehensive assessment of fixation time, analyzing histology, protein, and RNA and DNA quality. The origin of this study comes from an inquiry concerning fixation time made during review of the manuscript describing BE70. We had previously published data on fixation time across a limited time frame in NBF,3 but only evaluated RNA quality. The results of our present study confirm previous findings: RNA is substantially more sensitive than protein, which is more sensitive than DNA as a preanalytic variable, and both under- and overfixation can negatively impact the quality of a bioanalyte. We also revealed a number of previously unappreciated findings: There are substantial differences between coagulative and crosslinking fixatives with reference to fixation time, different assays for the detection of proteins in paraffin-embedded tissues have different characteristics, and a normalization approach using a housekeeping gene or an internal control protein in a quantification mode may be misleading if the tissues being examined have not been uniformly fixed and/or processed.
With regard to the models of crosslinking fixatives compared with coagulative fixatives, not only do coagulative fixatives fix tissue faster, tissue can dwell in the fixative longer. There have been good data suggesting that tissue is stable with reference to bioanalytes in ethanol-based fixatives for prolonged periods of time.7 However, the data that coagulative fixatives work in less than 24 hr is surprising. From a mechanistic perspective, this is anticipated by Fox,16 who describes an alcohol wave, followed by a clock reaction of crosslinking. The availability of shorter fixation times has substantial implications, as they allow a change in standard operating protocol in a clinical setting. The current clinical recommendation35 for NBF is 24 hr, plus or minus 8 hr. Many institutions have attempted to shorten NBF fixation times to enable next-day results. Although shorter fixation times have resulted in frequently adequate histopathology and allowed the detection of hormone receptors in breast cancer,36 immunohistochemical results have been negatively impacted when they are attempted with NBF.4,23 Prolonged fixation presents similar challenges to NBF.
Our present study findings, based on statistical differences in the analytes analyzed, suggest a fixation window of 4 hr to 3 months for BE70 and 12 hr to 1 week for NBF. As our current data demonstrate, there is some individual analyte specificity, as measured by immunohistochemistry, to these times. Defining a window of fixation times is challenging. The use of different antigen retrieval protocols is suggested to overcome these issues.21,22,35 Thus, the establishment of an optimal fixation time for BE70 needs to be further studied, using an extensive range of antibodies to guarantee an accurate evaluation of prognostic and predictive biomarkers through immunohistochemistry.
The results of our evaluation of protein quality by immunohistochemistry and the Western blot were surprising. The results of immunohistochemistry suggest a wide window for fixation (Figs. 2 and 3), whereas the Western blot data (Fig. 4A and B), and more specifically measurements based on ratios, suggest a substantially narrower window. Given this discrepancy, we used a protein array-based approach to investigate further (Fig. 5). The protein array data generally mirrored those for immunohistochemistry, as we hypothesized. We speculated also that the difference between the assays is based on the fact that immunohistochemistry and protein-array-based assays only require the epitope to be intact and that the integrity of the entirety of the entire protein is not required. By contrast, a successful Western blot assay is dependent on the presence of a full-length peptide. Damaged and degraded peptides will not migrate at the correct molecular weight. Although the epitope may be present, if the fragments are of diverse molecular weights, they will have an insufficient signal and be detected as smears by conventional detection methodologies. These findings suggest that the loss of antigenicity as detected by immunohistochemistry is the result of peptide degradation, rather than “masking” due to additional crosslinking. Attempts to normalize the results of the Western blot to match those of the immunohistochemistry or protein array suggested that degradation was logarithmic, which was not surprising, considering our prior studies of degradation of proteins in stored blocks.28 It was also tied to the molecular weight of the protein being detected. Clearly, the position of the epitope in the peptide may have some impact as well. Importantly, these data suggest proteins measured by Western blotting of FFPE tissue, and more specifically those which are normalized to a housekeeping gene, may give spurious results if the fixation time is not controlled or known.
In a prior study, we published concerning biomolecule degradation,28 we evaluated 12- versus 24-hr fixation times with NBF and compared them with tissue processing time of 4 versus 8 hr. In that study, the difference in fixation time was not noted to result in a difference in biomolecule stability as measured by AQP1 IHC. These results are confirmed by this study, and emphasize the interaction of fixation time and processing conditions in biomolecule stability.
Advanced molecular technologies, requiring high-quality nucleic acids, have offered insight into pathogenesis and prognostic/predictive factors in the context of personalized medicine. However, the recovery of nucleic acids from FFPE tissue remains challenging, with low recovery and poor quality of what is recovered. Alcohol-based fixatives may provide high quality and sufficient quantities of DNA, which are appropriate for whole-genome amplification or methylation assay.37 They also can be used for the expression profiling of microdissected areas,38 which need to have a well-preserved morphology and high quality of RNA. We similarly confirmed in our present analysis that the Ct values of ACTB (Fig. 6C) and IGF1 (Supplementary Fig. S2) were significantly lower in BE70 than in FFPE specimens. In the present study also, we recovered high yields and pure DNA from BE70 tissues (Fig. 7). Furthermore, the effects of BE70 fixation on nucleic acids preservation are relatively time-independent.
In summary, our current findings have demonstrated that coagulative and crosslinking fixatives have different windows of optimal fixation, and these windows depend on the bioanalyte. Coagulative fixatives offer a substantial benefit, providing a wider window for fixation time, and the potential for shorter optimal fixation times.
Supplementary Material
Footnotes
Competing Interests: The author(s) declared the following potential conflicts of interest with respect to the research, authorship, and/or publication of this article: The National Institutes of Health has filed a patent application (PCT/US2016/061642) for the fixative described herein. Joon-Yong Chung and Stephen M. Hewitt are listed as inventors on this patent application; however, the application is assigned to the US Department of Health and Human Services, as the work was performed under official duty (J-YC and SMH).
Author Contributions: J-YC and SMH conceived the study and devised the experimental design. J-YC, JSS, KY, JDS, and LC performed the experiments. J-YC, JSS, HC, AZR, and SMH performed data analyses for the experiments. J-YC and JSS drafted the manuscript. SMH revised the manuscript and figures, and added critical content to the discussion. All authors have read and approved the final manuscript.
Funding: The author(s) disclosed receipt of the following financial support for the research, authorship, and/or publication of this article: This research was supported by the Intramural Research Program of the National Institutes of Health, National Cancer Institute, Center for Cancer Research.
ORCID iD: J-Y Chung  https://orcid.org/0000-0001-5041-5982
SM Hewitt  https://orcid.org/0000-0001-8283-1788
Contributor Information
Joon-Yong Chung, Experimental Pathology Laboratory, Laboratory of Pathology, Center for Cancer Research, National Cancer Institute, National Institutes of Health, Bethesda, Maryland.
Joon Seon Song, Experimental Pathology Laboratory, Laboratory of Pathology, Center for Cancer Research, National Cancer Institute, National Institutes of Health, Bethesda, Maryland; Department of Pathology, Asan Medical Center, University of Ulsan College of Medicine, Seoul, Republic of Korea.
Kris Ylaya, Experimental Pathology Laboratory, Laboratory of Pathology, Center for Cancer Research, National Cancer Institute, National Institutes of Health, Bethesda, Maryland.
John D. Sears, Experimental Pathology Laboratory, Laboratory of Pathology, Center for Cancer Research, National Cancer Institute, National Institutes of Health, Bethesda, Maryland
Lauren Choi, Experimental Pathology Laboratory, Laboratory of Pathology, Center for Cancer Research, National Cancer Institute, National Institutes of Health, Bethesda, Maryland.
Hanbyoul Cho, Experimental Pathology Laboratory, Laboratory of Pathology, Center for Cancer Research, National Cancer Institute, National Institutes of Health, Bethesda, Maryland; Department of Obstetrics and Gynecology, Gangnam Severance Hospital, Yonsei University College of Medicine, Seoul, Republic of Korea.
Avi Z. Rosenberg, Department of Pathology, Johns Hopkins Medical Institutions, Baltimore, Maryland
Stephen M. Hewitt, Experimental Pathology Laboratory, Laboratory of Pathology, Center for Cancer Research, National Cancer Institute, National Institutes of Health, Bethesda, Maryland; Department of Pathology, Johns Hopkins Medical Institutions, Baltimore, Maryland.
Literature Cited
- 1. Hewitt SM, Lewis FA, Cao Y, Conrad RC, Cronin M, Danenberg KD, Goralski TJ, Langmore JP, Raja RG, Williams PM, Palma JF, Warrington JA. Tissue handling and specimen preparation in surgical pathology: issues concerning the recovery of nucleic acids from formalin-fixed, paraffin-embedded tissue. Arch Pathol Lab Med. 2008;132(12):1929–35. doi: 10.1043/1543-2165-132.12.1929. [DOI] [PubMed] [Google Scholar]
- 2. Hewitt SM, Badve SS, True LD. Impact of preanalytic factors on the design and application of integral biomarkers for directing patient therapy. Clin Cancer Res. 2012;18(6):1524–30. doi: 10.1158/1078-0432.CCR-11-2204. [DOI] [PMC free article] [PubMed] [Google Scholar]
- 3. Chung JY, Braunschweig T, Williams R, Guerrero N, Hoffmann KM, Kwon M, Song YK, Libutti SK, Hewitt SM. Factors in tissue handling and processing that impact RNA obtained from formalin-fixed, paraffin-embedded tissue. J Histochem Cytochem. 2008;56(11):1033–42. doi: 10.1369/jhc.2008.951863. [DOI] [PMC free article] [PubMed] [Google Scholar]
- 4. Werner M, Chott A, Fabiano A, Battifora H. Effect of formalin tissue fixation and processing on immunohistochemistry. Am J Surg Pathol. 2000;24(7):1016–9. [DOI] [PubMed] [Google Scholar]
- 5. Sapino A, Roepman P, Linn SC, Snel MH, Delahaye LJ, van den Akker J, Glas AM, Simon IM, Barth N, de Snoo FA, van ‘t Veer LJ, Molinaro L, Berns EM, Wesseling J, Riley LB, Anderson D, Nguyen B, Cox CE. MammaPrint molecular diagnostics on formalin-fixed, paraffin-embedded tissue. J Mol Diagn. 2014;16(2):190–7. doi: 10.1016/j.jmoldx.2013.10.008. [DOI] [PubMed] [Google Scholar]
- 6. Perry C, Chung JY, Ylaya K, Choi CH, Simpson A, Matsumoto KT, Smith WA, Hewitt SM. A buffered alcohol-based fixative for histomorphologic and molecular applications. J Histochem Cytochem. 2016;64(7):425–40. doi: 10.1369/0022155416649579. [DOI] [PMC free article] [PubMed] [Google Scholar]
- 7. Gillespie JW, Best CJ, Bichsel VE, Cole KA, Greenhut SF, Hewitt SM, Ahram M, Gathright YB, Merino MJ, Strausberg RL, Epstein JI, Hamilton SR, Gannot G, Baibakova GV, Calvert VS, Flaig MJ, Chuaqui RF, Herring JC, Pfeifer J, Petricoin EF, Linehan WM, Duray PH, Bova GS, Emmert-Buck MR. Evaluation of non-formalin tissue fixation for molecular profiling studies. Am J Pathol. 2002;160(2):449–57. doi: 10.1016/S0002-9440(10)64864-X. [DOI] [PMC free article] [PubMed] [Google Scholar]
- 8. Vincek V, Nassiri M, Nadji M, Morales AR. A tissue fixative that protects macromolecules (DNA, RNA, and protein) and histomorphology in clinical samples. Lab Invest. 2003;83(10):1427–35. [DOI] [PubMed] [Google Scholar]
- 9. Hostein I, Stock N, Soubeyran I, Marty M, De Mascarel I, Bui M, Geneste G, Petersen MC, Coindre JM, Macgrogan G. Nucleic acid quality preservation by an alcohol-based fixative: comparison with frozen tumors in a routine pathology setting. Diagn Mol Pathol. 2011;20(1):52–62. doi: 10.1097/PDM.0b013e3181e71ba5. [DOI] [PubMed] [Google Scholar]
- 10. Lykidis D, Van Noorden S, Armstrong A, Spencer-Dene B, Li J, Zhuang Z, Stamp GW. Novel zinc-based fixative for high quality DNA, RNA and protein analysis. Nucleic Acids Res. 2007;35(12):e85. doi: 10.1093/nar/gkm433. [DOI] [PMC free article] [PubMed] [Google Scholar]
- 11. Stanta G, Mucelli SP, Petrera F, Bonin S, Bussolati G. A novel fixative improves opportunities of nucleic acids and proteomic analysis in human archive’s tissues. Diagn Mol Pathol. 2006;15(2):115–23. [DOI] [PubMed] [Google Scholar]
- 12. Moelans CB, Oostenrijk D, Moons MJ, van Diest PJ. Formaldehyde substitute fixatives: effects on nucleic acid preservation. J Clin Pathol. 2011;64(11):960–7. doi: 10.1136/jclinpath-2011-200152. [DOI] [PubMed] [Google Scholar]
- 13. Pereira MA, Dias AR, Faraj SF, Cirqueira Cdos S, Tomitao MT, Nahas SC, Ribeiro U, Jr de, Mello ES. Carnoy’s solution is an adequate tissue fixative for routine surgical pathology, preserving cell morphology and molecular integrity. Histopathology. 2015;66(3):388–97. doi: 10.1111/his.12532. [DOI] [PubMed] [Google Scholar]
- 14. Belloni B, Lambertini C, Nuciforo P, Phillips J, Bruening E, Wong S, Dummer R. Will PAXgene substitute formalin? A morphological and molecular comparative study using a new fixative system. J Clin Pathol. 2013;66(2):124–35. doi: 10.1136/jclinpath-2012-200983. [DOI] [PubMed] [Google Scholar]
- 15. Helander KG. Kinetic studies of formaldehyde binding in tissue. Biotech Histochem. 1994;69(3):177–9. [DOI] [PubMed] [Google Scholar]
- 16. Fox CH, Johnson FB, Whiting J, Roller PP. Formaldehyde fixation. J Histochem Cytochem. 1985;33(8):845–53. [DOI] [PubMed] [Google Scholar]
- 17. Baker JR. Fixation in cytochemistry and electron-microscopy. J Histochem Cytochem. 1958;6(5):303–8. doi: 10.1177/6.5.303. [DOI] [PubMed] [Google Scholar]
- 18. Bostwick DG, al Annouf N, Choi C. Establishment of the formalin-free surgical pathology laboratory. Utility of an alcohol-based fixative. Arch Pathol Lab Med. 1994;118(3):298–302. [PubMed] [Google Scholar]
- 19. Dotti I, Bonin S, Basili G, Nardon E, Balani A, Siracusano S, Zanconati F, Palmisano S, De Manzini N, Stanta G. Effects of formalin, methacarn, and fineFIX fixatives on RNA preservation. Diagn Mol Pathol. 2010;19(2):112–22. doi: 10.1097/PDM.0b013e3181b520f8. [DOI] [PubMed] [Google Scholar]
- 20. Boissiere-Michot F, Denouel A, Boulle N, Guillaume C, Orsetti B, Lopez-Crapez E, Chateau MC, Bibeau F. The non-crosslinking fixative RCL2®-CS100 is compatible with both pathology diagnosis and molecular analyses. Pathol Oncol Res. 2013;19(1):41–53. doi: 10.1007/s12253-012-9556-2. [DOI] [PubMed] [Google Scholar]
- 21. Goldstein NS, Hewitt SM, Taylor CR, Yaziji H, Hicks DG. Members of Ad-Hoc Committee on Immunohistochemistry Standardization. Recommendations for improved standardization of immunohistochemistry. Appl Immunohistochem Mol Morphol. 2007;15(2):124–33. doi: 10.1097/PAI.0b013e31804c7283. [DOI] [PubMed] [Google Scholar]
- 22. Yaziji H, Taylor CR, Goldstein NS, Dabbs DJ, Hammond EH, Hewlett B, Floyd AD, Barry TS, Martin AW, Badve S, Baehner F, Cartun RW, Eisen RN, Swanson PE, Hewitt SM, Vyberg M, Hicks DG; Members of the Standardization Ad-Hoc Consensus Committee. Consensus recommendations on estrogen receptor testing in breast cancer by immunohistochemistry. Appl Immunohistochem Mol Morphol. 2008;16(6):513–20. doi: 10.1097/PAI.0b013e31818a9d3a. [DOI] [PubMed] [Google Scholar]
- 23. De Marzo AM, Fedor HH, Gage WR, Rubin MA. Inadequate formalin fixation decreases reliability of p27 immunohistochemical staining: probing optimal fixation time using high-density tissue microarrays. Hum Pathol. 2002;33(7):756–60. [DOI] [PubMed] [Google Scholar]
- 24. Shi SR, Liu C, Taylor CR. Standardization of immunohistochemistry for formalin-fixed, paraffin-embedded tissue sections based on the antigen-retrieval technique: from experiments to hypothesis. J Histochem Cytochem. 2007;55(2):105–9. doi: 10.1369/jhc.6P7080.2006. [DOI] [PubMed] [Google Scholar]
- 25. Wester K, Wahlund E, Sundstrom C, Ranefall P, Bengtsson E, Russell PJ, Ow KT, Malmström PU, Busch C. Paraffin section storage and immunohistochemistry. Effects of time, temperature, fixation, and retrieval protocol with emphasis on p53 protein and MIB1 antigen. Appl Immunohistochem Mol Morphol. 2000;8(1):61–70. [PubMed] [Google Scholar]
- 26. Dapson RW. Macromolecular changes caused by formalin fixation and antigen retrieval. Biotech Histochem. 2007;82(3):133–40. doi: 10.1080/10520290701567916. [DOI] [PubMed] [Google Scholar]
- 27. Kalkman S, Barentsz MW, Witkamp AJ, van der Wall E, Verkooijen HM, van Diest PJ. Brief fixation does not affect assessment of hormone receptor expression in invasive breast carcinoma biopsies: paving the road for same-day tissue diagnostics. Am J Surg Pathol. 2014;38(8):1071–8. doi: 10.1097/PAS.0000000000000207. [DOI] [PubMed] [Google Scholar]
- 28. Xie R, Chung JY, Ylaya K, Williams RL, Guerrero N, Nakatsuka N, Badie C, Hewitt SM. Factors influencing the degradation of archival formalin-fixed paraffin-embedded tissue sections. J Histochem Cytochem. 2011;59(4):356–65. doi: 10.1369/0022155411398488. [DOI] [PMC free article] [PubMed] [Google Scholar]
- 29. Allred DC, Harvey JM, Berardo M, Clark GM. Prognostic and predictive factors in breast cancer by immunohistochemical analysis. Mod Pathol. 1998;11(2):155–68. [PubMed] [Google Scholar]
- 30. Chung JY, Lee SJ, Kris Y, Braunschweig T, Traicoff JL, Hewitt SM. A well-based reverse-phase protein array applicable to extracts from formalin-fixed paraffin-embedded tissue. Proteomics Clin Appl. 2008;2(10–11):1539–47. doi: 10.1002/prca.200800005. [DOI] [PMC free article] [PubMed] [Google Scholar]
- 31. Chung JY, Braunschweig T, Hewitt SM. Optimization of recovery of RNA from formalin-fixed, paraffin-embedded tissue. Diagn Mol Pathol. 2006;15(4):229–36. doi: 10.1097/01.pdm.0000213468.91139.2d. [DOI] [PubMed] [Google Scholar]
- 32. Chung JY, Cho H, Hewitt SM. The paraffin-embedded RNA metric (PERM) for RNA isolated from formalin-fixed, paraffin-embedded tissue. Biotechniques. 2016;60(5):239–44. doi: 10.2144/000114415. [DOI] [PMC free article] [PubMed] [Google Scholar]
- 33. Chung JY, Choi J, Sears JD, Ylaya K, Perry C, Choi CH, Hong SM5, Cho H1,6, Brown KM2, Hewitt SM. A melanin-bleaching methodology for molecular and histopathological analysis of formalin-fixed paraffin-embedded tissue. Lab Invest. 2016;96(10):1116–27. doi: 10.1038/labinvest.2016.90. [DOI] [PMC free article] [PubMed] [Google Scholar]
- 34. Chung JY, Yi JM, Xie R, Brown V, Lee O, Ahuja N, Braunschweig T, Hewitt SM. A pressure cooking-based DNA extraction from archival formalin-fixed, paraffin-embedded tissue. Anal Biochem. 2012;425(2):128–34. doi: 10.1016/j.ab.2012.03.012. [DOI] [PMC free article] [PubMed] [Google Scholar]
- 35. Hewitt SM, Robinowitz M, Bogen SA, Gown AM, Kalra KL, Otis CN, Spaulding B, Taylor CR. Quality assurance for design control and implementation of immunohistochemistry assays; approved guideline-CLSI document I/LA28-A2. 2nd ed. Wayne, PA: Clinical and Laboratory Standards Institute; 2011. [Google Scholar]
- 36. Goldstein NS, Ferkowicz M, Odish E, Mani A, Hastah F. Minimum formalin fixation time for consistent estrogen receptor immunohistochemical staining of invasive breast carcinoma. Am J Clin Pathol. 2003;120(1):86–92. doi: 10.1309/QPHD-RB00-QXGM-UQ9N. [DOI] [PubMed] [Google Scholar]
- 37. Ergin B, Meding S, Langer R, Kap M, Viertler C, Schott C, Ferch U, Riegman P, Zatloukal K, Walch A, Becker KF. Proteomic analysis of PAXgene-fixed tissues. J Proteome Res. 2010;9(10):5188–96. doi: 10.1021/pr100664e. [DOI] [PubMed] [Google Scholar]
- 38. Goldmann T, Burgemeister R, Sauer U, Loeschke S, Lang DS, Branscheid D, Zabel P, Vollmer E. Enhanced molecular analyses by combination of the HOPE-technique and laser microdissection. Diagn Pathol. 2006;1:2. doi: 10.1186/1746-1596-1-2. [DOI] [PMC free article] [PubMed] [Google Scholar]
Associated Data
This section collects any data citations, data availability statements, or supplementary materials included in this article.