Abstract
T cell receptor (TCR) sequences are very diverse, with many more possible sequence combinations than T cells in any one individual1–4. Here we define the minimal requirements for TCR antigen specificity, through an analysis of TCR sequences using a panel of peptide and major histocompatibility complex (pMHC)-tetramer-sorted cells and structural data. From this analysis we developed an algorithm that we term GLIPH (grouping of lymphocyte interactions by paratope hotspots) to cluster TCRs with a high probability of sharing specificity owing to both conserved motifs and global similarity of complementarity-determining region 3 (CDR3) sequences. We show that GLIPH can reliably group TCRs of common specificity from different donors, and that conserved CDR3 motifs help to define the TCR clusters that are often contact points with the antigenic peptides. As an independent validation, we analysed 5,711 TCRβ chain sequences from reactive CD4 T cells from 22 individuals with latent Mycobacterium tuberculosis infection. We found 141 TCR specificity groups, including 16 distinct groups containing TCRs from multiple individuals. These TCR groups typically shared HLA alleles, allowing prediction of the likely HLA restriction, and a large number of M. tuberculosis T cell epitopes enabled us to identify pMHC ligands for all five of the groups tested. Mutagenesis and de novo TCR design confirmed that the GLIPH-identified motifs were critical and sufficient for shared-antigen recognition. Thus the GLIPH algorithm can analyse large numbers of TCR sequences and define TCR specificity groups shared by TCRs and individuals, which should greatly accelerate the analysis of T cell responses and expedite the identification of specific ligands.
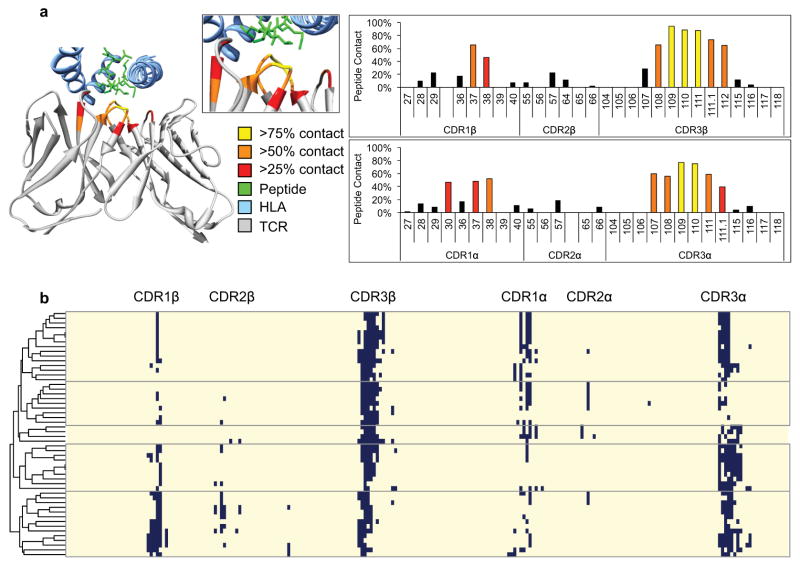
Advances in high-throughput sequencing technologies now enable the routine analysis of millions of T cell receptors in a single experiment, but there has been no systematic way to organize groups of TCR sequences according to their likely antigen specificities. To address this problem, we first performed an analysis of all reported TCR–pMHC structures. We aligned the TCR amino acid sequences from all 52 TCR–pMHC structures, and calculated the proportion of all complexes within 5 Å for each position from the peptide antigen (Extended Data Fig. 1, Supplementary Table 2). This provided an a priori probability of contact and the results showed that the majority of these possible contacts were in the CDR3s, and only short, typically linear stretches of amino acids make contact with antigenic peptide residues (IMGT positions 107–116), whereas the stem positions of CDR3 (IMGT positions 104, 105, 106, 117, and 118) are never within 5 Å of the antigen5. We also note that whereas there is always at least one CDR3β contact, there are multiple cases in which no CDR3α contact is made, suggesting that the former is required, although typically both are involved (Extended Data Fig. 1). Collectively, the results suggested that sequence analysis focused entirely on high probability contact sites in CDR3 may provide a means of clustering TCRs by shared specificity.
To evaluate whether specificity was principally mediated by these limited contact sites, we assembled a panel of eight pMHC tetramers, and used them to isolate specific T cells from 4–13 blood bank donors for each HLA specificity, plus one tonsil sample for the class II specificity (33 total donors). These were immunodominant peptides from Epstein–Barr virus (EBV), cytomegalovirus (CMV), and influenza in the context of HLA backgrounds HLA-A*0101, HLA-A*0201, HLA-B* 0702 or the class II molecule HLA-DRB1*0401 (Fig. 1a). Antigen-specific T cells were isolated using pMHC tetramers, and characterized using either single-cell TCRαβ sequencing or bulk TCRβ sequencing. In addition, 229 published TCR sequences of known specificity were obtained from the literature and from crystal structures in the Protein Data Bank6. In total, the training set consisted of 2,068 unique TCRs of known specificity (Supplementary Table 1). Although most specificities were recognized by hundreds of unique TCR sequences in each subject, a few subjects gave a limited oligoclonal response or had a single dominant clone against some specificities. For each of these specificities, almost all the TCRs were unique to an individual, consistent with their marked diversity (Fig. 1b).
Figure 1. Characteristics of TCRs reactive to common antigens across individuals.
a, MHC–tetramer-sorted antigen-specific TCR repertoires of common pathogen epitopes as well as public sources (n = 2,068). Diversity is calculated as the Shannon entropy of observed clones, where clone counts are the number of individuals expressing each clone. Percentage of all clones that were found in more than one individual reported as public. b, Representative Venn diagram of tetramer EBV-BMLF1280–288-GLC-specific clonal overlap in three HLA-A*0201+/EBV+ donors. c, Minimum Hamming distance of CDR3βs in MHC–tetramer-sorted antigen-specific pools, rendered non-redundant within each subject, compared with equal-sized randomly sampled naive control pools. s.d. of 100 repeat random samples of control TCRs reported on bars (*P < 0.01 Chi-square test). d, CDR3s in MHC–tetramer-sorted antigen-specific pools are enriched for a subset of motifs. Replicates A and B consisting of TCRs from different sets of donors (Supplementary Table 7) reproduce the same motifs with correlated enrichment assessed by Pearson correlation coefficient.
The specificity of some TCRs could be predicted by global similarity (Fig. 1c). Searching just within the CDR3, the CDR3 sequences selected against a single specificity would often differ by only one amino acid, whereas this was not observed in a set of unselected TCRs. It was also noted that antigen-specific pools of TCRs were enriched for more similar CDR3s on average (differing by 2–4 amino acids), although those could not be individually asserted to be antigen-specific as naive TCR populations also occasionally produced TCRs with such a degree of similarity.
To further distinguish TCRs recognizing the same antigen from unrelated TCRs, we searched for the enrichment of amino acid motifs with lengths of 2, 3, and 4 in the high-contact-probability region of CDR3β spanning IMGT positions 107–116. As the repertoire is created through a complex V(D)J recombination and nucleotide addition process, we developed a non-parametric resampling method for detecting the significant enrichment of local motifs. By this method, the similarity of receptors amongst antigen-specific repertoires were compared to repeat random subsampling from CDR3 length-distribution-matched unselected repertoires of 266,346 unique naive unselected CD4 and CD8 TCRs from thirteen healthy individuals to establish a ‘fold enrichment’ and ‘probability of enrichment’ of any motif above its expected frequency in the naive repertoire7,8. To avoid false positive conclusions drawn from PCR or read error, we separated biological replicates containing TCRs against the same specificity from different individuals and searched for enrichment of common motifs. Using this method, we could detect enriched motifs in CDR3s that were found within TCRs specific to a given pMHC from multiple individuals, but not in TCRs recognizing unrelated antigens (Fig. 1d).
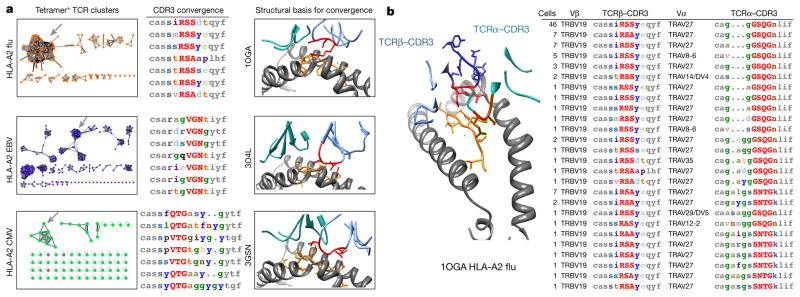
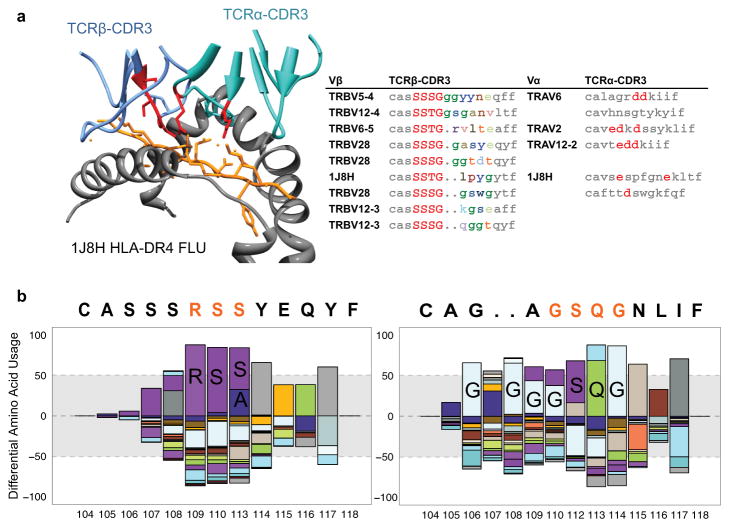
When clustering TCRs by both global similarity (CDR3 differing by up to one amino acid) and local similarity (shared enriched CDR3 amino acid motifs: >10× fold-enrichment, probability <0.001), we found that most of the TCR sequences selected by a particular pMHC tetramer typically fell into one or a few related TCR groups (Fig. 2a). Furthermore, in the four cases in which there was a high-resolution crystal structure involving one of these dominant TCRs complexed to its pMHC ligand, the significantly enriched CDR3 motifs corresponded to the contact residues with the antigenic peptide (Fig. 2a, b, Extended Data Fig. 2a). These were typically three to four amino acids in length and usually contiguous. Positions outside this central contact motif tended to tolerate more amino acid diversity. A positional weight matrix of amino acid diversity in the sequence group gives a high score to current group members and could be used to selectively recognize new group members (Extended Data Fig. 2b). In the case of the flu GIL antigen bound to HLA-A*0201, where we had αβ pairing from single-cell TCR sequencing, we found motifs for both α and β sequences (Fig. 2b). In the case of a DRB1*0401-restricted flu peptide specificity, the TCRα CDR3 did not give a clear sequence motif and the coordination of complementary charges is accomplished in multiple ways by different TCRs (Extended Data Fig. 2a). Thus we have largely relied on TCRβ sequences for our analysis. An analysis of positional motif enrichment and positional amino acid enrichment relative to the unselected repertoire highlighted the specific residues and their motif relationships that the structures indicate contribute the primary contacts of antigen recognition (Extended Data Fig. 2b). The results suggest that varying degrees of sequence convergence in each chain of the TCR heterodimer may provide some information regarding the relative importance of each chain for specificity.
Figure 2. Crystal structure representatives of TCR specificity groups reveal the structural basis for antigen-specific paratope convergence.
a, Network analysis of tetramer+ CDR3 clusters indicates relationships between TCRs (nodes) sharing global CDR3 similarity (black edges) or local CDR3 motifs (grey edges: motifs >10 fold enriched, 0.001> probability of enrichment by chance). Grey arrows indicate representative specificity group, accompanied with representative CDR3 alignment and crystal structure. Significant motif residues are highlighted in red in both CDR3 alignments and structure. In alignments: low contact probability, grey. In structures: MHC, grey; peptide, orange; TCRβ, light blue; TCRα, cyan. b, Single-cell paired α/β sequencing with crystal structure representative reveals coordinated motifs in both TCRβ and TCRα CDR3 that define paratope specificity.
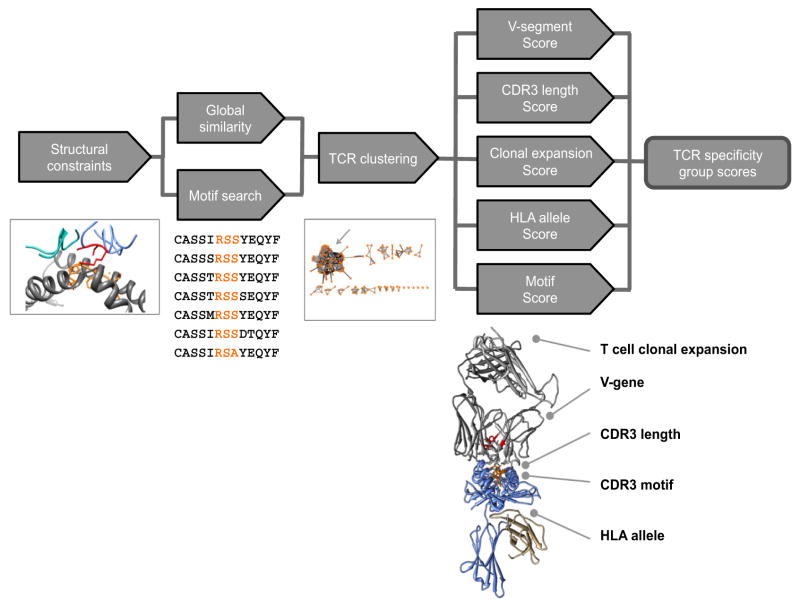
Collectively, these results on our tetramer-sorted TCR ‘training’ data set formulated the parameters of a new algorithm, GLIPH (grouping lymphocyte interactions by paratope hotspots), to search for and automatically cluster TCR sequences into distinct groups according to their likely specificity. GLIPH combines global and local TCR sequence similarity, structural peptide antigen contact propensity, V-segment bias, CDR3 length bias, shared HLA alleles among TCR contributors, and clonal expansion bias, to identify and cluster TCR sequences in specificity groups — sets of TCRs that are likely to recognize the same or very similar pMHC ligands (Extended Data Fig. 3, Supplementary Discussion; available at https://github.com/immunoengineer/gliph).
We carried out three tests to validate GLIPH. First, we ran multiple benchmarks on our training set of 2,068 unique sequences spanning eight tetramer specificities (Fig. 1a). We found that local motifs clustered 10% of the TCR database, global CDR3 similarity clustered 12% of the TCRs into clusters, and local and global GLIPH combination placed 14% of TCRs in clusters (clusters of minimum size 3 and shared Vβ; Extended Data Fig. 4a). We observed more clusters forming and a higher percentage of TCRs clustered as the number of available input TCRs increased. GLIPH clustered less than 0.5% of TCRs when run on naive sequences, indicating a low false-positive rate. When run on a mixture of 8 specificities, over 94% of clustered TCRs were correctly grouped with other TCRs of common specificity (Extended Data Fig. 4b). In comparison, clustering by global only, local motif only, contact probability agnostic, and an independent clustering algorithm CD-HIT, all were less effective or ineffective at successfully identifying TCRs of common specificity9 (Extended Data Fig. 4c). Thus GLIPH produced more clusters with greater accuracy than the other methods. Finally, as a test of whether GLIPH could recognize new members of existing specificity groups, we ran GLIPH on replicates containing only half of the subjects (Supplementary Table 7), and then used those specificity groups to score TCRs in the other half of the subjects. GLIPH was able to successfully recognize new TCRs of known specificity groups in the circulating T cells of new donors, providing a basis for reading the TCR repertoire (Extended Data Fig. 4d). The excess of specificity groups over the number of pMHCs also shows that there are multiple distinguishable TCR sequence solutions to a given ligand (Fig. 2a, Extended Data Fig. 4b), which was recently demonstrated in the context of an influenza CD8+ T cell epitope10.
Our second validation test evaluated the performance of GLIPH in a completely independent test set: TCR sequences from M. tuberculosis-specific CD4+ T cells isolated from 22 subjects with a latent infection (Supplementary Table 3). In brief, peripheral blood mononuclear cells (PBMCs) were stimulated with a large collection of M. tuberculosis peptides (n = 300) which can elicit a CD4+ response or an M. tuberculosis lysate for 4 and 12 h, respectively, and activated CD4+ T cells were selected on the basis of increased surface expression of CD154 or cytokine secretion11–13 (Extended Data Fig. 5b, c). Single cells were sorted into 96-well plates and amplified and sequenced for TCRαβ sequences, as well as scored for a panel of 18 cytokine genes using multiplex primers as previously described14 (Extended Data Fig. 6). The majority of cells showed a TH1*-like phenotype including IFNγ and IL-2 production, no IL-17 production, and T-bet and RORC expression consistent with previous reports15,16. The TCRs from the samples were enriched for clonally expanded sequences compared with PBMC controls (Extended Data Fig. 7). We obtained 4,464 independent TCRα and 5,711 TCRβ sequences from 22 individuals and analysed them with the GLIPH algorithm. GLIPH clustered 14% of all TCRs into 141 clusters of which 43 contained at least three unique TCRs. We focused on clusters that contained TCRs from at least 3 individuals: 16 distinct TCR β specificity groups that were shared between three or more individuals and contained at least four uniquely derived TCRβ clones. Among that set, there were six specificity groups that exhibited significant V-gene bias (P < 0.05), CDR3 length bias (P < 0.05), and were overrepresented in clonally expanded T cells (Fig. 3, Supplementary Table 5).
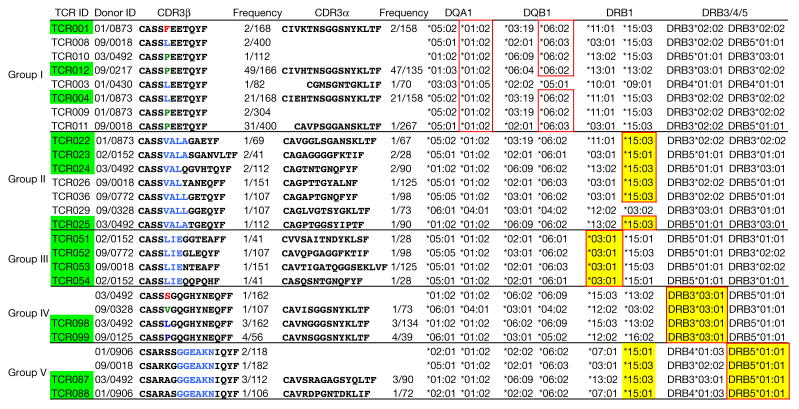
Figure 3. TCR specificity groups and predicted HLA-restriction among M. tuberculosis-infected subjects.
CDR3 α/β amino acid sequences from five GLIPH TCR specificity groups. Yellow-coloured boxes highlight the predicted common HLA class II alleles for each specificity group (combinatorial sampling probability <0.013 DRB1*15 for group II, probability <0.007 DRB1*03 for group III, probability <0.03 DRB3*03 for group IV, probability <0.02 DRB1*15/DRB5*01 for group V). Green-coloured boxes highlight the TCRs that have been validated in vitro. Red outlines indicate actual HLA as determined by reporter assay.
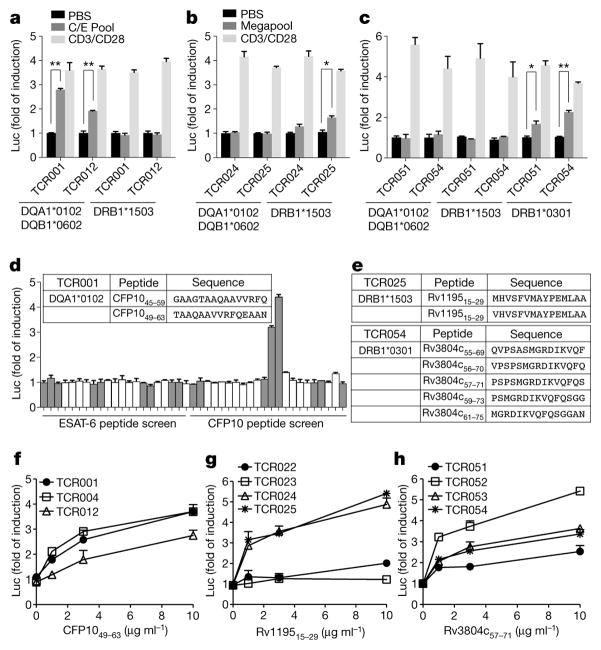
As an initial validation of the GLIPH-predicted specificity groups in the test set, these 22 individuals were comprehensively HLA-typed by sequencing to determine whether the GLIPH-derived TCR clusters also correlated with shared HLA alleles (Supplementary Table 6). We found 69 unique HLA class II alleles in our 22 subjects, but only one or two enriched candidate HLAs within the contributors to each GLIPH sequence group. To determine whether this predicted HLA restriction was correct, we chose three or four TCR heterodimers from different individuals from five different representative TCR specificity groups (I–V) that scored well for the GLIPH parameters (Fig. 3). Using a luciferase reporter assay17, we found that, as predicted, group I responded to the class II allele DQA1*0102/DQB1*0602, group II responded to DRB1*1503, group III responded to DRB1*0301, group IV responded to DRB3*0301, and group V responded to DRB5*0101 (Fig. 4a–c, Extended Data Fig. 8).
Figure 4. Identification of common antigen recognition by TCR specificity groups.
a, Group I TCRs were tested against candidate HLA alleles using CFP10/ESAT-6 pool (C/E Pool). b, c, Group II (b) and group III (c) TCRs were tested using megapool. Negative control, PBS; positive control, CD3/CD28 stimulation. Mean ± s.d. (n = 3, biological replicates) shown. *P < 0.05 and **P < 0.005 two-tailed Student’s t-tests. d, Individual peptides from C/E Pool tested against TCR001. Top 15th percentile of NetMHC-predicted DQA1*0102 binding indicated by grey bars. Insert table shows identified peptide antigen. e, Restricted HLA types and responding peptides for group II and III TCRs. f–h, Dose-dependent response of group I, II and III TCRs to their corresponding epitopes. Mean ± s.d. (n = 3, biological replicates) shown.
To determine the M. tuberculosis peptide specificity, we used the IEDB HLA-II binding prediction algorithms to rank likely antigen candidates known to be in the M. tuberculosis megapool18, and then performed individual peptide stimulation assays on the HLA-matched APC cell line to quickly identify the target peptide for all TCR specificity groups (I–V) (Fig. 4d, e, Extended Data Fig. 8). In each case, all or most TCRs in a given group recognized the same M. tuberculosis peptide (Fig. 4f–h).
To analyse the determinants of specificity independently, we performed a glycine mutagenesis scan of TCR025, which confirmed that the GLIPH predicted contact motif was indeed critical, with even conservative single amino acid changes (A>G and L>G) being sufficient to abolish specificity but not residues flanking either side (Fig. 5a).
Figure 5. Mutagenesis validation and de novo TCR design.

a, Glycine scan of CDR3β of TCR025 (group II). Each mutant was stimulated by DRB1*1503-restricted Rv119515–29, as well as a CD3/CD28-positive control. Mean ± s.d. (n = 3, biological replicates) shown. b, Group II CDR3β sequences with common CDR3 length. c, Positional weight matrix (PWM) reports observed CDR3β positional amino acid frequencies from (b). d, Top 1,000 theoretical TCRs and scores from PWM (equation (5) in Methods). Top 10 predicted TCRs (De18–De09) shown in red. Natural TCRs obtained from donors shown in yellow. e, De18–De09 were stimulated by DRB1*1503-restricted Rv119515–29. Blue indicates modified amino acids and red dash line indicates the basal activity. Mean ± s.d. (n = 3, biological replicates) shown. Activity compared to TCR025, *P < 0.01 two-tailed Student’s t-test.
As our final validation test of the ability of GLIPH to identify specificity regions of a TCR, and predict the specificity of new TCRs using this information, we generated de novo TCRs against the M. tuberculosis DRB1*1503-restricted peptide Rv119515–29. From subject-derived TCR CDR3 sequences identified by GLIPH as being convergent against this antigen (Fig. 5b), we calculated a CDR3 positional weight matrix (PWM) (Fig. 5c) to design TCRβ sequences (paired with the TCRα from known binder TCR025) as having the same specificity. From the GLIPH TCR PWM, we analysed the top 1,000 predicted CDR3β TCRs specific to M. tuberculosis DRB1*1503-restricted Rv119515–29. Some of these CDR3s were identical to those of observed binders, although in the context of TCR025 Vβ, Jβ, Vα, Jα and CDR3α, differed by at least 45 amino acids in the total TCR (Extended Data Fig. 9). We found that many predicted binders, none of which was found in our study, had better scores than the naturally derived TCRs obtained from subjects (Fig. 5d). From the GLIPH prediction set, we selected 10 of the best scoring predicted TCRs that were at least two amino acids different from TCR025, and 8 out of 10 TCRs demonstrated antigen-specific activation to Rv119515–29, with two such TCRs being significantly more active than TCR025 (Fig. 5e). This shows that GLIPH is able to predict new members of a specific group and even to improve sensitivity.
In summary, we find that the GLIPH algorithm can organize TCR sequences into distinct groups of shared specificity either within an individual or across a group of individuals. Second, it facilitates T cell antigen discovery as shown by our analysis of M. tuberculosis-specific T cells. Third, the TCR motifs that GLIPH identifies allow one to read the T cell receptor repertoire directly from primary sequence data. In fact a fourth, and perhaps the most important, use of GLIPH is to analyse αβ T cell responses independently of knowing the epitope specificity and MHC restriction of the set of TCRs, at least with a set of sequences enriched for a particular pathogen, as shown here. The number and size of such clusters provides information as to the complexity of an immune response, or the presence of an important shared specificity across individuals. This could be very useful in analysing the T cell response to a vaccine or infection in a given cohort, quantifying how many distinct specificity groups are active in each individual, and determining whether this correlates with a particular outcome.
Methods
Data reporting
No statistical methods were used to predetermine sample size. The experiments were not randomized and the investigators were not blinded to allocation during experiments and outcome assessment.
Antigen-specific T cells
Peripheral blood mononuclear cells (PBMCs) were obtained from 28 healthy blood donations of known HLA type at HLA-A, HLA-B, and HLA-DR loci and known infection status for EBV and CMV from the Stanford Blood Center. Cells were stained with fluorophore-conjugated pMHC tetramers of MHC HLA-A*0101, HLA-A*0201, HLA-B*0702, or HLA-DRB1*0401 backgrounds. The tetramers were engineered to display peptides of EBV, CMV, or flu through photo-exchange of a surrogate peptide in the presence of a molar excess of a replacement peptide. For EBV HLA-A2, a commercial dextramer was also used. Cells were sorted by fluorescent activated cell sorting (FACS) to collect either as single-cells or bulk populations of antigen-specific cells in RT reverse-transcriptase one-step reaction solution (Extended Data Fig. 5a). During single-cell sorting, index sorting was applied to collect activity on a number of additional markers including CD45RA and CD62L. Sorting for tetramer specific cells was conducted on a BD Aria II (BD Biosciences). For single-cell sorting M. tuberculosis-specific CD4+ T cells using activation marker CD154, PBMCs were thawed in complete RPMI 1640 medium at 2 × 10⁶ cells per ml and recovered 12 h before stimulation. PBMCs were stimulated with M. tuberculosis lysate (10 μg ml−1) for 12 h in the presence of 1 μg ml−1 purified anti-CD49d antibody and anti-CD154-PE. After stimulation, cells were harvested and stained with surface markers for sorting. For single-cell sorting cytokine-secreting cells, PBMCs were stimulated with either CFP10/ESAT-6 peptide pool or Megapool (2 μg ml−1 for each peptide) for 4 h in the presence of 1 μg ml−1 purified anti-CD49d antibody. Cells were collected and stained using the IL-2 or IFNγ Secretion Assay Kit (Miltenyi Biotec). Sorting was conducted on a BD FACSJazz cell sorter (BD Biosciences).
M. tuberculosis-infected study participants
22 adolescent participants, aged 12 to 18 years, were randomly selected from a previous cohort study, which enrolled in the town of Worcester, approximately 100 km from Cape Town, South Africa, between 2005 and 2007 (ref. 19). This study was approved by the Faculty of Health Sciences Human Research Ethics Committee of the University of Cape Town and Human Research Protection Program (HRPP) at Stanford University. Written informed consent was obtained from the parents of adolescents and assent was obtained from adolescents. Venous blood was collected for PBMC isolation, QuantiFERON TB Gold In-tube (Qiagen) (QFT) and a tuberculin skin test was administered. All samples used in this study were from asymptomatic QFT-positive adolescents. PBMCs were obtained by density gradient centrifugation using Ficoll and cryopreserved using freezing medium containing 90% fetal bovine serum and 10% DMSO. The 22 participants were HLA typed at Sirona Genomics (now Immucor inc.), under supervision of M. Mindrinos.
Cell lines and reagents
The Jurkat 76 T cell line, deficient for both TCRα and TCRβ chains, was provided by S.-A. Xue (Department of Immunology, University College London). The NFAT reporter stable cell line (J76-NFATRE-luc) was constructed using lentiviral transfer of pNL(NlucP/NFAT-RE/Hygro) (Promega) into Jurkat 76 cell. The K562 cell line was obtained from the ATCC and cultured under standard conditions. Artificial antigen presenting cells were constructed using lentiviral transfer of different HLA alleles (gBlock ordered from IDT) into K562 cells. These cell lines were used without further authentication. All cell lines were tested for mycoplasma and verified negative. Anti-CD4-APC, anti-CD69-APC/Cy7, and anti-TCR α/β-FITC abs were purchased from BioLegend. Anti-CD3-PB, purified anti-CD49d and anti-CD154-PE Abs were purchased from BD Biosciences.
Antigens
M. tuberculosis CFP10/ESAT-6 peptide pool: 22 peptides spanning the length of the CFP10 molecule and 21 peptides spanning the length of the ESAT-6 molecule were purchased from PEPscreen (Sigma). Each peptide was 15 amino acids long and overlapped its adjacent peptide by 11 residues. Peptide was dissolved in DMSO at 100 μg ml−1 and then mixed together to make CFP10/ESAT-6 peptide pool. Megapool peptides containing 300 epitopes from 90 M. tuberculosis proteins were provided by A. Sette (La Jolla Institute for Allergy & Immunology). M. tuberculosis whole-cell lysate (strain H37Rv) was provided by Bei Resources.
Sequencing of single-cell TCRs
Single cells were sorted into 96-well plates containing 12 μl of oneSTEP RT reaction buffer. The cells were then amplified for TCRβ and TCRα sequences, using multiplex primers, a DNA-nesting and multiplex process as previously described14,20. During the PCR priming, DNA multiplex barcodes were attached to each amplicon such that 96-well plates of single cells were processed on a single MiSeq 2 × 300 bp sequencing run.
Bulk sequencing of TCRs
Bulk collections of tetramer-specific T cell populations were collected into RLT lysis buffer (Qiagen). RNA was extracted from the pool and subjected to amplification and DNA multiplex barcoding through the use of previously described multiplex primer sets and a previously described plate-based multiplex priming reaction. Using this method, up to two 96-well plates of samples could be sequenced in parallel on a single MiSeq 2 × 300 bp sequencing run to generate nearly 21 million reads.
Computational analysis of single-cell and bulk TCR sequences
Fastq reads were paired-end assembled and converted to fasta. The fasta sequence files were demultiplexed to assign every read to a plate and well. All reads were separated into subsets of 10,000 reads or less per file. Each file was submitted for parallel analysis using the previously described VDJFasta algorithm14,20–22. For single-cell samples, the total population of reads is analysed within each given well, identifying a single cell only if empirically determined boundary cutoffs of dominance for a single TCRβ and TCRα clone are encountered, as previously reported8. The resulting full sequence for the TCRα chain(s) and TCRβ chain are then combined with any index FACS phenotypic markers specific to these single cells.
Computational error correction of bulk TCR sequences by replicates
PCR error, PCR contamination, read error and sample swaps can all contribute to error when performing bulk sequencing. To mitigate errors in bulk sequencing, RNA from each sample was split and processed as duplicate technical replicates. Comparison of clone frequencies across replicates established confidence intervals in apparent clone frequencies, allowed calculation of R2 reproducibility of clone frequencies across replicates, and enabled elimination of PCR and sequencing read errors resulting in a clone appearing only in one replicate. Any clones not encountered across replicates were rejected, assumed to be either read errors or too low in abundance for reliable recovery across replicates. As each replicate was sequenced to an average depth of 10,000 reads, this procedure resulted in the reliable recovery of all clones with frequencies 5 × 10⁻⁴. Within a sample, TCR reads differing from another more frequent clone by only one nucleotide were assumed to be read errors of the more abundant species and were collapsed into that higher-frequency read.
Structural analysis of TCR positional antigen contact probability
All amino acid sequences for all solved PDB structures were downloaded and scored against the TCR profile HMM with an e-value cutoff of <1 × 10⁻⁵, and blasted against a reference database of MHC sequences with an e-value cutoff of <1 × 10⁻¹⁰. Sequences from structures containing both an MHC and TCR were aligned. Every residue in every TCR of such sequences was annotated as potential-contact if within 5 Å of peptide in the pMHC complex as determined by Modeller 9.17 and confirmed manually using UCSF Chimera. Using these data, an average positional contact probability was generated for each homologous position in the TCR sequence alignment. The positional contact probabilities were used as a weighting scheme to influence importance of convergence motifs at homologous positions by GLIPH. It was observed that CDR3β contacts were limited to IMGT positions 107–116 irrespective of whether the four solved structures containing convergence group representatives in Fig. 2a and Extended Data Fig. 2a were withheld from the data set when calculating contact probability.
Naive reference repertoire generation
For this study, the naive control data set consists of 162,165 non-redundant V-J-CDR3 sequences from CD45RA+RO− naive T cells from two individuals7, 83,910 non-redundant V-J-CDR3 sequences from CD4 naive T cells from 10 healthy controls, and 27,292 non-redundant V-J-CDR3 sequences from CD8 naive T cells from 10 healthy controls8, for a total of 268,955 unique naive V-J-CDR3 sequences from 12 individuals. CDR3 length distributions and CDR3 3mer motif composition were comparable in all reference sets (Extended Data Fig. 10).
Calculating TCR global convergence
Global similarity is defined as the CDR3 hamming distance (number of CDR3 amino acid differences) between two TCRs using the same Vβ segment and having a same-length CDR3. In order to identify a global similarity cutoff below which two TCRs can be assumed to share a common specificity, GLIPH performed repeat random CDR3-length stratified resampling of an unselected naive TCR reference set. Using a sampling depth s of TCRs equal in size to the query set, GLIPH performs a large number (default, 1,000) of random samplings of s naive TCR sequences. For each sampling, each TCR in the set is compared to every other sample, and the lowest global similarity is recorded. The proportion of all TCR similarity distances is then taken as a probability of observing TCRs of that level of global similarity by chance in absence of selection. (For more details, see Supplementary Methods.)
Calculating TCR local convergence
Within any set of T cell receptors, a collection of all continuous 2mers, 3mers, 4mers and 5mers can be extracted and evaluated for their frequency within the set. Positive selection of each observed motif can be quantified by comparison to expected motif frequency distributions obtained during repeat resampling from an unselected repertoire (default 1,000 random resamplings; Extended Data Fig. 10). A fold-change of enrichment can be calculated as the observed frequency of the motif over the expected frequency of the motif as observed in repeat random samplings from the naive distribution. A probability of non-enrichment can be calculated as the proportion of random subsample simulations that obtain an unselected sample where the motif is at an equal or higher frequency than found in the observed set. Local convergence analysis is only performed within residues with at least a 5% probability of antigen contact (positions 107–116). Amino acid motif frequencies in the TCR sets were comparable in content and highly correlated in degree, with the result being that GLIPH results are robust to the specific naive TCR reference set used (Extended Data Fig. 10b).
If each motif could only be observed in a given sequence once, then the distribution of sampling motif frequency means become normally distributed and this result is equivalent to calculating the frequencies of all motifs in the reference database, and then calculating one-sided confidence intervals for expected frequencies of any given motif in the reference database at any given sampling depth:
| (1) |
where n is the sample set non-redundant CDR3 sample size, y is the motif mean frequency, OS indicates one-sided confidence interval, t is the t-distribution critical value, and s is the s.d. estimate at that sampling depth for the motif, as
| (2) |
(see Supplementary Methods).
Generating and scoring GLIPH specificity groups
After analysing global convergence cutoffs and local convergence motifs, GLIPH clusters all TCRs, creating an edge between TCRs that share either global similarity below the significance cutoff (that is, differ by less than 2 amino acids), or share a significant motif (that is, share a motif ‘RSS’ that is >10-fold enriched and <0.001 probability of occurring than this level of enrichment in naive TCR pools). Clusters can be optionally filtered for shared V-gene usage, where only edges between TCR members with the most common V-gene are kept. These resulting clusters are GLIPH specificity groups.
GLIPH specificity groups can be provided a score that combines the analysis of CDR3 motifs, enrichment of common V-genes, enrichment of a limited CDR3 length distribution, enrichment of clonally expanded clones, enrichment of shared HLA in donors, and cluster size. V-gene enrichment and CDR3 length distribution enrichment analysis is performed by calculating the Simpson diversity index for V-genes/CDR3-lengths within clonal members of GLIPH specificity groups, and calculating the probability that a random selection of TCR sequences of the same size would generate a Simpson score equal or superior to the observed score
| (3) |
Enrichment of clonal expansion is similarly calculated as the probability that a random set of equal size from the same data set would have at least this same number of expanded members. When HLA data are available, enrichment of HLA is calculated for each HLA allele found in at least two members in the GLIPH convergence group, in each instance calculating the probability that this particular HLA would be as enriched in a set of this size by random chance as is observed in the selected set. Global similarity is scored as previously defined. Local similarity significance is calculated as previously described. Finally, GLIPH cluster size can be scored by evaluating the probability of a network of that size forming by random chance in an unselected repertoire sampled at equal depth. The summary score of any GLIPH cluster is a combination of all individual scores, calculated as either a probability conflation
| (4) |
where P (X = C) is the probability that X belongs to class C, given N independent tests Pi, or the first principal component (Supplementary Methods, Supplementary Table 4). For specificity groups based on local motifs, V-gene usage, CDR3 length and clonal expansion appear as independent variables. However, it should be noted that for specificity groups defined by global similarity, the CDR3 length, and to some extent V-gene usage, are no longer truly independent variables. (GLIPH available at https://github.com/immunoengineer/gliph; for more details, see Supplementary Methods.)
Predicting specificity and de novo TCR specificity design with GLIPH
For a given convergence group, an N-terminal positional weight matrix (PWM) can be constructed of the CDR3 by creating a left-justified alignment of CDR3 amino acid residues (Fig. 5b) and tabulating the frequency of each amino acid at each homologous position (Fig. 5c). A score of any TCR sequence to the PWM can then be calculated as the product of the probability of each amino acid in the scored sequence at the homologous position in the PWM, employing pseudocounts of 0.5% for any amino acid not observed in the PWM input alignment (Fig. 5d). When attempting to identify new members of an existing GLIPH specificity group, only the first 10 N-terminal amino acid positions are used during scoring: this allows recognition of new TCRs of different lengths from the PWM, and leverages an observation that the conserved motifs always appear to be fixed a specific length from the N terminus and within the first 10 amino acids (Extended Data Fig. 4d).
| (5) |
where PWM is the positional weight matrix of amino acid frequencies per position, i is the amino acid position in the PWM, and ai is the frequency of amino acid a at position i in the PWM. The resulting score s can be normalized by comparison to a large set of naive TCRs as
| (6) |
where s is the PWM score of a TCR under evaluation (Formula 5), N is the set of naive TCR database (200,000 for Extended Data Fig. 4d), Sn is the PWM score of naive TCR n of set N, and Ps is the probability of that PWM score occurring in naive TCRs. To account for V-gene mismatch, a V-gene mismatch penalty v is applied during scoring (v = −2 in Extended Data Fig. 4d).
When attempting to de novo synthesize new members of an existing GLIPH specificity group, a global PWM of CDR3s of the same length is used. The top 1,000 highest predicted scoring TCRs are emitted from the PWM by stochastic sampling, and TCRs with the highest scores are preferentially tested (Fig. 5d, e). For normalization, the resulting score can be compared to a distribution of a large number of naive sequences scored against the same PWM, to produce a probability of membership.
Lentiviral TCR transduction
Plasmids for lentiviral transduction were provided by the Crabtree laboratory in Stanford University. Lentiviral transduction was performed as previously described23. In brief, TCRα chain, P2A linker and β chain fusion gene fragments were ordered from IDT and cloned into MCS of N103 vector (nLV Dual Promoter EF-1a-MCS-PGK-Puro). A GFP marker was also included through T2A linker. HEK-293T cells were plated on 10-cm dishes at 5 × 10⁶ cells per plate 24 h before transfection. The culture medium was changed before transfection. Lentiviral supernatants were prepared by co-transfection of 293T cells, using 10 μg of transfer vector, 7.5 μg of envelope vector (pMD2.G), 2.5 μg of packaging vector (psPAX2) and 75 μl PEI (Sigma). The culture medium was replaced 16 h after transfection and viral supernatant was collected 48 h later. The viral supernatants were filtered through a 0.45 μm SFCA syringe filter (Corning) and concentrated by centrifuge with 100 K Amicon Ultra-15 filter (Millipore). Concentrated viruses were used for J76-NFATRE-luc cell transduction using spinoculation for 2 h in the presence of 6 μg ml−1 polybrene (Sigma). 48 h after transduction, expression of the TCR was analysed by flow cytometry and both GFP and TCR positive cells were sorted for epitope screen.
Epitope screen
For peptide screen, 100 μl TCR transduced J76-NFATRE-luc cells (106 per ml) were co-cultured with 100 μl HLA-transduced K562 cells (106 per ml) in a 96-well plate. Peptide pool or individual peptide was added to the well at 2 μg ml−1. After 8 h incubation, cells were collected and luciferase activity was measured using Nano-Glo Luciferase Assay (Promega). Fold induction of luciferase activity was calculated referring to unstimulated samples.
Code availability
The open source code is available at GitHub (https://github.com/immunoengineer/gliph).
Data availability
All data that support the findings of this study are provided as Supplementary Data.
Extended Data
Extended Data Figure 1. TCRs specific to common antigens show motifs within a limited region of CDR residues with high structural contact propensity.
a, Probability of IMGT TCR CDR positions being within 5 Å of peptide antigen, as tabulated from 52 published crystal structures of TCR–pMHC interactions (Supplementary Table 2), and displayed as a heat map on representative TCR 2j8u. Positions with less than 25% contact probability are shown in black. b, Alignment of 52 non-redundant (<95% amino acid identity between any pair) TCR sequences from TCR–pMHC PDB structure complexes. Positions within 5 Å of peptide antigen are indicated in dark blue. Linear set of 3–5 amino acids in CDR3β observed in almost every structure, which TCRβ–CDR3 IMGT positions 108–111 being in contact in 90% of TCR structures. Minimal contacts observed by CDR1 and CDR2 of either chain. TCRs are clustered into five general contact modes according to contact profiles of all six CDRs.
Extended Data Figure 2. Crystal structure representative of TCR specificity groups.
a, Class II single-cell paired α/β sequencing with crystal structure representative indicating variable CDR3β length and discontinuous role of CDR3α. Discontinuous negatively charged residues in structure 1J8H coordinate lysine-positive charges in peptide; negatively charged residues indicated in orange in alignment when found. b, Positional amino acid bias in flu HLA-A2 dominant motif CDR3β and CDR3α convergence group, normalized by amino acid diversity in the unselected repertoire. Enrichment of RS(S/A) motif in TCRβ compared with naive distribution. Enrichment of SQ at IMGT positions 112, 113 in TCRα, with enrichment of glycine at multiple positions.
Extended Data Figure 3. Three-step GLIPH algorithm.
GLIPH searches for global and local (motif) CDR3 similarity in TCR CDR regions with high contact probability. Motif significance and global similarity cutoffs are established by repeat random sampling against an unbiased reference pool of TCRs. Second, all identified global and local relationships between TCRs are used to construct clusters of TCR specificity groups. Third, each specificity group is analysed for enrichment of common V-genes, CDR3 lengths, clonal expansions, shared HLA alleles in recipients, motif significance, and cluster size. Enrichment probability is obtained by calculating the probability of obtaining at least the observed Simpson diversity index measure for that feature compared with a random sampling of equal size from the source data set. The resulting features are combined into a specificity group score for each group.
Extended Data Figure 4. Benchmark of GLIPH subcomponents and complete algorithm on random naive TCRs or a mixed training set pool of pMHC tetramer+ TCRs of 8 known specificities.
a, GLIPH clusters up to 14.5% of tetramer+ TCRs, while clustering less than 0.5% of naive TCRs, a combination of global CDR3 similarity and local motif enrichment resulting in more clustering than either individually. b, The cluster results of applying GLIPH to the mixed pool of tetramer-sorted TCRs. Each node is a TCR, their specificity indicated by colour. Edges between TCRs indicating a GLIPH-predicted shared specificity; light grey indicate shared local motif, and dark grey indicate shared global similarity. Over 95% of cluster members are grouped with other TCRs of the same specificity. c, GLIPH components evaluated for percentage of TCRs clustered versus percentage of correct specificity assignments. Global CDR3 clustering by hamming dist = 1 or dist = 2 are reported. Global CDR3 similarity clustering by CD-HIT, with clustering cutoffs 0.8 or 0.9 reported. Local motif similarity clustering with and without structural constraints reported. Complete GLIPH, including global CDR3 identity, local CDR3 motif similarity, structural constraints and clustering scoring, resulted in 14.5% of TCRs clustering with 95% of cluster members correctly grouped with other TCRs of shared specificity. For global similarity, distance 1 resulted in effective grouping of TCRs whereas distance 2 resulted in predominantly mixed clusters. For local motifs, effective TCR clustering could only be obtained when structural contact probability masks were applied. Similarly, although CD-HIT was not effective at clustering TCRs by common specificity when provided the entire TCR sequences, when offered only the high contact probability CDR3s, it was able to perform effective clusters provided an appropriate clustering threshold. d, When run on replicate A containing TCRs from half of study subjects, GLIPH produced specificity groups whose positional weight matrices (PWMs) could then be used to score the TCRs from replicate B subjects (equations (5) and (6) in Methods). GLIPH scoring identifies new TCRs of correct specificity from new subjects.
Extended Data Figure 5. Platform for PBMC stimulation and characterization of antigen-specific TCRs.
a, Gating strategy used for isolating and sorting tetramer-positive T cells. b, Frozen PBMCs from QFN+ donors are thawed, recovered and stimulated with either M. tuberculosis lysate or peptide pool. Antigen-specific T cells are single-cell-sorted into 96-well plate for TCR amplification using established protocol14. c, Gating strategy used for isolating and single-cell sorting antigen-specific T cells.
Extended Data Figure 6. Phenotypic analysis of clonal expanded M. tuberculosis-specific CD4+ T cells.
a, Gating strategy for isolating antigen-specific T cells. PBMC from one QFN+ donor (02/0259) was stimulated with M. tuberculosis lysate and then stained with activation markers CD69 and CD154. Antigen-specific CD4+ T cells were sorted by gating on CD69+CD154+ population. Alternatively, PBMCs were stimulated with megapool peptide library. Antigen-specific CD4+ T cells were isolated using cytokine capture assay, IL-2 or IFNγ. b, 18-parameter (parameters listed on right side) phenotypic analysis of M. tuberculosis-specific CD4+ T cells from all the 22 donors. Individual T cells are grouped by TCR sequence; each colour on the bar above the heat maps represents a distinct and clonal expanded TCR sequence. The majority of cells presented a TH1*-like phenotype including IFNγ and IL-2 production, T-bet and RORC expression, as is characteristic of previously reported M. tuberculosis responses.
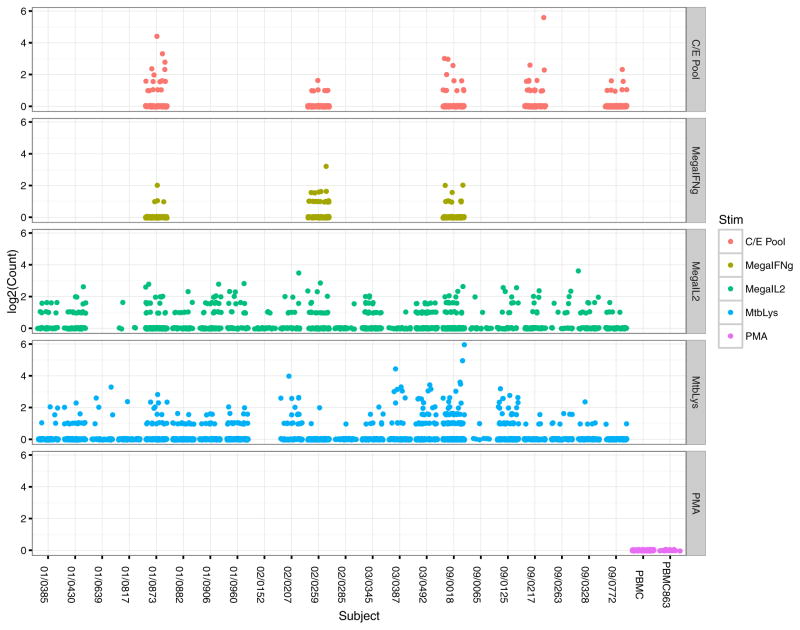
Extended Data Figure 7. Clonal expansion of M. tuberculosis-specific CD4+ T cells.
Clonal analysis of M. tuberculosis-specific CD4+ T cells from all the 22 donors using different selection strategy, including stimulation by ESAT6/CFP-10 pool (C/E Pool) or Megapool followed by cytokine capture assay and M. tuberculosis lysate stimulation followed by CD154+ selection. Each dot represents a distinct TCR sequence and the count represents the number of repeat. PMA/ionomycin stimulation was used as a non-specific stimulation control.
Extended Data Figure 8. Epitope screen using luciferase assay.
a, Each individual peptide from megapool was tested against J76-NFATRE-luc cell expressing TCR025 in co-culture with K562 expressing DRB1*1503. Column 1–300: individual peptide from Megapool, column 301: CD3/CD28 stimulation as positive control. Peptides predicted to be in the top 15 percentile of binding to each HLA by the MHC-II Consensus method are indicated by grey bars. Mean ± s.d. (n = 3, biological replicates) are shown. The insert table shows the restricted HLA type and responding peptides. b–d, A similar screen was also performed for TCR054 (b), TCR098 (c) and TCR088 (d).
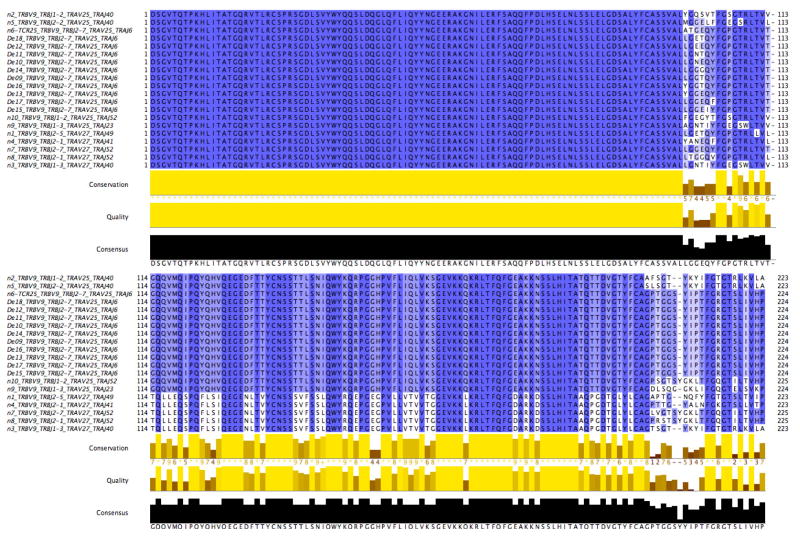
Extended Data Figure 9. Amino acid alignment of naturally occurring and de novo group II TCRs.
Amino acid alignment presents first the TCRβ chain followed the TCRα chain for naturally occurring group II natural TCRs n1–n10 from Fig. 5b (n denotes natural) and de novo TCRs De9–De18 from Fig. 5e. All segment identities are reported for each sequence in the sequence headers. Positional conservation is coloured as dark blue if conserved, and light blue or white if variable.
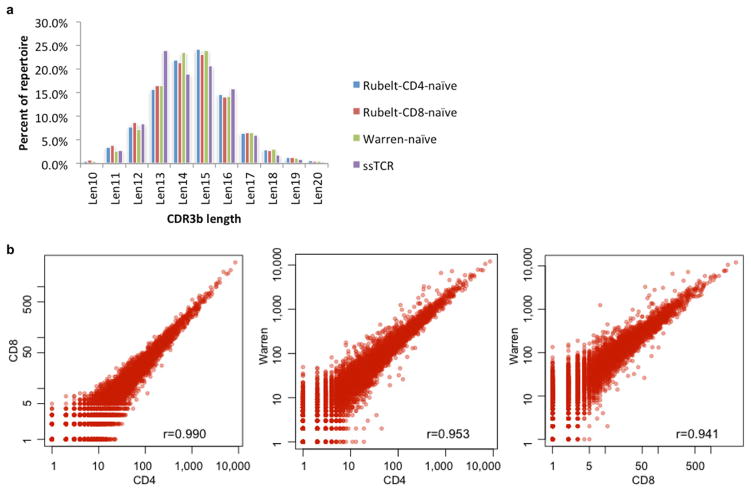
Extended Data Figure 10. Comparison of CDR3 length and 3mer motif composition of naive TCR reference set.
The naive control data set consists of 162,165 non-redundant V-J-CDR3 sequences from CD45RA+RO− naive T cells (labelled with the author name ‘Warren’)7, 83,910 non-redundant V-J-CDR3 sequences from CD4 naive T cells from 10 healthy controls, and 27,292 non-redundant V-J-CDR3 sequences from CD8 naive T cells from 10 healthy controls8, for a total of 268,955 unique naive V-J-CDR3 sequences. a, b, Analysis of CDR3 length distributions (a) and motif frequency distributions (b) indicates that the three naive reference sets have very similar CDR3 length distributions and 3mer amino acid motif frequency distributions (r = 0.99, r = 0.95, and r = 0.94 Pearson correlation coefficients for CD4 × CD8, CD4 × Warren, and CD8 × Warren, respectively).
Supplementary Material
Acknowledgments
We thank the Stanford Human Immune Monitoring Center for high-throughput sequencing support, and M. Mindrinos and co-workers at Sirona Genomics for the HLA typing. We especially thank The Bill and Melinda Gates Foundation, The National Institutes of Health (2U19 AI057229) and the Howard Hughes Medical Institute for financial support, S.-A. Xue for providing the Jurkat 76 T cell line, C.-Y. Chang and R. Taniguchi for helping with lentiviral transduction, R. Hovde for valuable discussions regarding statistical measures, H. Mahomed, W. Hanekom and members of the Adolescent Cohort Study (ACS) group for enrolment and follow-up of the M. tuberculosis-infected adolescents, and R. Bedi for collecting TCR sequences from the literature. Sorting was (partially) performed in the Shared FACS Facility obtained using NIH S10 Shared instrument grant (S10RR025518-01).
Footnotes
The authors declare no competing financial interests.
Readers are welcome to comment on the online version of the paper.
Reviewer Information Nature thanks B. Chain, R. Holt and the other anonymous reviewer(s) for their contribution to the peer review of this work.
Online Content Methods, along with any additional Extended Data display items and Source Data, are available in the online version of the paper; references unique to these sections appear only in the online paper.
Supplementary Information is available in the online version of the paper.
Author Contributions J.G., H.H. and M.M.D. conceptualized the study; H.H. and J.G. performed the experiments with assistance from A.N. and O.H.; J.G., H.H. and M.M.D. performed analysis with assistance from C.P, S.M.K., S.D.B., and O.M.M.; J.G. authored the codebase with assistance from N.H.; X.H.J. and A.H. provided help with TCR sequencing; C.L.A. and A.S. provided the megapool and data interpretation; T.J.S. provided samples from the M. tuberculosis study; F.R. and L.E.W. provided sequencing data; J.G., H.H. and M.M.D. wrote the manuscript with input from all authors; M.M.D. supervised the study.
References
- 1.Arstila TP, et al. A direct estimate of the human αβ T cell receptor diversity. Science. 1999;286:958–961. doi: 10.1126/science.286.5441.958. [DOI] [PubMed] [Google Scholar]
- 2.Davis MM, Bjorkman PJ. T-cell antigen receptor genes and T-cell recognition. Nature. 1988;334:395–402. doi: 10.1038/334395a0. [DOI] [PubMed] [Google Scholar]
- 3.Qi Q, et al. Diversity and clonal selection in the human T-cell repertoire. Proc Natl Acad Sci USA. 2014;111:13139–13144. doi: 10.1073/pnas.1409155111. [DOI] [PMC free article] [PubMed] [Google Scholar]
- 4.Shortman K, Egerton M, Spangrude GJ, Scollay R. The generation and fate of thymocytes. Semin Immunol. 1990;2:3–12. [PubMed] [Google Scholar]
- 5.Rudolph MG, Stanfield RL, Wilson IA. How TCRs bind MHCs, peptides, and coreceptors. Annu Rev Immunol. 2006;24:419–466. doi: 10.1146/annurev.immunol.23.021704.115658. [DOI] [PubMed] [Google Scholar]
- 6.Berman HM, et al. The Protein Data Bank. Nucleic Acids Res. 2000;28:235–242. doi: 10.1093/nar/28.1.235. [DOI] [PMC free article] [PubMed] [Google Scholar]
- 7.Warren RL, et al. Exhaustive T-cell repertoire sequencing of human peripheral blood samples reveals signatures of antigen selection and a directly measured repertoire size of at least 1 million clonotypes. Genome Res. 2011;21:790–797. doi: 10.1101/gr.115428.110. [DOI] [PMC free article] [PubMed] [Google Scholar]
- 8.Rubelt F, et al. Individual heritable differences result in unique cell lymphocyte receptor repertoires of naive and antigen-experienced cells. Nat Commun. 2016;7:11112. doi: 10.1038/ncomms11112. [DOI] [PMC free article] [PubMed] [Google Scholar]
- 9.Li W, Godzik A. CD-HIT: a fast program for clustering and comparing large sets of protein or nucleotide sequences. Bioinformatics. 2006;22:1658–1659. doi: 10.1093/bioinformatics/btl158. [DOI] [PubMed] [Google Scholar]
- 10.Song I, et al. Broad TCR repertoire and diverse structural solutions for recognition of an immunodominant CD8+ T cell epitope. Nat Struct Mol Biol. 2017;24:395–406. doi: 10.1038/nsmb.3383. [DOI] [PMC free article] [PubMed] [Google Scholar]
- 11.Chattopadhyay PK, Yu J, Roederer M. A live-cell assay to detect antigen-specific CD4+ T cells with diverse cytokine profiles. Nat Med. 2005;11:1113–1117. doi: 10.1038/nm1293. [DOI] [PubMed] [Google Scholar]
- 12.Frentsch M, et al. Direct access to CD4+ T cells specific for defined antigens according to CD154 expression. Nat Med. 2005;11:1118–1124. doi: 10.1038/nm1292. [DOI] [PubMed] [Google Scholar]
- 13.Lindestam Arlehamn CS, et al. A quantitative analysis of complexity of human pathogen-specific CD4 T cell responses in healthy M. tuberculosis-infected South Africans. PLoS Pathog. 2016;12:e1005760. doi: 10.1371/journal.ppat.1005760. [DOI] [PMC free article] [PubMed] [Google Scholar]
- 14.Han A, Glanville J, Hansmann L, Davis MM. Linking T-cell receptor sequence to functional phenotype at the single-cell level. Nat Biotechnol. 2014;32:684–692. doi: 10.1038/nbt.2938. [DOI] [PMC free article] [PubMed] [Google Scholar]
- 15.Lindestam Arlehamn CS, et al. Memory T cells in latent Mycobacterium tuberculosis infection are directed against three antigenic islands and largely contained in a CXCR3+CCR6+ TH1 subset. PLoS Pathog. 2013;9:e1003130. doi: 10.1371/journal.ppat.1003130. [DOI] [PMC free article] [PubMed] [Google Scholar]
- 16.Sallusto F. Heterogeneity of human CD4+ T cells against microbes. Annu Rev Immunol. 2016;34:317–334. doi: 10.1146/annurev-immunol-032414-112056. [DOI] [PubMed] [Google Scholar]
- 17.Sharma G, Holt RA. T-cell epitope discovery technologies. Hum Immunol. 2014;75:514–519. doi: 10.1016/j.humimm.2014.03.003. [DOI] [PubMed] [Google Scholar]
- 18.Wang P, et al. Peptide binding predictions for HLA DR, DP and DQ molecules. BMC Bioinformatics. 2010;11:568. doi: 10.1186/1471-2105-11-568. [DOI] [PMC free article] [PubMed] [Google Scholar]
- 19.Mahomed H, et al. Predictive factors for latent tuberculosis infection among adolescents in a high-burden area in South Africa. Int J Tuberc Lung Dis. 2011;15:331–336. [PubMed] [Google Scholar]
- 20.Han A, et al. Dietary gluten triggers concomitant activation of CD4+ and CD8+ αβ T cells and γδ T cells in celiac disease. Proc Natl Acad Sci USA. 2013;110:13073–13078. doi: 10.1073/pnas.1311861110. [DOI] [PMC free article] [PubMed] [Google Scholar]
- 21.Glanville J, et al. Naive antibody gene-segment frequencies are heritable and unaltered by chronic lymphocyte ablation. Proc Natl Acad Sci USA. 2011;108:20066–20071. doi: 10.1073/pnas.1107498108. [DOI] [PMC free article] [PubMed] [Google Scholar]
- 22.Glanville J, et al. Precise determination of the diversity of a combinatorial antibody library gives insight into the human immunoglobulin repertoire. Proc Natl Acad Sci USA. 2009;106:20216–20221. doi: 10.1073/pnas.0909775106. [DOI] [PMC free article] [PubMed] [Google Scholar]
- 23.Hathaway NA, et al. Dynamics and memory of heterochromatin in living cells. Cell. 2012;149:1447–1460. doi: 10.1016/j.cell.2012.03.052. [DOI] [PMC free article] [PubMed] [Google Scholar]
Associated Data
This section collects any data citations, data availability statements, or supplementary materials included in this article.
Supplementary Materials
Data Availability Statement
All data that support the findings of this study are provided as Supplementary Data.


