

Abstract
Deep analysis of regulative mechanisms of transcription and translation in eukaryotes could improve knowledge of many genetic pathologies such as retinitis pigmentosa (RP). New layers of complexity have recently emerged with the discovery that ‘junk’ DNA is transcribed and, among these, miRNAs have assumed a preponderant role. We compared changes in the expression of miRNAs obtained from whole transcriptome analyses, between two groups of retinal pigment epithelium (RPE) cells, one untreated and the other exposed to the oxidant agent oxidized low‐density lipoprotein (oxLDL), examining four time points (1, 2, 4 and 6 h). We found that 23 miRNAs exhibited altered expression in the treated samples, targeting genes involved in several biochemical pathways, many of them associated to RP for the first time, such as those mediated by insulin receptor signaling and son of sevenless. Moreover, five RP causative genes (KLHL7, RDH11,CERKL, AIPL1 and USH1G) emerged as already validated targets of five altered miRNAs (hsa‐miR‐1307, hsa‐miR‐3064, hsa‐miR‐4709, hsa‐miR‐3615 and hsa‐miR‐637), suggesting a tight connection between induced oxidative stress and RP development and progression. This miRNA expression analysis of oxidative stress‐induced RPE cells has discovered new regulative functions of miRNAs in RP that should lead to the discovery of new ways to regulate the etiopathogenesis of RP.
Keywords: miRNA, regulation, retina, retinal degeneration, RNA‐Seq
Abbreviations
- AIPL1
aryl hydrocarbon receptor interacting protein like 1
- CERKL
ceramide kinase like
- EDGE
empirical analysis of DGE
- ER
endoplasmic reticulum
- IRS
insulin receptor substrate
- KLHL7
kelch‐like protein 7
- miRNome
miRNA transcriptome
- oxLDL
oxidized low‐density lipoprotein
- RDH11
retinol dehydrogenase 11
- RPE
retinal pigment epithelium
- RP
retinitis pigmentosa
- SOS
son of sevenless
- USH1G
usher syndrome type 1G
Analysis of regulative mechanisms of transcription and translation in eukaryotes is a very challenging task. New layers of complexity are daily discovered, such as the preponderant role in regulative functions of miRNAs. miRNAs represent a group of short non‐coding RNAs that induce transcript degradation or translational inhibition of their target mRNAs, acting as post‐transcriptional regulators of gene expression 1. They assume the role of key regulators of several important biological processes, in both physiological and pathological conditions 2, controlling specific pathways by targeting networks of functionally correlated genes. Alterations of miRNA expression, due to mutations in either the miRNA itself or its target genes, could lead to several pathological conditions such as cancers 3, neurodegenerative and genetic diseases 4. Therefore miRNAs, due to their emerging role as disease biomarkers, might be possible therapeutic targets in human disorders 5.
The retina is the back portion of the eye, photosensitive and able to focus light signals towards the optic nerve first, then towards the brain, after transduction of them into electrical stimuli. This light‐sensitive layer of the eye represents the target of a huge number of human inherited pathologies, such as retinitis pigmentosa (RP) 6. RP is a genetic disease that determines retinal degeneration by inducing a slow and progressive death in photoreceptors and retinal pigment epithelium (RPE) cells 7, leading to loss of ability to transmit to the brain the visual information. The term ‘pigmentosa’ deals with the characteristic appearance, during the advanced states of the disease, of abnormal areas of pigment in the retina. Much evidence supports the role of miRNAs in normal retinal development and functions 8. Alterations of miRNA regulation in conditional Dicer mouse mutant eyes reduce and damage normal development of lens, cornea, retina and optic chiasm 9. Furthermore, post‐developmental disruption of miRNA processing in photoreceptors leads to severe functional impairments 10. Interestingly, the targeted deletion of specific retina‐enriched miRNAs has relevant effects on vertebrate eye 11, such as pathogenic roles in human retinal diseases 12. Nowadays, miRNA expression data come only from the analysis of murine miRNA transcriptome (miRNome) but, due to structural and functional differences between human and mouse retinas, they are not totally useful. Therefore, an improved knowledge of human retina miRNome, especially of patients affected by retinal disease, could lead to a better understanding of the physiopathology of this tissue. In this work, we investigated the complexity of human retina miRNome, analyzing data from human RPE cell transcriptomes. RPE represents a single layer of post‐mitotic cells, acting as both a selective barrier to and a vegetative regulator of the overlying photoreceptor layer, thereby playing a key role in its maintenance. Due to its specific proteins, RPE helps to renew outer segments by phagocytizing the spent discs of photoreceptor outer segments, regulates the trafficking of nutrients and waste products to and from the retina, protects the outer retina from excessive high‐energy light and light‐generated reactive oxygen species and maintains retinal homeostasis through the release of diffusible factors. In detail, we compared miRNA expression changes between two group of RPE cells, one exposed to the oxidant agent oxidized low‐density lipoprotein (oxLDL) and the other untreated, considering four time points (1, 2, 4 and 6 h) over basal one (time zero). oxLDL was chosen because it has already been tested on several neurodegenerative diseases but, above all, because it was seen that high cholesterol level could be linked to RP development and progression 13. The main purpose of our work was to discover which miRNAs changed during oxidative stress induction and what their targets are, in order to better understand how reactive oxygen species might lead to RP development.
Materials and methods
This study was approved by the Ethics Committee of Azienda Policlinico Universitario ‘G. Martino’ Messina.
Cell culture
Human RPE‐derived cells (H‐RPE – human retinal pigment epithelial cells, Clonetics™, Lonza) were maintained at 1 × 10⁶ cells·mL−1 in culture in T‐75 flasks containing RtEGM™ retinal pigment epithelial cell growth medium BulletKit® (Clonetics™, Lonza, Basel, Switzerland) with 2% fetal bovine serum, 100 units·mL−1 of penicillin and 100 μg·mL−1 of streptomycin and incubated at 37 °C with 5% CO2. After 24 h, 100 μg·mL−1 of oxLDL was added to the treated group.
Total RNA sequencing
RNA was extracted by TRIzol™ reagent (Invitrogen, Thermo Fisher Scientific, Waltham, MA, USA), following manufacturer's protocol, and quantified with a Qubit 2.0 fluorimeter by Qubit® RNA assay kit (Thermo Fisher Scientific). Expression analysis was realized comparing human RPE cells treated with 100 μg·mL−1 of oxLDL and untreated ones, both at the moment of treatment and for four different time points (1, 2, 4 and 6 h). Libraries were generated using 1 μg of total RNA and the Ion Total RNA‐Seq Kit v2 (Thermo Fisher Scientific), then purified by Dynabeads® magnetic beads and quantified with a Qubit 2.0 fluorimeter with Qubit dsDNA HS Assay Kit. An appropriate library amount was used for clonal amplification performed with the Ion PI™ Template OT2 200 Kit v2 (Thermo Fisher Scientific) on the Ion One Touch™ 2 System; template‐positive Ion Sphere Particles were enriched with the Ion One Touch™ Enrichment System. Sequencing runs were performed on an Ion Proton™ Sequencer (Ion Torrent technology; Thermo Fisher Scientific), using the Ion PI™ Sequencing 200 Kit v2 and the Ion PI™ Chip Kit v2 (Thermo Fisher Scientific). The experiment was repeated three times.
Quality validation and read mapping
Sequence reads were generated from RPE‐specific cDNA libraries on the Ion Torrent Proton. Obtained raw sequences were filtered to remove low quality reads (average per base Phred score < 28). Furthermore, the reads containing adaptor sequences and low‐quality sequences (reads presenting ambiguous bases denoted as ‘N’) were also trimmed from the raw data. The quality of analyzed data was checked using fastqc (v.0.11.5) and qualimap (v.2.2.1) software. The filtered data were then analyzed by clc genomics workbench v.10.0.1 (Qiagen Aarhus, Denmark; https://www.qiagenbioinformatics.com/products/clc-genomics-workbench/) using Homo sapiens genome hg19 and Ensembl RNA database v.74 as references. RNA‐Seq analysis was conducted using the following settings: quality trim limit = 0.01, ambiguity trim maximum value = 2. Map to annotated reference: minimum length fraction and minimum similarity fraction = 0.8, maximum number of hits/read = 2, type of organism = eukaryote, paired settings =default.
Small RNA analysis
The applied approach counted the different types of small RNAs in the data and compared them with databases of miRNAs or other small RNAs. Once whole RNA‐Seq data were imported, the small RNAs were extracted and counted, in order to create a small RNA sample that could be used for further steps. Sequences were filtered based on length (reads below 15 bp and above 55 bp were discarded) and on minimum sampling count (set at 1). The aligned and selected reads were grouped on the sequence of the mature miRNAs allowing up to two mismatches within the exact length of the reference mature sequence (i.e. excluding trimming or extension variants). Subsequently, the number of reads mapping on each mature miRNA was counted and then normalized using either the trimmed mean of M‐values (TMM) method 14 or reads per million (CPM). Finally, the small RNA sample produced when counting the tags was enriched by comparing the tag sequences with the annotation resources miRBase (v21) and Ensembl non‐coding RNA database (v74).
Gene expression and statistical analysis
The original expression values were log2 transformed and normalized in order to ensure that samples are comparable and assumptions on the data for analysis are met 15. In order to highlight the miRNAs with different level of expression between untreated and treated samples, and for the four considered time points, we categorized them into two groups, based on count ratios (fold‐change): (a) up‐regulated (fold change > 1); (b) down‐regulated (0 < fold change < 1). Furthermore, because the fold changes are linear, for any value smaller than 1 (i.e. for down‐regulation), we chose to replace the value by its negative reciprocal value, in order to make the variation more noticeable (for instance, 2‐fold downregulation is indicated by a value of ‐2 instead of 0.5). Due to the few biological replicates available for each of the experimental groups studied (only three replicates for each considered time point), but with many features to be studied simultaneously (miRNAs in a whole transcriptome), we applied the empirical analysis of DGE (EDGE) statistical algorithm, which implements the ‘exact test’ for two‐group comparisons developed by Robinson and Smyth 16. The test is based on the assumption that the count data follow a negative binomial distribution, which in contrast to the Poisson distribution has the characteristic that it allows for a non‐constant mean–variance relationship. The ‘exact test’ of Robinson and Smyth is similar to Fisher's exact test, but also accounts for over‐dispersion caused by biological variability. The miRNAs uniquely identified in the RPE cells with at least five unique gene reads, greater than one‐fold (up‐regulated) or lower than one‐fold (down‐regulated) changes in expression based on the ratio of expression values, and with Bonferroni‐adjusted P values lower than 0.05 were selected for functional categorization of differentially expressed miRNAs.
Validation of miRNAs by qRT‐PCR
To confirm the transcriptome results, the 23 analyzed miRNA were validated by qRT‐PCR. Complementary DNA synthesis from miRNA samples was performed using the miScript II RT Kit and HiSpec Buffer (Qiagen). The obtained cDNA was subjected to the RT‐PCR in the ABI 7500 fast sequence detection system (Applied Biosystems, Thermo Fisher Scientific), using the BRYT‐Green based PCR reaction. PCR amplification was performed in a total reaction mixture of 20 μL, containing 20 ng cDNA, 10 μL 2× GoTaq1qPCR Master Mix (Promega, Madison, WI, USA) and 0.2 μm of each primer. The PCR was run with the standard thermal cycle conditions using the two‐step qRT‐PCR method: an initial denaturation at 95 °C for 30 s, followed by 40 cycles of 30 s at 95 °C and 30 s at 60 °C. Each reaction was run in triplicate, considering all selected time points (1, 2, 4 and 6 h), and the average threshold cycle (C t) was calculated for each replicate. The expression of miRNAs was calculated relative to the expression level of the endogenous control U6, and the relative expression of a gene was calculated using the method. The correlation of the fold‐change of the gene expression ratios between qRT‐PCR and RNA‐Seq was checked by linear regression analysis in spss Statistics v24.0 software (IBM Corp., Armonk, NY, USA).
miRNA target identification and pathway analysis
Obtained miRNAs were firstly analyzed by the experimentally validated miRNA‐target interactions database miRTarBase (http://mirtarbase.mbc.nctu.edu.tw) 17, and then investigated by microT v5.0 (http://diana.imis.athena-innovation.gr) 18 web‐based prediction software, in order to discover new potential targets. Once targets were obtained, a pathway analysis of selected miRNAs was performed by diana‐mirpath v3.0 (http://snf-515788.vm.okeanos.grnet.gr) 19 and cluego cytoscape plugin 20.
Results
Sequencing analysis and mapping statistics
RNA sequencing carried out with Ion Torrent yielded a total of 11 214 300 quality reads (mean mapping quality = 32.92) with mean read length of 155.03 bp. All reads were previously aligned to GRCh37/hg19 reference assembly, and then to known human miRNAs (miRBase v21) 21 and GRCh37 non‐coding RNAs 22. About 71 500 small RNAs were founded in all samples, 69 158 of which were annotated and about 2341 unannotated. In details, 23 miRNAs, each one considered as a ‘group’ made of known precursors and/or mature miRNAs resulting from mapping (Table 1), showed expression alterations at the analyzed time points (Table S1). All previous mapping statistics are based on average values calculated for all three replicates in each time point. Detailed information on RNA‐Seq statistics are available in Table 2.
Table 1.
Altered miRNAs with ranking. The RNA‐Seq analysis highlighted the 23 grouped miRNAs (mature, precursors and precursor variants) with expression alterations, ranked on their abundance (based on read count). As seen in table, the 10 top‐ranked miRNAs accounted for almost 80% of the total count, and the top five for 60%
| Rank | ID | Sequence | Length (bp) | Count (precursors) | Count (precursors with variants) | Count (mature) | Total |
|---|---|---|---|---|---|---|---|
| 1 | hsa‐mir‐3615 | UCUCUCGGCUCCUCGCGGCUC | 21 | 7 | 13 | 9 | 29 |
| 2 | hsa‐mir‐3654 | GACUGGACAAGCUGAGGAA | 19 | 26 | 6 | 7 | 39 |
| 3 | hsa‐mir‐198 | GGUCCAGAGGGGAGAUAGGUUC | 22 | 8 | 4 | 5 | 17 |
| 4 | hsa‐mir‐5047 | UUGCAGCUGCGGUUGUAAGGU | 21 | 7 | 4 | 5 | 16 |
| 5 | hsa‐mir‐671‐3p | UCCGGUUCUCAGGGCUCCACC | 21 | 9 | 4 | 5 | 18 |
| 6 | hsa‐mir‐1307‐3p | ACUCGGCGUGGCGUCGGUCGUG | 22 | 0 | 7 | 3 | 10 |
| 7 | hsa‐mir‐1181 | CCGUCGCCGCCACCCGAGCCG | 21 | 3 | 1 | 2 | 6 |
| 8 | hsa‐mir‐3655 | GCUUGUCGCUGCGGUGUUGCU | 21 | 0 | 3 | 2 | 5 |
| 9 | hsa‐mir‐4315 | CCGCUUUCUGAGCUGGAC | 18 | 2 | 1 | 2 | 5 |
| 10 | hsa‐mir‐7705 | AAUAGCUCAGAAUGUCAGUUCUG | 23 | 1 | 1 | 2 | 4 |
| 11 | hsa‐mir‐3064‐3p | UUGCCACACUGCAACACCUUACA | 23 | 1 | 0 | 1 | 2 |
| 12 | hsa‐mir‐3198 | GUGGAGUCCUGGGGAAUGGAGA | 22 | 2 | 0 | 1 | 3 |
| 13 | hsa‐mir‐3917 | GCUCGGACUGAGCAGGUGGG | 20 | 1 | 0 | 1 | 2 |
| 14 | hsa‐mir‐4523 | GACCGAGAGGGCCUCGGCUGU | 21 | 1 | 0 | 1 | 2 |
| 15 | hsa‐mir‐4647 | GAAGAUGGUGCUGUGCUGAGGAA | 23 | 1 | 0 | 1 | 2 |
| 16 | hsa‐mir‐4709‐3p | UUGAAGAGGAGGUGCUCUGUAGC | 23 | 0 | 2 | 1 | 3 |
| 17 | hsa‐mir‐4721 | UGAGGGCUCCAGGUGACGGUGG | 22 | 0 | 2 | 1 | 3 |
| 18 | hsa‐mir‐4800‐3p | CAUCCGUCCGUCUGUCCAC | 19 | 1 | 1 | 1 | 3 |
| 19 | hsa‐mir‐6084 | UUCCGCCAGUCGGUGGCCGG | 20 | 1 | 0 | 1 | 2 |
| 20 | hsa‐mir‐637 | ACUGGGGGCUUUCGGGCUCUGCGU | 24 | 1 | 0 | 1 | 2 |
| 21 | hsa‐mir‐6501‐3p | CCAGAGCAGCCUGCGGUAACAGU | 23 | 2 | 0 | 1 | 3 |
| 22 | hsa‐mir‐8085 | UGGGAGAGAGGACUGUGAGGC | 21 | 0 | 1 | 1 | 2 |
| 23 | hsa‐mir‐922 | GCAGCAGAGAAUAGGACUACGUC | 23 | 0 | 1 | 1 | 2 |
| Total | 74 | 51 | 55 | 180 |
Table 2.
RNA‐Seq statistics. Considering the whole experiment, about 6000 small RNAs were detected (average value), of which about 96% was annotated by Ensembl GRCh37 non‐coding RNA database and miRBase, with an average reads count of about 70 000. All average values were calculated considering the means of three replicates for each time point
| Annotation | Small RNA count | Percentage | Read count | Percentage | Perfect matches | Percentage | 1 mismatches | Percentage | 2 mismatches | Percentage |
|---|---|---|---|---|---|---|---|---|---|---|
| Annotated | 5624 | 96 | 69 158 | 96.7 | 2843 | 50.6 | 1549 | 27.5 | 1232 | 21.9 |
| With miRBase (Homo sapiens) | 9 | 0.2 | 115 | 0.2 | 5 | 55.6 | 2 | 22.2 | 2 | 22.2 |
| With Homo_sapiens GRCh37.ncrna | 5615 | 99.8 | 69 043 | 99.8 | 2834 | 50.6 | 1547 | 27.5 | 1230 | 21.9 |
| Unannotated | 235 | 4 | 2341 | 3.3 | ||||||
| Total | 5859 | 100 | 71 499 | 100 |
Expression analysis
The predominant length of the resulting mature miRNAs was 21 bp. We identified a total of 55 mature miRNAs with an average expression level of three reads across all considered treated and untreated RPE cells cultures (Table 1). The variability was low across samples, with an expected higher trend for miRNAs expressed at lower levels. As highlighted in Table 3 and in Fig. 1, there are few values of fold‐change that repeat during analyzed time points, with the highest value of 3.7 reached by mir‐3654. Interestingly, we found five clusters of miRNAs showing particular trends through analyzed time points. Cluster 1 (mir‐1307, mir‐3198‐2, mir‐4315, mir‐4721 and mir‐6501) showed a small decrease (fold change = −0.2) in treated samples after 1 h, followed by a greater diminution (fold change = −2.3) from 2 h up to 6 h. Cluster 2, showing the highest number of deregulated miRNAs (mir‐1181, mir‐198, mir‐3064, mir‐3615, mir‐3917, mir‐637, mir‐671, mir‐8085 and mir‐922), evidenced a small increase (fold change = +0.2) in treated samples after 1 h, then increased (fold change = +2.3) up to 2 h, and finally diminished to a similar extent (fold change = −2.3) at 4 h, remaining unchanged up to 6 h. Cluster 4 (mir‐4523, mir‐4647, mir‐6084 and mir‐7705) showed a small increase (fold change = +0.2) in treated samples after 1 h, remained constant up to 2 h, then increased noticeably (fold change = +2.3) at 4 h, and decreased again (fold change = −2.3) at 6 h. Cluster 5 (mir‐3655, mir‐4709, mir‐4800 and mir‐5047) showed a small increase (fold change = +0.2) in treated samples after 1 h, remained constant up to 4 h, then increased noticeably (fold change = +2.3) at 6 h. Cluster 3, made of the single mir‐3654, presented a small increase (fold change = +0.3) in treated samples after 1 h, remained constant up to 4 h, then increased noticeably (fold change = +3.7) at 6 h (Fig. 1). We ranked the expressed miRNAs based on their abundance (Table 1). The 10 top‐ranked miRNAs accounted for almost 80% of the total count and the top five for 60%.
Table 3.
miRNA expression variations throughout all analyzed time points. All 23 selected miRNAs showed particular fold‐change trends, between treated and untreated samples, during considered time points (0, 1, 2, 4 and 6 h), with a few values that are repeats. The whole results were statistically validated by Bonferroni‐corrected EDGE test, and P values are reported
| Sequence | Length | Name | 0 h vs 1 h | EDGE test (P value), Bonferroni corrected | 1 h vs 2 h | EDGE test (P value), Bonferroni corrected | 2 h vs 4 h | EDGE test (P value), Bonferroni corrected | 4 h vs 6 h | EDGE test (P value), Bonferroni corrected | 1 h vs 4 h | EDGE test (P value), Bonferroni corrected | 1 h vs 6 h | EDGE test (P value), Bonferroni corrected | 2 h vs 6 h | EDGE test (P value), Bonferroni corrected |
|---|---|---|---|---|---|---|---|---|---|---|---|---|---|---|---|---|
| CCGUCGCCGCCACCCGAGCCG | 21 | hsa‐mir‐1181 | 0.166666667 | 3.65711 × 10⁻⁵ | 2.332680923 | 3.65711 × 10⁻⁵ | −2.332680923 | 3.65711 × 10⁻⁵ | 1 | 4.74338 × 10⁻²⁰ | 1 | 0 | 1 | 4.74338 × 10⁻²⁰ | −2.332680923 | 3.65711 × 10⁻⁵ |
| ACUCGGCGUGGCGUCGGUCGUG | 22 | hsa‐mir‐1307‐3p | −0.166666667 | 3.65711 × 10⁻⁵ | −2.332680923 | 3.65711 × 10⁻⁵ | 1 | 0 | 1 | 4.74338 × 10⁻²⁰ | −2.332680923 | 3.65711 × 10⁻⁵ | −2.332680923 | 3.65711 × 10⁻⁵ | 1 | 4.74338 × 10⁻²⁰ |
| GGUCCAGAGGGGAGAUAGGUUC | 22 | hsa‐mir‐198 | 0.166666667 | 3.65711 × 10⁻⁵ | 2.332680923 | 3.65711 × 10⁻⁵ | −2.332680923 | 3.65711 × 10⁻⁵ | 1 | 3.65711 × 10⁻⁵ | 1 | 0 | 1 | 3.65711 × 10⁻⁵ | −2.332680923 | 4.74338 × 10⁻²⁰ |
| UUGCCACACUGCAACACCUUACA | 23 | hsa‐mir‐3064‐3p | 0.166666667 | 3.65711 × 10⁻⁵ | 2.332680923 | 3.65711 × 10⁻⁵ | −2.332680923 | 3.65711 × 10⁻⁵ | 1 | 4.74338 × 10⁻²⁰ | 1 | 0 | 1 | 4.74338 × 10⁻²⁰ | −2.332680923 | 3.65711 × 10⁻⁵ |
| GUGGAGUCCUGGGGAAUGGAGA | 22 | hsa‐mir‐3198 | −0.166666667 | 3.65711 × 10⁻⁵ | −2.332680923 | 3.65711 × 10⁻⁵ | 1 | 0 | 1 | 4.74338 × 10⁻²⁰ | −2.332680923 | 3.65711 × 10⁻⁵ | −2.332680923 | 3.65711 × 10⁻⁵ | 1 | 4.74338 × 10⁻²⁰ |
| UCUCUCGGCUCCUCGCGGCUC | 21 | hsa‐mir‐3615 | 0.166666667 | 3.65711 × 10⁻⁵ | 2.332680923 | 3.65711 × 10⁻⁵ | −2.332680923 | 0 | 1 | 4.74338 × 10⁻²⁰ | 1 | 3.65711 × 10⁻⁵ | 1 | 3.65711 × 10⁻⁵ | −2.332680923 | 4.74338 × 10⁻²⁰ |
| GACUGGACAAGCUGAGGAA | 19 | hsa‐mir‐3654 | 0.333333333 | 0.000182855 | 1 | 0.000182855 | 1 | 7.31422 × 10⁻⁵ | 3.694855996 | 0.000109713 | 1 | 0.000109713 | 3.694855996 | 4.74338 × 10⁻²⁰ | 3.694855996 | 0.000182855 |
| GCUUGUCGCUGCGGUGUUGCU | 21 | hsa‐mir‐3655 | 0.166666667 | 3.65711 × 10⁻⁵ | 1 | 3.65721 × 10⁻⁵ | 1 | 0 | 2.334587154 | 4.74338 × 10⁻²⁰ | 1 | 3.65711 × 10⁻⁵ | 2.334587154 | 3.65711 × 10⁻⁵ | 2.334587154 | 4.74338 × 10⁻²⁰ |
| GCUCGGACUGAGCAGGUGGG | 20 | hsa‐mir‐3917 | 0.166666667 | 3.65711 × 10⁻⁵ | 2.332680923 | 3.65711 × 10⁻⁵ | −2.332680923 | 3.65711 × 10⁻⁵ | 1 | 4.74338 × 10⁻²⁰ | 1 | 0 | 1 | 4.74338 × 10⁻²⁰ | −2.332680923 | 3.65711 × 10⁻⁵ |
| CCGCUUUCUGAGCUGGAC | 18 | hsa‐mir‐4315 | −0.166666667 | 3.65711 × 10⁻⁵ | −2.332680923 | 3.65711 × 10⁻⁵ | 1 | 0 | 1 | 4.74338 × 10⁻²⁰ | −2.332680923 | 3.65711 × 10⁻⁵ | −2.332680923 | 3.65711 × 10⁻⁵ | 1 | 4.74338 × 10⁻²⁰ |
| GACCGAGAGGGCCUCGGCUGU | 21 | hsa‐mir‐4523 | 0.166666667 | 0 | 1 | 0 | 2.332680923 | 3.65711 × 10⁻⁵ | −2.332680923 | 3.65711 × 10⁻⁵ | 2.332680923 | 3.65711 × 10⁻⁵ | 1 | 4.74338 × 10⁻²⁰ | 1 | 4.74338 × 10⁻²⁰ |
| GAAGAUGGUGCUGUGCUGAGGAA | 23 | hsa‐mir‐4647 | 0.166666667 | 0 | 1 | 0 | 2.332680923 | 3.65711 × 10⁻⁵ | −2.332680923 | 3.65711 × 10⁻⁵ | 2.332680923 | 3.65711 × 10⁻⁵ | 1 | 4.74338 × 10⁻²⁰ | 1 | 4.74338 × 10⁻²⁰ |
| UUGAAGAGGAGGUGCUCUGUAGC | 23 | hsa‐mir‐4709‐3p | 0.166666667 | 0 | 1 | 0 | 1 | 3.65711 × 10⁻⁵ | 2.335287929 | 3.65711 × 10⁻⁵ | 1 | 3.65711 × 10⁻⁵ | 2.335287929 | 4.74338 × 10⁻²⁰ | 2.335287929 | 4.74338 × 10⁻²⁰ |
| UGAGGGCUCCAGGUGACGGUGG | 22 | hsa‐mir‐4721 | −0.166666667 | 3.65711 × 10⁻⁵ | −2.332680923 | 3.65711 × 10⁻⁵ | 1 | 0 | 1 | 4.74338 × 10⁻²⁰ | −2.332680923 | 3.65711 × 10⁻⁵ | −2.332680923 | 3.65711 × 10⁻⁵ | 1 | 4.74338 × 10⁻²⁰ |
| CAUCCGUCCGUCUGUCCAC | 19 | hsa‐mir‐4800‐3p | 0.166666667 | 3.65711 × 10⁻⁵ | 1 | 3.65711 × 10⁻⁵ | 1 | 3.65711 × 10⁻⁵ | 2.338006877 | 4.74338 × 10⁻²⁰ | 1 | 0 | 2.338006877 | 4.74338 × 10⁻²⁰ | 2.338006877 | 3.65711 × 10⁻⁵ |
| UUGCAGCUGCGGUUGUAAGGU | 21 | hsa‐mir‐5047 | 0.166666667 | 3.65711 × 10⁻⁵ | 1 | 3.65731 × 10⁻⁵ | 1 | 0 | 2.335287929 | 4.74338 × 10⁻²⁰ | 1 | 3.65711 × 10⁻⁵ | 2.335287929 | 3.65711 × 10⁻⁵ | 2.335287929 | 4.74338 × 10⁻²⁰ |
| UUCCGCCAGUCGGUGGCCGG | 20 | hsa‐mir‐6084 | 0.166666667 | 0 | 1 | 0 | 2.332680923 | 3.65711 × 10⁻⁵ | −2.332680923 | 3.65711 × 10⁻⁵ | 2.332680923 | 3.65711 × 10⁻⁵ | 1 | 4.74338 × 10⁻²⁰ | 1 | 4.74338 × 10⁻²⁰ |
| ACUGGGGGCUUUCGGGCUCUGCGU | 24 | hsa‐mir‐637 | 0.166666667 | 3.65711 × 10⁻⁵ | 2.332680923 | 3.65711 × 10⁻⁵ | −2.332680923 | 3.65711 × 10⁻⁵ | 1 | 4.74338 × 10⁻²⁰ | 1 | 0 | 1 | 4.74338 × 10⁻²⁰ | −2.332680923 | 3.65711 × 10⁻⁵ |
| CCAGAGCAGCCUGCGGUAACAGU | 23 | hsa‐mir‐6501‐3p | −0.166666667 | 3.65711 × 10⁻⁵ | −2.332680923 | 3.65711 × 10⁻⁵ | 1 | 0 | 1 | 4.74338 × 10⁻²⁰ | −2.332680923 | 3.65711 × 10⁻⁵ | −2.332680923 | 3.65711 × 10⁻⁵ | 1 | 4.74338 × 10⁻²⁰ |
| UCCGGUUCUCAGGGCUCCACC | 21 | hsa‐mir‐671‐3p | 0.166666667 | 3.65711 × 10⁻⁵ | 2.332680923 | 3.65711 × 10⁻⁵ | −2.332680923 | 0 | 1 | 4.74338 × 10⁻²⁰ | 1 | 3.65711 × 10⁻⁵ | 1 | 3.65711 × 10⁻⁵ | −2.332680923 | 4.74338 × 10⁻²⁰ |
| AAUAGCUCAGAAUGUCAGUUCUG | 23 | hsa‐mir‐7705 | 0.166666667 | 0 | 1 | 0 | 2.332680923 | 3.65711 × 10⁻⁵ | −2.332680923 | 3.65711 × 10⁻⁵ | 2.332680923 | 3.65711 × 10⁻⁵ | 1 | 4.74338 × 10⁻²⁰ | 1 | 4.74338 × 10⁻²⁰ |
| UGGGAGAGAGGACUGUGAGGC | 21 | hsa‐mir‐8085 | 0.166666667 | 3.65711 × 10⁻⁵ | 2.332680923 | 3.65711 × 10⁻⁵ | −2.332680923 | 3.65711 × 10⁻⁵ | 1 | 4.74338 × 10⁻²⁰ | 1 | 0 | 1 | 4.74338 × 10⁻²⁰ | −2.332680923 | 3.65711 × 10⁻⁵ |
| GCAGCAGAGAAUAGGACUACGUC | 23 | hsa‐mir‐922 | 0.166666667 | 3.65711 × 10⁻⁵ | 2.332680923 | 3.65711 × 10⁻⁵ | −2.332680923 | 3.65711 × 10⁻⁵ | 1 | 4.74338 × 10⁻²⁰ | 1 | 0 | 1 | 4.74338 × 10⁻²⁰ | −2.332680923 | 3.65711 × 10⁻⁵ |
Figure 1.
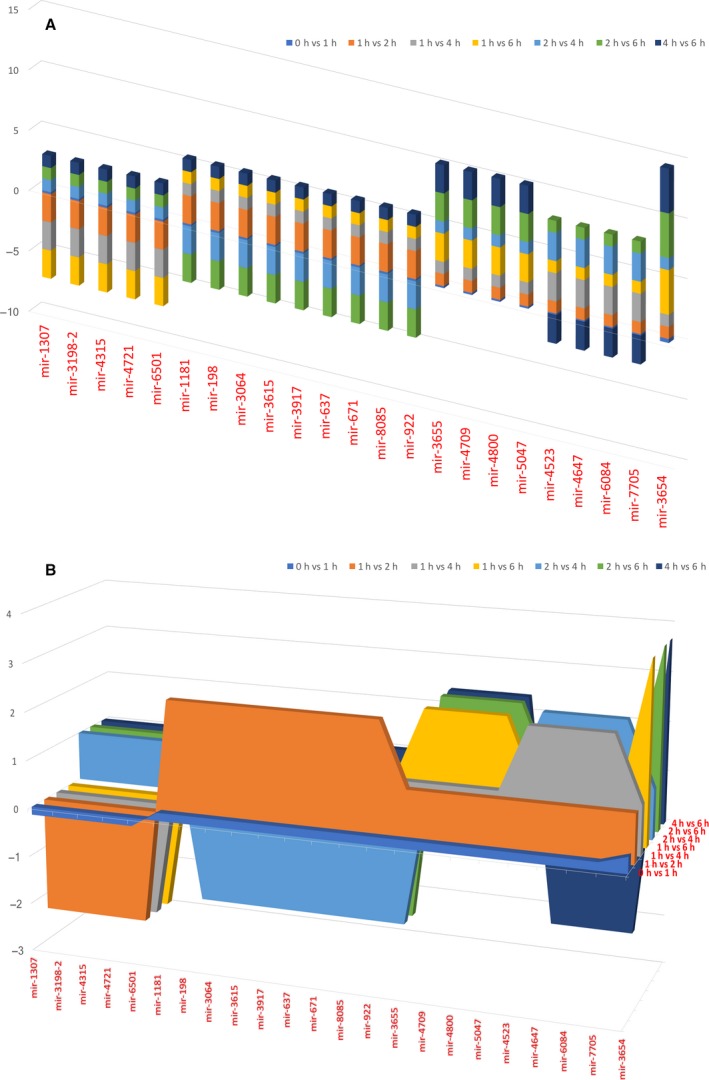
Bar graph and 3D area graph of miRNA fold‐change trends during analyzed time points. 3D bar graph (A) and 3D area graph (B) of selected miRNA fold‐change throughout all considered time points. Five clusters emerged from the analysis: the first two exhibited an opposite trend, globally negative for cluster 1 (mir‐1307, mir‐3198‐2, mir‐4315, mir‐4721, mir‐6501) and globally positive for cluster 2 (mir‐1181, mir‐198, mir‐3064, mir‐3615, mir‐3917, mir‐637, mir‐671, mir‐8085, mir‐922); the last two clusters evidenced a strong positive trend, greater in cluster 5 (mir‐3655, mir‐4709, mir‐4800, mir‐5047) than in cluster 4 (mir‐4523, mir‐4647, mir‐6084, mir‐7705). The only cluster with its own individual trend was the third, made of the single mir‐3654, with a globally slightly positive trend, which did not show noticeable changes due to the opposite expression differences in the last two time points. For any value smaller than 1, we chose to replace the value by its negative reciprocal value, in order to make the variation more noticeable. More details on single miRNA expressions are presented in Table 3.
qRT‐PCR verification
To validate the authenticity and reproducibility of the RNA‐Seq results, the 23 analyzed miRNAs were selected for qRT‐PCR analysis, and the obtained expression profiles were similar to the results of transcriptome analysis (data not shown). The linear regression analysis showed a significantly positive correlation of the relationship between gene expression ratios of qRT‐PCR and RNA‐Seq for all selected time points (Fig. 2), confirming our transcriptomic data validity.
Figure 2.
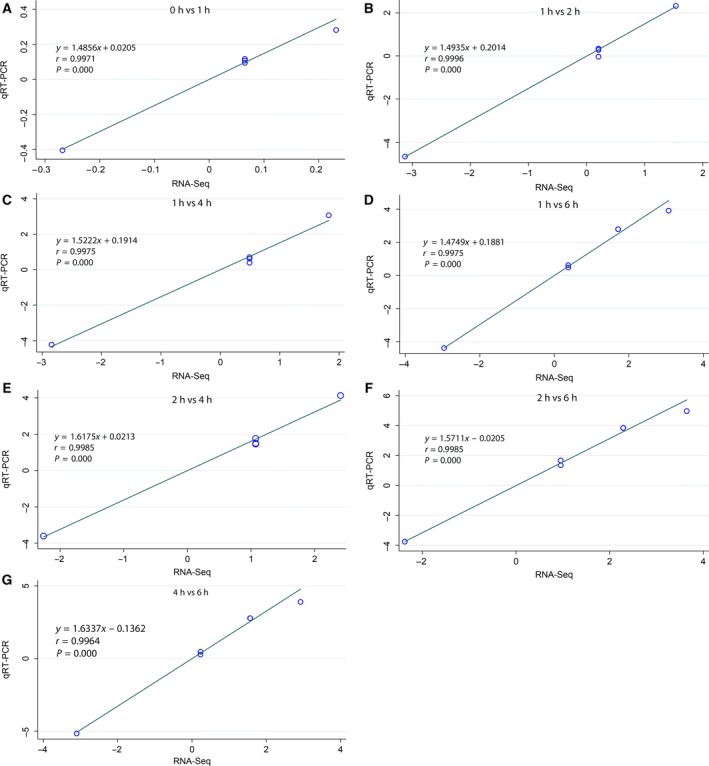
Correlation analysis of fold‐change data between qRT‐PCR and RNA‐Seq. Data from qRT‐PCR and RNA‐Seq are means of three replicates, considering all selected time points (A, B, C, D, E, F, G). Scatterplots were generated by the fold‐change values from RNA‐Seq (x‐axis) and qRT‐PCR (y‐axis).
miRNA target identification and pathway analysis
There were 1402 genes that were experimentally validated targets of 23 miRNAs found altered in miR TarBase. Five miRNAs (hsa‐miR‐1307‐3p, hsa‐miR‐3064‐3p, hsa‐miR‐4709‐3p, hsa‐miR‐3615 and hsa‐miR‐637) are able to regulate five already known RP causative genes [Kelch‐like protein 7 (KLHL7), retinol dehydrogenase 11 (RDH11), ceramide kinase like (CERKL), aryl hydrocarbon receptor interacting protein like 1 (AIPL1) and usher syndrome type 1G (USH1G)], as demonstrated by high‐throughput sequencing of RNA isolated by cross‐linking immunoprecipitation; photoactivatable‐ribonucleoside‐enhanced cross‐linking and immunoprecipitation; and crosslinking, ligation and sequencing of hybrids. Eight hundred and ten genes, instead, were common to those that emerged from microT prediction, which in total showed 7351 target genes. Subsequently, mirPath Kyoto Encyclopedia of Genes and Genomes (KEGG) analysis showed a statistically significant association between six analyzed miRNAs (hsa‐miR‐3615, hsa‐miR‐922, hsa‐miR‐4523, hsa‐miR‐671‐3p, hsa‐miR‐198 and hsa‐miR‐1307‐3p) and ‘NF‐kappa B signaling pathway’, and two miRNAs (hsa‐miR‐922 and hsa‐miR‐1307‐3p) showed association with ‘fatty acids biosynthesis and metabolism’. mirPath gene ontology (GO) analysis, instead, showed a statistically significant association between six miRNAs (hsa‐miR‐3615, hsa‐miR‐922, hsa‐miR‐637, hsa‐miR‐671‐3p, hsa‐miR‐198 and hsa‐miR‐1307‐3p) and four categories (‘cellular nitrogen compound’, ‘metabolic process’, ‘organelle’, and ‘RNA binding and poly(A) RNA binding’), five miRNAs (hsa‐miR‐3615, hsa‐miR‐922, hsa‐miR‐637, hsa‐miR‐198 and hsa‐miR‐1307‐3p) and three categories (‘cytosol’, ‘biosynthetic process’ and ‘mitotic cell cycle’), and four miRNAs (hsa‐miR‐3615, hsa‐miR‐922, hsa‐miR‐198 and hsa‐miR‐1307‐3p) and six categories (‘gene expression’, ‘nucleoplasm’, ‘protein complex’, ‘molecular function’ and ‘cellular component’). Detailed results are available in Table S2 and Fig. 3. Once we had obtained experimental validated pathways, we enriched previously gathered data with pathway analysis based on miRTarBase and microT common gene targets, realized by cytoscape and its plugin cluego. Pathways with the highest number of involved miRNA‐regulated genes could be clustered in ‘intracellular organelle’, ‘regulation of cellular process’, ‘organic cyclic, hetero cycle, cellular nitrogen and aromatic compounds metabolic process’, ‘protein metabolic process’, ‘nucleic acid binding’, ‘macromolecule modification’, ‘regulation of transcription’, ‘regulation of response to stimulus’, ‘proteosomal cleavage of substrate’, ‘insulin receptor substrate (IRS) – and son of sevenless (SOS) ‐mediated signaling’, ‘endoplasmic reticulum (ER)–phagosome pathway ‘, ‘inflammation’, ‘ABC‐transporters disorders’, and ‘signaling by Hedgehog’. Detailed pathways, including the exact number of involved genes, are shown in Fig. 4.
Figure 3.
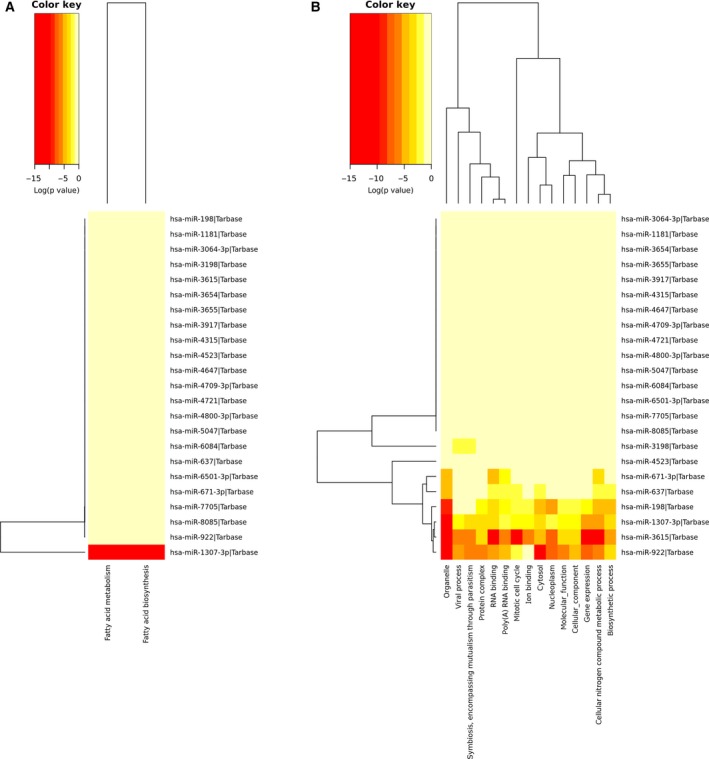
Hierarchical clustering of features by mirPath analysis. As evidenced in heat maps from KEGG (A) and GO (B) mirPath analysis, several predicted pathways (two for KEGG, 15 for GO) were statistically associated to considered miRNAs.
Figure 4.
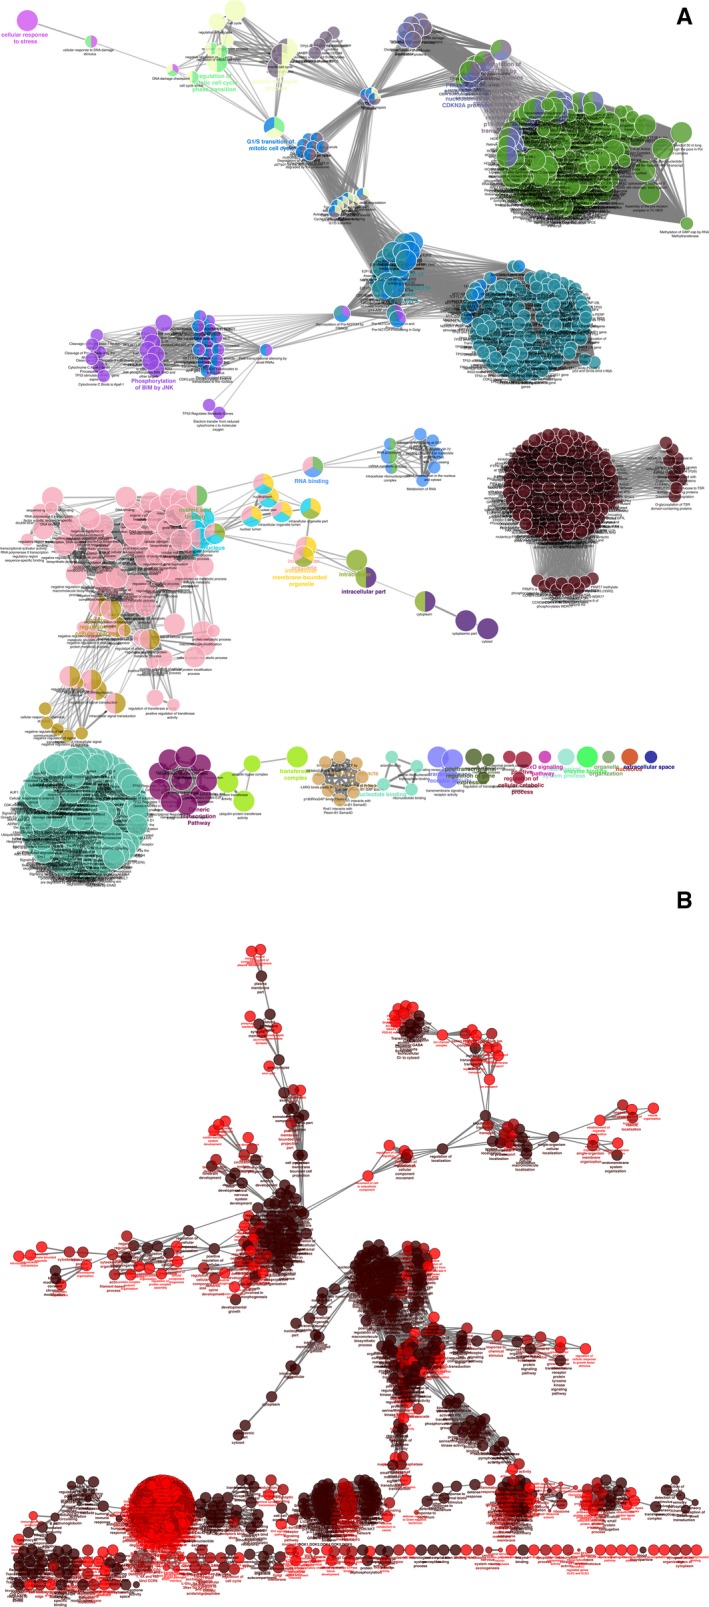
cluego pathway analysis of miRNAs target genes from miRTarBase and microT databases. cluego analysis highlighted a rich and very clustered network of possible involved pathways for both miRTarBase validated targets (A) and microT predicted ones (B). Details are given in Table S3.
Discussion
Retinitis pigmentosa is an ocular disease with very heterogeneous phenotypes with unusually complex molecular genetic causes 23. Such an intricate picture, primarily determined by locus and allelic heterogeneity 24, is worsened by the actual lack of knowledge on all possible causative genes and their function. Moreover, little is known about involvement of regulative non‐coding RNAs 25, which are already considered the most promising targets of experimental therapies 26. Using high‐throughput sequencing technologies, we analyzed the whole transcriptome of RPE cells treated with oxLDL during a follow‐up of four time points (1, 2, 4 and 6 h) after exposure, and compared the results with untreated cells. Due to the high coverage of our sequencing experiment, we were able to detect miRNAs and sequence variants that had a low level of expression. Furthermore, the parallel analysis of three replicates for each selected group for each time point, along with a specific statistical test, allowed us to obtain reliable data, overcoming possible bias‐related variability in miRNA expression levels and nucleotide sequences. Oxidative stress plays a critical role in the etiopathogenesis of RP 27, leading to pathobiological changes including outer blood–retina barrier breakdown and senescence of RPE cells 28. RPE cells are very susceptible to oxidative stress, due to high metabolic activity, including physiological phagocytosis and life‐long light illumination 29. Therefore, as high cholesterol could be linked to RP development and progression 30, oxLDL could represent the source of pathobiological changes of RPE cells 31, such as outer blood–retina barrier dysfunction 32, inhibition of processing of photoreceptor outer segments by RPE 33, expression of transforming growth factor‐β 2 34, synthesis alterations of extracellular matrix components 35, increasing RPE apoptosis 36 and senescence changes 31. Moreover, several miRNAs were already associated to retinal development and function in vertebrates, such as miR‐216a and miR‐23a 37, 38, although at very low levels. Following these data, we noticed that about 74% of miRNAs found showed an average read count of 2 or even 1. The meaning of this observation could be that miRNAs with relatively low expression levels can play a tissue‐specific physiological role, underlining the importance of a high‐coverage for the study of human tissues. Furthermore, the analysis of miRNA sequence diversity indicated that a wide range of variants (with the highest peak of 13 precursor variants for hsa‐mir‐3615) are expressed in RPE cells, bearing different and often composite sequence modifications, many of which probably happened after oxidative stress induction. In order to evaluate how oxLDL could regulate miRNA expression, we hypothesized a possible ‘dual’ mechanism, direct and not. It was seen, from whole transcriptome analysis data, that DICER1 was globally up‐regulated after induced oxidative stress. In detail, it showed the following fold‐change trend: 1 h → 2.181, 2 h → 2.614, 4 h → 1 and 6 h → 2.799. Therefore, the oxLDL probably regulates miRNAs both directly (especially as shown by down‐regulated miRNAs) and indirectly by Dicer (particularly when it is up‐regulated and over‐expresses miRNAs). Interestingly, the five clusters of selected miRNAs showed particular pairings: the first two clusters exhibited an opposite trend, globally negative for cluster 1, and globally positive for cluster 2; the last two cluster evidenced a strong positive trend, greater in cluster 5 than in cluster 4; the only cluster with its own individual trend was the third, with a globally slightly positive trend, which did not noticeably change, due to the opposite expression differences in the last two time points. In detail, basing on mirPath, the only ubiquitous miRNA is hsa‐mir‐1307, whose contribution could determine a decrease in all resultant pathways. However, because it is the only down‐expressed miRNA throughout all the time points, its role might be considered less decisive than the others. Therefore, a possible dysregulation of the nuclear factor kappa‐light‐chain‐enhancer of activated B cells (NF‐κB) signaling pathway emerged, a pathway already associated to retinal degeneration 39, 40, along with fatty acid metabolism, known to be one of the most involved pathways in RP 41 and its particular forms, such as Stargardt syndrome 42. Moreover, several new interesting pathways could be altered by the analyzed miRNAs, as emerged from target gene predictions. Cellular nitrogen compound metabolic processes seems to be impaired, as already highlighted in aqueous humor and peripheral blood of RP patients 43, leading to nitrosative stress. Additionally, alterations of metabolic processes involving organic cyclic, cellular aromatic and heterocycle compounds, such as reaction intermediates of the retinoid cycle, could lead to retinal degeneration 44. Furthermore, three signaling pathways were predicted to be altered by selected miRNA dysregulation: insulin receptor signaling, possibly related to glucose sequestration by RPE in RP dominant subjects 45, SOS‐mediated signaling, already associated to ocular manifestations in Noonan syndrome 46, 47, and Hedgehog signaling, whose impairments could lead to ciliary trafficking defects 48. The described pathways along with ABC‐transporter disorders 49, inflammation 50, ER–phagosome pathways 51 and the ubiquitin proteasome pathway 52 represent all possible targets of miRNA regulation in RPE cells. Finally, miRTarBase showed experimentally verified gene targets of several considered miRNAs, already known to be causative of different forms of RP: KLHL7 (target of hsa‐miR‐1307), whose mutations could determine alterations in ubiquitination of target proteins for proteasome‐mediated degradation 53; RDH11 (target ofhsa‐miR‐3064), encoding a fundamental enzyme needed for vision‐related and systemic retinoic acid metabolism 54; CERKL (target of hsa‐miR‐4709), encoding an antioxidant protein that is crucial to photoreceptor survival 55, 56; AIPL1 (target of hsa‐miR‐3615), whose mutations cause various form of recessive RP and Leber congenital amaurosis 57; and USH1G (target of hsa‐miR‐637), one of best known causative gene of Usher syndrome type I 58.
Conclusions
We analyzed whole transcriptomes of two group of RPE cells, treated with oxLDL and untreated, comparing miRNA expression changes at four selected time points (1, 2, 4 and 6 h) from time zero. We found that 23 grouped miRNAs exhibited expression alterations in treated samples, targeting genes involved in several biochemical pathways. Most of these, such as fatty acid metabolism and the ubiquitin proteasome pathway, are already known to be directly involved in retinal degenerations. Several others, instead, might be associated for the first time to RP etiopathogenesis, such as IRS‐ and SOS‐mediated pathways. Moreover, five RP causative genes (KLHL7, RDH11, CERKL, AIPL1 and USH1G) emerged as already validated targets of five altered miRNAs (hsa‐miR‐1307, hsa‐miR‐3064, hsa‐miR‐4709, hsa‐miR‐3615 and hsa‐miR‐637), suggesting a tight connection between induced oxidative stress and RP development and progression, thanks to the important junction ring represented by regulative functions of miRNAs. Nevertheless, many other important aspects have to be investigated, such as variant miRNA targets and isomiR, along with predicted target validation. Additionally, we have to underline that predicted miRNA targets resulted from in silico analyses and, even if they are based on statistical significance algorithms and literature data, they will need to be experimentally validated. Furthermore, a deeper transcriptome sequencing on a larger number of samples could permit us to increase the number of detected miRNAs, improving knowledge of regulative functions of these small RNAs and RP.
Author contributions
LD planned experiments and wrote the manuscript; PB contributed reagents; CS performed experiments; CR performed manuscript supervision; RD analyzed data; AS wrote and drafted the manuscript.
Supporting information
Table S1. miRNAs precursors and precursors variants coming from RNA‐Seq analysis.
Table S2. mirPath KEGG and GO analysis.
Table S3. ClueGO detailed pathway analysis of miRNAs target genes from miRTarBase and microT databases.
Table S1. miRNAs precursors and precursors variants coming from RNA‐Seq analysis.
References
- 1. He L and Hannon GJ (2004) MicroRNAs: small RNAs with a big role in gene regulation. Nat Rev Genet 5, 522–531. [DOI] [PubMed] [Google Scholar]
- 2. Zamore PD and Haley B (2005) Ribo‐gnome: the big world of small RNAs. Science 309, 1519–1524. [DOI] [PubMed] [Google Scholar]
- 3. Taylo MA (2015) Circulating MicroRNAs as biomarkers and mediators of cell‐cell communication in cancer. Biomedicines 3, 270–281. [DOI] [PMC free article] [PubMed] [Google Scholar]
- 4. He R, Xie X, Lv L, Huang Y, Xia X, Chen X and Zhang L (2017) Comprehensive investigation of aberrant microRNAs expression in cells culture model of MnCl2‐induced neurodegenerative disease. Biochem Biophys Res Commun 486, 342–348. [DOI] [PubMed] [Google Scholar]
- 5. Huang W (2017) MicroRNAs: biomarkers, diagnostics, and therapeutics. Methods Mol Biol 1617, 57–67. [DOI] [PubMed] [Google Scholar]
- 6. Fahim AT, Daiger SP and Weleber RG (2000) Nonsyndromic retinitis pigmentosa overview In GeneReviews (Adam MP, Ardinger HH, Pagon RA, Wallace SE, Bean LJH, Mefford HC, Stephens K, Amemiya A. and Ledbetter N, eds). University of Washington, Seattle, Seattle, WA. [Google Scholar]
- 7. Zhang Q (2016) Retinitis pigmentosa: progress and perspective. Asia Pac J Ophthalmol (Phila) 5, 265–271. [DOI] [PubMed] [Google Scholar]
- 8. Ohana R, Weiman‐Kelman B, Raviv S, Tamm ER, Pasmanik‐Chor M, Rinon A, Netanely D, Shamir R, Solomon AS and Ashery‐Padan R (2015) MicroRNAs are essential for differentiation of the retinal pigmented epithelium and maturation of adjacent photoreceptors. Development 142, 2487–2498. [DOI] [PubMed] [Google Scholar]
- 9. Akhtar S, Patnaik SR, Kotapati Raghupathy R, Al‐Mubrad TM, Craft JA and Shu X (2015) Histological characterization of the Dicer1 mutant zebrafish retina. J Ophthalmol 2015, 309510. [DOI] [PMC free article] [PubMed] [Google Scholar]
- 10. Sundermeier TR and Palczewski K (2016) The impact of microRNA gene regulation on the survival and function of mature cell types in the eye. FASEB J 30, 23–33. [DOI] [PMC free article] [PubMed] [Google Scholar]
- 11. Saxena K, Rutar MV, Provis JM and Natoli RC (2015) Identification of miRNAs in a model of retinal degenerations. Invest Ophthalmol Vis Sci 56, 1820–1829. [DOI] [PubMed] [Google Scholar]
- 12. Romano GL, Platania CBM, Drago F, Salomone S, Ragusa M, Barbagallo C, Di Pietro C, Purrello M, Reibaldi M, Avitabile T et al (2017) Retinal and circulating miRNAs in age‐related macular degeneration: an in vivo animal and human study. Front Pharmacol 8, 168. [DOI] [PMC free article] [PubMed] [Google Scholar]
- 13. Kaushik S, Tan AG, Mitchell P and Wang JJ (2007) Prevalence and associations of enhanced retinal arteriolar light reflex: a new look at an old sign. Ophthalmology 114, 113–120. [DOI] [PubMed] [Google Scholar]
- 14. Li X, Brock GN, Rouchka EC, Cooper NGF, Wu D, O'Toole TE, Gill RS, Eteleeb AM, O'Brien L and Rai SN (2017) A comparison of per sample global scaling and per gene normalization methods for differential expression analysis of RNA‐seqdata. PLoS ONE 12, e0176185. [DOI] [PMC free article] [PubMed] [Google Scholar]
- 15. Allison DB, Cui X, Page GP and Sabripour M (2006) Microarray data analysis: from disarray to consolidation and consensus. Nat Rev Genet 7, 55–65. [DOI] [PubMed] [Google Scholar]
- 16. Robinson MD and Smyth GK (2008) Small‐sample estimation of negative binomial dispersion, with applications to SAGE data. Biostatistics 9, 321–332. [DOI] [PubMed] [Google Scholar]
- 17. Chou CH, Chang NW, Shrestha S, Hsu SD, Lin YL, Lee WH, Yang CD, Hong HC, Wei TY, Tu SJ et al (2016) miRTarBase 2016: updates to the experimentally validated miRNA‐target interactions database. Nucleic Acids Res 44, D239–D247. [DOI] [PMC free article] [PubMed] [Google Scholar]
- 18. Paraskevopoulou MD, Georgakilas G, Kostoulas N, Vlachos IS, Vergoulis T, Reczko M, Filippidis C, Dalamagas T and Hatzigeorgiou AG (2013) DIANA‐microT web server v5.0: service integration into miRNA functional analysis workflows. Nucleic Acids Res 41, W169–W173. [DOI] [PMC free article] [PubMed] [Google Scholar]
- 19. Vlachos IS, Zagganas K, Paraskevopoulou MD, Georgakilas G, Karagkouni D, Vergoulis T, Dalamagas T and Hatzigeorgiou AG (2015) DIANA‐miRPath v3.0: deciphering microRNA function with experimental support. Nucleic Acids Res 43, W460–W466. [DOI] [PMC free article] [PubMed] [Google Scholar]
- 20. Bindea G, Mlecnik B, Hackl H, Charoentong P, Tosolini M, Kirilovsky A, Fridman WH, Pagès F, Trajanoski Z and Galon J (2009) ClueGO: a Cytoscape plug‐in to decipher functionally grouped gene ontology and pathway annotation networks. Bioinformatics 25, 1091–1093. [DOI] [PMC free article] [PubMed] [Google Scholar]
- 21. Kozomara A and Griffiths‐Jones S (2014) miRBase: annotating high confidence microRNAs using deep sequencing data. Nucleic Acids Res 42, D68–D73. [DOI] [PMC free article] [PubMed] [Google Scholar]
- 22. Guttman M, Amit I, Garber M, French C, Lin MF, Feldser D, Huarte M, Zuk O, Carey BW, Cassady JP et al (2009) Chromatin signature reveals over a thousand highly conserved large non‐coding RNAs in mammals. Nature 458, 223–227. [DOI] [PMC free article] [PubMed] [Google Scholar]
- 23. Daiger SP, Sullivan LS and Bowne SJ (2013) Genes and mutations causing retinitis pigmentosa. Clin Genet 84, 132–141. [DOI] [PMC free article] [PubMed] [Google Scholar]
- 24. Sorrentino FS, Gallenga CE, Bonifazzi C and Perri P (2016) A challenge to the striking genotypic heterogeneity of retinitis pigmentosa: a better understanding of the pathophysiology using the newest genetic strategies. Eye (Lond) 30, 1542–1548. [DOI] [PMC free article] [PubMed] [Google Scholar]
- 25. Zhang LJ, Zhang Y, Dong LJ and Li XR (2012) Expression and function of microRNA in the eye. Zhonghua Yan Ke Za Zhi 48, 1136–1140. [PubMed] [Google Scholar]
- 26. Adams BD, Parsons C, Walker L, Zhang WC and Slack FJ (2017) Targeting noncoding RNAs in disease. J Clin Invest 127, 761–771. [DOI] [PMC free article] [PubMed] [Google Scholar]
- 27. Kruk J, Kubasik‐Kladna K and Aboul‐Enein HY (2015) The role oxidative stress in the pathogenesis of eye diseases: current status and a dual role of physical activity. Mini Rev Med Chem 16, 241–257. [DOI] [PubMed] [Google Scholar]
- 28. Bailey TA, Kanuga N, Romero IA, Greenwood J, Luthert PJ and Cheetham ME (2004) Oxidative stress affects the junctional integrity of retinal pigment epithelial cells. Invest Ophthalmol Vis Sci 45, 675–684. [DOI] [PubMed] [Google Scholar]
- 29. Jo YK, Park SJ, Shin JH, Kim Y, Hwang JJ, Cho DH and Kim JC (2011) ARP101, a selective MMP‐2 inhibitor, induces autophagy‐associated cell death in cancer cells. Biochem Biophys Res Commun 404, 1039–1043. [DOI] [PubMed] [Google Scholar]
- 30. Chakravarthy U, Wong TY, Fletcher A, Piault E, Evans C, Zlateva G, Buggage R, Pleil A and Mitchell P (2010) Clinical risk factors for age‐related macular degeneration: a systematic review and meta‐analysis. BMC Ophthalmol 10, 31. [DOI] [PMC free article] [PubMed] [Google Scholar]
- 31. Mao K, Shu W, Qiu Q, Gu Q and Wu X (2017) Salvianolic acid A protects retinal pigment epithelium from OX‐LDL‐induced inflammation in an age‐related macular degeneration model. Discov Med 23, 129–147. [PubMed] [Google Scholar]
- 32. Kim JH, Lee SJ, Kim KW, Yu YS and Kim JH (2012) Oxidized low density lipoprotein‐induced senescence of retinal pigment epithelial cells is followed by outer blood‐retinal barrier dysfunction. Int J Biochem Cell Biol 44, 808–814. [DOI] [PubMed] [Google Scholar]
- 33. Hoppe G, Marmorstein AD, Pennock EA and Hoff HF (2001) Oxidized low density lipoprotein‐induced inhibition of processing of photoreceptor outer segments by RPE. Invest Ophthalmol Vis Sci 42, 2714–2720. [PubMed] [Google Scholar]
- 34. Yu AL, Lorenz RL, Haritoglou C, Kampik A and Welge‐Lussen U (2009) Biological effects of native and oxidized low‐density lipoproteins in cultured human retinal pigment epithelial cells. Exp Eye Res 88, 495–503. [DOI] [PubMed] [Google Scholar]
- 35. Saneipour M, Ghatreh‐Samani K, Heydarian E, Farrokhi E and Abdian N (2015) Adiponectin inhibits oxidized low density lipoprotein‐induced increase in matrix metalloproteinase 9 expression in vascular smooth muscle cells. ARYA Atheroscler 11, 191–195. [PMC free article] [PubMed] [Google Scholar]
- 36. Yating Q, Yuan Y, Wei Z, Qing G, Xingwei W, Qiu Q and Lili Y (2015) Oxidized LDL induces apoptosis of human retinal pigment epithelium through activation of ERK‐Bax/Bcl‐2 signaling pathways. Curr Eye Res 40, 415–422. [DOI] [PubMed] [Google Scholar]
- 37. Olena AF, Rao MB, Thatcher EJ, Wu SY and Patton JG (2015) miR‐216a regulates snx5, a novel notch signaling pathway component, during zebrafish retinal development. Dev Biol 400, 72–81. [DOI] [PMC free article] [PubMed] [Google Scholar]
- 38. Li DD, Zhong BW, Zhang HX, Zhou HY, Luo J, Liu Y, Xu GC, Luan CS and Fang J (2016) Inhibition of the oxidative stress‐induced miR‐23a protects the human retinal pigment epithelium (RPE) cells from apoptosis through the upregulation of glutaminase and glutamine uptake. Mol Biol Rep 43, 1079–1087. [DOI] [PubMed] [Google Scholar]
- 39. Xiong Y, Ji HP, Song WT, Yin YW, Xia CH, Xu B, Xu Y and Xia XB (2016) N‐methyl‐N‐nitrosourea induces retinal degeneration in the rat via the inhibition of NF‐κB activation. Cell Biochem Funct 34, 588–596. [DOI] [PubMed] [Google Scholar]
- 40. Okamoto T, Ozawa Y, Kamoshita M, Osada H, Toda E, Kurihara T, Nagai N, Umezawa K and Tsubota K (2016) Neuroprotective effect of rapamycin as a modulator of the mTOR‐NF‐κB axis during retinal inflammation. PLoS ONE 11, e0146517. [DOI] [PMC free article] [PubMed] [Google Scholar]
- 41. Garcia‐Cazorla À, Mochel F, Lamari F and Saudubray JM (2015) The clinical spectrum of inherited diseases involved in the synthesis and remodeling of complex lipids. A tentative overview. J Inherit Metab Dis 38, 19–40. [DOI] [PubMed] [Google Scholar]
- 42. Bennett LD and Anderson RE (2016) Current progress in deciphering importance of VLC‐PUFA in the retina. Adv Exp Med Biol 854, 145–151. [DOI] [PubMed] [Google Scholar]
- 43. Martínez‐Fernández de la Cámara C, Salom D, Sequedo MD, Hervás D, Marín‐Lambíes C, Aller E, Jaijo T, Díaz‐Llopis M, Millán JM and Rodrigo R (2013) Altered antioxidant‐oxidant status in the aqueous humor and peripheral blood of patients with retinitis pigmentosa. PLoS ONE 8, e74223. [DOI] [PMC free article] [PubMed] [Google Scholar]
- 44. Bassolino G, Sovdat T, Liebel M, Schnedermann C, Odell B, Claridge TD, Kukura P and Fletcher SP (2014) Synthetic control of retinal photochemistry and photophysics in solution. J Am Chem Soc 136, 2650–2658. [DOI] [PubMed] [Google Scholar]
- 45. Wang W, Lee SJ, Scott PA, Lu X, Emery D, Liu Y, Ezashi T, Roberts MR, Ross JW, Kaplan HJ et al (2016) Two‐step reactivation of dormant cones in retinitis pigmentosa. Cell Rep 15, 372–385. [DOI] [PMC free article] [PubMed] [Google Scholar]
- 46. van Trier DC, Vos AM, Draaijer RW, van der Burgt I, Draaisma JM and Cruysberg JR (2016) Ocular manifestations of noonan syndrome: a prospective clinical and genetic study of 25 patients. Ophthalmology 123, 2137–2146. [DOI] [PubMed] [Google Scholar]
- 47. Roberts AE, Araki T, Swanson KD, Montgomery KT, Schiripo TA, Joshi VA, Li L, Yassin Y, Tamburino AM, Neel BG et al (2007) Germline gain‐of‐functionmutations in SOS1 cause Noonan syndrome. Nat Genet 39, 70–74. [DOI] [PubMed] [Google Scholar]
- 48. Schwarz N, Lane A, Jovanovic K, Parfitt DA, Aguila M, Thompson CL, da Cruz L, Coffey PJ, Chapple JP, Hardcastle AJ et al (2017) Arl3 and RP2 regulate the trafficking of ciliary tip kinesins. Hum Mol Genet 26, 2480–2492. [DOI] [PMC free article] [PubMed] [Google Scholar]
- 49. D'Angelo R, Donato L, Venza I, Scimone C, Aragona P and Sidoti A (2017) Possibleprotectiverole of the ABCA4 gene c.1268A>G missensevariant in Stargardtdisease and syndromicretinitis pigmentosa in a Sicilian family: preliminary data. Int J Mol Med 39, 1011–1020. [DOI] [PubMed] [Google Scholar]
- 50. Appelbaum T, Santana E and Aguirre GD (2017) Strong upregulation of inflammatory genes accompanies photoreceptor demise in canine models of retinal degeneration. PLoS ONE 12, e0177224. [DOI] [PMC free article] [PubMed] [Google Scholar]
- 51. Williams DS and Lopes VS (2011) The many different cellular functions of MYO7A in the retina. Biochem Soc Trans 39, 1207–1210. [DOI] [PMC free article] [PubMed] [Google Scholar]
- 52. Juuti‐Uusitalo K, Koskela A, Kivinen N, Viiri J, Hyttinen JMT, Reinisalo M, Koistinen A, Uusitalo H, Sinha D, Skottman H et al (2017) Autophagy regulates proteasome inhibitor‐induced pigmentation in human embryonic stem cell‐derived retinal pigment epithelial cells. Int J Mol Sci 18, E1089. [DOI] [PMC free article] [PubMed] [Google Scholar]
- 53. Angius A, Uva P, Buers I, Oppo M, Puddu A, Onano S, Persico I, Loi A, Marcia L, Höhne W et al (2016) Bi‐allelic mutations in KLHL7 cause a Crisponi/CISS1‐like phenotypeassociated with early‐onsetretinitis pigmentosa. Am J Hum Genet 99, 236–245. [DOI] [PMC free article] [PubMed] [Google Scholar]
- 54. Xie YA, Lee W, Cai C, Gambin T, Nõupuu K, Sujirakul T, Ayuso C, Jhangiani S, Muzny D, Boerwinkle E et al (2014) New syndrome with retinitis pigmentosa iscaused by nonsense mutations in retinoldehydrogenase RDH11. Hum Mol Genet 23, 5774–5780. [DOI] [PMC free article] [PubMed] [Google Scholar]
- 55. Chen J, Liu F, Li H, Archacki S, Gao M, Liu Y, Liao S, Huang M, Wang J, Yu S et al (2015) pVHL interacts with ceramide kinase like (CERKL) protein and ubiquitinates it for oxygen dependent proteasomal degradation. Cell Signal 27, 2314–2323. [DOI] [PubMed] [Google Scholar]
- 56. Fathinajafabadi A, Pérez‐Jiménez E, Riera M, Knecht E and Gonzàlez‐Duarte R (2014) CERKL, a retinal disease gene, encodes an mRNA‐binding protein that localizes in compact and untranslated mRNPs associated with microtubules. PLoS ONE 9, e87898. [DOI] [PMC free article] [PubMed] [Google Scholar]
- 57. Srilekha S, Arokiasamy T, Srikrupa NN, Umashankar V, Meenakshi S, Sen P, Kapur S and Soumittra N (2015) Homozygosity mappingin leber congenital amaurosis and autosomal recessive retinitis pigmentosa in South Indian families. PLoS ONE 10, e0131679. [DOI] [PMC free article] [PubMed] [Google Scholar]
- 58. Lenarduzzi S, Vozzi D, Morgan A, Rubinato E, D'Eustacchio A, Osland TM, Rossi C, Graziano C, Castorina P, Ambrosetti U et al (2015) Usher syndrome: an effective sequencing approach to establish a genetic and clinical diagnosis. Hear Res 320, 18–22. [DOI] [PubMed] [Google Scholar]
Associated Data
This section collects any data citations, data availability statements, or supplementary materials included in this article.
Supplementary Materials
Table S1. miRNAs precursors and precursors variants coming from RNA‐Seq analysis.
Table S2. mirPath KEGG and GO analysis.
Table S3. ClueGO detailed pathway analysis of miRNAs target genes from miRTarBase and microT databases.
Table S1. miRNAs precursors and precursors variants coming from RNA‐Seq analysis.