Abstract
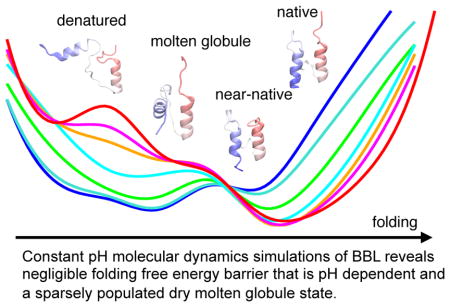
Solution pH plays an important role in protein dynamics, stability, and folding; however, detailed mechanisms remain poorly understood. Here we use continuous constant pH molecular dynamics in explicit solvent with pH replica exchange to describe the pH profile of the folding cooperativity of a miniprotein BBL, which has drawn intense debate in the past. Our data reconciled the two opposing hypotheses (downhill vs. two-state) and uncovered a sparsely populated unfolding intermediate. As pH is lowered from 7 to 5, the folding barrier vanishes. As pH continues to decrease, the unfolding barrier lowers and denaturation is triggered by the protonation of Asp162, consistent with experimental evidence. Interestingly, unfolding proceeded via an intermediate, with intact secondary structure and a compact, unlocked hydrophobic core shielded from solvent, lending support to the recent hypothesis of a universal dry molten globule in protein folding. Our work demonstrates that constant pH molecular dynamics is a unique tool for testing this and other hypotheses to advance the knowledge in protein dynamics, stability, and folding.
Graphical Abstract
1 Introduction
Protein folding, the process by which a protein’s sequence directs the amino-acid chain to form a stable three-dimensional structure, has fascinated the experimental and theoretical communities for more than two decades1–3. At the focal point are the so-called ultrafast folders, i.e., miniproteins with micro- or sub-microsecond folding time4,5, which offer a unique opportunity for bridging experimental measurements and computer simulations at atomic resolution 6,7. Among these proteins, the so-called downhill or barrierless folders have sparked great interest and controversy8–14. Classical protein folding is barrier limited, i.e., native (folded) and denatured (unfolded) conformational ensembles (states) are separated by a significant energy barrier 11. By contrast, an ideal downhill folding protein samples a single energy well, with a minimum that “continuously” shifts between the folded and unfolded states under varying temperature or solution conditions15,16. In practice, a downhill folder is the one with a marginal folding free energy barrier, i.e., < 3kT, where k is the Boltzmann constant5,17,18. Thus, probing downhill folders promised to offer a complete view of the protein folding process. In this work, we varied pH in silico to probe the unfolding mechanism of a helical mini-protein, BBL, which has been intensely debated over the past decade8,11–13,16,19.
BBL is a mesophilic variant of the peripheral subunit binding domain (PSBD) family of proteins 20. NMR models of various length (37–50 residues, Table S1, ESI†) revealed two parallel α-helices joined by an irregular loop (Fig. 1a). A conserved Asp16221,22 forms a conserved23 hydrogen bond network with the sidechain and backbone of Thr152 and Thr159 (Fig. 1b). At the end of the two helices are two histidines, one of which (His166) is packed against a hydrophobic pocket formed by Leu144, Ala148, Ile149, and Val16324, which together with other interhelical and loop-helix contacts form the hydrophobic core in the protein (Fig. 1a and c).
Fig. 1. Structure and sequence of BBL.
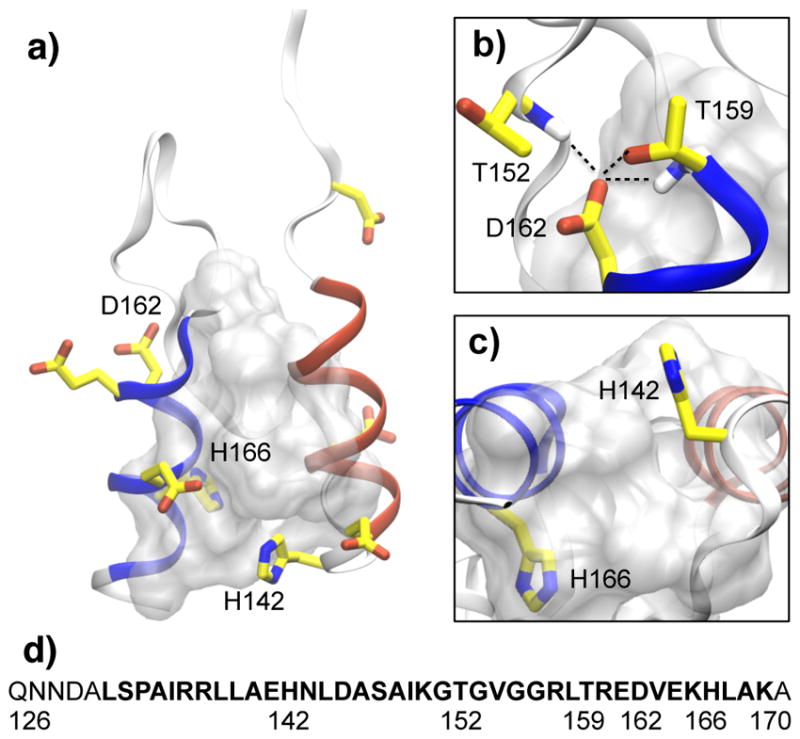
a) Overall structure of BBL (pdb 1W4H20), with the N- (133–141, red) and C-terminal helices (160–168, blue) shown in ribbon and Asp/Glu/His sidechains shown in stick model. The hydrophobic core, comprised of residues Ile135, Leu138, Leu139, Leu144, Ala146, Ala148, Ile149, Leu158, Vla163, His166, and Leu167, is shown as the grey surface. b) Zoomed-in view of the hydrogen bonds (indicated with broken lines) involving Asp162. c) Zoomed-in view of the two histidines. d) The amino acid sequence of BBL used by Fersht and coworkers (pdb 1W4H). The truncated sequence used by Muñoz and coworkers 8,17 is shown in bold.
BBL was suggested to be a downhill folder based on spectroscopy and calorimetry measurements by Muñoz and coworkers8,13,17. Fersht and coworkers, however, showed that BBL folding follows the conventional two-state cooperative mechanism19 and has an unfolding free energy (or stability) of 2.1–2.4±0.3 kcal/mol at 298 K (3.5–4.1±0.5 kT), pH 7 and 200 mM ionic strength25. Three differences between the Muñoz and Fersht studies include the use of an extrinsic fluorophore label at the N-terminus (none in Fersht experiments), sequence length (6 residue longer in Fersht experiments, Fig. 1d), and solution conditions (pH 5.3 without salt in Muñoz and pH 7 with 200 mM salt in Fersht experiments). In their earlier work, Fersht and coworkers showed that at neutral pH, the stability of BBL remains unchanged as the ionic strength was varied between zero and 200 mM20. More recently, Muñoz and coworkers confirmed their conclusion using the full-length Fersht construct without the label13,16. Thus, extrinsic label, sequence length and ionic strength have been ruled out as the major factors in the controversy. Instead, Fersht and coworkers pointed out that the phosphate buffer used in Muñoz experiments13,16 led to a sharp decrease of solution pH from 7 to 5.5 at the guanidinium chloride denaturation midpoint12,26. Since the stability of BBL decreases significantly between pH 8 and 520, likely due to the protonation of His166 which has a measured pKa of 5.424,27, Fersht and coworkers argued that the one-state behavior was a result of denaturation12,26. Thus, pH emerges as the central player in the debatable mechanism of BBL folding.
The folding cooperativity of BBL has been previously investigated in the theoretical community using molecular dynamics (MD) simulations based on the native-centric Go models15,28,29 and physical force fields30–33. The effect of pH was examined by using two pH conditions, pH 5 and 7, in the conventional fixed-protonation-state simulations in explicit solvent (with different protonation states of histidines) 32, and in the continuous constant pH molecular dynamics (CpHMD)34,35 in generalized-Born (GB) implicit solvent33. However, a complete pH profile of BBL folding, which could shed “more definitive” light in the controversy, has not been obtained.
In the present work, we employed CpHMD with conformational sampling in explicit solvent and the pH replica-exchange (pH-REX) protocol36 to study the stability and folding of BBL in a wide range of pH. Our data reconciled the two-state and downhill hypotheses, and uncovered an unfolding intermediate, lending support to the hypothesis of a universal dry molten globule in protein folding. We also found that acid denaturation of BBL is a two-stage process, sequentially triggered by the protonation of His166 and Asp162, in agreement with experiment.
2 Methods
2.1 Structure preparation
The NMR model obtained by Fersht group at pH 7 and 200 mM salt (first entry in the PDB of 1W4H20, sequence given in Fig. 1d) was used as the starting configuration. The N-terminus was acetylated and the C-terminus was amidated. Hydrogens were added using the HBUILD facility 37 in CHARMM38. Dummy hydrogen atoms were added to Asp and Glu sidechains and placed in the syn position initially 34. The protein was then placed in a truncated octahedral water box so that the dimension of box is larger than the end-to-end distance of the unfolded BBL (65.3 Å16). Water molecules within 2.6 Å of any protein heavy atoms were deleted. To relax the hydrogen positions, the system was minimized by steepest descent followed by the adopted basis Newton-Raphson method with protein heavy atoms fixed and subsequently harmonically restrained with a force constant of 50.0 kcal/mol·Å2. Note, no explicit counter ions were added in the simulation, following our previous work36. BBL has a small (+2) total net charge at pH 7. To compensate for the pH-dependent total net charge and its fluctuation during proton titration, a background plasma was applied in the particle mesh Ewald calculation for conformational dynamics. See our previous study for more discussion36. To focus on the pH effect, no salt ions were included in the simulation.
2.2 CpHMD simulations
CpHMD simulations with the hybrid-solvent scheme and pH replica-exchange protocol36 were performed using the PHMD and REPDSTR modules in the CHARMM package (version c37b1)38, The all-atom CHARMM22/CMAP force field39,40 and the CHARMM-style TIP3P water model40 were used to represent the protein and water, respectively.
Following energy minimization, the system was heated from 0 to 300 K in 60 ps with the protein heavy atoms harmonically restrained with a force constant of 5.0 kcal/mol·Å2. During equilibration, the restraint was gradually reduced to zero within 90 ps followed by an 850-ps unrestrained dynamics run. In the heating and equilibration stage, CpHMD was turned on at pH 7. Molecular dynamics was conducted under periodic boundary conditions and constant NPT ensemble at ambient temperature (300 K) and pressure (1 atm), controlled by the Nóse-Hoover thermostat41 and the Langevin piston pressure-coupling algorithm42, respectively. The SHAKE algorithm43 was applied to bonds involving hydrogen atoms to allow for a 2-fs time step. The van der Waals energy and force were gradually switched off with a switching function applied in the range from 10 to 12 Å. Electrostatic energy and force were calculated using the smooth particle-mesh Ewald method44,45 with a real-space cutoff of 12 Å and a sixth-order interpolation with approximately 1 Å grid spacing. The neighbor list was updated whenever necessary. All Asp, Glu, His, Lys and Arg residues were allowed to titrate. The λ coordinates were updated every 5 MD steps to allow for water relaxation 36. The solvation forces for λ dynamics were calculated using the GBSW implicit-solvent model46. The ionic strength in the GB calculation was set to zero. The default setting in the GBSW and PHMD modules of CHARMM was used36.
In the production run, the pH replica-exchange protocol was applied. 36. Every 500 MD steps or 1 ps, the spatial coordinates of two replicas with adjacent pH attempted a swap according to the Metropolis criterion 36. At the start of the production run, 7 replicas were placed in the pH range 1–7.5. After 85 ns, additional 13 replicas were added to enhance sampling. The pH conditions of the 20 replicas were 1.0, 1.5, 2.0, 2.25, 2.5, 2.75, 3.0, 3.25, 3.5, 3.75, 4.0, 4.25, 4.5, 4.75, 5.0, 5.5, 6.0, 6.5, 7.0 and 7.5. Each replica was subject to constant NPTpH molecular dynamics of 380 ns, resulting in an aggregate sampling time over 6 μs. The last 100 ns of all replicas were used for analysis. Data was collected every 1 ps.
2.3 Control simulation
As a control, we performed the conventional fixed-protonation-state simulation with the same force field and starting structure as in the CpHMD simulations. Hydrogens were added using the pdb2gmx utility of GROMACS. The protonation states of all titratable residues as well as the tautomeric states of histidines at physiological conditions were assigned according to the pH 7 replica in the CpHMD simulations. The molecule was solvated in a triclinic water box with a minimum distance of 15 Å between the solute and edges of the water box. Two explicit Cl− ions were added to neutralize the excess charge. The system energy was minimized by steepest descent until the maximum force was reduced below 1000 kJ/mol/nm.
The simulation was performed using the GROMACS package47 (version 4.5.5). The LINCS algorithm48 was applied to bonds involving hydrogen atoms to allow a 2-fs time step. Systems were simulated under periodic boundary conditions in the constant NPT ensemble at a temperature of 300 K maintained by the Hoover thermostat41 with a time constant of 0.1 ps. The Parrinello-Rahman barostat 49 was applied to maintain a pressure of 1 atm using isotropic pressure coupling with the time constant of 4.0 ps, reference pressures of 1 bar, and compressibility of 4.5×10⁻⁵ bar−1. van der Waals interactions were smoothly switched off from 10 to 12 Å using a switching function. Electrostatic energies were calculated using the particle-mesh Ewald method44,45, with a real-space cutoff of 14 Å and a sixth-order interpolation with 1.6 Å grid spacing. The system was first equilibrated for 200 ps in the NVT ensemble and 1 ns in the NPT ensemble. The production run was performed in the NPT ensemble for 400 ns. During the production run, data was recorded every 1000 MD steps or 2 ps.
2.4 pKa calculation
We defined the protonated and unprotonated states as those with λ < 0.2 and λ > 0.8, respectively. The unprotonated fraction S can then be calculated. Fitting of S values at each simulated pH to the Hill equation gave the pKa.
| (1) |
where n is the Hill coefficient representing the slope of the transition region in the titration curve.
3 Results and Discussion
pH-REX CpHMD simulation of BBL in explicit solvent and pH range 1–7.5 was initiated from the NMR model of the Fersht construct (pdb 1W4H20). To focus on the pH effect, no salt ions were added and the ionic strength in the GB calculation was set to zero. Simulation lasted 380 ns per replica with a total sampling time over 6 μs. We monitored the simulation convergence by following the time course of the fraction of native contacts q, a commonly used progress variable in folding studies, and the macroscopic pKa values, indicative of protonation-state sampling convergence. q is defined as the total number of native contacts relative to that in the native state (more details given under Fig. 2). After 280 ns, both q at different pH and pKa values were converged (Fig. S2 and S3, ESI†), and we used the remaining 100 ns trajectories of the replicas for analysis. Similar analysis was performed for the control simulation (with fixed protonation states at pH 7, Fig. S4, ESI†).
Fig. 2. BBL samples the native and denatured basins as well as an intermediate states in a pH-dependent manner.
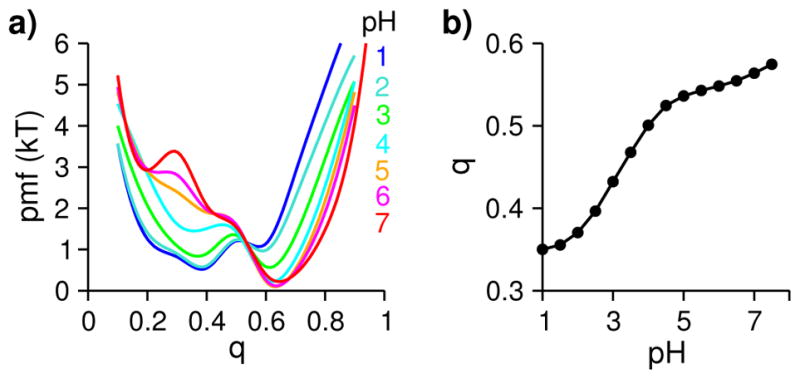
a) Potential of mean force as a function of the fraction of native contacts q at different pH in units of kT, where k is the Boltzmann constant. Following Brooks and coworkers 50, two residues were considered in contact, if the distance between the center of geometry of the sidechain heavy atoms is within 6.5 Å. A contact was considered native, if it occurs with a probability above 0.5 in the control simulation. b) Average fraction of native contacts at different pH.
We first examined the pH-dependent folding of BBL using the potential of mean force (pmf) or the free energy profile along q at different pH (Fig. 2a). At 7, the pmf displays a global minimum around q of 0.6, representative of the native basin. A second, shallow minimum around q of 0.2 is also visible, representative of the denatured basin. In the folding direction (increasing q), the barrier is less than 0.5 kT, while in the unfolding direction (decreasing q), the barrier is higher, about 3.5 kT. The pmf of the native basin is about 3 kT lower than the denatured basins, in excellent agreement with 3.5–4.1±0.5 kT estimated by Fersht and coworkers using thermal and chemical denaturation under 200 mM salt 25. As pH is lowered from 7 to 5, the folding barrier decreases and vanishes at pH 5, indicating downhill folding, in support of the hypothesis by Mũnoz and coworkers8,13,16,17. Surprisingly, in the pmf for pH 5–7, we notice a very shallow intermediate around q of 0.4. As pH is further decreased between 4 and 1, the pmf of the native basin is raising, while that of the denatured basin is lowering. Interestingly, the intermediate seen in the pmf for pH 5–7 is also lowered and seems to dominate pH 3 and 4. At pH 3, the pmf of the intermediate has nearly the same value as that of the native basin. The folding and unfolding barriers are nearly identical. At pH 2 and 1, however, the pmf of the denatured basin is lowered and becomes visible. This data suggests that BBL folding is both thermodynamically and kinetically favored above pH 3. Further, there is a sparsely populated intermediate next to the denatured basin.
To examine the pH effect on the overall degree of folding, we plotted the average q at different pH (Fig. 2b). Two transitions are visible. As pH is reduced from 7.5 to 5, there is a gradual decrease in q by 0.05, while between pH 5 and 1, q decreases sharply by 0.2. This is agreement with the pmf of q (Fig. 2a), confirming that BBL is folded above pH 5 and becomes increasingly denatured between pH 5 and 1. The transition midpoint of the latter is around pH 3, which is about 1 unit lower than that estimated using thermal denaturation with 200 mM salt 27. We will come back to this point later in the discussion.
We further characterized BBL folding using an additional progress variable, radius of gyration of the hydrophobic core, Rg. The free energy surface (FES) in terms of q and Rg was plotted for different pH conditions (Fig. 3). At pH 7, the FES displays a minimum region, corresponding to the native basin, with a broad range of q (0.5–0.8) and a narrow range of Rg (6–7 Å). The latter is similar to the values measured from the NMR models (Table S1, ESI†). The spread in q can be attributed to the relatively unstable native contacts (SI). In agreement with the pmf of q (Fig. 2a), the FES also displays a second minimum region, about 3 kT higher, with q around 0.12 and Rg of 9–12 Å, corresponding to the denatured basin. The FES of pH 5 is very similar to pH 7, except that the minimum region is slightly shifted (by about 0.05) to smaller values of q, and the region between the denatured and native basins is slightly more populated. In agreement with the pmf of q, this data demonstrates that BBL mainly samples the native state above pH 5, and the folding barrier lowers as pH is reduced from 7 to 5. We note that at pH 5 and below the native basin also contains the near-native structures, in which the last turn of the CT-helix unwinds. Thus, we use the term native-like state to refer to the native and native-like structures (Fig. 3, snapshots NL).
Fig. 3. Unfolding free energy landscape of BBL reveals three states.
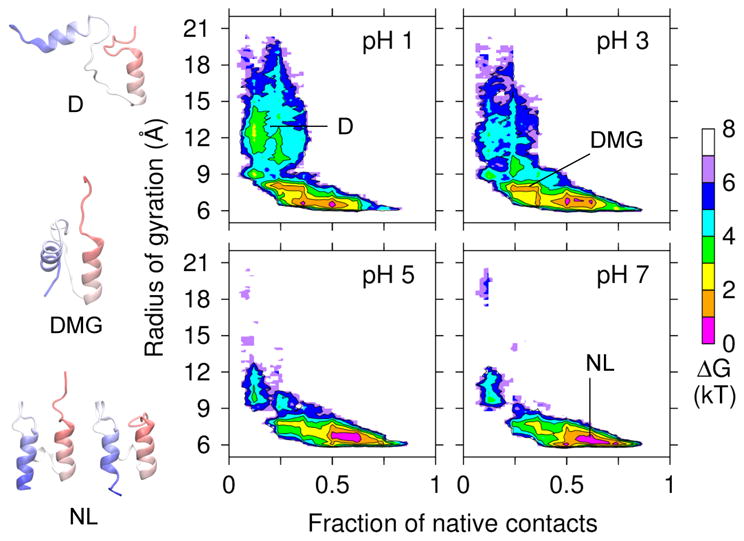
Free energy surface as a function of the fraction of native contacts q and the radius of gyration Rg. Representative snapshots are shown for the native-like (NL), dry molten globule (DMG), and denatured (D) states. Rg was calculated using the hydrophobic core residues given under Fig. 1.
In the FES of pH 3 and below, a “tail” region with small q and significantly larger Rg (up to 20 Å) develops, indicating that BBL samples an extended denatured state (Fig. 3, snapshot D). The tail region becomes more populated at pH 1, leading to an L-shaped FES. An L-shaped FES indicates that BBL folding occurs through an initial hydrophobic collapse followed by backbone and sidechain reorientation to maximize hydrophobic contacts which “anneals” the protein to the native state 50. Notably, the FES of pH 1 and 3 also contain a minimum region with a slightly larger Rg (around 8 Å) but much lower q (0.2–0.4) than the native state, consistent with the intermediate seen in the pmf of q. Compared to the native state, this state, which we shall call dry molten globule (DMG) has weakened hydrophobic contacts, which results in the tilting of the NT and CT-helices (Fig. 3, snapshot DMG).
To characterize the structures of the three states, we examined the angle formed by the NT- and CT-helices, the residue-based helicity as well as the number of water within a radius of 6 Å from the center of mass of the hydrophobic core. Note, 6 Å is the radius of gyration of the hydrophobic core in the native state. In the denatured state, the probability distribution of the interhelical angle is almost flat (Fig. 4a, green), indicating that the two helices can adopt any orientation, consistent with the wide range of Rg values shown on the FES. As expected, the denatured state is well hydrated, by up to 30 water within a radius of 6 Å from the center of mass (Fig. 4b, green). The NT-helix remains intact; however, the CT-helix is partially unfolded, with the helicity reduced to below 60% (Fig. 4c, green). This is consistent with the chemical shifts data measured under the condition of pH 2 and 200 mM salt, which showed that the CT-helix is largely and NT-helix is partially disrupted27. The helices are more stable in the simulations, due to the lack of salt and the helical bias of the CHARMM C22/CMAP force field51,52. We note that, at pH 5 and below, the last turn of the CT-helix tended to unwind, in agreement with the chemical shift data measured at pH 4.8 (His166 is protonated)24 and the conventional explicit-solvent MD with His166 protonated based on the OPLS force field32 as well as the simulation in the GBSW implicit solvent 33.
Fig. 4. Characterization of the three different states.
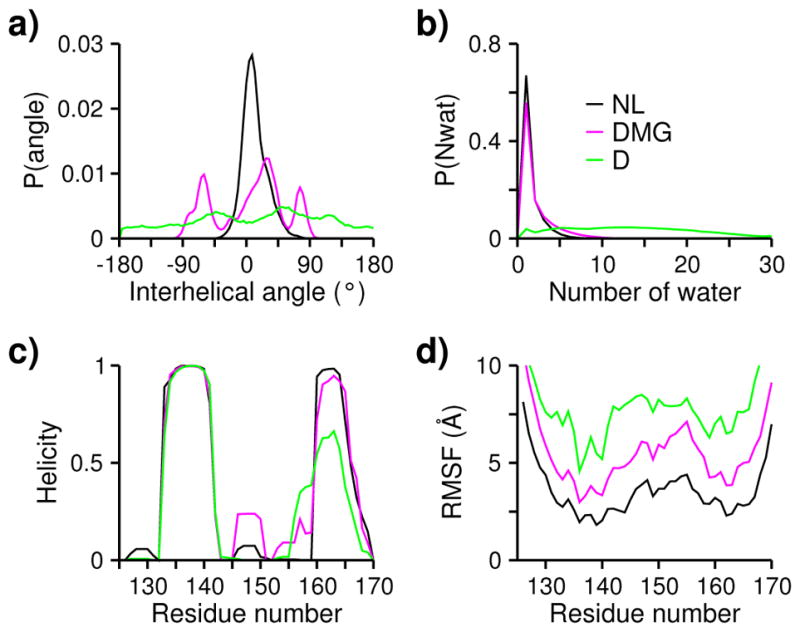
a) Probability distribution of the interhelical angle between the NT- and CT-helices. Native-like (NL), dry molten globule (DMG), and denatured (D) states are indicated in black, magenta, and green, respectively. NL was defined with q > 0.5 and Rg < 7; DMG was defined with 0.2 < q < 0.4 and Rg < 9; D was defined with Rg > 9. The interhelical angle is defined by the helical vectors formed between the Cα atoms of residues 133 and 141 and between residues 160 and 166. b) Number of water within a radius of 6 Å (gyration radius of the hydrophobic core in the folded state) from the center of mass of the hydrophobic core (defined under Fig. 1). c) Residue-based helicity. d) Root-mean-square fluctuation (RMSF) of the Cα atoms.
We now turn to the intermediate seen on the FES, which bears the signature of a dry molten globule53,54. Molten globule (MG) refers to a folding intermediate in which the protein adopts a compact, dynamic form with native-like secondary structure and a loose, unlocked core54,55. The acid-denatured α-lactalbumin, known as the A form, is an early example of MG that has been experimentally characterized56. In contrast to the “wet” MG, a dry MG (DMG) refers to a MG state with a solvent-shielded protein interior 53,54. The intermediate state located on the FES (Fig. 3) exhibits the structural and dynamical features of DMG. Similar to the native state, the protein interior is devoid of water (Fig. 4b), and the helical content remains nearly intact (Fig. 4c). However, the NT- and CT-helices are not no longer locked in a parallel orientation, as evident from the various interhelical angles (Fig. 4a), and the overall structure is more dynamic, as seen from the greater root-mean-square fluctuation of the Cα atoms throughout the sequence (Fig. 4d). Thus, the intermediate state found here will be referred to as a DMG in the remainder of the paper.
We examined the native contacts in the putative DMG, by calculating a contact map, in which the native contact occupancy is color coded based on the relative free energy. 58 “native” contacts identified in the control simulation (Fig. 5, upper triangle) were all weakened in the DMG, consistent with the overall enhanced dynamic fluctuation compared to the native state (Fig. 5, lower triangle). 13 native contacts, Asp129–Leu131, Asp129–Arg136, Leu131–Leu139, Arg136–Ala140, Ala146–Leu158, Leu144–Leu167, Ile149–His166, Gly151–Leu158, Thr152–Thr159, Thr152–Asp162, G153–Asp162, His166–Lys169, Leu167–Ala170, were destabilized by more than 2 kT. Most of them are long-range contacts (j > i+6), located at the interface between the helices and the loop. Notably, the most strongly destabilized contacts, His166–Ile149/Lys169, Asp162–Thr152/Gly153, involve titratable residues Asp162 and His166 (highlighted in Fig. 5). Significant changes in the local environment of these two residues result in large pKa shifts during acid-induced unfolding of BBL (see later discussion). Comparing the long-range contacts in the DMG with those in the D state (Fig. S6, ESI†), we found that the contacts involving Leu138 (with Arg160, Leu163, and Leu167) and Val163 (with Ile135, Leu139, Leu144, and Ile149) are further weakened, which suggests that Leu138 and Val163 are the most critical hydrophobic residues for BBL unfolding. These data are consistent with the experimental findings: Leu138 is a conserved residue in the PSBD family and mutation L138A significantly destabilizes BBL; V163A nearly unfolds the protein23.
Fig. 5. Native contact occupancy in the dry molten globule.
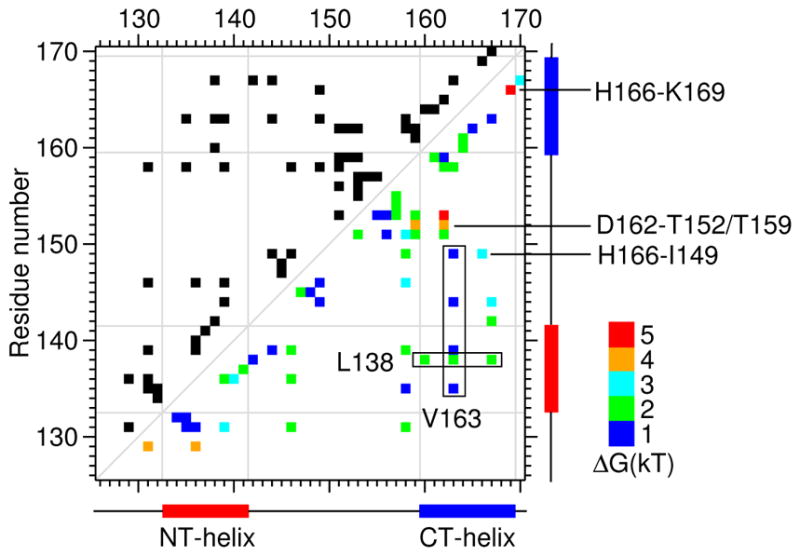
Native contacts are indicated in the top triangle. Destabilization free energies, , in units of kT, are shown in the lower triangle. Pi j and represent the probabilities of contact i j in the DMG and N states, respectively. The latter was calculated using the control simulation (Fig. S5, ESI†). For clarity the free energies were binned and color coded: 0–1 kT (blue), 1–2 kT (green), 2–3 kT (cyan), 3–4 kT (orange), and 4–5 kT (red). Residues discussed in the main text are indicated. The positions of the two helices are given on the bottom and side of the contact map.
Lastly, we calculated the pH-dependent stability change of BBL using the integrated form of the Wyman linkage equation27,57,58,
| (2) |
where i is the index of the titratable site, ΔGunf(pHref) is the unfolding free energy at a reference pH, and refer to the pKa’s in the native and denatured states, respectively. Accordingly, only residues having a significant pKa shift upon protein unfolding, i.e., , contribute to the pH-dependent stability change.
In our simulations, the only residues that showed significant pKa shift are Asp162 and His166 (Fig. 6a, red). In the native state, the pKa of Asp162 is significantly down shifted relative to the model value by more than 3 units, due to the hydrogen bonding with Thr152 and Thr159 which favors the charged form (Fig. 1b). Further stabilized comes from the attractive electrostatic interaction with Lys165, located nearly one turn away on the same helix. In the denatured state, however, the hydrogen bonds and the interaction with Lys165 are disrupted, resulting in an increase of pKa. The pKa of His166 in the native-like state is down shifted relative to the model by about 1 unit due to desolvation which favors the neutral form (Fig. 1c). Partial unwinding of the CT-helix and disruption of the hydrophobic core in the denatured state lead to the increase in solvent exposure and recovery of the normal (model) pKa.
Fig. 6. Comparison to experimental measurements of pH-dependent stability of BBL.
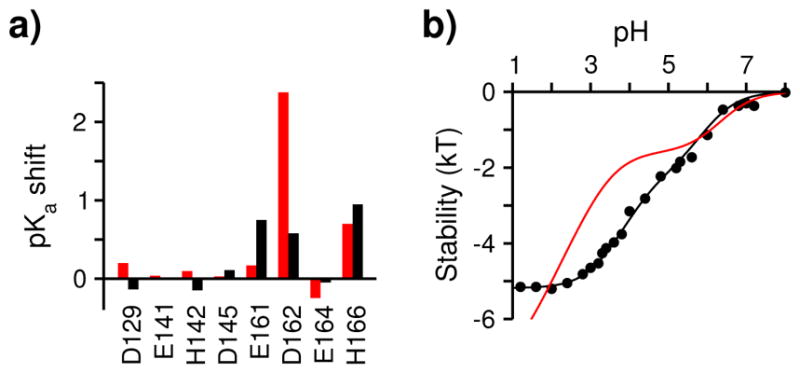
a) Calculated (red) and experimental (black) pKa shifts between the native and denatured states. The native state was defined with q > 0.7 and Rg < 7 Å. The experimental denatured-state pKa’s were assumed as 3.75, 4.46 and 6.33 for Asp, Glu and His, respectively, based on fitting the corresponding calculation (Eq. 2) to the pH-dependent stability measurements in 200 mM salt solution 27. b) Calculated (red curve) and measured (black circles) pH-dependent stability 27. Calculation used the native and denatured pKa’s of Asp162, His166, and Glu141 (Eq. 2).
We compare the calculated pKa shifts with the experimental ones derived from the native-state pKa’s and the slope of the pH-dependent stability curve27. Noticeable differences are found for two residues, Asp162 and Glu161(Fig. 6a), which can be attributed to the different salt condition (200 mM in experiment and zero in the simulation). The calculated pKa shift of Asp162 is about 2 units larger than experiment, which is due to the absence of salt screening of hydrogen bonding, which would significantly raise the native-state pKa. Additionally, the use of the GB implicitsolvent model to propagate λ dynamics has been known to underestimate the pKa’s of acidic residues involved in salt-bridge or hydrogen-bonding interactions 36. In contrast to Asp162, the calculated pKa shift for Glu161 is smaller by 0.7 units compared to experiment, which may be attributed to the absence of salt screening in the denatured state. As a result, the denatured-state pKa of Glu161 (3.4) remains depressed relative to the model value (4.4).
Using the calculated native and denatured pKa’s, we obtained the pH-dependent stability (unfolding free energy) change of BBL. Consistent with the pH-dependent fraction of native contacts (Fig. 2b), two transitions are clearly seen (Fig. 6b, red). The first transition is due to the titration of His166, which destabilizes the protein by nearly 2 kT going from pH 7 to 5. The second transition is due to the titration of Asp162, which destabilizes the protein by more than 4 kT going from pH 4 to 1. Consistent with the pKa shifts, the calculated and measured stability changes agree well in the pH range 5 to 8 (Fig. 6b). Below pH 5, the calculated curve is shifted to lower pH values, due to the smaller native pKa of Asp162 compared to the measurement. The larger stability decrease below pH 3 is due to the larger calculated pKa shift of Asp162 as compared to experiment.
How does protonation of His166 and Asp162 influence the stability of BBL and ultimately induce unfolding? At pH 7, the de-protonated His166 is packed against the hydrophobic core and interacts with Lys169 at the end of the CT-helix (Fig. S7, ESI†). At pH 5, His166 becomes protonated, resulting in the loss of the hydrophobic contact and emergence of the electrostatic repulsion from Lys169, which destabilizes the CT-helix, leading to unwinding of the helical end (Fig. 3, snapshot NL), in agreement with the chemical shifts data24 and previous simulation studies performed at 5 and 732,33. Thus, the effect of His166 protonation is mainly local unfolding. The protonation of Asp162, however, leads to global unfolding. At pH below 3, Asp162 becomes protonated, leading to the breakage of a hydrogen bond network which helps stabilize the hydrophobic core and consequently unfolding of BBL (Fig. 3, snapshot D). Our data corroborate the experimental findings that D162N and D162G mutations nearly unfolded BBL and E3BD proteins, respectively 21,23, supporting the notion that interactions involving Asp162 are a part of the folding nuclei for PSBD family proteins 23. Note, while our data highlights the role of Asp162, it does not rule out the contribution from other acidic residues because their protonation increases the repulsive Coulombic forces due to the excess positive charges. Cerminara et al. recently suggested that BBL unfolding could be due to the titration of an arginine59. Our simulations demonstrated that Lys and Arg residues are fully charged in the simulation pH range (1–7.5), thus ruling out their involvement in the unfolding of BBL.
4 Concluding discussion
We have employed CpHMD simulations to study the pH profile of BBL stability and folding. Two dominant conformational ensembles, native-like and denatured states, were identified, consistent with the two-state folding mechanism advocated by Fersht and coworkers12,19,25,26. At pH 7, our simulations gave an unfolding free energy of 3 kT, matching the experimental estimate of 3.5–4.1±0.5 kT25. Interestingly, the folding free energy barrier is only about 0.5 kT, and it decreases to zero as pH is reduced to 5, lending support to the downhill folding mechanism proposed by Munõz and coworkers8,13,16. Our simulations confirmed the critical role of His166 and Asp162 in BBL folding. Protonation of His166 destabilizes the protein by partial unwinding the CT-helix, in agreement with both NMR data24 and previous MD studies 32,33. Protonation of Asp162 completely disrupts the hydrophobic core, consistent with the mutation data21,23 and experimental pKa shift of Asp162 upon unfolding. The denatured state emerged from our simulation showed a higher helical content and stronger local attractive electrostatics, as compared to that inferred from NMR and pKa measurements27. These differences can be mainly attributed to the absence of salt screening in the simulation but also the force field bias toward the helical state 51,52. Surprisingly, our simulations revealed that acid-induced unfolding of BBL proceeds via a DMG, which has not been previously reported in the BBL folding simulations15,28–33, perhaps due to the use of high temperature which destabilizes the state. Nor was it reported by Fersht and Munõz groups, which may be due to the sparse population.
Contrary to the belief that protein unfolding is initiated by the penetration of water into the protein interior, formation of DMG has been proposed as a universal kinetic unfolding intermediate by Baldwin and others based on the experimental studies of several proteins, such as ribonuclease A (RNase A) and villin headpiece subdomain (HP35)53,54. The first evidence of DMG came from the urea denaturation experiment of RNase A, where proton NMR and hydrgen/deuterium exchange data indicated an unfolding intermediate, in which the protein contains a high degree of secondary structure, the sidechains are free to rotate but water is absent in the core60. Recently, the native-state triplet-triplet energy transfer experiments suggested that both expanded and compact DMG states exist as folding intermediates for the miniprotein HP35, which has been long thought as a highly cooperative folder 61,62. Experimental evidence of DMG has also been shown in urea unfolding of ribonuclease H63 and acid unfolding of a multi-domain protein, human serum albumin64.
In the theoretical community, DMG was first hypothesized as a high energy state that precedes protein unfolding65. Later, in the first acid denaturation MD simulation on apomyoglobin, an unfolding intermediate similar to DMG was observed preceding a wet MG state 66. More recently, the MD simulation of urea unfolding of hen egg lysozyme also demonstrated a DMG as an early unfolding intermediate67. Thus, our data lends support to the role of DMG as a universal intermediate in protein unfolding. CpHMD simulations offer a unique opportunity to probe detailed electrostatic mechanisms that govern protein dynamics, stability, and folding.
Supplementary Material
Acknowledgments
The authors acknowledge National Science Foundation (MCB1305560) and National Institutes of Health (GM098818) for funding.
Footnotes
Electronic Supplementary Information (ESI) available: [details of any supplementary information available should be included here]. See DOI: 10.1039/b000000x/
Conflict of interest
There are no conflicts to declare.
References
- 1.Fersht AR. Nat Rev Mol Cell Biol. 2008;9:650–654. doi: 10.1038/nrm2446. [DOI] [PubMed] [Google Scholar]
- 2.Dill KA, MacCallum JL. Science. 2012;338:1042–1046. doi: 10.1126/science.1219021. [DOI] [PubMed] [Google Scholar]
- 3.Wolynes PG. Biochimie. 2015;119:218–230. doi: 10.1016/j.biochi.2014.12.007. [DOI] [PMC free article] [PubMed] [Google Scholar]
- 4.Dill KA, Ozkan SB, Shell MS, Weikl TR. Annu Rev Biophys. 2008;37:289–316. doi: 10.1146/annurev.biophys.37.092707.153558. [DOI] [PMC free article] [PubMed] [Google Scholar]
- 5.Prigozhin MB, Gruebele M. Phys Chem Chem Phys. 2013;15:3372–3388. doi: 10.1039/c3cp43992e. [DOI] [PMC free article] [PubMed] [Google Scholar]
- 6.Lindorff-Larsen K, Piana S, Dror RO, Shaw DE. Science. 2011;334:517–520. doi: 10.1126/science.1208351. [DOI] [PubMed] [Google Scholar]
- 7.Nguyen H, Maier J, Huang H, Perrone V, Simmerling C. J Am Chem Soc. 2014;136:13959–13962. doi: 10.1021/ja5032776. [DOI] [PMC free article] [PubMed] [Google Scholar]
- 8.Garcia-Mira MM, Sadqi M, Fischer N, Sanchez-Ruiz JM, Muñoz V. Science. 2002;298:2191–2195. doi: 10.1126/science.1077809. [DOI] [PubMed] [Google Scholar]
- 9.Ma H, Gruebele M. Proc Natl Acad Sci USA. 2005;102:2283–2287. doi: 10.1073/pnas.0409270102. [DOI] [PMC free article] [PubMed] [Google Scholar]
- 10.Liu F, Gruebele M. J Mol Biol. 2007;370:574–584. doi: 10.1016/j.jmb.2007.04.036. [DOI] [PubMed] [Google Scholar]
- 11.Huang F, Ying L, Fersht AR. Proc Natl Acad Sci USA. 2009;106:16239–16244. doi: 10.1073/pnas.0909126106. [DOI] [PMC free article] [PubMed] [Google Scholar]
- 12.Huang F, Johnson CM, Petrovich M, Fersht AR. Proc Natl Acad Sci USA. 2013;110:E331–E332. doi: 10.1073/pnas.1217840110. [DOI] [PMC free article] [PubMed] [Google Scholar]
- 13.Campos LA, Muñoz V. Proc Natl Acad Sci USA. 2013;110:E1242–E1243. doi: 10.1073/pnas.1219166110. [DOI] [PMC free article] [PubMed] [Google Scholar]
- 14.Yu W, Baxa MC, Gagnon I, Freed KF, Sosnick TR. Proc Natl Acad Sci USA. 2016;113:4747–4752. doi: 10.1073/pnas.1522500113. [DOI] [PMC free article] [PubMed] [Google Scholar]
- 15.Cho SS, Weinkam P, Wolynes PG. Proc Natl Acad Sci USA. 2008;105:118–123. doi: 10.1073/pnas.0709376104. [DOI] [PMC free article] [PubMed] [Google Scholar]
- 16.Liu J, Campos LA, Cerminara M, Wang X, Ramanatan R, English DS, Muñoz V. Proc Natl Acad Sci USA. 2012;109:179–184. doi: 10.1073/pnas.1111164109. [DOI] [PMC free article] [PubMed] [Google Scholar]
- 17.Sadqi M, Fushman D, Muñoz V. Nature. 2006;442:317–321. doi: 10.1038/nature04859. [DOI] [PubMed] [Google Scholar]
- 18.Carter JW, Baker CM, Best RB, Sancho DD. J Phys Chem B. 2013;117:13435–13443. doi: 10.1021/jp405904g. [DOI] [PMC free article] [PubMed] [Google Scholar]
- 19.Ferguson N, Schartau PJ, Sharpe TD, Sato S, Fersht AR. J Mol Biol. 2004;344:295–301. doi: 10.1016/j.jmb.2004.09.069. [DOI] [PubMed] [Google Scholar]
- 20.Ferguson N, Sharpe TD, Schartau PJ, Sato S, Allen MD, Johnson CM, Rutherford TJ, Fersht AR. J Mol Biol. 2005;353:427–446. doi: 10.1016/j.jmb.2005.08.031. [DOI] [PubMed] [Google Scholar]
- 21.Ferguson N, Day R, Johnson CM, Allen MD, Daggett V, Fersht AR. J Mol Biol. 2005;347:855–870. doi: 10.1016/j.jmb.2004.12.061. [DOI] [PubMed] [Google Scholar]
- 22.Sharpe TD, Ferguson N, Johnson CM, Fersht AR. J Mol Biol. 2008;383:224–237. doi: 10.1016/j.jmb.2008.06.081. [DOI] [PubMed] [Google Scholar]
- 23.Neuweiler H, Sharpe TD, Rutherford TJ, Johnson CM, Allen MD, Ferguson N, Fersht AR. J Mol Biol. 2009;390:1060–1073. doi: 10.1016/j.jmb.2009.05.011. [DOI] [PubMed] [Google Scholar]
- 24.Arbely E, Rutherford TJ, Sharpe TD, Ferguson N, Fersht AR. J Mol Biol. 2009;387:986–992. doi: 10.1016/j.jmb.2008.12.055. [DOI] [PubMed] [Google Scholar]
- 25.Neuweiler H, Sharpe TD, Johnson CM, Teufel DP, Ferguson F, Fersht AR. J Mol Biol. 2009;387:975–985. doi: 10.1016/j.jmb.2008.12.056. [DOI] [PubMed] [Google Scholar]
- 26.Fersht AR, Petrovich M. Proc Natl Acad Sci USA. 2013;110:E1244–E1245. doi: 10.1073/pnas.1303286110. [DOI] [PMC free article] [PubMed] [Google Scholar]
- 27.Arbely E, Rutherford TJ, Neuweiler H, Sharpe TD, Ferguson N, Fersht AR. J Mol Biol. 2010;403:313–327. doi: 10.1016/j.jmb.2010.08.052. [DOI] [PubMed] [Google Scholar]
- 28.Zuo G, Wang J, Wang W. Proteins. 2006;63:165–173. doi: 10.1002/prot.20857. [DOI] [PubMed] [Google Scholar]
- 29.Knott M, Chan HS. Proteins. 2006;65:373–391. doi: 10.1002/prot.21066. [DOI] [PubMed] [Google Scholar]
- 30.Zhang J, Li W, Wang J, Qin M, Wang W. Proteins. 2008;72:1038–1047. doi: 10.1002/prot.22001. [DOI] [PubMed] [Google Scholar]
- 31.Pitera JW, Swope WC, Abraham FF. Biophys J. 2008;94:4837–4846. doi: 10.1529/biophysj.107.123265. [DOI] [PMC free article] [PubMed] [Google Scholar]
- 32.Settanni G, Fersht AR. J Mol Biol. 2009;387:993–1001. doi: 10.1016/j.jmb.2009.02.014. [DOI] [PubMed] [Google Scholar]
- 33.Liu H, Huo S. J Phys Chem B. 2012;116:646–652. doi: 10.1021/jp209791a. [DOI] [PMC free article] [PubMed] [Google Scholar]
- 34.Khandogin J, Brooks CL., III Biophys J. 2005;89:141–157. doi: 10.1529/biophysj.105.061341. [DOI] [PMC free article] [PubMed] [Google Scholar]
- 35.Khandogin J, Brooks CL., III Biochemistry. 2006;45:9363–9373. doi: 10.1021/bi060706r. [DOI] [PubMed] [Google Scholar]
- 36.Wallace JA, Shen JK. J Chem Theory Comput. 2011;7:2617–2629. doi: 10.1021/ct200146j. [DOI] [PMC free article] [PubMed] [Google Scholar]
- 37.Brünger AT, Karplus M. Proteins. 1988;4:148–156. doi: 10.1002/prot.340040208. [DOI] [PubMed] [Google Scholar]
- 38.Brooks BR, Brooks CL, III, Mackerell AD, Jr, Nilsson L, Petrella RJ, Roux B, Won Y, Archontis G, Bartles C, Boresch S, Caflisch A, Caves L, Cui Q, Dinner AR, Feig M, Fischer S, Gao J, Hodoscek M, Im W, Lazaridis KKT, Ma J, Ovchinnikov V, Paci E, Pastor RW, Post CB, Pu JZ, Schaefer M, Tidor B, Venable RM, Woodcock HL, Wu X, Yang W, York DM, Karplus M. J Comput Chem. 2009;30:1545–1614. doi: 10.1002/jcc.21287. [DOI] [PMC free article] [PubMed] [Google Scholar]
- 39.MacKerell AD, Jr, Bashford D, Bellott M, Dunbrack RL, Jr, Evanseck JD, Field MJ, Fischer S, Gao J, Guo H, Ha S, Joseph-McCarthy D, Kuchnir L, Kuczera K, Lau FTK, Mattos C, Michnick S, Ngo T, Nguyen DT, Prodhom B, Reiher WE, III, Roux B, Schlenkrich M, Smith JC, Stote R, Straub J, Watanabe M, Wiórkiewicz-Kuczera J, Yin D, Karplus M. J Phys Chem B. 1998;102:3586–3616. doi: 10.1021/jp973084f. [DOI] [PubMed] [Google Scholar]
- 40.MacKerell AD, Jr, Feig M, Brooks CL., III J Comput Chem. 2004;25:1400–1415. doi: 10.1002/jcc.20065. [DOI] [PubMed] [Google Scholar]
- 41.Hoover WG. Phys Rev A. 1985;31:1695–1697. doi: 10.1103/physreva.31.1695. [DOI] [PubMed] [Google Scholar]
- 42.Feller SE, Zhang Y, Pastor RW, Brooks BR. J Chem Phys. 1995;103:4613–4621. [Google Scholar]
- 43.Ryckaert JP, Ciccotti G, Berendsen HJC. J Comput Phys. 1977;23:327–341. [Google Scholar]
- 44.Darden T, York D, Pedersen L. J Chem Phys. 1993;98:10089–10092. [Google Scholar]
- 45.Essmann U, Perera L, Berkowitz ML, Darden T, Hsing L, Pedersen LG. J Chem Phys. 1995;103:8577–8593. [Google Scholar]
- 46.Im W, Lee MS, Brooks CL., III J Comput Chem. 2003;24:1691–1702. doi: 10.1002/jcc.10321. [DOI] [PubMed] [Google Scholar]
- 47.Pronk S, Páll S, Schulz R, Larsson P, Bjelkmar P, Apostolov R, Shirts MR, Smith JC, Kasson PM, van der Spoel D, Hess B, Lindahl E. Bioinformatics. 2013;29:845–854. doi: 10.1093/bioinformatics/btt055. [DOI] [PMC free article] [PubMed] [Google Scholar]
- 48.Hess B, Bekker H, Berendsen HJC, Fraaije JGEM. J Comput Chem. 1997;18:1463–1472. [Google Scholar]
- 49.Parrinello M, Rahman A. J Appl Phys. 1981;52:7182–7190. [Google Scholar]
- 50.Shea JE, Brooks CL., III Annu Rev Phys Chem. 2001;52:499–535. doi: 10.1146/annurev.physchem.52.1.499. [DOI] [PubMed] [Google Scholar]
- 51.Best RB, Zhu X, Shim J, Lopes PEM, Mittal J, Feig M, MacKerell AD., Jr J Chem Theory Comput. 2012;8:3257–3273. doi: 10.1021/ct300400x. [DOI] [PMC free article] [PubMed] [Google Scholar]
- 52.Chen W, Shi C, Mackerell AD, Jr, Shen J. J Phys Chem B. 2015;119:7902–7910. doi: 10.1021/acs.jpcb.5b02290. [DOI] [PMC free article] [PubMed] [Google Scholar]
- 53.Baldwin RL, Frieden C, Rose GD. Proteins. 2010;78:2725–2737. doi: 10.1002/prot.22803. [DOI] [PMC free article] [PubMed] [Google Scholar]
- 54.Baldwin RL, Rose GD. Curr Opin Struct Biol. 2013;23:4–10. doi: 10.1016/j.sbi.2012.11.004. [DOI] [PubMed] [Google Scholar]
- 55.Kuwajima K. Proteins. 1989;6:87–103. doi: 10.1002/prot.340060202. [DOI] [PubMed] [Google Scholar]
- 56.Dolgikh DA, Gilmanshin RI, Brazhnikov EV, Bychkova VE, Semisotnov GV, Venyaminov SY, Ptitsyn OB. FEBS Lett. 1981;136:311–315. doi: 10.1016/0014-5793(81)80642-4. [DOI] [PubMed] [Google Scholar]
- 57.Wyman J., Jr Adv Protein Chem. 1964;19:223–286. doi: 10.1016/s0065-3233(08)60190-4. [DOI] [PubMed] [Google Scholar]
- 58.Shen JK. Biophys J. 2010;99:924–932. doi: 10.1016/j.bpj.2010.05.009. [DOI] [PMC free article] [PubMed] [Google Scholar]
- 59.Cerminara M, Campos LA, Ramanathan R, Muñoz V. PLoS ONE. 2013;8:e78044. doi: 10.1371/journal.pone.0078044. [DOI] [PMC free article] [PubMed] [Google Scholar]
- 60.Kiefhaber T, Labhardt AM, Baldwin RL. Nature. 1995;375:513–515. doi: 10.1038/375513a0. [DOI] [PubMed] [Google Scholar]
- 61.Reiner A, Henklein P, Kiefhaber T. Proc Natl Acad Sci USA. 2010;107:4955–4960. doi: 10.1073/pnas.0910001107. [DOI] [PMC free article] [PubMed] [Google Scholar]
- 62.Neumaier S, Kiefhaber T. J Mol Biol. 2014;426:2520–2528. doi: 10.1016/j.jmb.2014.04.022. [DOI] [PubMed] [Google Scholar]
- 63.Jha SK, Marqusee S. Proc Natl Acad Sci USA. 2014;111:4856–4861. doi: 10.1073/pnas.1315453111. [DOI] [PMC free article] [PubMed] [Google Scholar]
- 64.Acharya N, Mishra P, Jha SK. J Phys Chem Lett. 2016;7:173–179. doi: 10.1021/acs.jpclett.5b02545. [DOI] [PubMed] [Google Scholar]
- 65.Shakhnovich EI, Finkelstein AV. Biopolymers. 1989;28:1667–1680. doi: 10.1002/bip.360281003. [DOI] [PubMed] [Google Scholar]
- 66.Onufriev A, Case DA, Bashford D. J Mol Biol. 2003;325:555–567. doi: 10.1016/s0022-2836(02)01207-x. [DOI] [PubMed] [Google Scholar]
- 67.Hua L, Zhou R, Thirumalai D, Berne BJ. Proc Natl Acad Sci USA. 2008;105:16928–16933. doi: 10.1073/pnas.0808427105. [DOI] [PMC free article] [PubMed] [Google Scholar]
Associated Data
This section collects any data citations, data availability statements, or supplementary materials included in this article.


