Abstract
Feeding animals glucose, fructose, sucrose, and fat-enriched diets can lead to diet-induced hyperglycemia, severity of which largely depends on type and concentration of nutrients used and length of dietary intervention. As a strategy of dietary intervention, we adopted glucose-enriched diet, drinking water, and intraperitoneal (i.p.) glucose injection at the dose previously determined to be effective to establish a sustained hyperglycemia over a period of 2 weeks. In our current study, we used 4 groups of Sprague Dawley rats: control, glucose-treated, glucose+tempol, and glucose+captopril-treated groups. Our study demonstrated that glucose levels gradually started to increase from day 3, and reached to the highest levels (321 mg/dl) at day 12 and maintained similar levels until the end of the study on day 14 in glucose treated-group compared to control. However, tempol- and captopril-treated groups showed significantly high glucose levels in only second week. Plasma insulin level has been significantly increased in glucose-treated animals but not in tempol- and captopril-treated groups when compared to control. We also observed elevated blood pressure (BP) in glucose-treated group compared to control, which can be attributed to increased Ang II production from 46.67 pg.ml−1 to 99 pg.ml−1 (control vs glucose), increased oxidative stress in cortical proximal tubule (PT), decreased urine flow, and increased expression and activity of PT-specific α1-subunit of Na+-K+-ATPase in renal cortex, the latter is responsible for increased sodium reabsorption from epithelial cells of PT into peritubular capillaries, leading to increased blood volume and eventual blood pressure. All these events are reversed in captopril- and tempol-treated animals.
Keywords: Hyperglycemia, hypertension, renin-angiotensin system
Introduction
Dietary intervention is a common strategy to induce chronic hyperglycemia in animals to emulate the diabetic complications observed in human beings. Numerous studies show that dietary supply of excess nutrients such as fructose, sucrose, glucose, fat to animals or other subjects for a period of time can induce sustained hyperglycemia resulting in many diabetic complications including hypertension, insulin resistance, and nephropathy (Chen et al. 2010; Lozano et al. 2016; Fakhruddin et al. 2017b). In our recent study, we have observed that oral and intraperitoneal glucose loading for a period of 2-weeks significantly elevated blood glucose levels concurrent with hyperinsulinemia and hypertension (Fakhruddin et al. 2017b). In line with this observation, some studies showed that animals fed glucose-enriched diets for 2–7 weeks promoted an elevation in blood pressure without significant changes in plasma glucose levels (Reaven & Ho, 1991; Kaufman et al. 1991). The elevated BP has been attributed to an increase in sympathetic nervous system stimulation and/or hyperinsulinemia (Kaufman et al. 1991).
Hyperglycemia can induce an elevation in blood pressure via numerous pathways. One of the potential pathways involved in raising blood pressure is the renin-angiotensin aldosterone system (RAAS), which is responsible for systemic and local production of Ang II, a potent vasoconstrictor. Conventionally, the effects of RAAS were considered to be mediated by its circulating components such as renin, angiotensinogen, angiotensin converting enzyme (ACE), and Ang II. However, physiological, biochemical, and molecular studies have demonstrated convincing evidences that RAAS components can also be produced in local tissues such as brain, heart, testes, kidney, beta-cells, and vasculature (Paul et al. 2006, Graciano et al. 2004; Dostal & Baker, 1999). Though systemic RAAS has an important role in elevating blood pressure, growing scientific evidence has showed that intrarenal upregulation of RAAS can be increasingly involved in raising BP and renal injury in diabetic conditions (Kobori et al. 2007; Suzaki et al. 2007; Mizuno et al. 2002).
Angiotensin II, a potent vasoconstrictor component of RAAS, can be increased independently of the plasma levels in the interstitial fluid of kidney cortex in response to different pathological conditions (Nishiyama et al. 2002; Prathipati et al. 2015; Nagai et al. 2005). In addition to Ang II, other RAAS components such as angiotensinogen, ACE, AT1R, and renin can be overexpressed specially in the proximal tubule of renal cortex (Nagai et al. 2005; Luo et al. 2015). RAAS components overexpressed in the kidney cortex under diabetic milieu cause dysregulation of fluid homeostasis through diverse signaling pathways, leading to increased Na+-reabsorption followed by increased extracellular fluid volume. Several studies have shown that hyperglycemia-induced upregulation of Ang II increases its interaction with AT1R to elicit various pathological responses including enhanced aldosterone secretion, increased fluid reabsorption through proximal tubule, increased reactive oxygen species (ROS), renovascular constriction etc (Kobori et al. 2007; Navar, 2014; Leehey et al. 2004). Angiotensin II (Ang II) along with high glucose can significantly increase the generation of ROS through activation of NADPH oxidase, mETC, AGEs, and uncoupled eNOS resulting in the development of oxidative stress (Fakhruddin et al. 2017a). Interestingly, Ang II-induced ROS generation in turn further intensify the interaction between Ang II and ATIR resulting in a vicious cycle of renal injury.
Renal proximal tubular cells play a pivotal role in Na+ reabsorption primarily via the apical Na+/H+ exchanger (NHE) and the Na+–HCO3− cotransporter, where the reabsorbed intracellular Na+ is pumped to the extracellular fluid through the basolateral sodium pump, i.e. the Na+-K+-ATPase (NKA). Interestingly, oxidative stress accompanied by enhanced Ang II activity stimulate Na+/H+ exchanger 3 (NHE3) activity through increased Jak2-dependent CaM phosphorylation and phospholipase c activity in the proximal tubule (PT), which causes increased sodium retention and contributes to an increase in blood pressure (Banday & Lokhandwala, 2011). This observation was supported by evidence that oxidative stress causes an imbalance in RAAS in favor of pro-hypertensive components in the renal cortex and in in vitro renal proximal cells, which contributes to antinatriuretic effects resulting in increased fluid retention, and blood pressure (Luo et al. 2015). In addition, streptozotocin-induced diabetes and/or Ang II infusion increased mRNA and protein levels of NKA α1 subunit in the renal cortex (Fekete et al. 2008). Ang II also directly activates the NKA α1 subunit through phosphorylation of serine residues on specific peptide segments that underlies the role of the α1 subunit in efflux of intracellular sodium (Yingst et al. 2004).
In our previous study, a chronic hyperglycemic and hypertensive rat model was developed through chronic oral and intraperitoneal glucose loading for a 2-week period. Hyperglycemia produced an elevation in blood pressure within all the groups. The mechanism underlying elevated BP in glucose-fed rats are not well understood. Some studies showed that glucose-fed rats developed hypertension because of increased sympathetic activity. However, the current model was exposed to sustained hyperglycemic conditions for a two-week period, therefore we proposed that the sustained hyperglycemia promoted an increased exposure of high glucose to glomerular as well as tubular cells via increased glomerular filtration of glucose, which will provoke glucose-mediated aberrant signaling pathways in local renal cells. Increased glucose uptake from the high glucose-enriched tubular filtrate by tubular cells can locally induce oxidative stress and RAS activation leading to impairment in fluid homeostasis as demonstrated in many diabetic animal models (Vallon & Thomson, 2012; Shin et al. 2016; Brezniceanu et al. 2007).
Based on these observations, we hypothesized that hyperglycemia resulting from chronic oral and intraperitoneal glucose loading can induce Ang II production and oxidative stress in proximal tubular cells to promote increased sodium reabsorption. A hyperglycemia-induced increase in Ang II and/or oxidative stress are likely to upregulate protein levels of Na+-K+-ATPase in the basolateral membrane of PT epithelial cells, which pumps intracellular Na+ to interstitial fluid, resulting in increased Na+ reabsorption followed by increased blood volume and eventual hypertension.
Materials and Methods
Ethical Approval
All experiments were performed in accordance with the ethical principles of ‘The Journal of Experimental Physiology’ and approved by the University of Louisiana at Monroe Institutional Animal Care and Use Committee (IACUC) approved protocol number 15JUN-KEJ-01 in accordance with all federal regulations as detailed in the tenth guide for use of laboratory animals in scientific experiments. The experiments were performed on Male Sprague-Dawley rats [(250 – 300g), Harlan, Indianapolis, IN, USA], which were housed under controlled humidity (60±10%), temperature (23±2°C) and light (12-hour cycle light/dark) with free access to normal/glucose-enriched food and water throughout the study. At the end of the study, animals were anesthetized with a single dose of thiobutabarbital (Inactin, 120 mg.kg−1 I.P.) and sacrificed by cervical dislocation while under anesthesia. The investigators understand the ethical principles under which The Journal of Experimental Physiology operates and our work complies with this animal ethics checklist.
Materials
CMA 30 linear microdialysis probes were obtained from CMA/Microdialysis (Harvard Apparatus, Holliston, MA, USA). 4–20% gradient SDS-PAGE was obtained from Bio Rad (Hercules, CA, USA). Primary antibodies for Na+-K+-ATPase α1-subunit (NKA α1), beta-actin, fluorescein phalloidin, and DAPI were purchased from Life Technologies Corporation (Grand Island, NY, USA). Phospho-Na+-K+-ATPase α1-subunit (Ser 18) (p-NKA α1) antibody was obtained from Cell Signalling Technology (Denvers, MA, USA). Membrane slide 1.0 (PET) was bought from Carl Zeiss Microscopy GmbH (Königsallee, Göttingen, Germany). Spin trapping reagents (CMH and CPH) and diethyldithiocarbamic acid were obtained from Enzo Life Sciences (Farmingdale, NY, USA). Captopril, Tempol, D-(+)-Glucose, and Inactin (thiobutabarbital sodium) were purchased from Sigma-Aldrich Inc, Saint Louis, MO, USA. Rat insulin elisa kits were obtained from Life Technologies, Frederick, Maryland, USA. Rat specific angiotensin II Elisa kits were obtained from Phoenix Pharmaceuticals, Inc. (Burlingame, CA, USA). Blood glucose test strips were purchased from Nipro Diagnostics, Fort Lauderdale, Florida, USA. Regular rat chow (in powder form) was bought from Harlan, Indianapolis, IN, USA.
Animals
Male Sprague-Dawley rats (250 – 320g), supplied by animal research facility at the University of Louisiana at Monroe, were housed in a controlled environment and had free access to normal/glucose-enriched food and water throughout the study. All experiments were approved by the University of Louisiana at Monroe Institutional Animal Care and Use Committee (IACUC).
In the current study, we followed a previously described hyperglycemic and hypertensive rat model protocol, which was developed through oral and intraperitoneal glucose loading for a period of 2 weeks. We provided animals with high glucose-enriched food and drinking water along with intraperitoneal glucose injection at the following dose: feed: 80 gm.kg−1BW, drinking water: 2 gm.kg−1BW ml−1, injection: 2.25 gm.kg−1BW.ml−1 (First Week) that were increased to 80 gm.kg−1BW in the second week, drinking water: 2.5 gm.kg−1BW ml−1, injection: 2.75 gm.kg−1BW.ml−1 (Second Week), to challenge the capacity of beta cells to secrete insulin for glucose homeostasis as per the protocol (Fakhruddin et al. 2017b). We have employed 4 groups of animals for our current study: control, glucose-treated, glucose-treated with captopril (G+Captopril), and glucose-treated with tempol (G+Tempol).
Experimental Protocol
Prior to the study, animals were individually housed and randomly divided into four groups: control (n = 6), glucose-treated (n = 6), glucose-treated with captopril (n = 9), and glucose-treated with tempol (n = 9). Fresh glucose-enriched food and water were prepared every morning according to the dose detailed above and supplied to all groups except the control before the injection. The injection dose was also prepared every morning and preserved until the evening dose. To sustain plasma glucose levels over the second week, we had to slightly increase the glucose dose with drinking water and injection in the second week. Since we couldn’t exceed a certain volume and concentration in the injection as well as in the drinking water to avoid animal discomfort at the outset of the study, we only increased the glucose dose slightly with injection and water in the second week, which didn’t differ from the initial dose in terms of volume and concentration as body weight was also slightly decreased. For all groups (e.g. control, glucose and/or drug treated), glucose levels were monitored by a TRUE test glucose meter in the morning (8–9 am, before injection) and evening (7–8 pm, 3 hours after injection) by drawing a tiny blood drop (approx. 0.5 μl) from the tail of restraint animals and the average glucose levels of two readings were recorded. In addition to glucose, G+captopril and G+tempol groups were given captopril (8 mg.kg−1.day−1) and tempol (100 μmol.kg−1day−1), respectively, by intraperitoneal injection as a single dose each day with the morning dose of glucose. Captopril is an ACE inhibitor to block Ang II production, while tempol is an antioxidant that neutralizes reactive oxygen species (ROS), thereby inhibiting the development of oxidative stress. At the end of the study (on 15th day), blood was collected to measure for insulin levels.
Food was freshly prepared daily by mixing the required glucose amount with standard rat chow (powder form), and reconstituting it into a ball with a small quantity of tap water. Based on previous studies in our lab, rats were determined to consume an average of 50 gm of food daily, therefore, the glucose doses were calculated based on the animal’s weight to provide a daily allowance of at least 50gm. Glucose-enriched drinking water was prepared by simply dissolving the required amount of glucose in water.
Surgical Procedure
At the end of the final study day (on 15th day), surgeries were performed on animals. Before surgery was begun, all animals were examined to ensure they were adequately anesthetized by testing the pedal withdrawal reflex (foot pad pinch on both hind feet). If the foot pad pinch caused a response, an additional amount of anesthetic was injected and re-tested before starting the procedure. The surgical procedures were similar to those that were previously described (Fakhruddin et al. 2017b; Alanazi et al. 2016). Briefly, rats were anesthetized with a single dose of thiobutabarbital (Inactin, 120 mg.kg−1 I.P.). The carotid artery, jugular vein, and bladder were cannulated for hemodynamic evaluation, saline infusion, and urine sampling, respectively. In order to facilitate breathing, rats were intubated with a tracheal cannula (PE-240, Becton Dickinson, Sparks, MD). After the cannulation procedures, rats were positioned on their right flank, and a small left flank incision was made to expose the left kidney. CMA 30 linear microdialysis probes were inserted into the renal cortex of the exposed kidney for renal interstitial sample collection, and the kidney was carefully placed into the abdominal cavity followed by the closure of the incision by surgical packing. The inlet tube of the inserted probe was attached to a microinfusion pump for physiological saline infusion (3 μl.min−1). The outlet tube was connected to Eppendorf tubes for sample collections. The carotid catheter was already connected to a pressure transducer which is coupled with a polygraph system (Biopac Systems) and a personal computer. As previously described, a 45 min stabilization period was observed, and after stabilization period, blood pressure and heart rate were recorded continuously for a period of 4 hours.
Sample Collection
Renal Interstitial Fluid (RIF) and Urine Collection
After surgery, a 45 min recovery period was observed followed by a 4 hour interstitial fluid and urine collection from all groups. For interstitial fluid collection, physiological saline was infused at a rate of 3 μl.min−1 through the inlet tube and renal interstitial fluid was collected via the outlet tube of the probe. Urine was collected through the bladder catheter. At the end of the 4 hour hemodynamic assessment and sample collection, blood was drawn from the carotid artery and the right kidney and heart were extracted. Kidneys and hearts were snap-frozen immediately after extraction in liquid nitrogen-cold isopentane. All samples and organs were stored at −80° C until analyzed. Plasma was obtained by immediate centrifugation and stored at −80°C.
Immunofluorescence Laser-catapult Microdissection (IF-LCM) of Proximal Tubules
Serial 10-μm-thick frozen sections were cut from the kidney cortex, in a Leica 1860 cryostat, and mounted on polyethylene terephthalate (PET) membrane slides (Carl Zeiss Microscopy GmbH, Königsallee, Göttingen, Germany). For dissection of proximal tubules, cortical segment staining was adapted from the sequential process of fluorescence staining previously described by others (Micanovic et al. 2015). At least, 100,000–200,000 μm2 proximal tubule was catapulted into a tube containing 30 μl NP40 cell lysis buffer (Life Technologies, Frederick, Maryland, USA).
Sample Analysis
Plasma Glucose and Insulin Measurement
Blood samples were drawn from the tail vein and analyzed for glucose levels using a TRUE test glucose meter in all the groups (n=6). Plasma insulin levels were measured using commercially available rat insulin Elisa kits (Life Technologies, Frederick, Maryland, USA).
Determination of Ang II levels
Dialysate from control, glucose-treated, G+Captopril, and G+Tempol groups were collected and freeze dried. Powdered samples were reconstituted (2× concentrated) using the 1× EIA assay buffer supplied with the Elisa kits. An ELISA was performed on the concentrated interstitial fluid samples to determine the concentration of Ang II present by comparison to a standard curve.
Plasma and Urine Analysis for electrolytes
Plasma and urine were analyzed for sodium and potassium electrolytes via an IL943 automatic flame photometer.
Determination of superoxide and peroxynitrite free radicals by EPR
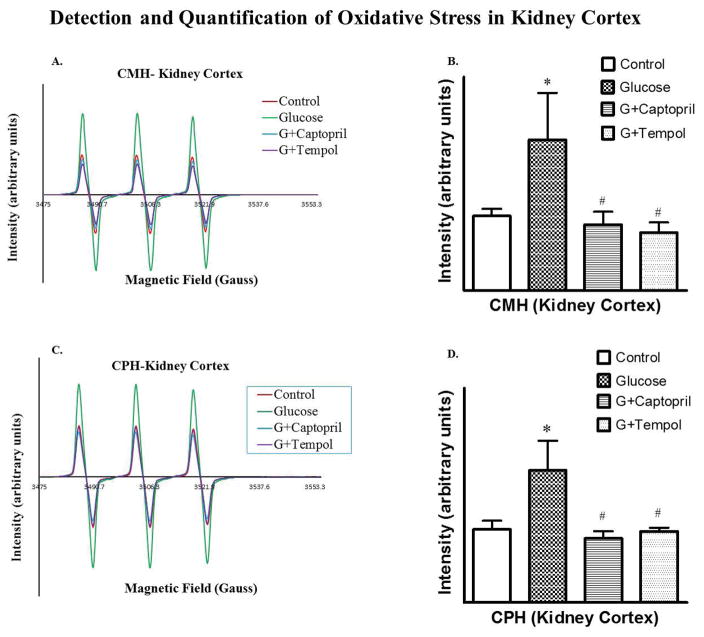
Oxidative stress was analyzed using a versatile non-destructive analytical technique, EPR – Electron Paramagnetic Resonance Spectroscopy. As previously described, superoxide (O2−) and peroxynitrite (ONOO−) were determined in the kidney cortex by using EPR spectrometer (Prathipati et al. 2015). Spin probes CMH (1-hydroxy-3-methoxycarbonyl-2, 2, 5, 5-tetramethylpyrrolidine.HCl) and CPH (1-hydroxy-3-carboxy-2, 2, 5, 5-tetramethylpyrrolidine.HCl) were used as spin trapping reagents to trap O2− and ONOO−, respectively, for measurement by EPR spectrometer. Briefly, kidney tissues were cut into 2 mm-thick similar slices just before the experiment and tissue slices were incubated for 1 hour at 37°C in 0.5 ml of Krebs/HEPES buffer (pH 7.4) containing 25 μM deferoxamine (DF) and 5 μM diethyldithiocarbamate (DETC) along with 5 mM of CMH or CPH. After incubation, an EPR capillary tube was filled with the sample solution to be ready for EPR analysis. EPR spectrometer was adjusted to the following settings: field sweep, 80G; microwave frequency, 9.64GHz; microwave power, 1.34mW; modulation amplitude, 5G; conversion time, 327.68ms; time constant, 10.24ms; 512 points resolution; and receiver gain, 1×10⁴.
Protein Extraction and Western Blot Analysis
Catapulted proximal tubules contained in NP40 cell lysis buffer were vortexed and centrifuged and clear supernatant was collected for western blot. Protein concentrations were determined via a bicinchoninic acid (BCA) protein assay kit. The obtained proteins were resolved by using 4–20% gradient SDS-PAGE. After separation, proteins were transferred to 0.45μm PVDF-Plus membranes. Membranes were treated with Pierce Western blot signal enhancer and blocked with 0.1% Tween-20 and 2% bovine serum albumin prior to sequential incubation with primary antisera, peroxidase-conjugated secondary antiserum, and Supersignal West Femto Maximum Sensitivity substrate.
Statistical Analyses
Data were expressed as mean ± SD and analyzed by two-way analysis of variance (ANOVA) followed by Bonferroni multiple comparison test when appropriate (GraphPad InStat 3). Some data were also analyzed using one-way ANOVA followed by Tukey-Kramer tests or unpaired student’s t-test when appropriate. In Elisa, each animal sample was duplicated on 96-well immunoplate and taken average absorption of the two readings for that animal. All western blot experiments were triplicated. P < 0.05 was considered significant.
Results
Food, Water Intake and Body Weight
Glucose-enriched food as well as water consumption and body weight were recorded, as the average of the first and second week values. Food and water intake as well as body weight were significantly decreased in glucose-, captopril- and tempol treated animals when compared to control (Data not shown). However, there was no significant change in food and water consumption when compared within the same group. Body weight was significantly decreased in the first and second week as compared to the initial body weight within the group, while second week body weight reduction was relatively more than the first week; there were no significant differences.
Glucose Treatment
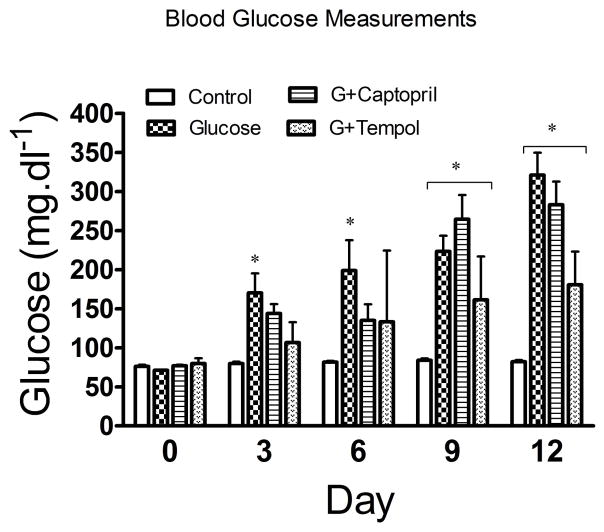
Our study showed that glucose levels began to increase significantly from day 3 (170 ± 71mg.dl−1) through day 6 (199 ± 110mg.dl−1), and continued to progressively and significantly increase from day 9 (223 ± 57mg.dl−1) to day 12 (321 ± 81mg.dl−1) in the glucose-treated group when compared to control. Moreover, measurements in a small subset of glucose-treated animals from day 13 showed a similar glucose level to day 14, indicating that a peak and sustained elevation in blood glucose level was achieved. However, glucose levels didn’t significantly increase until the second week in G+captopril (264 ± 88mg.dl−1 and 282 ± 84mg.dl−1 in day 9 and 12, respectively) and G+tempol groups, where the G+tempol group only showed a significant increment in glucose levels on day 12 (180 ± 43mg.dl−1), and both groups showed a similar glucose level on day 13 and day 14 (Figure 1).
Fig. 1.
Measurement of blood glucose levels. Values are expressed as mean ± SD. *P <0.05 in the glucose, G+captopril, and G+tempol treated group when compared to the control group (Two-way ANOVA followed by Bonferroni tests)
Development of Hyperinsulinemia
Figure 2 shows that glucose treatment (25 ± 13μlU.ml−1) produced a significant increase in circulating insulin levels as compared to control (16 ± 9μlU.ml−1). The observed hypoglycemic mediated increase was attenuated with both captopril (10 ± 1μlU.ml−1) and tempol (11 ± 3μlU.ml−1) treatments.
Fig. 2.
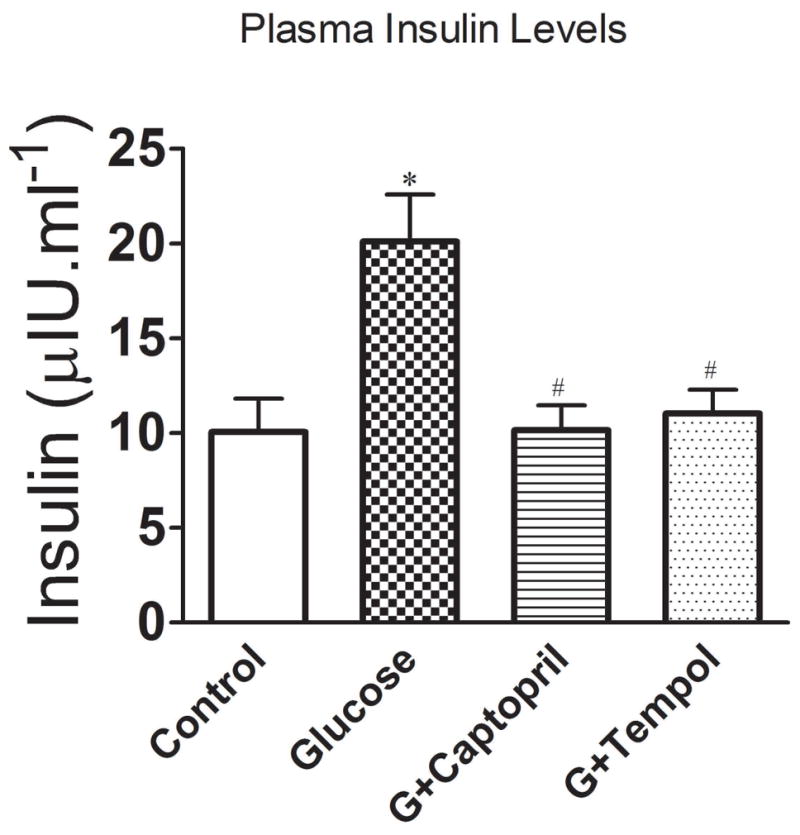
Plasma insulin levels in control, glucose, G+captopril, and G+tempol treated groups. Values are expressed as mean ± SD. *P < 0.05 for the glucose vs control, #P <0.05 for glucose vs G+captopril, and G+tempol treated groups, respectively (One-way ANOVA followed by Tukey-Kramer multiple comparison).
Development of Hypertension
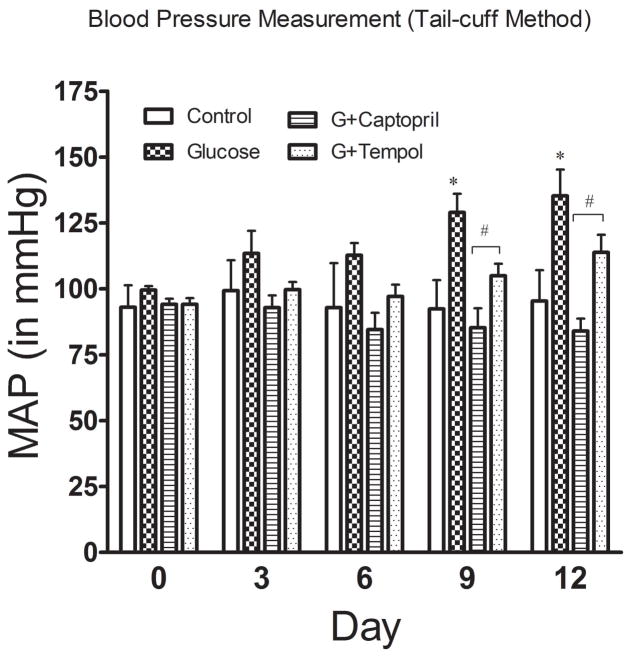
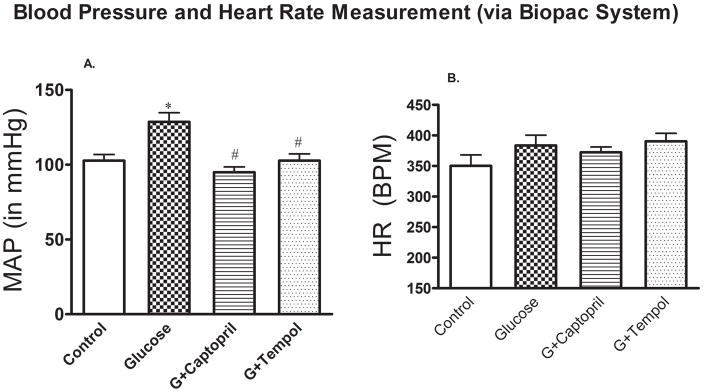
In addition to sustained hyperglycemia induced by such dietary intervention, BP also started to increase in the animals, albeit not significantly, from the very beginning of glucose feeding and injection, which led to a significant increase by day 9 (129 ± 18mmHg) through day 12 (135 ± 26mmHg) as compared to control day 9 (92 ± 11mmHg) and day 12 (95 ± 12mmHg) (Figure 3) and at the end of study (day 15: 129 ± 6mmHg) vs control (day 15: 103 ± 10mmHg) (Figure 4A). The glucose mediated increase in BP was returned to control levels by both captopril (day 9: 85 ± 19mmHg; day 12: 84 ± 12mmHg) (Figure 3) and tempol (day 9: 105 ± 12mmHg; day 12: 113 ± 17mmHg) (Figure 3) treatments. This attenuation in glucose mediated hypertension was observed at the end of the study as well [G+captopril; day 15: 95 ± 9mmHg: G+tempol; day 15: 102 ± 12mmHg] (Figure 4A). However, there were no significant differences in heart rate between the different treatment groups (Figure 4B).
Fig. 3.
Blood pressure measurement. Blood pressure was measured via tail cuff plethysmography for each of the groups (control, glucose, G+captopril, and G+tempol treated groups, n=6). Values are expressed as mean ± SD. *P <0.05, and #P <0.05 for the glucose vs control, and glucose vs G+captopril, G+tempol treated groups on day 0, day 3, day 6, day 9, and day 14 (Two-way ANOVA followed by Bonferroni posttests). When time factor was considered, the BP change was not significant at day 3 and 6 for all groups but captopril. However, BP change was significant in only day 6 for control vs glucose, and glucose vs G+tempol groups when tested individually using student’s t-test.
Fig 4.
A. In-line mean arterial pressure (MAP) and B. heart rate (HR) measurement. Values are expressed as mean ± SD. *P < 0.05, and #P < 0.05 for the control vs glucose, and glucose vs G+captopril, G+tempol treated group, respectively (one-way ANOVA followed by Tukey-Kramer posttests). B. Heart rate: There was no significant difference in HR between all groups.
Determination of Renal Interstitial Angiotensin II levels
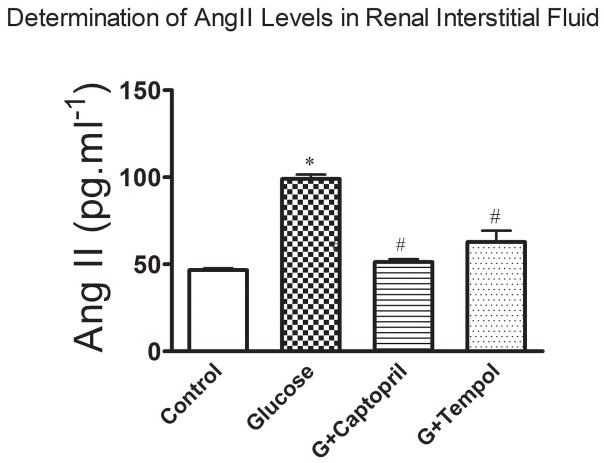
Figure 5 shows a significant increase in renal interstitial AngII levels in the glucose treated (99 ± 6pg.ml−1) group as compared to the control (47 ± 2pg.ml−1: Figure 5). The observed increase in renal interstitial AngII levels was returned to control in the G+captopril (51 ± 4pg.ml−1) treated group and attenuated in the G+tempol (63 ± 6pg.ml−1) treated group (Figure 5).
Fig 5.
Angiotensin II was measured in the renal interstitial fluid sampled from the kidney cortex by commercially available Elisa kits. Values are expressed as mean ± SD. *P < 0.05, and #P < 0.05 for the control vs glucose, and glucose vs G+captopril, G+tempol treated groups, respectively (one-way ANOVA followed by Tukey-Kramer posttests).
Development of Oxidative Stress
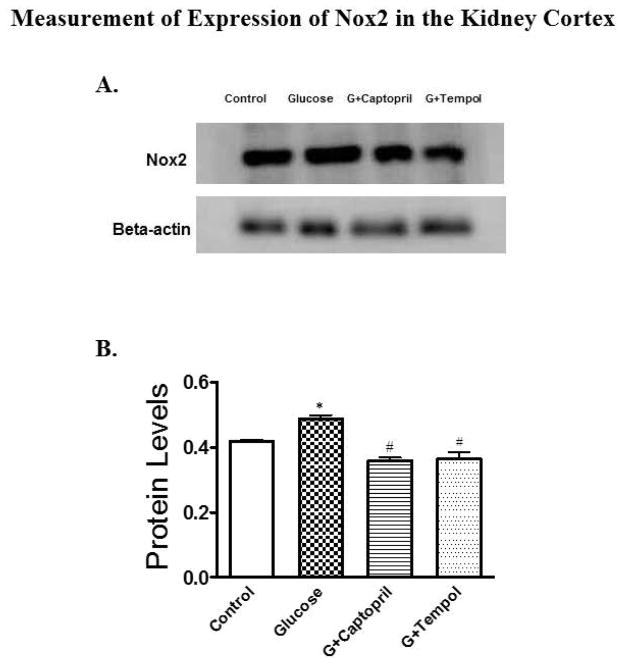
Glucose-treated animals had an increased O2•− (3.5E+07 ± 1.1E+07 arbitrary units: Figure 6B) and OONO− (1.2E+07 ± 2.8E+07 arbitrary units: Figure 6D) in comparison to control (O2•−; 1.8E+06 ± 2.0E+06: Figure 6B and OONO−; 6.8E+06 ± 2.0E+06: Figure 6D) as determined by EPR in the renal cortical tissue of this hypertensive hyperglycemic rat model. Development of oxidative stress has been further confirmed by evaluating the expression Nox2 protein levels in PT, which increased significantly in glucose-treated (6.9E+05 ± 1.3E+06 arbitrary units) animals while captopril (4.1E+05 ± 8.2E+05 arbitrary units) and tempol (2.2E+05 ± 4.3E+05 arbitrary units) treatments reduced the protein to control (5.0E+05 ± 10.0E+05 arbitrary units) levels (Figure 7B).
Fig 6.
Detection of superoxide (5A, B) and peroxynitrite (5C, D) to measure oxidative stress. 5A and 5B show EPR signal intensity, and relative EPR signal area (arbitrary units), respectively, for superoxide detection. 5C and 5D show EPR signal intensity, and relative EPR signal area (arbitrary units), respectively, for peroxynitrite detection. *P < 0.05, and #P < 0.05 for the control vs glucose, and glucose vs G+captopril, G+tempol treated group, respectively (one-way ANOVA followed by Tukey-Kramer posttests).
Fig 7.
Western blot analysis for expression of Nox2 protein in the PT of kidney cortex. 6A and 6B present protein blot and quantified density of protein blots when normalized to β-actin for all groups. A significant increase in Nox2 expression was observed in the glucose-treated group as compared to control while expression was reduced significantly in G+captopril and G+tempol groups when compared to the glucose-treated group. *P < 0.05, and #P < 0.05 for the control vs glucose, and glucose vs G+captopril, G+tempol treated groups, respectively (one-way ANOVA followed by Tukey-Kramer posttests).
Measurement of Urine Flow, Urinary Sodium Excretion and Plasma Sodium Levels
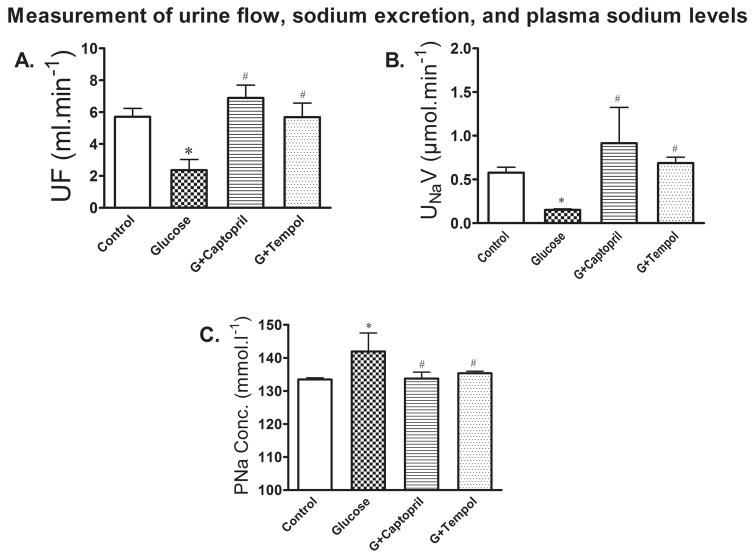
Figure 8A shows there was a significant decrease in urine flow mediated by glucose (2 ± 1ml.min−1) treatment as compared to control (6 ± 1ml.min−1). The glucose mediated decrease in urine flow was returned to control by G+captopril (7 ± 2ml.min−1) and G+tempol (6 ± 2ml.min−1) treatments (Figure 8A). Glucose treatment produced a significant reduction in sodium excretion (0.2 ± 0.02ml.min−1: Figure 8B) and an increase in plasma sodium (142 ± 6ml.min−1: Figure 8C) levels as compared to control (sodium excretion: 0.6 ± 0.2ml.min−1 : Figure 8B; plasma sodium: 133 ± 1ml.min−1: Figure 8C). The observed decrease in sodium excretion and increase in plasma sodium was returned to control in the G+captopril treated (sodium excretion: 0.7 ± 1ml.min−1 : Figure 8B; plasma sodium: 133 ± 6ml.min−1: Figure 8C) and G+tempol treated (sodium excretion: 0.7 ± 0.2ml.min−1 :Figure 8B; plasma sodium: 135 ± 2ml.min−1: Figure 8C) groups.
Fig 8.
A. Urine flow (UF) was significantly decreased in the glucose-treated animals, but increased in G+captopril and G+tempol treated animals. B. In line with decreased urine flow, urinary sodium excretion (UNaV) was significantly decreased in the glucose-treated groups while sodium excretion is increased in the captopril and tempol treated groups. C. shows increased conservation of plasma sodium while it reduced plasma sodium concentration (PNa Conc.) in captopril and tempol treated animals. These observations together imply that increased sodium is retained in the kidney. Values are expressed as mean ± SD. *P < 0.05, and #P < 0.05 for the control vs glucose, and glucose vs G+captopril, G+tempol treated groups, respectively (one-way ANOVA followed by Tukey-Kramer posttests).
Laser Capture Micro-dissection of the PT and Analysis for Na+-K+ ATPase α1 subunit and phospho-Na-K-ATPase α1 subunit (Ser 18)
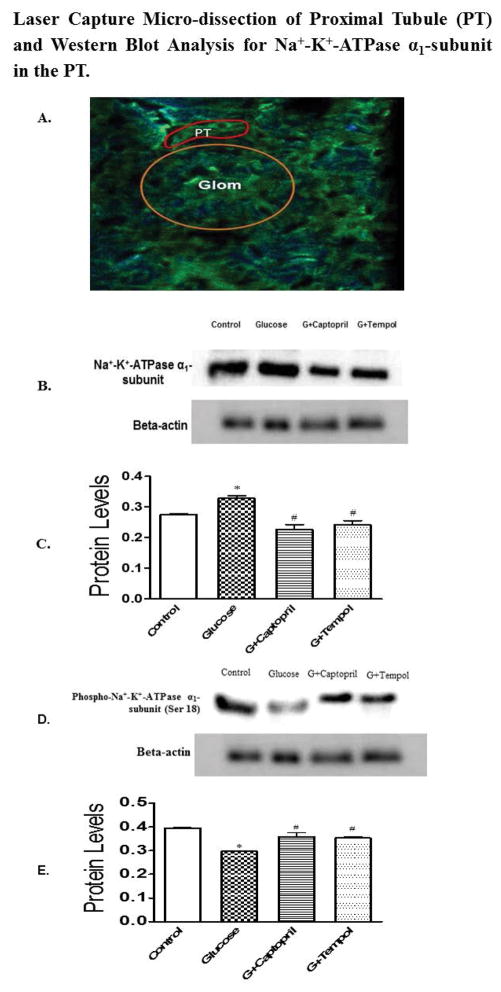
Figure 9A shows the PET stained image of the glomerulus (yellow circle) and PT (in red) before laser capture micro-dissection. Glucose-treated animals had an increased Na+-K+ ATPase α1 subunit expression in the PT (0.4 ± 0.009 arbitrary units: Figure 9C) in comparison to control (0.2 ± 0.005: Figure 9C). The increase in Na+-K+ ATPase α1 subunit expression in the PT was attenuated by G+captopril (0.2 ± 0.03 arbitrary units: Figure 9C) and G+tempol (0.2 ± 0.02 arbitrary units: Figure 9C) treatments. Furthermore, glucose (0.2 ± 0.007 arbitrary units: Figure 9E) treatment produced a significant reduction in phospho-Na+-K+-ATPase α1 subunit (Ser 18) as compared to control (0.4 ± 0.01 arbitrary units: Figure 9E). There was a significant increase in the Na+-K+ ATPase α1 subunit expression to phospho-Na+-K+-ATPase α1 subunit (Ser 18) ratio in the glucose (1.1) treated animals as compared to control (0.69). The observed glucose mediated reduction in phospho-Na+-K+-ATPase α1 subunit (Ser 18) was returned to control levels by G+captopril (0.4 ± 0.01 arbitrary units: Figure 9E) and G+tempol (0.4 ± 0.01 arbitrary units: Figure 9E) treatments. In addition the ratio of Na+-K+ ATPase α1 subunit expression to phospho-Na+-K+-ATPase α1 subunit (Ser 18) was returned to control levels in the G+captopril (0.63) and G+tempol treated (0.68) animals.
Fig 9.
A. 10 μm thick tissue sections were cut in cryostat and mounted on PET-slides followed by serial staining as described in the protocol. The sections were observed under immunofluorescence-laser capture microscopy to catapult proximal tubule. The image (A) shows glomerulus (yellow circle) and PT (in red squiggle). B, D and C, E exhibit protein blot and quantified density of protein blots, respectively, from PT lysates when normalized to β-actin for all groups. A significant increase in Na+-K+-ATPase α1-subunit expression was observed in the glucose-treated group compared to control while expression was reduced significantly in G+captopril and G+tempol groups when compared to the glucose-treated group (B, C). Conversely, phosphorylated Na+-K+-ATPase α1-subunit (Ser 18) was attenuated in glucose group while captopril- and tempol treated animals showed significantly increased phosphorylation. The ratio of Na+-K+-ATPase α1-subunit expression to phosphorylated Na+-K+-ATPase α1-subunit was 0.69 in the Control, 1.1 in the glucose treated groups, 0.63 in the G+captopril treated group and 0.68 in the G+tempol treated group. *P < 0.05, and #P < 0.05 for the control vs glucose, and glucose vs G+captopril, G+tempol treated groups, respectively (one-way ANOVA followed by Tukey-Kramer posttests).
Discussion
The current study showed that there was a progressive and sustained increase in glucose levels beginning on day 3 of the study that was mediated by glucose treatments. Interestingly, this observation along with our previous study (Fakhruddin et al. 2017b) indicate that BP can be increased in glucose-fed animals regardless of their plasma glucose levels, as long as the BP increment is sustained by a consistent increase in blood glucose and insulin levels.
Increased BP can be attributed to enhanced production of angiotensin II, a potent vasoconstrictor, accompanied by increased generation of superoxide, and peroxynitrite free radicals with consequent development of oxidative stress in the kidney cortex. In addition, glucose-treated animals demonstrated high plasma insulin levels at the end of the 2-week study. Conversely, kidney cortical levels of angiotensin II, and oxidative stress as well as plasma insulin levels were significantly reduced in captopril- and tempol-treated animals resulting in decreased blood pressure. This indicates the involvement of induction of the renin-angiotensin-aldosterone-system, oxidative stress in the kidney cortex and/or hyperinsulinemia are involved in the observed hypertension in this hypertensive and hyperglycemic rat model.
It is evident in some other studies that animals fed glucose-enriched diets may develop hypertension accompanied with hyperinsulinemia and variable plasma glucose levels (normal to moderate hyperglycemia) depending on the nutrient concentration and length of feeding, implying that hypertension may develop regardless of plasma glucose levels in glucose-fed animals (Reaven & Ho, 1991; Kaufman et al. 1991; Midaoui & Champlain, 2002). Some studies showed that hypertension in glucose-fed normal subjects is caused by increased sympathetic nervous system (SNS) activity, and SNS activity-mediated increased blood pressure is predominantly caused by a hyperinsulinemic condition, albeit hyperglycemia may also be involved (Kaufman et al. 1991; Rowe et al. 1981).
Since our study showed sustained hyperglycemia in response to repeated oral and intraperitoneal glucose loading, hyperglycemia induced in such a way is likely to increase exposure of high glucose to the glomerular and tubular cells through hyperfiltration, an episode similar to the one encountered during prediabetes (Vallon & Thomson, 2012). Increased glomerular filtration results in increased glucose in tubular filtrate, most of which is reabsorbed in the early proximal tubule by the high-capacity sodium-dependent glucose transporter 2 (SGLT2), and the remaining luminal glucose is taken up in further distal parts of the proximal tubule by the low-capacity SGLT1, leading to increased intracellular concentration of glucose in proximal epithelial cells.
High intracellular glucose concentration can evoke abnormal signaling transduction pathways leading to pathophysiological functions of the proximal tubule. One of the abnormalities of hyperglycemia in the diabetic settings is to elicit increased upregulation of both local and systemic RAS components. Interestingly, the proximal tubule increases local expression and production of various pro-hypertensive RAS components including angiotensinogen, ACEs, AT1R, and Ang II, which play a pivotal role in the pathomechanisms of diabetic nephropathy as evident in growing body of studies (Kobori et al. 2007; Luo et al. 2015; Zhang et al. 2002). In the current study, a significant increase in Ang II production in renal interstitial fluid was observed. Ang II, a potent pressor hormone, plays a critical role in not only vasoconstriction, but also fluid retention in the proximal tubule. Renal angiotensin II mediates its hypertensive effects through interaction with both local and systemic AT1R that results in both intra- and extra-renal vasoconstriction, increased cardiac contractility, and increased sodium reabsorption in the renal tubules both directly and via increased aldosterone secretion from the adrenal gland (Crowley et al. 2006; Navar, 2010). Angiotensin II can also induce the generation of superoxide by activating NADPH oxidase, a superoxide generating machinery, promoting intrarenal oxidative stress. In addition to NADPH oxidase, other diverse pathways including mETC, AGEs, uncoupled NOS can induce the development of oxidative stress in diabetic milieu (Fakhruddin et al. 2017a).
Furthermore, hyperglycemia can also induce intrarenal oxidative stress via other mechanisms where increased intracellular glucose levels in proximal epithelial cells can pose a risk of diverting glucose to different metabolic pathways instead of the glycolytic pathway; the latter is not a common pathway as proximal tubular cells do not utilize glucose for energy production. For example, high glucose in diabetic subjects is likely to undergo polyol/sorbitol pathway, autooxidation, de novo synthesis of diacylglycerol, and non-enzymatic glycation (AGEs production), thus increasing the susceptibility of proximal tubular cells to the enhanced generation of ROS followed by the development of oxidative stress (Dunlop, 2010; Forbes et al. 2008). This is intriguing to note that Ang II and ROS can induce each other, thus exhibiting a vicious cycle of pressor effect in the kidney cortex. This is evident in our study where we found attenuated Ang II levels in tempol-treated animals while captopril-treated animals showed decreased superoxide and peroxynitrite generation.
Increased expression of Nox2 levels in the current study is in contrast with other studies which demonstrated increased Nox4 expression in the proximal tubule followed by the development of oxidative stress in diabetes (Sedeek et al. 2010). This discrepancy can be attributed to the animal strains, disease model, and in vitro versus in vivo protein expression. However, multiple lines of evidence show diabetes-induced upregulation of Nox2 in the renal cortex, indicating the involvement of Nox2 in the development of renal oxidative stress during diabetes, consequently, in the development of hypertension and diabetic nephropathy (Ohshiro et al. 2006; Sedeek et al. 2013).
The current study demonstrated that Ang II and/or ROS in the renal cortex increased blood pressure by enhancing sodium retention in the proximal tubule, which is supported by the findings that excretion of Na+ in urine as well as urine flow was significantly reduced in glucose-treated animals, while treatment with captopril and tempol attenuated this response. Increased reabsorption of Na+ into the circulatory system was confirmed in that a significantly higher concentration of Na+ in the plasma was measured. These findings are consistent with those of other studies that exhibited increased intrarenal oxidative stress and RAS activation (e.g. pro-pressor components) to be underlying mechanism for increasing reabsorption of Na+ and water, contributing to increased blood volume and eventual blood pressure (Luo et al. 2015; Mervaala et al. 1999). Moreover, elevated levels of OONO− production in the current study supported the hypothesis that increased O2•− generation reacts with NO to form potent and versatile oxidant peroxynitrite (OONO−), thereby scavenging NO, an important vasodilator, to promote renovascular vasoconstriction and hypertension. This observation is supported by evidence that blunted intrarenal NO generation increases tubular sodium reabsorption leading to increased arterial pressure (Navar, 2005). In addition, hyperinsulinemia observed in our study can potentially be involved in Na+-reabsorption through induction of Na+-K+-ATPase in the proximal tubule as evident in other studies (Féraille et al. 1999; Baum, 1987). However, the exact role of insulin and glucose interaction to promote proximal tubule Na+-retention needs to be determined in this animal model.
Increased production of angiotensin II and the development of oxidative stress in the renal cortex caused increased sodium and water retention, which suggest that the proximal tubule is playing a key role in causing volume expansion and elevated blood pressure. But the mechanism by which increased sodium reabsorption occurs in this model is not clear. Hence, the role of the Na+-K+-ATPase, an ion pump, largely responsible for transporting intracellular Na+ out of the cells into interstitial fluid followed by its reabsorption into circulation through peritubular capillaries was determined. Proximal tubular cells were microdissected and isolated from the heterogeneous cellular environment and proximal tubule cells’ lysates were obtained. An increased expression of the α-subunit of Na+-K+-ATPase, which catalyzes Na+-K+-ATPase activity, was determined by western blot analysis. The increase expression of the α-subunit of Na+-K+-ATPase, which catalyzes Na+-K+-ATPase activity, thus represents an increase in functional Na+ transport activity within the current study (Salyer et al. 2013).
In addition, we have measured the expression of phophorylated NKA α1 at serine 18 residue to confirm basal activity of this proten pump corresponding to the increased NKA α1 expression. We found that phospho-NKA α1 levels were decreased in glucose treated animals while captopril and tempol elevated its levels. This is cirtical to understanding the activity of basal NKA α1 since its phosphorylation at serine-18 increases its internalization by endosome, thus reducing its activity (Chibalin et al. 1997; Pedemonte et al. 2005). The current study showed that both captopril and tempol treatments returned this ratio to control levels. Therefore, the ratio of expression of NKA α1 to phospho-NKA α1 is a good index to the measurement of NKA α1 activity, where its increased ratio is indicative of it enhanced activity (Feschenko & Sweadner, 1997; Hatou et al. 2010). Our study evidently showed that decreased phosphorylation of Ser18 of NKA α1 in glucose group reduces its internalization, thereby upholding its increased activity exerted by already overexpressed NKA α1. Phosphorylation at Serine-18 by different hormones such as dopamine can inhibit the pump activity of Na+-K+-ATPase (Efendiev & Pedemonte, 2006), which supports our observations that Serine-18 phosphorylation of NKA α1 is an underlying mechanism for regulation of pump activity of Na+-K+-ATPase in the rat proximal tubule. Though various ion channels such as SGLT2, SGLT1, Na+/H+ Exchanger 3 (NHE3), and Na+-Cl− cotransporter, which are located in apical membranes of proximal tubule epthelial cells, can participate in Na+-reabsorption from the lumen into the intracellular side, Na+-K+-ATPase is involved in transporting the intracellular Na+ into the interstitial fluid. Given this characteristic, expression, and/or stimulation of Na+-K+-ATPase plays a potential role in fluid retention. However, additional studies are needed to confirm its relative magnitude in Na+-reabsorption by analyzing and comparing other ion channels of PT in this rat model.
Consistent with previous reports the current study observed an elevation in angiotensin II and oxidative stress, which could promote Na+-K+-ATPase-mediated sodium reabsorption and consequent hypertension (Wang et al. 2009). Moreover, apparent scavenging of NO by O2•− can also affect the activity of the Na+-K+-ATPase. Studies suggest that blunted intrarenal NO bioavailability can induce pump activity of the Na+-K+-ATPase in the basolateral membrane of proximal tubule epithelial cells. This confers an additive effect of Na+-retention to already existing active sodium retaining pathways stimulated by RAAS and oxidative stress (Hakam & Hussain, 2006; Banday & Lokhandwala, 2008). Additionally, insulin can also induce Na+-K+-ATPase-mediated sodium reabsorption in the proximal tubule (Féraille et al. 1999), which causes amplification to the already increased extracellular fluid volume and blood pressure.
In summary, the current study demonstrates sustained hyperglycemia and hypertension through feeding glucose-enriched diets accompanied with intraperitoneal glucose injection in Sprague Dawley rats. Hypertension caused by such dietary intervention results from high glucose-induced increased generation of angiotensin II and development oxidative stress in renal cortex. Ang II and/or oxidative stress promote enhanced Na+-retention through the proximal tubule by potentially increasing the expression and activity of the Na+-K+-ATPase in glucose-treated animals. An upregulation of Na+-K+-ATPase can increase pumping of Na+ from interior sites of epithelial cells in the basolateral membrane of the proximal tubule to the interstitial fluid followed by increased Na+ reabsorption into the peritubular capillaries. As a result, it significantly increases Na+-levels in plasma leading to increased blood volume and eventual hypertension. Treatment with captopril and tempol significantly reduced Na+-K+-ATPase expression and sodium reabsorption followed by a significant attenuation of blood pressure in this hypertensive hyperglycemic rat model.
New Findings.
What is the central question of the study?
Chronic glucose feeding accompanied with glucose injection (I.P.) causes sustained hyperglycemia and hypertension in rats, a hypothesis that was not tested before. Moreover, the exact reason of hypertension is also not known. We explored some molecular pathways of proximal tubule in the kidney that may be involved in promoting Na+-retention to increase blood pressure.
What is the main finding and its importance?
We demonstrated that development of hypertension is mediated by upregulation of renal renin-angiotensin system, oxidative stress, which alone or in combination promoted sodium reabsorption through increasing expression and activity of α1-subunit of Na+-K+-ATPase (NKA α1) in proximal tubule (PT). As evidenced by our study results, NKA α1 appears to play an important role in pumping intracellular Na+ out to extracellular space resulting in increased Na+-reabsorption followed by increased blood pressure. However, additional studies are needed to confirm its relative magnitude in Na+-reabsorption by analyzing and comparing other ion channels of PT in this rat model. Overall, targeting NKA α1 in a hyperglycemia-induced hypertensive rat model can be a novel therapeutic strategy in the treatment of hypertension.
Acknowledgments
We thank Dr. Sharon E. Meyer for her technical assistance with the EPR experiment.
Financial Support
This work was supported by a NIH-LBRN grant.
Abbreviations
- ACE
angiotensin converting enzyme
- AGEs
advanced glycation end products
- Ang II
Angiotensin II
- AT1R
angiotensin type 1 receptor
- BCA
bicinchoninic acid
- BP
blood pressure
- CaM
calmodulin
- CMH
1-hydroxy-3-methoxycarbonyl-2, 2, 5, 5-tetramethylpyrrolidine.HCl
- CPH
1-hydroxy-3-carboxy-2, 2, 5, 5-tetramethylpyrrolidine.HCl
- DETC
diethyldithiocarbamate
- eNOS
endothelial nitric oxide synthase
- EPR
electron paramagnetic resonace
- Jak2
janus kinase 2
- mETC
mitochondrial electron transport chain
- NADPH oxidase
nicotinamide adenine dinucleotide phosphate oxidase
- NHE
Na+/H+ exchanger
- NKA α1
Na+-K+-ATPase α1-subunit
- NO
nitric oxide, NOS, nitric oxide synthase
- PT
proximal tubule
- RAAS
renin-angiotensin aldosterone system
- RIF
renal interstitial fluid
- ROS
reactive oxygen species
- SGLT2
sodium-dependent glucose transporter 2
- SNS
sympathetic nervous system
Footnotes
Competing interests
The authors declare no conflicts of interests
Author contributions
F.S., W.A.A, K.P.B. and K.E.J. conceived and designed the experiments, F.S. and H.N.A performed the experiments; F.S., W.A.A. and H.N.A analysed the data; F.S. wrote the paper; F.S., W.A.A., H.N.A., K.P.B, and K.E.J. reviewed and approved the submission.
References
- Alanazi W, Fakhruddin S, Jackson KE. Microdialysis sampling of renal interstitial fluid in acute studies. International Journal of Biology. 2016;8:69–79. [Google Scholar]
- Banday AA, Lokhandwala MF. Loss of biphasic effect on Na/K-ATPase activity by angiotensin II involves defective angiotensin type 1 receptor-nitric oxide signaling. Hypertension. 2008;52:1099–1105. doi: 10.1161/HYPERTENSIONAHA.108.117911. [DOI] [PubMed] [Google Scholar]
- Banday AA, Lokhandwala MF. Oxidative stress causes renal angiotensin II type 1 receptor upregulation, Na+/H+ exchanger 3 overstimulation, and hypertension. Hypertension. 2011;57:452–459. doi: 10.1161/HYPERTENSIONAHA.110.162339. [DOI] [PubMed] [Google Scholar]
- Baum M. Insulin stimulates volume absorption in the Rabbit proximal convoluted tubule. J Clin Invest. 1987;79:1104–1109. doi: 10.1172/JCI112925. [DOI] [PMC free article] [PubMed] [Google Scholar]
- Brezniceanu ML, Liu F, Wei CC, Tran S, Schetelli S, Zhang SL, Guo DF, Filep JG, Ingelfinger JR, Chan JS. Catalase overexpression attenuates angiotensinogen expression and apoptosis in diabetic mice. Kidney Int. 2007;71:912–923. doi: 10.1038/sj.ki.5002188. [DOI] [PubMed] [Google Scholar]
- Chen L, Caballero B, Mitchell DC, Loria C, Lin PH, Champagne CM, Elmer PJ, Ard JD, Batch BC, Anderson CA, Appel LJ. Reducing consumption of sugar-sweetened beverages is associated with reduced blood pressure: A prospective study among United States adults. Circulation. 2010;121:2398–2406. doi: 10.1161/CIRCULATIONAHA.109.911164. [DOI] [PMC free article] [PubMed] [Google Scholar]
- Chibalin AV, Katz AI, Berggren P-O, Bertorello AM. Receptor-mediated inhibition of renal Na+-K+-ATPase is associated with endocytosis of its α- and β-subunits. Am J Physiol Cell Physiol. 1997;273:1458–C1465. doi: 10.1152/ajpcell.1997.273.5.C1458. [DOI] [PubMed] [Google Scholar]
- Crowley SD, Gurley SB, Herrera MJ, Ruiz P, Griffiths R, Kumar AP, Kim HS, Smithies O, Le TH, Coffman TM. Angiotensin II causes hypertension and cardiac hypertrophy through its receptors in the kidney. Proc Natl Acad Sci USA. 2006;103:17985–17990. doi: 10.1073/pnas.0605545103. [DOI] [PMC free article] [PubMed] [Google Scholar]
- Dostal DE, Baker KM. The cardiac renin-angiotensin system. Circ Res. 1999;85:643–650. doi: 10.1161/01.res.85.7.643. [DOI] [PubMed] [Google Scholar]
- Dunlop M. Aldose reductase and the role of the polyol pathway in diabetic nephropathy. Kidney Int. 2000;58:S3–S12. doi: 10.1046/j.1523-1755.2000.07702.x. [DOI] [PubMed] [Google Scholar]
- Efendiev R, Pedemonte CH. Contrary to rat-type, human-type Na,K-ATPase is phosphorylated at the same amino acid by hormones that produce opposite effects on enzyme activity. J Am Soc Nephrol. 2006;17:31–38. doi: 10.1681/ASN.2005070681. [DOI] [PubMed] [Google Scholar]
- Fakhruddin S, Alanazi W, Jackson KE. Diabetes-induced reactive oxygen species: Mechanism of their generation and role in renal injury. Journal of Diabetes Research. 2017a;2017 doi: 10.1155/2017/8379327. Article ID 8379327. [DOI] [PMC free article] [PubMed] [Google Scholar]
- Fakhruddin S, Alanazi WA, Jackson KE. Development of a chronic hyperglycemic and hypertensive rat model through repetitive intraperitoneal and oral glucose loading. International Journal of Current Research. 2017b;9:48786–48793. [Google Scholar]
- Fekete A, Rosta K, Wagner L, Prokai A, Degrell P, Ruzicska E, Vegh E, Toth M, Ronai K, Rusai K, Somogyi A, Tulassay T, Szabo AJ, Ver A. Na+,K+-ATPase is modulated by angiotensin II in diabetic rat kidney – another reason for diabetic nephropathy? J Physiol. 2008;586:5337–5348. doi: 10.1113/jphysiol.2008.156703. [DOI] [PMC free article] [PubMed] [Google Scholar]
- Féraille E, Carranza ML, Gonin S, Béguin P, Pedemonte C, Rousselot M, Caverzasio J, Geering K, Martin P-Y, Favre H. Insulin-induced stimulation of Na+,K+-ATPase activity in kidney proximal tubule cells depends on phosphorylation of the α-subunit at Tyr-10. Mol Biol Cell. 1999;10:2847–2859. doi: 10.1091/mbc.10.9.2847. [DOI] [PMC free article] [PubMed] [Google Scholar]
- Feschenko MS, Sweadner KJ. Phosphorylation of Na,K-ATPase by protein kinase C at Ser18 occurs in intact cells but does not result in direct inhibition of ATP hydrolysis. The Journal of Biological Chemistry. 1997;272:17726–17733. doi: 10.1074/jbc.272.28.17726. [DOI] [PubMed] [Google Scholar]
- Forbes JM, Coughlan MT, Cooper ME. Oxidative stress as a major culprit in kidney disease in diabetes. Diabetes. 2008;57:1446–1454. doi: 10.2337/db08-0057. [DOI] [PubMed] [Google Scholar]
- Graciano ML, Cavaglieri RDC, Delle H, Dominguez WV, Casarini DE, Malheiros DMAC, Noronha IL. Intrarenal renin-angiotensin system is upregulated in experimental model of progressive renal disease induced by chronic inhibition of nitric oxide synthesis. J Am Soc Nephrol. 2004;15:1805–1815. doi: 10.1097/01.asn.0000131528.00773.a9. [DOI] [PubMed] [Google Scholar]
- Hakam AC, Hussain T. Angiotensin II AT2 receptors inhibit proximal tutular Na+-K+-ATPase activity via a NO/cGMP-dependent pathway. Am J Physiol Renal Physiol. 2006;290:F1430–F1436. doi: 10.1152/ajprenal.00218.2005. [DOI] [PubMed] [Google Scholar]
- Hatou S, Yamada M, Akune Y, Mochizuki H, Shiraishi A. Role of insulin in regulation of Na+-/K+-dependent ATPase activity and pump function in corneal endothelial cells. Invest Ophthalmol Vis Sci. 2010;51:3935–3942. doi: 10.1167/iovs.09-4027. [DOI] [PubMed] [Google Scholar]
- Kaufman LN, Peterson MM, Smith SM. Hypertension and sympathetic hyperactivity induced in rats by high-fat or glucose diets. Am J Physiol. 1991;260:E95–100. doi: 10.1152/ajpendo.1991.260.1.E95. [DOI] [PubMed] [Google Scholar]
- Kobori H, Nangaku M, Navar LG, Nishiyama A. The intrarenal renin-angiotensin system: From physiology to the pathobiology of hypertension and kidney disease. Pharmacol Rev. 2007;59:251–287. doi: 10.1124/pr.59.3.3. [DOI] [PubMed] [Google Scholar]
- Leehey J, Singh AK, Alavi N, Singh R. Role of angiotensin II in diabetic nephropathy. Kidney Int. 2000;58:S93–S98. doi: 10.1046/j.1523-1755.2000.07715.x. [DOI] [PubMed] [Google Scholar]
- Lozano I, Van der Werf R, Bietiger W, Seyfritz E, Peronet C, Pinget M, Jeandidier N, Maillard E, Marchioni E, Sigrist S, Dal S. High-fuctose and high-fat diet-induced disorders in rats: impact on diabetes risk, hepatic and vascular complications. Nutr Metab (Lond) 2016;13:15. doi: 10.1186/s12986-016-0074-1. [DOI] [PMC free article] [PubMed] [Google Scholar]
- Luo H, Wang X, Chen C, Wang J, Zou X, Li C, Xu Z, Yang X, Shi W, Zeng C. Oxidative stress causes imbalance of renal renin angiotensin system (RAS) components and hypertension in obese Zucker rats. J Am Heart Assoc. 2015;4:e001559. doi: 10.1161/JAHA.114.001559. [DOI] [PMC free article] [PubMed] [Google Scholar]
- Mervaala E, Dehmel B, Gross V, Lippoldt A, Bohlender R, Milia AF, Ganten D, Luft FC. Angiotensin-converting enzyme inhibition and AT1 receptor blockade modify the pressure-natriuresis relationship by additive mechanisms in rats with human renin and angiotensinogen genes. J Am Soc Nephrol. 1999;10:1669–1680. doi: 10.1681/ASN.V1081669. [DOI] [PubMed] [Google Scholar]
- Micanovic R, Khan S, El-Achkar TM. Immunofluorescence laser micro-dissection of specific nephron segments in the mouse kidney allows targeted downstream proteomic analysis. Physiol Rep. 2015;3:e12306. doi: 10.14814/phy2.12306. [DOI] [PMC free article] [PubMed] [Google Scholar]
- Midaoui AE, de Champlain J. Prevention of hypertension, insulin resistance, and oxidative stress by α-Lipoic acid. Hypertension. 2002;39:303–307. doi: 10.1161/hy0202.104345. [DOI] [PubMed] [Google Scholar]
- Mizuno M, Sada T, Kato M, Koike H. Renoprotective effects of blockade of angiotensin II AT1 receptors in an animal model of type 2 diabetes. Hypertens Res. 2002;25:271–278. doi: 10.1291/hypres.25.271. [DOI] [PubMed] [Google Scholar]
- Nagai Y, Yao L, Kobori H, Miyata K, Ozawa Y, Miyatake A, Yukimura T, Shokoji T, Kimura S, Kiyomoto H, Kohno M, Abe Y, Nishiyama A. Temporary angiotensin II blockade at the prediabetic stage attenuates the development of renal injury in type 2 diabetic rats. J Am Soc Nephrol. 2005;16:703–711. doi: 10.1681/ASN.2004080649. [DOI] [PMC free article] [PubMed] [Google Scholar]
- Navar LG. The intrarenal renin-angiotensin system in hypertension. Kidney Int. 2004;65:1522–1532. doi: 10.1111/j.1523-1755.2004.00539.x. [DOI] [PubMed] [Google Scholar]
- Navar LG. The role of the kidneys in hypertension. J Clin Hypertens. 2005;7:542–549. doi: 10.1111/j.1524-6175.2005.04130.x. [DOI] [PMC free article] [PubMed] [Google Scholar]
- Navar LG. Counterpoint: Activation of the intrarenal renin-angiotensin systems is the dominant contributor to systemic hypertension. J Appl Physiol. 2010;109:1998–2000. doi: 10.1152/japplphysiol.00182.2010a. [DOI] [PMC free article] [PubMed] [Google Scholar]
- Nishiyama A, Seth DM, Navar G. Renal interstitial fluid concentrations of angiotensins I and II in anesthetized rats. Hypertension. 2002;39:129–134. doi: 10.1161/hy0102.100536. [DOI] [PubMed] [Google Scholar]
- Ohshiro Y, Ma RC, Yasuda Y, Hiraoka-Yamamoto J, Clermont AC, Isshiki K, Yagi K, Arikawa E, Kem TS, King GL. Reduction of diabetes-induced oxidative stress, fibrotic cytokine expression, and renal dysfunction in protein kinase Cβ-null mice. Diabetes. 2006;55:3112–3120. doi: 10.2337/db06-0895. [DOI] [PubMed] [Google Scholar]
- Paul M, Mehr AP, Kreutz R. Physiology of local renin-angiotensin systems. Physiol Rev. 2006;86:747–803. doi: 10.1152/physrev.00036.2005. [DOI] [PubMed] [Google Scholar]
- Pedemonte CH, Efendiev R, Bertorello AM. Inhibition of Na+-K+-ATPase by dopamine in proximal tubule epithelial cells. Semin Nephrol. 2005;25:322–327. doi: 10.1016/j.semnephrol.2005.03.007. [DOI] [PubMed] [Google Scholar]
- Prathipati P, Alanazi W, Fakhruddin, Jackson DW, Jackson KE. Role of interstitial angiotensin II and ATP in mediating renal injury induced by recurrent insulin induced hypoglycemia. Annual Research & Review in Biology. 2015;6:328–336. [Google Scholar]
- Reaven GM, Ho H. Sugar-induced hypertension in Sprague-Dawley rats. Am J Hypertens. 1991;4:610–614. doi: 10.1093/ajh/4.7.610. [DOI] [PubMed] [Google Scholar]
- Rowe JW, Young JB, Minaker KL, Stevens AL, Pallotta J, Landsberg L. Effect of insulin and glucose infusions on sympathetic nervous system activity in normal man. Diabetes. 1981;30:219–225. doi: 10.2337/diab.30.3.219. [DOI] [PubMed] [Google Scholar]
- Salyer SA, Parks J, Barati MT, Lederer ED, Clark BJ, Klein JD, Khundmiri SJ. Aldosterone regulates Na+, K+ ATPase activity in human renal proximal tubule cells through mineralocorticoid receptor. Biochimica et Biophysica Acta. 2013;1833:2143–2152. doi: 10.1016/j.bbamcr.2013.05.009. [DOI] [PubMed] [Google Scholar]
- Sedeek M, Nasrallah R, Touyz RM, Hébert RL. NADPH oxidase, reactive oxygen species, and the kidney: friend and foe. J Am Soc Nephrol. 2013;24:1512–1518. doi: 10.1681/ASN.2012111112. [DOI] [PMC free article] [PubMed] [Google Scholar]
- Sedeek MG, Callera G, Montezano A, Gutsol A, Heitz F, Szyndralewiez C, Page P, Kennedy CRJ, Burns KD, Touyz RM, Hebert RL. Critical role of Nox4-based NADPH oxidase in glucose-induced oxidative stress in the kidney: Implications in type 2 diabetic nephropathy. Am J Physiol Renal Physiol. 2010;299:F1348–F1358. doi: 10.1152/ajprenal.00028.2010. [DOI] [PubMed] [Google Scholar]
- Shin SJ, Chung S, Kim SJ, Lee E-M, Yoo Y-H, Kim J-W, Ahn Y-B, Kim F-S, Moon S-D, Kim M-J, Ko S-H. Effect of sodium-glucose co-transporter 2 inhibitor, Dapagliflozin, on renal angiotensin system in an animal model of type 2 diabetes. PLoS ONE. 2016;11:e0165703. doi: 10.1371/journal.pone.0165703. [DOI] [PMC free article] [PubMed] [Google Scholar]
- Suzaki Y, Ozawa Y, Kobori H. Intrarenal oxidative stress and augmented angiotensinogen are precedent to renal injury in Zucker diabetic fatty rats. Int J Biol Sci. 2007;3:40–46. doi: 10.7150/ijbs.3.40. [DOI] [PMC free article] [PubMed] [Google Scholar]
- Vallon V, Thomson SC. Renal function in diabetic disease models: the tubular system in the pathophysiology of the diabetic kidney. Annu Rev Physiol. 2012;74:351–375. doi: 10.1146/annurev-physiol-020911-153333. [DOI] [PMC free article] [PubMed] [Google Scholar]
- Wang X, Armando I, Upadhyay K, Pascua A, Jose PA. The regulation of proximal tubular salt transport in hypertension: an update. Curr Opin Nephrol Hypertens. 2009;18:412–420. doi: 10.1097/MNH.0b013e32832f5775. [DOI] [PMC free article] [PubMed] [Google Scholar]
- Yingst DR, Massey KJ, Rossi NF, Mohanty MJ, Mattingly RR. Angiotensin II directly stimulates activity and alters the phosphorylation of Na,KATPase in rat proximal tubule with a rapid time course. American Journal of Physiology – Renal Physiology. 2004;287:F713–F721. doi: 10.1152/ajprenal.00065.2004. [DOI] [PubMed] [Google Scholar]
- Zhang S-L, To C, Chen X, Filep JG, Tang S-S, Ingelfinger J, Chan JSD. Essential role(s) of the intrarenal renin-angiotensin system in transforming growth factor-β1 gene expression and induction of hypertrophy of rat kidney proximal tubular cells in high glucose. J Am Soc Nephrol. 2002;13:302–312. doi: 10.1681/ASN.V132302. [DOI] [PubMed] [Google Scholar]


