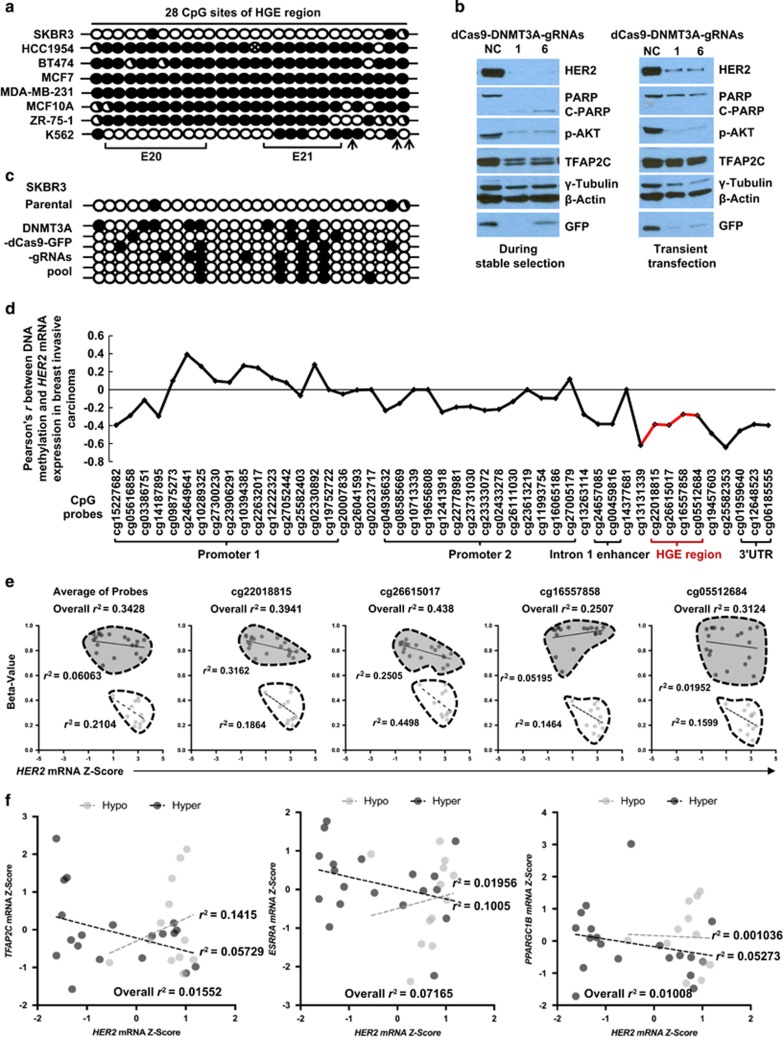
Figure 4.
DNA methylation determines the enhancer function of HGE and is inversely correlated with HER2 gene expression in breast cancers. (a) DNA methylation of the 28 CpG dinucleotides in the HGE region in multiple cell lines, assessed using the bisulfite sequencing. Each circle represents a CpG dinucleotide: open circle, unmethylated site; closed circle, methylated site; half-closed circle, semi-methylated site; circle with an x, mutated site. Exons are marked, and TFAP2C consensus nucleotides are indicated by arrows. (b) Indicated proteins from SKBR3 cells either transfected with CRISPR-dCas9-DNMT3A-EGFP carrying gRNA 1 or 6 and undergoing stable selection (left) or transiently transfected with the same plasmids for 48 h (right) were assessed by western blotting. (c) DNA methylation status of the HGE region in SKBR3 during the stable selection as assessed by bisulfide sequencing. (d) Correlation (Pearson's r) of all 47 DNA methylation sites around HER2 gene including HGE regions (red color) with HER2 expression in 839 breast invasive carcinoma samples was analyzed using MethHC.53 (e) The inverse correlation of average and each individual CpG sites located in HGE with HER2 expression in HER2-positive breast cancer samples grouped in hypomethylation (light) and hypermethylation (dark) is shown. Pearson r2 values of the correlations are displayed in each subgroup of samples. (f) Correlation between TFAP2C, ESRRA, PPARGC1B and HER2 mRNA level in HER2-positive breast cancer samples sub grouped by DNA methylation status of HGE region were plotted. Light and dark dots are designated to hypomethylation and hypermethylation in the HGE region, respectively.

