

Abstract
US policymakers place high priority on tying Medicare payments to the value of care delivered. A critical part of this effort is the Hospital Value-based Purchasing Program (HVBP), which rewards or penalizes hospitals based on their quality and episode-based costs of care and incentivizes integration between hospitals and post-acute care providers. Within HVBP, each patient affects hospital performance on a variety of quality and spending measures, and performance translates directly to changes in program points and ultimately dollars. In short, hospital revenue from a patient consists not only of the DRG payment, but also of that patient’s marginal future reimbursement. We estimate the magnitude of the marginal future reimbursement for individual patients across each type of quality and performance measure. We describe how those incentives differ across hospitals, including integrated and safety-net hospitals. We find evidence that hospitals improved their performance over time in the areas where they have the highest marginal incentives to improve care, and that integrated hospitals responded more than non-integrated hospitals.
Keywords: Pay-for-performance, value-based purchasing, integrated care, Medicare, incentives
JEL Classification: I11, I13, I18
1. Introduction
The Centers for Medicare and Medicaid Services (CMS) and other large payers are increasingly using value-based purchasing programs to motivate better quality and more efficient care. The Hospital Value-Based Purchasing (HVBP) program is one of the largest mandatory, value-based purchasing programs and is central to the US government’s effort to tie 85% of fee-for-service Medicare payments to quality or value by 2016 (Burwell, 2015). Unlike other initiatives, CMS’s Hospital Value-Based Purchasing (HVBP) program explicitly ties financial incentives to hospital performance on both quality and episode payments, which incentivizes integration between hospitals and post-acute care providers. Additionally, the HVBP program affects future hospital revenue based on prior performance, creating financial incentives to improve performance.
An ongoing concern of HVBP and other pay-for-performance programs is that it is unclear whether the size of the incentives is adequate to induce hospital behavior change (Ryan et al., 2015; Figueroa et al, 2016). To better understand why the evidence suggests that hospitals are not improving their performance in some measures, a closer characterization of the incentives each hospital faces is needed. This paper describes the HVBP incentives faced by hospitals, estimates their magnitude and distribution, and tests whether hospitals facing larger financial incentives are more likely to improve performance.
For the roughly 3,000 hospitals in the program, performance on quality and spending metrics in the current year affects Medicare payments in future years (Centers for Medicare & Medicaid Services, 2012a). For example, in Fiscal Year (FY) 2016, the program adjusted Medicare payments to hospitals by as much as two percent, up or down, based on performance mostly in FY 2014 (Centers for Medicare & Medicaid Services, 2013a). For each participating hospital, their financial bonus or penalty is determined by their relative performance across a variety of measures spanning four domains: patient experience, clinical process of care, outcomes, and efficiency (Centers for Medicare & Medicaid Services, 2013a). The efficiency domain is comprised of a single measure of Medicare Part A and Part B spending during an episode of care (Das et al., 2016a).
The HVBP program has created two fundamental changes in Medicare hospital reimbursement. Because each Medicare patient affects hospital performance on a variety of quality and spending measures, each patient’s care and outcomes translate directly to changes in program points and ultimately dollars. For example, spending during a single episode of care — including in a skilled nursing facility, outpatient rehabilitation, home health care, and readmission to a hospital — affects a hospital’s total episode spending measure. Hospital performance across all the quality and spending measures determines the magnitude of the change in the base-operating DRG amount a hospital will receive for patients in a future fiscal year. Hospitals that perform well in both spending and quality measures receive the largest bonuses (Das et al., 2016b). In short, hospital revenue from a given patient consists not only of the current Diagnosis related Group (DRG) payment as has been the case in traditional fee-for-service Medicare, but also consists of that patient’s marginal future reimbursement due to that patient’s marginal effect on the HVBP bonus or penalty.
The HVBP program also has extended the relevant timeframe for performance to a 30-day episode that starts three days prior to admission and ends 30 days after discharge. Hospitals have financial incentives to improve quality and lower spending for the entire episode of care, including care supplied by other providers up to 30 days post discharge. As a result, hospitals may seek ways to integrate with providers of post-acute care. Our conceptual model predicts that integrated hospitals will be able to respond to incentives more easily. This may encourage more integration. Hospitals that choose not to integrate will still have an incentive to work closely with post-acute care providers to improve quality and reduce expenditures.
The HVBP program’s incentives have several implications for hospital behavior. First, hospitals have incentives to improve many aspects of quality of care and to reduce episode spending. Second, because these incentives vary widely — from zero at the margin to quite large financial incentives, depending on where the hospitals are in the performance distribution compared to other hospitals and their own baseline measures — different hospitals have vastly different incentives to make improvements in spending or in different quality domains. Therefore, we expect hospitals to respond to their own incentives at the margin, and make improvements in different areas in the future. Third, we expect that hospitals that have already integrated with post-acute care providers will perform better, and that some hospitals will have strong incentives to integrate more with post-acute care providers.
The HVBP program is especially important for the movement towards more integration because — unlike the ACO and bundled payment programs that are mostly voluntary — the HVBP program applies to almost all general hospitals. Hospitals are now being held accountable for the quality and cost of care given by other providers, up to 30 days post discharge. This creates incentives to increase integration with post-acute care providers such as skilled nursing facilities, inpatient rehabilitation facilities, and home health care agencies (Chen and Ackerly, 2014). For example, hospitals can improve integration with skilled nursing facilities through mergers, acquisitions, or informal contracts. With the addition of the episode spending measure to the program, CMS hoped it would increase the incentives for hospitals to engage in care coordination with other provider (Centers for Medicare & Medicaid Services, 2012b).
After describing the HVBP program and incentives, the empirical work has three parts. First, we quantify the marginal incentives for a change in mortality by one additional death and the incentives for an improvement in all measures by one decile. We not only calculate the mean, but document the wide heterogeneity in incentives that typically include many zeros and a long right tail. Second, we describe the heterogeneity in those incentives across hospitals, including by whether the hospital is integrated with post-acute care providers. Third, we test whether hospitals with larger marginal incentives respond with larger changes in those measures from FY 2015 to FY 2016. We use national data on about 3,000 hospitals to compute the effect of a one-decile improvement in each of the measures. Using the FY 2016 performance data we can see how hospitals changed their domain scores as a function of the marginal incentives. In addition, we have patient-level data for all Michigan Medicare patients from FY 2015. From those Michigan data we compute the effect of a change in mortality by one death on future Medicare payments. We predict that hospitals respond to those incentives by improving their score on the domains that have the greatest potential payoff, and find evidence in support of this prediction. It is remarkable that despite the difficulties of calculating these marginal future reimbursements, hospitals respond to them (akin to baseball teams quantifying value for each player’s performance, aka the Moneyball approach).
2. Hospital Value-Based Purchasing
The Hospital Value-Based Purchasing (HVBP) program financially incentivizes hospitals to improve their performance across a variety of measures every fiscal year. As legislated by the Affordable Care Act, the HVBP program is managed by the Center for Medicare and Medicaid Services (CMS). This program applies to all acute care hospitals that participate in the Inpatient Prospective Payment System, with some minor exclusion criteria (Centers for Medicare & Medicaid Services, 2013b). Besides participating in the Inpatient Prospective Payment System, these inclusion criteria include meeting the minimum required number of cases or surveys for individual measures, not receiving payment reductions from the Hospital Inpatient Quality Reporting Program, no immediate deficiencies that jeopardize patient safety or health, and not having an exemption from the Health and Human Services secretary. Around 3,000 acute care hospitals participated in FY 2015.
With the implementation of the Hospital Value-Based Purchasing Program, CMS wanted to focus on six overarching priorities related to hospital care: clinical care, person- and caregiver-centered experience and outcomes, safety, efficiency and cost reduction, care coordination, and community/population health (Centers for Medicare & Medicaid Services, 2012b). As outlined in the Final Rule detailing the program measures for FY 2015, CMS believed that the included “measure sets should generally rely on a mix of standards, outcome, process of care measures, and patient-reported measures including measures of care transitions, patient experience, and changes in patient functional status, with an emphasis on measurement as close to the patient-centered outcome of interest as possible” (Centers for Medicare & Medicaid Services, 2012b). This program drastically changes how Medicare pays hospitals, because the financial bonus depends on performance across many quality and cost measures for an episode of care.
This emphasis on care coordination and integration across providers is more apparent with the inclusion of the Medicare-Spending-per-Beneficiary measure. In justifying the addition of the measure to the program, CMS believed that the MSPB “provides an incentive for hospitals to build stronger relationships with and better understand the providers and suppliers that furnish care for their patients before and after an acute care hospitalization” (Centers for Medicare & Medicaid Services, 2012b). CMS also felt “that the prompt implementation of this measure is an important step to incentivizing care coordination, improving more effective post acute care delivery and follow up, and reducing unnecessary services and preventable readmissions for Medicare beneficiaries.” (Centers for Medicare & Medicaid Services, 2012b) CMS envisioned hospitals that “provide quality inpatient care, conduct appropriate discharge planning, and work with providers and suppliers on appropriate follow-up care will realize efficiencies and perform well on the measure, because the Medicare beneficiaries they serve will have a reduced need for excessive post-discharge services.” Therefore, CMS has the explicit goal of using the HVBP program to increase coordination between hospitals and other providers and implicitly encourage integration.
Although the program has gone through several changes since it was first implemented in FY 2013, the basic structure of the program has remained constant (Centers for Medicare & Medicaid Services, 2013a). Hospital performance across a defined set of measures within broader categorical domains is collected, scored, and weighted, leading to an overall program score which is translated into a financial bonus or penalty. The bonus or penalty is a percentage point increase or decrease in a hospitals’ base-operating DRG payment amount, which is used in the Medicare Inpatient Prospective Payment System. Accordingly, hospitals can avoid a reduction in their base DRG payment amount by performing well on the included measures. This program is financed by an initial base-operating DRG payment reduction for all participating hospitals each fiscal year. Starting in FY 2013, there was a 1.0 % reduction to fund the incentive payments, and subsequently the maximum penalty or bonus was approximately 1.0%. In subsequent years, this amount has increased by 0.25%, plateauing at 2.0% from FY 2017 onwards. The HVBP program is designed to be budget neutral. Therefore, it redistributes payments from hospitals with measured low quality of care and high episode spending to those that perform well on those measures.
The measures included in the HVBP program evaluate hospital performance throughout a longitudinal episode of care. Medicare spending in the three days preceding an acute inpatient hospitalization are incorporated in the efficiency measure while the patient experience, clinical process of care, outcomes, and spending domains all evaluate hospital performance during an acute hospitalization. Finally, specific questions in the patient experience and clinical process of care domains evaluate discharge information clarity and delivery, while the mortality and spending measures assess outcomes and costs that occur post-discharge. Therefore, the set of measures included in the HVBP program assess hospital performance before, during, and after an acute inpatient hospitalization. These measures attempt to capture a broad range of true quality of care and cost of care. While it is possible that hospitals would cherry pick measures with the aim of improving narrowly (in effect, teaching to the test), the intent of HVBP is to encourage general improvement in quality and cost of care for all Medicare patients.
In FY 2013, the two domains of measures were patient experience of care, which accounted for 30% of the overall program score, and clinical process of care, which accounted for 70% (see Table 1). The patient experience of care domain consists of measures drawn from the Hospital Consumer Assessment of Healthcare Providers and Systems (HCAHPS) survey, while the clinical process of care domain includes medical and surgical process of care measures (Centers for Medicare & Medicaid Services, 2013a). In FY 2014, the program added an outcomes domain, composed of 30-day mortality rates for acute myocardial infarctions, heart failure, and pneumonia. This new domain accounted for 25% of the overall program score, while the clinical process of care domain weight was decreased to 45% (see Table 2 for details about measures within domains).
Table 1.
HVBP domain weights by fiscal year
| Domains | 2013 | 2014 | 2015 | 2016 |
|---|---|---|---|---|
| Patient Experience of Care | 30% | 30% | 30% | 25% |
| Clinical Process of Care | 70% | 45% | 20% | 10% |
| Outcomes | – | 25% | 30% | 40% |
| Efficiency | – | – | 20% | 25% |
Table 2.
HVBP domain measures in FY 2015
| Patient Experience of Care Domain (8) |
| Nurse Communication |
| Doctor Communication |
| Hospital Staff Responsiveness |
| Pain Management |
| Medicine Communication |
| Hospital Cleanliness & Quietness |
| Discharge Information |
| Overall Hospital Rating |
| Clinical Process of Care Domain (12) |
| Fibrinolytic Therapy Received within 30 minutes of Hospital Arrival†† |
| Primary PCI Received within 90 minutes of Hospital Arrival† |
| Heart Failure Discharge Instructions† |
| Blood Cultures Performed in the ED Prior to Initial Antibiotic Received in Hospital† |
| Initial Antibiotic Selection for CAP in Immunocompetent Patient††† |
| Prophylactic Antibiotic Received within One Hour Prior to Surgical Incision† |
| Prophylactic Antibiotic Selection for Surgical Patients |
| Prophylactic Antibiotics Discontinued within 24 hours after Surgery††† |
| Cardiac Surgery Patients with Controlled 6 AM Post-Operative Serum Glucose† |
| Postoperative Urinary Catheter Removal on Postoperative Day 1 or 2 |
| Surgery Patients on a Beta Blocker Prior to Arrival That Received a Beta Blocker |
| During the Perioperative Period |
| Surgery Patients Who Received Appropriate Venous Thromboembolism |
| Prophylaxis within 24 Hours |
| Outcomes Domain (5) |
| Acute Myocardial Infarction 30-day Mortality Rate |
| Heart Failure 30-Day Mortality Rate |
| Pneumonia 30-Day Mortality Rate |
| Patient Safety for Select Indicators Composite Score (AHRQ PSI-90) |
| Central Line-Associated Bloodstream Infection (CLABSI) Score |
| Efficiency Domain (1) |
| Medicare-Spending-per-Beneficiary |
Notes:
Measures that were removed from HVBP FY 2016
Measure removed from analysis due to small sample size
Measure removed from analysis due to data errors
In FY 2015, the program added an efficiency domain, which consisted of only one measure, the Medicare-Spending-per-Beneficiary. This is a measure of hospitalization episode costs, including Medicare Part A and Part B spending from three days before an index hospital admission through 30 days post-discharge (Quality Net, 2015). In addition to this new domain, there were some changes to the measures in the clinical process of care and outcome domains. The efficiency and clinical process of care domains each accounted for 20% of the overall program score in FY 2015, while the patient experience of care and outcome domain each accounted for 30% (Centers for Medicare & Medicaid Services, 2013a). There were no new domains for the program in FY 2016, but there were changes to the measures in the clinical process of care and outcome domains, as well as the overall domain weighting (see Table 1 for a comparison of the domain weights over years).
The MSPB measure clearly incentivizes hospitals to establish relationships with other providers to coordinate care. Prior research has demonstrated that performance on this spending measure was driven in a large part by post-discharge spending (Das et al., 2016a) Thus, with the introduction of the Hospital Value-Based Purchasing Program and the inclusion of measures that assess hospital performance before, during, and after an acute inpatient hospitalization, CMS is providing financial incentives for hospitals to engage in care coordination efforts and integration with providers outside of the hospital setting.
The HVBP program scores hospitals based on their achievement (comparison to other hospitals), as well as their improvement (comparison to their own previous performance). Every fiscal year of the program has an affiliated performance period and baseline period that vary across measures (Centers for Medicare & Medicaid Services, 2013b). Generally, each performance period initiates approximately two years prior to the fiscal year for which payment adjustments take effect to ensure that CMS has sufficient time to collect and process the data. These dates are set well in advance by the federal government so that hospitals can engage in efforts to improve their performance. In all measures besides the Medicare-Spending-per-Beneficiary measure, hospital achievement points are assigned by comparing hospital performance during the performance period to the performance of all hospitals in the baseline period. In the spending measure, achievement points are assigned by comparing hospital rates to all hospital rates, with both rates drawn from the performance period.
The specific conversion of measures to achievement points depends on several distributions. If a hospital’s rate is better than or equal to the mean of the highest performing decile, they receive 10 points, and if a hospital’s rate is worse than the median, they receive 0 points. When a hospital’s rate is better than or equal to the median and worse than the mean of the top decile, they receive a score between 0 and 10, depending on their rate, the median, and the mean of the best decile (Centers for Medicare & Medicaid Services, 2013b). Hospital improvement points are awarded by comparing a hospital’s rates during the performance period to the same hospital’s rates during the baseline period. If a hospital’s performance has declined, they receive 0 points, if it is better than the mean of the best decile, they receive 9 points, and if it is in between, they receive a score between 0 and 9, depending on their performance period rate, their baseline rate, and the mean of the best decile. The patient experience of care also assigns hospitals consistency points, which gives hospitals 20 points for being above the median in all eight survey dimensions included in the domain, or else they receive a score depending on their performance, the median, and the lowest score (Centers for Medicare & Medicaid Services, 2013a).
The highest of either the achievement or improvement score is awarded to each hospital for every measure, as long as the hospital has met the required minimum number of cases for each measure (Centers for Medicare & Medicaid Services, 2013b). By taking the higher of either the achievement or improvement score, CMS ensures that hospitals that improve one year are not penalized for that improvement in the future. In the patient experience of care domain, the consistency score is added with a base score to determine the overall domain score (Centers for Medicare & Medicaid Services, 2013a). Summing the scores across all the measures within each domain, and dividing by the total possible points in each domain provides a normalized score that is subsequently weighted according to CMS-specified domain weights. The sum of the domain scores results in an overall program score labeled the Total Performance Score (TPS). This score is then translated into an incentive bonus (or penalty) with a linear exchange function (Centers for Medicare & Medicaid Services, 2013b). We will refer to the incentive payment as a bonus, without loss of generality. Ultimately this bonus affects future Medicare reimbursement for inpatient care for an entire year. Therefore, changes in measured quality and episode payments affect future Medicare reimbursement.
The design of the HVBP program is a principal-agent problem with multitasking, where CMS is the principal and hospitals are the agents (Holmstrom and Milgrom, 1991). Concerns about this pay-for-performance program are similar to concerns in education, where increasingly teachers and even students face strong financial incentives for achievement on specific tests. Those concerns include creating incentives that are too weak to illicit a response and teaching to the test (see Neal (2011) for a review of the literature). The results on whether holding teachers accountable improves student performance are decidedly mixed (Jacob, 2005; Fryer, 2013). As with education, it is an open empirical question whether CMS’s HVBP program induces the desired positive improvements in patient outcomes.
3. Economic Incentives in HVBP
Marginal future reimbursement
Having described the institutional details of HVBP, we next discuss the HVBP formulas in great detail to understand theoretically how changes in one patient’s performance measures affect future Medicare payments. We also explain how those incentives are nonlinear for a given hospital and therefore heterogeneous across hospitals, creating heterogeneous incentives for improvement.
Our primary theoretical point is that Medicare payment for one patient hospitalization is no longer just the diagnosis related group (DRG) payment, as it was prior to HVBP, but now also includes a marginal future reimbursement. Simply put, hospital j’s Medicare reimbursement for patient i is the sum of their current DRG payment plus the discounted marginal future reimbursement (discounted two years at discount rate δ per year).
| (1) |
The first term on the right-hand side of equation (1) represents the payment by Medicare to the hospital for the patient’s index hospitalization, based on the DRG. The DRG payments vary across hospitals due to a variety of adjustments such as for teaching status, disproportionate share hospital (DSH) payments, and geographic variation in cost of living adjustments. This explains the hospital subscript j in equation (1). Of course, our theoretical point only applies to Medicare patients and to hospitals that participate in the HVBP program.
The second term is the focus of this paper. Unlike the DRG payment, the marginal future reimbursement is not uniform for all patients at the same hospital with the same medical condition and treatment. Instead, it varies by patient within hospital for each of the four domains of patient experience, clinical processes, outcomes, and episode payments. It varies across hospitals for otherwise identical patients because the marginal incentives differ depending on where a hospital is in the distribution of performance levels within each of these measures.
For example, consider two patients admitted to the same hospital for coronary bypass with percutaneous transluminal coronary angioplasty (PTCA) and without major complications. Both are assigned to DRG 232. The hospital receives the same DRG payment for their index hospitalization. However, suppose one dies shortly after discharge while the other lives. The patient who dies will raise the hospital’s mortality rate, adversely affecting the hospital’s outcome domain, percent bonus, and future Medicare payments, while the patient who lives improves the hospital’s mortality rate. The two patients have different marginal future reimbursements, one positive and one negative, solely based on their mortality. About two years in the future, all Medicare payments for that hospital will be affected by the mortality rate in the current year, resulting in a discounted (by δ2 over two years) adjustment to the percent bonus that is applied to all Medicare payments for inpatient care. A similar story can be told about the other measures of quality of care and episode payments.
In contrast, consider two identical patients who have identical experiences in terms of all the measured outcomes, yet are admitted to different hospitals. Although their experiences are the same, they could have quite different marginal future reimbursements. For example, if one hospital is already a top performer and has the maximum number of achievement points, the marginal future reimbursements will be zero. A hospital that is in the upper-middle part of the distribution will typically have larger marginal future reimbursements. There is heterogeneity in the marginal future reimbursement across hospitals as well as within hospitals.
Next we focus on the details of the HVBP program, to understand the translation from specific measures to dollars. The conversion of measures to dollars has four steps. The measures are converted to points. The Total Performance Score (TPS) is the weighted sum of points. The percent bonus is a rescaling of TPS. The expectation was to have a range from −1.5 to 1.5% in FY 2015, but the actual numbers were from −1.24% to 2.09% to ensure a budget-neutral redistribution. Finally, the percent bonus is applied to each hospital’s future Medicare inpatient payments. The following schematic diagram shows this full conversion.
| (2) |
Every measured outcome — the 12 clinical processes of care, eight patient experience scores, five patient health outcomes, and one episode payment (in FY 2015) — affects future Medicare reimbursement. The marginal effect of one patient on future Medicare reimbursement, summed over the 26 different measures, depends on five partial derivatives, one for each term in equation (2). The marginal future reimbursement (MFR) is specific to each patient i and their hospital j.
| (3) |
The marginal future reimbursement for each patient is the full partial derivative summed over all 26 measures.
| (4) |
Because the conversion of TPS to percent bonus to dollars is independent of the specific measures, we can rearrange the formula by pulling out the last two terms. Furthermore, the expectation operator matters only for the change in points from the change in measures, which is actually discontinuous because of rounding but we analyze as if it were continuous.
| (5) |
Working backwards through equation (5), the effect of the percent bonus on a hospital’s annual Medicare reimbursement (% Bonus → $) depends on annual Medicare inpatient payments. In other words, it is roughly proportional to hospital size. The amount of the bonus (in dollars) is the percent bonus multiplied by the inpatient Medicare payments in a year. The total annual Medicare inpatient payments will be proportional to the number of Medicare inpatients, and may be many tens of millions of dollars. Therefore, even a miniscule change in the percent bonus can lead to a substantial change in dollars.
The conversion of TPS to percent bonus (TPS → % Bonus) is perfectly linear. In FY 2015, the conversion was 2.5801048882. This maps the range of TPS (from 6.6 to 92.86 in FY 2015) into the percent bonus range of −1.24% to 2.09%. The conversion factor differs by year. Similarly, the conversion of measures to points to TPS (Points → TPS) is also linear, although the weights have changed over the years (as explained in section 2).
Finally, the conversion of the raw measures to points (Measures → Points) is complex and nonlinear. It depends on the hospital’s score relative to other hospitals and to its own baseline score. For an excellent hospital, a small marginal improvement will not lead to any more points. For a bad hospital, a small marginal improvement will not lead to any achievement points, but may (or may not) generate improvement points. CMS wanted to reward high-performing hospitals, while also providing an incentive for low-performing hospitals to improve. This dual-reward system provides positive incentives for improvement (or maintaining high quality) across the performance spectrum. Because this term of equation (5) is too complicated to summarize in a single formula, we will rely on empirical data to determine the average marginal effects at different points in the distribution, averaged across different hospitals and different domains.
Implications
This conceptual framework has several implications. First, each Medicare patient has a marginal future reimbursement, which contributes to their total reimbursement. Each patient contributes to at least some of the measures used to determine the percent bonus. (For example, although all Medicare patients are included in the efficiency score, only AMI, heart failure, and pneumonia patients affect the mortality score.) Each patient changes the hospital’s measures, which ultimately affects that hospital’s future Medicare reimbursement.
Second, the relationship between one patient’s measures and future hospital reimbursement is complicated and nonlinear. However, we can glean some insights from the formulas. If a patient’s measures are better than the hospital’s average, then the marginal benefit is positive. If the patient’s measures are worse than the hospital’s average, then the marginal future reimbursement is negative. If the patient’s measures are sufficiently poor, then the marginal future reimbursement could be negative enough to dominate the DRG payment, leaving the hospital with a net negative reimbursement for that patient. Hospitals in the middle of the distribution for a measure will have larger marginal effects than those at either extreme. Hospitals with many Medicare patients have more money at stake, but any one patient has a smaller marginal effect on the percent bonus. These effects roughly cancel out, because the marginal effects are multiplicative and one is proportional to number of patients and the other is inversely proportional. Therefore, marginal future reimbursements are not related to hospital size.
Third, there is great heterogeneity in these effects, both across patients within hospitals and across hospitals. Within a hospital, there is heterogeneity across patients because some patients’ measures will improve the hospital average and other patients’ measures will worsen the hospital average. Of course, most patients will have some measures above and some below. There is also heterogeneity across Medicare patients in how many measures will be taken for each patient. As discussed above, certain measures only apply to patients with certain medical conditions, or those who take the patient experience survey. Between hospitals there is heterogeneity in their baseline measures and where their average is in the overall distribution, and those differences create nonlinearities in the marginal effects.
Fourth, the marginal future reimbursements create incentives for hospitals to improve their quality and episode payments for care. Furthermore, each hospital can determine which areas of quality improvement have the highest return on investment. Those are the areas where the hospital should invest (assuming that the cost of effort is equal across domains). However, some hospitals have zero marginal incentive to improve, as we will show.
Fifth, hospitals that have already integrated with some post-acute care providers should have lower cost of improving quality of care, due to shared information, resources, and goals. Therefore, hospitals that have already integrated may exhibit greater improvement in their measures from one year to the next, due to the lower cost of improvement.
The conceptual framework also guides our empirical research. One empirical goal is descriptive: to estimate the magnitude of these incentives, to show the distribution across hospitals, and to explain how it varies across hospitals. We estimate the magnitudes of the marginal future reimbursements at the patient level for certain measures, and the average marginal future reimbursement for modest changes at the hospital level, to see how large these incentives are. We are interested in the distributions, not merely the means, including the fraction of zeros and the maximum. We want to know if the distributions vary across different measures, and systematically by hospital characteristics such as size, integration, and safety-net status.
Another empirical goal is behavioral: to estimate if hospitals respond to these incentives by improving most in domains where they have the largest incentive to improve. We test to see if the observed changes in measures from year to year are positively related to the average hospital-level incentive for improvement. If yes, then that indicates that the current financial incentives in HVBP are enough to promote the improvement (although that alone will not indicate if the magnitude is optimal). We also test whether integrated hospitals respond more than non-integrated hospitals. Although the conceptual framework focuses on the direct effect of the marginal TPS on its own measure, because of constrained resources there could be cross-effects of one marginal TPS on a different measure. In our empirical work we also estimate the main model controlling for all other marginal TPS included to see if these cross effects are important empirically.
4. Empirical work
MFR for mortality in Michigan
Before estimating the marginal future reimbursements for all 26 measures and whether they influence hospitals to improve, it is instructive to estimate the magnitude of the marginal future reimbursement for the three mortality measures. Mortality is a widely used and understood measure of quality. Discrete changes in mortality are easy to model and interpret. Therefore, we will estimate a simpler version of equation (5), one that only uses a mortality measure instead of summing over all measures.
One way to measure the effect of mortality on the marginal future reimbursement is to ask: by how much would marginal future reimbursements change if one more patient had died? We ask the question this way, instead of one fewer, because mortality rates are low, so adding one death avoids any floor effects. The approach is straightforward. We know the total number of patients in each hospital who were treated for acute myocardial infarction (AMI), heart failure, or pneumonia during the measurement period. We know the observed mortality rate. Therefore, we can estimate the number of deaths (the estimated number may not be an exact integer due to small differences in sample between our sample derived directly from Medicare claims and what CMS uses). Then we recalculate each of the three mortality rates as if one more person had died. Next, we recalculate achievement and improvement points for that hospital, which then changes the total performance score, percent bonus, and total dollars. For some hospitals, especially those near the top and bottom of the mortality distribution, one additional death will have no effect on their points or marginal future reimbursement. Therefore, for each of the three measured mortality rates (m = AMI, heart failure, pneumonia), we estimate a simplified version of equation (5).
| (6) |
One important technical note is that we allow for fractional changes in achievement and improvement points. This does not happen when CMS assigns points; CMS rounds all points to the nearest integer. Our approach is consistent with an expected increase. Because these measures are too complicated to game precisely, we feel that our approach gives a better sense of the actual marginal future reimbursement. However, as a robustness check, we also re-ran the analyses using the CMS method of rounding all points to the nearest integer. Our results are qualitatively the same.
One-decile improvement
While the analysis looking at a change in a single patient’s outcome is revealing, the more policy-relevant approach estimates the effect on future reimbursement if a hospital makes a modest improvement in one measure. Hospitals often embark on initiatives to improve quality or to lower episode spending in certain departments or for specific medical conditions. Therefore, it is natural to ask, what is the effect of a one-decile improvement in a measure on future Medicare reimbursement? A one-decile improvement in a measure is more standardized across measures than a one-unit improvement. It is large enough to be meaningful and it is roughly equal to the mean improvement for hospitals that do improve. A one-decile improvement can be estimated without individual data. Because we know each hospital’s score for each of the 26 measures in the four domains, we can simulate what would happen if that measure improved by one decile. For those in the top decile, we simulate them moving to the top of the distribution.
In this way, we can estimate the effect of a modest improvement in each measure. For example, a hospital at the 24th percentile improves to the 14th percentile. How large is a one-decile improvement? It depends on the measure and which part of the distribution the hospital is in, with a larger improvement usually needed in the tails of the distribution. For example, for AMI mortality, hospitals in the lowest quintile would need to improve mortality by 0.7 percentage points (on a baseline of 16 percent mortality), while those in the second and fourth quintiles would only need to improve by 0.3 percentage points, those in the middle quintile by 0.2 percentage points, and those in the top quintile by 1.4 percentage points. Given the change in measure, we can estimate the change in achievement and improvement points, which leads to improvements in TPS, percent bonus, and dollars. Although all hospitals in this simulation will improve their measure, the change in dollars may be small if there is no corresponding change in points. Therefore, for each of the 26 measures, we estimate a modification of equation (5).
| (7) |
Heterogeneity in one-decile improvement
We explored which hospitals tend to fall in which parts of the distribution of the marginal future reimbursements. This was done two ways. The first way provided a technical exploration of the nonlinear relationship between the measures and the marginal future reimbursement. We expected, for example, that hospitals at the bottom and at the top of the distribution of measure would have the smallest marginal future reimbursements. We graphed the mean change in TPS as a function of the achievement points and the improvement points to help illustrate how the formulas work, and how the measures translate to changes in TPS. In other words, which hospitals face the highest and lowest incentives to improve because of their measured quality is dependent on the distribution of achievement and improvement points.
The second way explored how hospital characteristics (integration, teaching status, size, safety-net, urban/rural, etc.) are related to the incentives. This showed which kinds of hospitals face the strongest incentives. Together, these two sets of analyses provided important information.
Change in TPS
Our conceptual framework predicts that having a stronger financial incentive to improve should be associated with a greater year-to-year improvement in that measure. Therefore, we will run regressions to estimate the change in measure performance (from FY 2015 to FY 2016) as a function of the size of the marginal incentive. We operationalize this by using the calculated one-decile improvement in the TPS score. A one-decile improvement standardizes improvements across different measures. Certainly, hospitals may improve by more (or less) than one decile, but this standardizes the amounts.
Our basic model estimates the change in a measure m over two years in hospital j as a function of the marginal TPS score in the first year (due to a one-decile change in the measure). Because the marginal TPS score measures the incentive for improving, we expect that the coefficient on marginal TPS will be positive. The model has one observation per hospital. Hospital-level control variables (X) include the value-based purchasing adjustment factor in FY 2015, percent of Medicare days, teaching affiliation, number of beds, for-profit status, and the integration status and safety-net status.
| (8) |
Our hypothesis is that β1 > 0 for measures such that a higher score indicates better performance (most measures). Patient experience, clinical process, and mortality measures are reported as percentages. Higher scores indicate better performance for most measures. However, lower values in Patient Safety Composite Score, CLABSI Score, and Medicare-Spending-per-Beneficiary Ratio indicate better quality or spending. We not only ran the main model, but also included interactions with whether the hospital is integrated and whether the hospital is a safety-net hospital. We also estimated models that controlled for marginal TPS for all measures and not only the one corresponding to the dependent variable.
5. Data
National data
The main analyses use national hospital-level data to estimate the effect of a one-decile improvement in measurement. These calculations do not require individual-level data. Therefore, we use national data. We used data from the CMS Hospital Compare and Medicare Impact File to identify hospitals participating in the HVBP program in both FY 2015 and FY 2016. For each of these 2,972 hospitals, we evaluated hospital-level performance on the spending and quality measures in the HVBP program using publically available CMS Hospital Compare data (see Table 3 for summary statistics). Additionally, we used the CMS FY 2016 Final Rule and Impact File to obtain actual payment adjustments due to the HVBP program and to estimate case-mix adjusted annual Medicare base payment rates.
Table 3.
Hospital characteristics
| National Sample |
Michigan Subsample |
|
|---|---|---|
| Hospitals, N | 2,972 | 82 |
| HVBP | ||
| Positive FY 2015 HVBP Bonus, % | 55 | 51 |
| Ownership, % | ||
| For-profit | 23 | 6 |
| Not-for-profit | 63 | 85 |
| Government | 14 | 9 |
| Region, % | ||
| Northeast | 16 | – |
| Midwest | 24 | 100 |
| South | 40 | – |
| West | 19 | – |
| Geographic Core-based Statistical Area, % | ||
| Large Urban | 41 | 37 |
| Other Urban | 35 | 37 |
| Rural | 24 | 27 |
| Teaching and Medicare | ||
| Teaching affiliated, % | 38 | 59 |
| Medicare Days, % | 38 | 44 |
| Medicare Admissions, mean | 3,008 | 4,487 |
| Hospital Integration | ||
| Integrated SNF, HHA, or IRF, % | 52 | 72 |
| Safety-net Hospital | ||
| Safety-net status, % | 32 | 15 |
| Uncompensated Care per Claim | 702 | 395 |
| Disproportionate Share, % | 29 | 26 |
We also used the FY 2016 Impact File to obtain hospital characteristics such as service regions, urban or rural status, and Medicare dependency. To examine hospital characteristics such as teaching affiliation and hospital ownership, we augmented the Impact File with the American Hospital Association Annual Survey from 2013. Teaching status is defined based on both AHA major and minor teaching status: it includes hospitals with approval to participate in residency or internship training by the Accreditation Council for Graduate Medical Education, hospitals with medical school affiliation as reported to the American Medical Association, hospitals that are members of the Council of Teaching Hospitals of the Association of American Medical Colleges, and hospitals with internship or residency approved by the American Osteopathic Association.
There are growing incentives to integrate within the Medicare system, as evidenced by the Bundled Payments Care Initiative as well as the Hospital Value-Based Purchasing Program. Both these programs reimburse hospitals based on the services provided during a longitudinal episode of care. As hospitals work to coordinate their care with providers in the pre and post-acute care setting, the efficiencies that could arise from integration will be an important consideration going forward. Penalties on readmissions are part of a different hospital quality program (Hospital Readmissions Reduction Program), but costs from readmissions are included in the spending measure in HVBP. The spending measure provides hospitals with clear incentives to integrate because costs are incorporated from 3 days before an inpatient hospitalization through 30-days post discharge.
Accordingly, we defined hospital integration with post-acute care providers using the FY 2014 Hospital Cost Report Information System. We defined integration by whether a hospital owned an inpatient rehabilitation facility (IRF), skilled nursing facility (SNF), or home health agency (HHA). Within our national sample, approximately 28 percent of hospitals had a hospital-based IRF, 17 percent with hospital-based SNF, and 24 percent with hospital-based HHA. A little more than half of all hospitals own at least one of the three types of hospital-based post-acute care services (52%).
To define safety-net hospitals, we relied on what has been used in the recent literature. Safety-net hospitals are not officially designated by CMS. Instead, CMS uses Disproportionate share hospital (DSH) patient percentage to reimburse hospitals serving larger proportions of patients that are covered by Medicare supplementary Social Security income and non-Social Security Income Medicaid patients. Following FY 2014, Medicare’s DSH payments were reduced to 25 percent and the remaining 75 percent transitioned to uncompensated care. Each Medicare DSH hospital received an uncompensated care payment based on 75 percent of the estimated DSH payment, share of uninsured patients, and a relative amount of UCC as compared to a national sample of DSH hospitals. Given the transition to UCC under PPACA, we consider both DSH and UCC as two dimensions of safety-net status. We defined safety-net hospitals based on two methods used in recent studies as measures of hospital safety-net status (Chatterjee and Joynt, 2014; Gilman et al., 2014; Gilman et al., 2015; Mohan et al., 2013). One component of our measure is the amount of Medicare uncompensated care (UCC) per claim; the other is the percentage of DSH.
Across these two components, we characterized hospitals as safety-net if they are in the top quartile of DSH or UCC across our national sample, resulting in a total of 940 safety-net and 2,032 non safety-net hospitals. Safety-net hospitals differ from non safety-net hospitals in a number of ways. Approximately 49 percent of safety-net hospitals are teaching affiliated as compared to 32 percent of non safety-net hospitals. On average, safety-net hospitals are larger in size than non safety-net hospitals in terms of mean beds per hospital (280 vs. 168 beds) and average number of annual Medicare cases (3,300 vs. 2,873). Fewer safety-net hospitals than non safety-net hospitals received bonuses of some value under the FY 2015 HVBP program (61 percent vs. 43 percent).
Michigan data
Some of our analyses require having patient-level Medicare data. For those analyses, we turn to the state of Michigan, which has 82 hospitals participating in the HVBP program. Michigan is the 10th largest state by population and is known to have heterogeneous, representative demographics. Michigan hospitals were similar to national hospitals on a number of dimensions (see Table 3 for summary statistics). For example, Michigan hospitals were comparable to the rest of the US on the proportion of hospitals that received HVBP bonuses (51% vs. 56%), hospital bed counts (median of 181 vs. 146), as well as in the receipt of payments for DSH (mean 26% vs. 29%). Michigan hospitals were more reliant on Medicare beneficiaries compared to the rest of the US, with an average of approximately 75% more Medicare patients per year, and tended to receive fewer Medicare dollars for uncompensated care (median of $335 per claim vs. $424 per claim). Further, Michigan hospitals tended to be more integrated than the general US hospital sample.
However, what is most important for this analysis is whether the distribution of mortality rates in Michigan hospitals is similar to the national distribution. The distribution of the Michigan mortality rate has about the same mean and distribution as the national data. Michigan hospitals have a nearly uniform distribution among all hospitals nationally. Therefore, conclusions about the magnitude and distribution of the marginal future reimbursement based on the Michigan data will be representative nationally.
To compute the marginal effect of one additional death (for the three specific conditions) on Medicare payments we need to know both the mortality rate and the number of admissions in each hospital during the measurement period (October 1, 2012 through June 30, 2013). The CMS Hospital Compare and Medicare Impact File give the mortality rate for AMI, heart failure, and pneumonia for each participating Michigan hospital. To compute the marginal effect of one more death, we also need the denominator, which is why we are restricted to the Michigan data. Using the 100% FY 2015 MEDPAR data we counted the number of patients admitted to each of the 82 hospitals for the three conditions between October 1, 2013 and June 30, 2013. The final sample has 6,017 admissions for AMI, 9,982 for heart failure, and 8,644 for pneumonia.
To compute the marginal effect of each patient’s episode payments on the hospital’s efficiency score and Medicare payments, we need patient-level episode payments. We have access to price-standardized episode payments for all Medicare patients in Michigan, including up to 30 days post discharge. The Michigan episode payments come from the Michigan Value Collaborative (MVC) claims-based registry. The MVC is a quality improvement collaborative that maintains Medicare and Blue Cross Blue Shield claims-based data on use and costs surrounding 30 and 90 day episodes of care for hospitals in Michigan. Episodes are defined as the period extending from hospital admission through 30 days post discharge and include payments for services delivered during this time window. The Michigan episode payments are not risk adjusted, although the national HVBP spending measure is. We estimated total Medicare episode payments for each of the Michigan hospitals in our sample for all claims dated between May 1, 2013 and December 31, 2013 (the measurement period for efficiency). Because the HVBP payment adjustments only affect the Medicare Part A base payment rates, we excluded Medicare reimbursements for disproportionate share hospital, indirect medical education, and new technology payments. Only patients with Medicare as the primary payer were included in these figures. Our sample of Michigan Medicare patients includes 24,643 admissions.
6. Results
Marginal future reimbursement for mortality in Michigan
The marginal future reimbursement of one additional death ranges widely across the eligible Michigan hospitals, from $0 to more than a $40,000 penalty (see Figure 1 for box and whisker plots of the distribution of the change in annual Medicare payments). First, for roughly one-third of all hospitals, one additional death does not affect marginal future reimbursement (marginal future reimbursement is zero). The specific numbers are 17 hospitals (out of 50) for AMI, 33 out of 73 for heart failure, and 25 out of 75 for pneumonia. On the other hand, for the two-thirds of hospitals that do face a penalty, the marginal future reimbursement (negative, a penalty) can be as large as −$44,683 for AMI, −$41,303 for heart failure, and −$29,345 for pneumonia.
Figure 1.
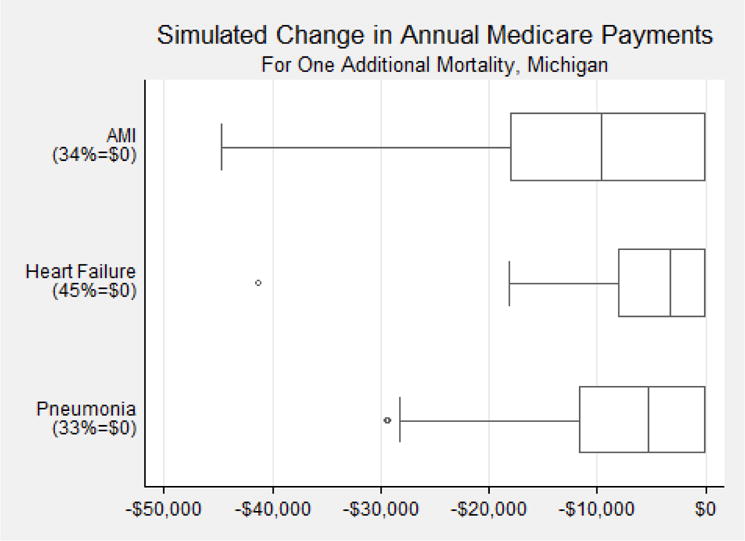
Box and whisker plots of the distribution of the change in annual Medicare payments (always negative) for Michigan hospitals if they had had one additional mortality, for AMI, heart failure, and pneumonia.
We next show summary statistics, including average achievement points and improvement points, for Michigan hospitals grouped by whether their marginal future reimbursements were zero, medium, or large. Michigan hospitals with larger (more negative) marginal future reimbursements, as defined by hospitals with below-the-mean marginal future reimbursement, have more beds, are more likely to be integrated, and tend to be safety-net hospitals (see Table 4). These hospitals also have greater achievement scores in the middle of the score distribution, consistent with greater sensitivity to shifts in scoring as compared to hospitals at the bottom of the performance distribution.
Table 4.
Summary statistics for Michigan hospitals grouped by marginal future reimbursement from one additional mortality, for AMI, heart failure, and pneumonia
| N | Measure (mean) | Improvement Score (mean) | Achievement Score (mean) | Bed Size (mean) | PAC Integration (%) | Safety-Net (%) | |
|---|---|---|---|---|---|---|---|
| Outcome: AMI Mortality | |||||||
| Total | 50 | 85.6 | 4.2 | 5.3 | 341 | 72 | 20 |
| $0 | 17 | 85.2 | 3.2 | 3.5 | 358 | 76 | 24 |
| $0 to – $17,654 | 68 | 11 | |||||
| (reference) | 19 | 85.7 | 4.4 | 5.5 | 282 | ||
| > −$17,653 | 14 | 85.9 | 5 | 7.1 | 399 | 71 | 29 |
| Outcome: Heart Failure Mortality | |||||||
| Total | 73 | 88.0 | 1.5 | 2.2 | 262 | 71 | 15 |
| $0 | 33 | 87.1*** | 0.3 | 0.6** | 245 | 70 | 6** |
| $0 to –$9,119 | 71 | 25 | |||||
| (reference) | 24 | 88.3 | 1.8 | 2.2 | 227 | ||
| > −$9,119 | 16 | 89.2*** | 3.8** | 5.5*** | 352** | 75 | 19 |
| Outcome: Pneumonia Mortality | |||||||
| Total | 75 | 88.9 | 3.3 | 4.1 | 255 | 72 | 15 |
| $0 | 25 | 87.6*** | 1.1*** | 1.2*** | 246 | 72 | 12 |
| $0 to −$10,804 (reference) |
31 | 89.5 | 5.0 | 5.2 | 197 | 68 | 10 |
| > −$10,804 | 19 | 89.6 | 3.5 | 6.0 | 363*** | 79 | 26 |
p<0.05
p<0.01
Lower MSPB score indicates better performance
For each of the three mortality measures, hospitals are grouped by the size of the marginal future reimbursement from one additional mortality. The first row is for all Michigan hospitals. The next three rows are for subsamples defined by the size of the marginal future reimbursement.
One-decile improvement
The results of the one-decile improvements show remarkably consistent patterns of wide heterogeneity, with the largest values being quite substantial (see Figures 2, 3, and 4 for box and whisker plots of the distribution of the change in annual Medicare payments).
Figure 2.
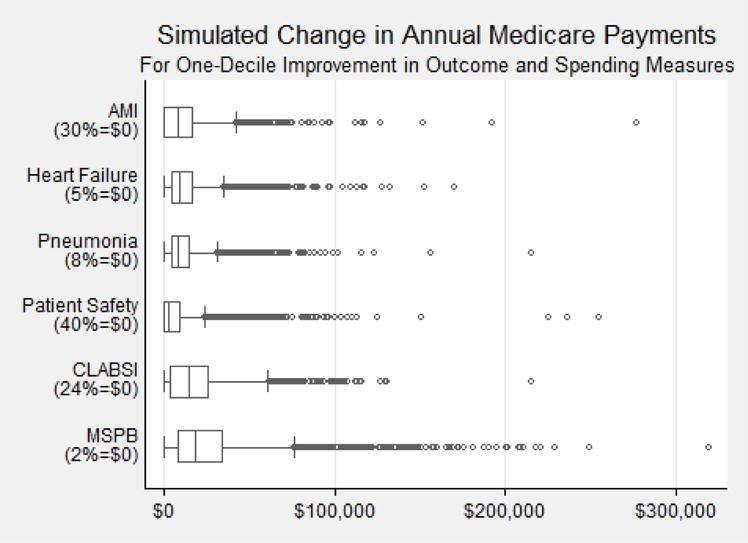
Box and whisker plots of the distribution of the change in annual Medicare payments (always positive) for all hospitals nationwide if they improved the measure by one decile.
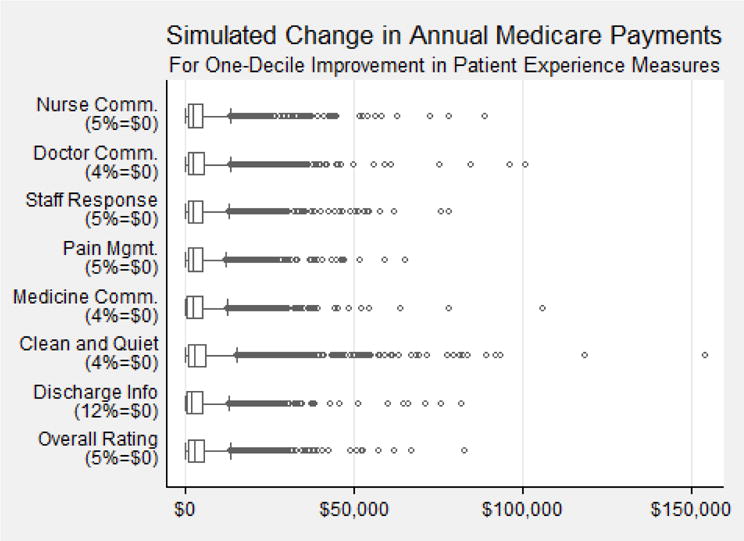
Figure 3.
Box and whisker plots of the distribution of the change in annual Medicare payments (always positive) for all hospitals nationwide if they improved the measure by one decile.
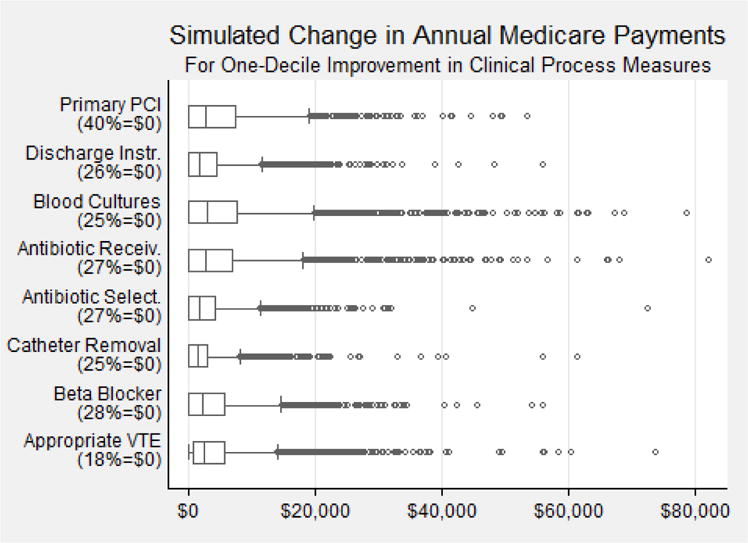
Figure 4.
Box and whisker plots of the distribution of the change in annual Medicare payments (always positive) for all hospitals nationwide if they improved the measure by one decile.
We start with the mortality results, which are somewhat comparable to the Michigan results for a single death (see Figure 2). A large fraction of hospitals nationwide would see no financial benefit from improving their mortality rate by one decile. For AMI, about two-thirds of hospitals would get a bonus. For heart failure and pneumonia, this value is over 90 percent. For hospitals that would receive a bonus, most would receive less than $50,000, but a few would receive more than $100,000. The other two outcome measures (PSI-90 and CLABSI) have similar distributions, with approximately one-third of hospitals with zeros and a long right tail extending past $100,000, to an extreme of more than $200,000.
A one-decile improvement in the efficiency measure (Medicare Spending Per Beneficiary, or MSPB) is similarly skewed (see bottom row of Figure 2). There is no financial payment for 73 out of 2,972 hospitals (2%). The median is around $20,000. The incentive to improve efficiency by one-decile is as high as $300,000.
In contrast to the results for the one-decile improvements in outcomes and efficiency scores, the results for patient experience (see Figure 3) and clinical process of care (see Figure 4) are much smaller in magnitude. The median values, again shown in box and whisker plots, are less than $5,000. The upper whisker values are never higher than $20,000. The highest values were nearly all less than $100,000. As with the other measures, there were sizeable fractions with zero values.
Heterogeneity in one-decile improvement
Having shown wide variation in the distribution of incentives from a one-decile improvement, we next document differences in TPS across different types of hospitals (see Tables 5A and 5B). Hospitals that are rural, non-teaching, and have relatively few Medicare admissions face higher incentives than other types of hospitals. Hospitals that are integrated with SNFs, IRFs, or home health agencies tend to have similar marginal incentives as those that are non-integrated in terms of TPS change. For the measure of episode spending, integrated hospitals appear to face slightly smaller incentives than non-integrated hospitals. In terms of Medicare reimbursement, however, our results indicate that integrated hospitals tend to have larger total marginal future reimbursements than non-integrated hospitals (see Table 6). There is no appreciable difference between safety-net and non-safety net hospitals and the marginal incentives are relatively similar across various parts of the US.
Table 5A.
Mean change in TPS from a one-decile improvement, by hospital characteristics, national data
| Experience: Hospital Rating | Process: Beta Blocker | Outcome: AMI Mortality | Efficiency: MSPB | |
|---|---|---|---|---|
| All Hospitals in Measure | 0.50 | 0.41 | 0.75 | 3.06 |
| Ownership | ||||
| For-profit | 0.48*** | 0.47 | 0.71 | 3.27*** |
| Not-for-profit | 0.49 | 0.39 | 0.75 | 2.91*** |
| Government | 0.54*** | 0.44 | 0.85 | 3.39*** |
| Region | ||||
| Northeast | 0.49** | 0.42*** | 0.71 | 2.72** |
| Midwest | 0.46*** | 0.36*** | 0.74 | 3.09** |
| South | 0.52** | 0.43 | 0.81 | 3.02** |
| West | 0.49** | 0.45*** | 0.71 | 3.38** |
| Geographic Core-based Statistical Area | ||||
| Large Urban | 0.46 | 0.40 | 0.72 | 2.79 |
| Other Urban | 0.45 | 0.40 | 0.79 | 2.93 |
| Rural | 0.61*** | 0.47 | 0.75 | 3.70*** |
p<0.05
p<0.01
The significance levels indicate pair-wise comparisons with Bonferroni adjustment. For Experience, for-profit are significantly different from government hospitals; South region is different from each of the other regions (p<0.01 vs. Midwest, p<0.05 vs. Northeast, p<0.05 vs. West); and rural hospitals are different from non-rural hospitals. For Process, Midwest region is different from Northeast and West (p<0.01); For Efficiency, not-for-profit hospitals are different from for-profit and government hospitals (p<0.01); West region is different from Northeast (p<0.01), Midwest (p<0.05), and South (p<0.01); Northeast region is different from Midwest (p<0.05); rural hospitals are different from non-rural hospitals.
Table 5B.
Mean change in TPS from a one-decile improvement, by hospital characteristics, national data
| Experience: Hospital Rating | Process: Beta Blocker | Outcome: AMI Mortality | Efficiency: MSPB | |
|---|---|---|---|---|
| Teaching affiliation | ||||
| Affiliated | 0.45*** | 0.38 | 0.75 | 2.64*** |
| Not Affiliated | 0.52*** | 0.44 | 0.76 | 3.32*** |
| Percent Medicare Days | ||||
| < Mean Medicare Days | 0.48*** | 0.41 | 0.77 | 3.01*** |
| ≥ Mean Medicare Days | 0.51*** | 0.42 | 0.74 | 3.11*** |
| Medicare Admissions per Year | ||||
| < Mean Medicare Admissions | 0.53*** | 0.46 | 0.73 | 3.48*** |
| ≥ Mean Medicare Admissions | 0.43*** | 0.35 | 0.76 | 2.36*** |
| Hospital Integration | ||||
| PAC Integration | 0.49 | 0.40 | 0.77 | 2.97*** |
| No PAC Integration | 0.50 | 0.44 | 0.73 | 3.16*** |
| Safety-Net Status, UCC or DSH | ||||
| Safety-Net | 0.53** | 0.44** | 0.79 | 3.03 |
| Non Safety-Net | 0.48* | 0.40** | 0.74 | 3.08 |
| FY 2015 HVBP Bonus | ||||
| Downward Adjustment | 0.49 | 0.47*** | 0.88*** | 2.60*** |
| Upward Adjustment | 0.50 | 0.37c | 0.60*** | 3.43*** |
p<0.05
p<0.01
The significance levels indicate pair-wise comparisons with Bonferroni adjustment.
Table 6.
Summary statistics for hospitals grouped by marginal future reimbursement for a one-decile improvement in each of four representative measures, national data
| N | Measure (mean) | Improvement Score (mean) | Achievement Score (mean) | Bed Size (mean) | PAC Integration (%) | Safety-Net (%) | |
|---|---|---|---|---|---|---|---|
| Experience: Hospital Rating | |||||||
| Total | 2,937 | 69.9 | 1.6 | 2.7 | 206 | 52 | 32 |
| $0 | 149 | 85.9*** | 6.0*** | 9.1*** | 97*** | 19*** | 9*** |
| $0 – $5,070 | 31 | ||||||
| (reference) | 1,884 | 69.0 | 1.3 | 2.2 | 139 | 50 | |
| > $5,070 | 904 | 69.1 | 1.3 | 2.8*** | 362*** | 63*** | 37*** |
| Process: Beta Blocker | |||||||
| Total | 2,715 | 97.0 | 3.8 | 4.8 | 218 | 53 | 31 |
| $0 | 772 | 99.1*** | 6.0*** | 9.5*** | 166 | 46*** | 29 |
| $0 – $5,863 | 28 | ||||||
| (reference) | 1,261 | 95.9 | 3.4 | 2.8 | 163 | 52 | |
| > $5,863 | 682 | 96.8*** | 2.2*** | 3.4*** | 378*** | 64*** | 38*** |
| Outcome: AMI Mortality | |||||||
| Total | 1,485 | 85.5 | 4.8 | 5.3 | 305 | 62 | 31 |
| $0 | 444 | 86.8*** | 8.8*** | 9.6*** | 324*** | 64 | 29 |
| $0–$18,515 | 704 | 85.3 | 4.0 | 58 | 29 | ||
| (reference) | 4.3 | 227 | |||||
| > $18,515 | 337 | 84.3*** | 1.4*** | 1.8*** | 441*** | 68*** | 40*** |
| Efficiency: MSPB† | |||||||
| Total | 2,962 | 0.99 | 0.88 | 1.88 | 204 | 52 | 32 |
| $0 | 73 | 0.85*** | 6.05*** | 7.81*** | 112 | 38 | 27 |
| $0–$27,853 | 29 | ||||||
| (reference) | 1,907 | 0.98 | 0.97 | 1.89 | 127 | 47 | |
| > $27,853 | 982 | 1.00*** | 0.42*** | 1.41*** | 362*** | 63*** | 36*** |
p<0.05
p<0.01
Lower MSPB score indicates better performance
For each of the four representative measures, hospitals are grouped by the size of the marginal future reimbursement from a one-decile improvement in that measure. The first row is for all hospitals. The next three rows are for subsamples defined by the size of the marginal future reimbursement.
We also present results that show the technical relationship between improvement and achievement points on the adjustment factor after a one-decile improvement in measure performance. Specifically, each figure shows the mean change in the adjustment factor (y-axis) for a one-decile improvement in overall hospital rating, using national data, conditional on achievement points (x-axis) and improvement points (different lines). A higher value of the adjustment factor means that for that combination of achievement and improvement points, the marginal future reimbursement will also be higher.
The measures generally follow one of two patterns. The first pattern is exemplified by the Medicare-Spending-per-Beneficiary and overall hospital rating measures (see Figures 5 and 6). The underlying measures are quite continuous. For this first pattern, hospitals in the middle of the scoring distribution for both improvement and achievement face a larger incentive than hospitals at the tail ends of the distribution. Hospitals that are either already among the best or the worst have little direct financial incentive to improve.
Figure 5.
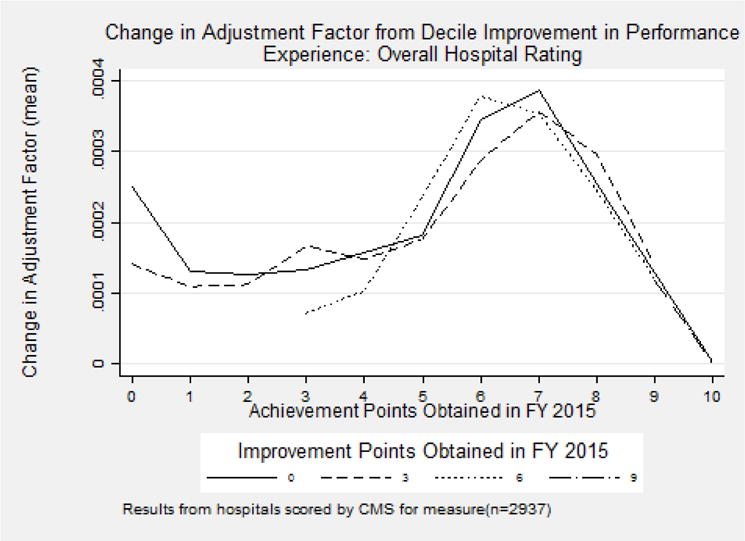
Mean change in Adjustment Factor (y-axis) for a one-decile improvement in overall hospital rating, using national data, conditional on achievement points (x-axis) and improvement points (different lines).
Figure 6.
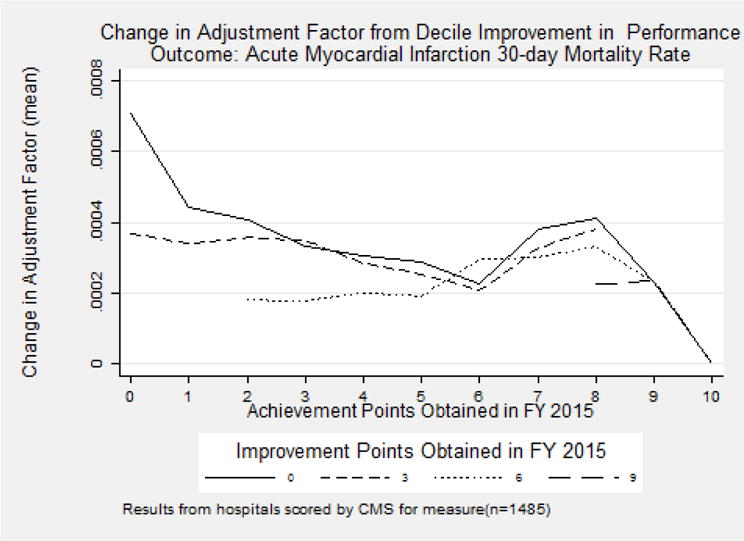
Mean change in Adjustment Factor (y-axis) for a one-decile improvement in AMI 30-day mortality, using national data, conditional on achievement points (x-axis) and improvement points (different lines).
The second pattern is demonstrated by measures on AMI mortality and beta blocker during the perioperative period (see Figures 7 and 8), and is consistent with the other patient experience and clinical measures. The underlying measures have a ceiling effect, that is, a large group of hospitals that achieve the maximum score and cannot improve. For this second pattern, hospitals tend to have more to gain from a one-decile improvement when performance across both improvement and achievement is low.
Figure 7.
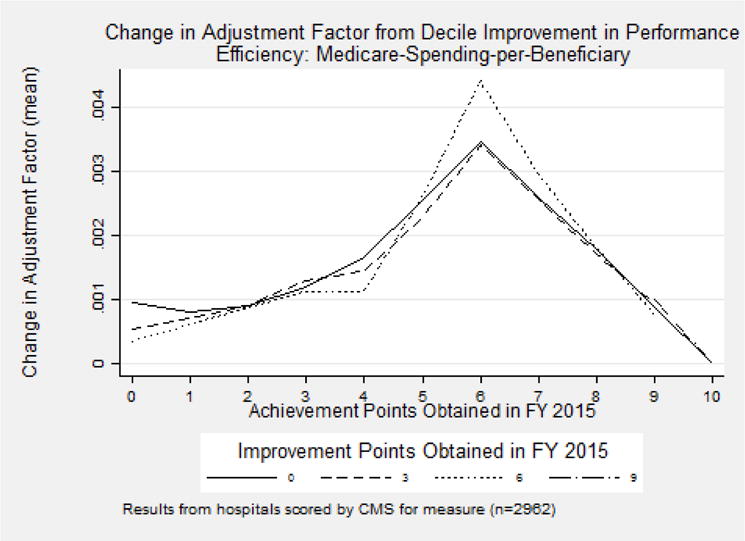
Mean change in Adjustment Factor (y-axis) for a one-decile improvement in Medicare spending per beneficiary, using national data, conditional on achievement points (x-axis) and improvement points (different lines).
Figure 8.
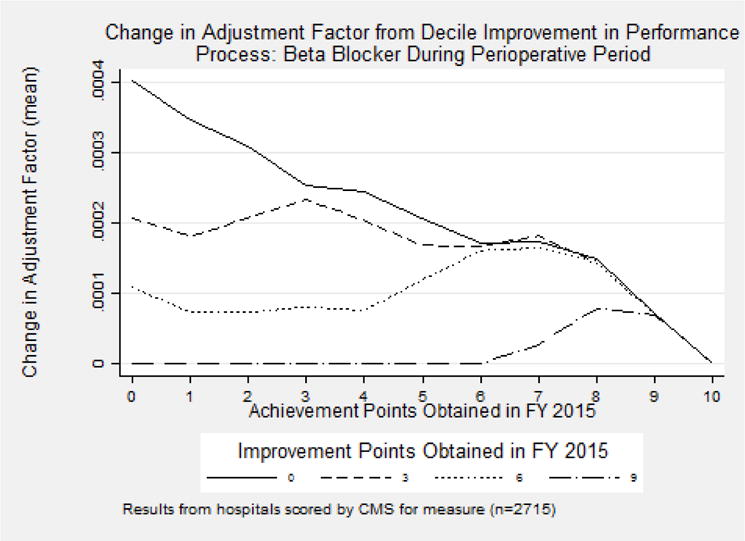
Mean change in Adjustment Factor (y-axis) for a one-decile improvement in use of beta blockers during perioperative period, using national data, conditional on achievement points (x-axis) and improvement points (different lines).
Change in TPS
The overall results showing the relationship between the marginal incentive from a one-decile improvement in a measure and its year-to-year change in measure performance are generally consistent with our hypothesis (see Table 7). The model predicts that higher marginal benefits from performance improvements should induce greater improvement in performance over time. The first 15 measures are defined so that a higher number indicates improvement in performance, while the last three (patient safety composite score, CLABSI, and efficiency) are all defined so that lower scores are preferred. Of these, seven are statistically significant and of the expected sign, two are statistically significant and of the opposite sign; the rest are not statistically significant. When also controlling for the other marginal incentives of all other measures, the results are even stronger. In those models there are nine statistically significant coefficients with the expected signs and only one with the opposite sign.
Table 7.
FY 2016 measure change from one-decile measure improvement
| Mean | (1) Coeff. (SE) |
(2) Coeff. (SE) |
|
|---|---|---|---|
| Patient Experience of Care Domain | |||
| Nurse Communication | 78.03 | −0.34** (0.16) |
−0.11 (0.20) |
| Doctor Communication | 80.55 | 0.31*** (0.12) |
0.31** (0.13) |
| Hospital Staff Responsiveness | 65.36 | −0.04 (0.19) |
0.11 (0.22) |
| Pain Management | 70.15 | 0.39** (0.17) |
0.98*** (0.20) |
| Medicine Communication | 63.07 | 0.36 (0.21) |
0.74*** (0.24) |
| Hospital Cleanliness & Quietness | 65.69 | −0.12 (0.13) |
−0.14 (0.13) |
| Discharge Information | 85.57 | 0.66*** (0.13) |
0.75*** (0.13) |
| Overall Hospital Rating | 69.89 | 0.66*** (0.19) |
0.76*** (0.00) |
| Clinical Process of Care Domain | |||
| Prophylactic Antibiotic Selection | 98.74 | 1.04*** (0.14) |
1.29*** (0.14) |
| Urinary Catheter Removal | 96.90 | −0.19 (0.31) |
−0.04 (0.32) |
| Beta Blocker During Perioperative Period | 97.03 | 0.26 (0.18) |
0.59*** (0.19) |
| VTE Prophylaxis Within 24 Hours | 97.60 | 1.79*** (0.10) |
1.721*** (0.099) |
| Outcomes Domain | |||
| AMI Survival Rate (1 – Mortality Rate) | 85.53 | 0.081*** (0.026) |
0.072*** (0.027) |
| HF Survival Rate (1 – Mortality Rate) | 87.94 | 0.026 (0.017) |
0.023 (0.017) |
| PN Survival Rate (1 – Mortality Rate) | 88.35 | −0.022 (0.020) |
−0.019 (0.021) |
| Patient Safety Composite Score | 0.50 | 0.0017 (0.0020) |
0.0015 (0.0021) |
| CLABSI Score | 0.52 | −0.018 (0.013) |
−0.019 (0.014) |
| Efficiency Domain | |||
| Medicare-Spending-per-Beneficiary Ratio | 0.99 | 0.00103*** (0.00036) |
0.0010*** (0.0004) |
|
| |||
| Include other incentives as controls? | No | Yes | |
p<0.05
p<0.01
These results report the measure averages in FY 2015, (1) the coefficient and its standard error from regressing measure rate differences from FY 2015 to FY 2016 on marginal incentive (effect of one-decile improvement on Total Performance Score), and (2) same as (1) with the addition of marginal incentives for all other measures. Patient experience, clinical process, and mortality measures are reported as percentages, and higher scores indicate better performance. Lower values in Patient Safety Composite Score, CLABSI Score, and Medicare-Spending-per-Beneficiary Ratio indicate better quality.
For most measures integrated hospitals perform at least as well as non-integrated hospitals, with the exception of two process measures, where the coefficients are the wrong sign (see Table 8). There appears to be no difference in response across integrated and non-integrated hospitals for patient experience measures. Our results show that integrated hospitals are associated with improvement on the spending, CLABSI, and Beta Blocker During Perioperative Period measures as compared to non-integrated hospitals.
Table 8.
FY 2016 measure change from one-decile measure improvement conditional on integration and safety-net status
| Constant term (SE) |
Integrated (SE) |
Safety-Net (SE) |
|
|---|---|---|---|
| Patient Experience of Care Domain | |||
| Nurse Communication | −0.29 (0.24) |
−0.14 (0.32) |
−0.05 (0.34) |
| Doctor Communication | 0.27 (0.17) |
−0.07 (0.23) |
0.22 (0.25) |
| Hospital Staff Responsiveness | −0.28 (0.29) |
−0.24 (0.38) |
0.88** (0.39) |
| Pain Management | 0.42 (0.25) |
−0.41 (0.33) |
0.49 (0.36) |
| Medicine Communication | 0.86*** (0.32) |
−0.51 (0.42) |
−0.76 (0.44) |
| Hospital Cleanliness & Quietness | 0.11 (0.20) |
−0.31 (0.24) |
−0.21 (0.25) |
| Discharge Information | 0.81*** (0.19) |
0.07 (0.21) |
−0.41 (0.21) |
| Overall Hospital Rating | 0.35 (0.29) |
0.32 (0.36) |
0.46 (0.37) |
| Clinical Process of Care Domain | |||
| Prophylactic Antibiotic Selection for Surgical Patients | 0.88*** (0.18) |
0.40 (0.22) |
0.12 (0.21) |
| Postoperative Urinary Catheter Removal | 0.72** (0.36) |
−1.14*** (0.40) |
−1.72*** (0.41) |
| Beta Blocker During Perioperative Period | −0.22 (0.22) |
0.79** (0.32) |
0.92*** (0.35) |
| Surgery Patients Who Received Appropriate VTE | 2.00*** (0.13) |
−0.34** (0.17) |
−0.27 (0.16) |
| Outcomes Domain | |||
| Acute Myocardial Infarction 30-day Mortality Rate | 0.091** (0.037) |
0.040 (0.040) |
−0.104** (0.041) |
| Heart Failure 30-Day Mortality Rate | 0.012 (0.028) |
0.052 (0.034) |
0.035 (0.047) |
| Pneumonia 30-Day Mortality Rate | −0.012 (0.030) |
−0.049 (0.036) |
0.047 (0.039) |
| Patient Safety for Select Indicators Composite Score | −0.0001 (0.0026) |
0.0026 (0.0026) |
0.0011 (0.0027) |
| Central Line-Associated Bloodstream Infection Score | 0.010 (0.021) |
−0.050** (0.022) |
0.003 (0.022) |
| Efficiency Domain | |||
| Medicare-Spending-per-Beneficiary Ratio | 0.00186*** (0.00050) |
−0.00269*** (0.00069) |
0.00087 (0.00074) |
p<0.05
p<0.01
These results report the coefficients and standard errors from 18 regressions: effect of decile improvement on TPS with respect to measure rate change from FY 2015 to FY 2016 when the hospitals are not integrated and not safety-net, the difference in effect when the hospitals are integrated and non-safety-net, and the difference in effect when the hospitals are not integrated and safety-net. Patient experience, clinical process, and mortality measures are reported as percentages, and higher scores indicate better performance. Lower values in Patient Safety Composite Score, CLABSI Score, and Medicare-Spending-per-Beneficiary Ratio indicate better quality.
The patterns across safety-net hospitals and non-safety-net hospitals are broadly consistent in that the interaction effects show that safety-net hospitals are generally not statistically significantly different from non safety-net hospitals (see Table 8). We find that safety-net hospitals had a stronger response to one patient experience measure and one clinical process measure as compared to non safety-net hospitals, and a stronger but worse performance on AMI mortality and Postoperative Urinary Catheter Removal measure.
Limitations
The analyses are limited by lack of information in two areas. We only have individual-level data on the measures for mortality in Michigan, so can only calculate the patient-level marginal future reimbursement for the three mortality measures. Fortunately, the one-decile improvement measures give a good sense of the distribution of incentives across hospitals (although not within hospitals). We also do not have information on the cost of modest improvements in any of the measures, either the level or their distributions. A full examination of whether hospitals improve their HVBP measures would not only include the financial incentives of improvement (as we did) but also the cost of improvement (which is unknown). We have no reason to believe that the actual costs are correlated with the incentives, meaning that our estimates are probably unbiased. Finally, the details of the HVBP program have changed every single year. Therefore, while our general theoretical points stand, the specifics of the estimates and distributions are specific to the years studied. We hope that our analyses will help CMS continue to improve their design of the HVBP program in the future.
7. Conclusion
Our study has produced a number of interesting methodological and policy-relevant findings. In the methodological area, we have three notable conclusions. First, we described how a hospital’s reimbursement from each Medicare patient consists not only of the payment for the index hospitalization (primarily the DRG payment), but also the marginal future reimbursement from the patient’s effect on quality and spending measures in the HVBP pay-for-performance program. Second, we show that these marginal future reimbursements vary both within hospital and across hospitals and that they sometimes, but not always, create incentives to improve. Third, we show that for many measures, hospitals with larger financial incentives did improve their performance more than hospitals with smaller financial incentives. This empirical result is robust to whether we also control for the marginal future incentives from other measures, implying that hospitals compartmentalize investments in quality improvement.
Although studies have documented the lack of significant improvements in overall average quality by hospitals participating in HVBP (Ryan et al., 2015; Figueroa et al., 2016), this is the first evaluation of the program to consider the distribution of incentives based on marginal improvements in performance. Our results are consistent with the prior findings in that overall changes in measures are often small or zero, yet we show that they are substantial for some hospitals, in part because of the wide variation in the distribution of the size of the incentives.
In the area of policy, we also have three noteworthy findings. First, the incentives in the HVBP program are complicated, but understanding them is essential for understanding how to modify and improve the program going forward. CMS may want to change the formulas to create positive incentives for a larger percentage of hospitals. Second, our results find that integrated hospitals are more responsive to the incentive for the efficiency measure (and other measures) than non-integrated hospitals. Integrated hospitals may be more efficient at improving quality and holding down costs post-discharge, and in the long run more hospitals may become more integrated. Third, our research also has implications for the broader literature on the value of information and the importance of health information technology. If a hospital knew — in real time — the marginal future reimbursement for an individual patient for specific measures, it could better optimize how to improve its bottom line while improving value of care.
Acknowledgments
Funding: This work was supported by the National Institute on Aging (P01-AG019783). Emmett Keeler and Elena Prager provided helpful conference discussions. We are grateful for comments by seminar participants at the London School of Economics, the University of Chicago, the University of Michigan, and ASHEcon.
Appendix Table 1.
Correlations of marginal incentives: the effect of a one-decile improvement on the Total Performance Score, for each measure using the national sample
| Nurse Communication |
Doctor Communication |
Hospital Staff Responsiveness |
Pain Management |
Medicine Communication |
|
|---|---|---|---|---|---|
| Patient Experience of Care Domain | |||||
| Nurse Communication | 1.00 | ||||
| Doctor Communication | 0.31 | 1.00 | |||
| Hospital Staff Responsiveness | 0.40 | 0.18 | 1.00 | ||
| Pain Management | 0.43 | 0.30 | 0.37 | 1.00 | |
| Medicine Communication | 0.42 | 0.26 | 0.34 | 0.39 | 1.00 |
| Hospital Cleanliness & Quietness | 0.23 | 0.10 | 0.18 | 0.24 | 0.20 |
| Discharge Information | 0.23 | 0.11 | 0.18 | 0.21 | 0.18 |
| Overall Hospital Rating | 0.32 | 0.13 | 0.21 | 0.30 | 0.25 |
| Clinical Process of Care Domain | |||||
| Prophylactic Antibiotic Selection | 0.04 | 0.04 | 0.04 | 0.03 | 0.02 |
| Urinary Catheter Removal | 0.01 | 0.01 | 0.04 | 0.01 | −0.01 |
| Beta Blocker During Perioperative Period | 0.03 | 0.04 | 0.05 | −0.03 | −0.01 |
| VTE Prophylaxis Within 24 Hours | 0.02 | 0.01 | 0.04 | 0.02 | 0.00 |
| Outcomes Domain | |||||
| AMI Survival Rate (1 – Mortality Rate) | −0.05 | −0.06 | −0.08 | −0.09 | −0.05 |
| HF Survival Rate (1 – Mortality Rate) | 0.02 | −0.07 | −0.03 | −0.07 | −0.01 |
| PN Survival Rate (1 – Mortality Rate) | −0.11 | −0.06 | −0.02 | −0.05 | −0.02 |
| Patient Safety Composite Score | −0.05 | −0.07 | −0.01 | −0.06 | −0.03 |
| CLABSI Score | 0.04 | −0.05 | −0.04 | −0.10 | −0.02 |
| Efficiency Domain | |||||
| Medicare-Spending-per-Beneficiary Ratio | 0.04 | 0.12 | 0.06 | 0.14 | 0.04 |
| Hospital Cleanliness & Quietness | Discharge Information | Overall Hospital Rating | |
|---|---|---|---|
| Patient Experience of Care Domain | |||
| Hospital Cleanliness & Quietness | 1.00 | ||
| Discharge Information | 0.08 | 1.00 | |
| Overall Hospital Rating | 0.10 | 0.21 | 1.00 |
| Clinical Process of Care Domain | |||
| Prophylactic Antibiotic Selection | 0.00 | 0.05 | 0.03 |
| Urinary Catheter Removal | 0.00 | 0.00 | 0.02 |
| Beta Blocker During Perioperative Period | −0.02 | −0.02 | −0.04 |
| VTE Prophylaxis Within 24 Hours | −0.01 | −0.01 | 0.01 |
| Outcomes Domain | |||
| AMI Survival Rate (1 – Mortality Rate) | −0.01 | −0.04 | −0.05 |
| HF Survival Rate (1 – Mortality Rate) | −0.04 | −0.03 | 0.01 |
| PN Survival Rate (1 – Mortality Rate) | −0.07 | −0.03 | 0.02 |
| Patient Safety Composite Score | 0.00 | 0.00 | 0.00 |
| CLABSI Score | 0.02 | 0.03 | −0.07 |
| Efficiency Domain | |||
| Medicare-Spending-per-Beneficiary Ratio | 0.01 | 0.07 | 0.05 |
| Prophylactic Antibiotic Selection | Urinary Catheter Removal | Beta Blocker During Perioperative Period | VTE Prophylaxis Within 24 Hours | |
|---|---|---|---|---|
| Clinical Process of Care Domain | ||||
| Prophylactic Antibiotic Selection | 1.00 | |||
| Urinary Catheter Removal | 0.19 | 1.00 | ||
| Beta Blocker During Perioperative Period | 0.20 | 0.30 | 1.00 | |
| VTE Prophylaxis Within 24 Hours | 0.19 | 0.22 | 0.20 | 1.00 |
| Outcomes Domain | ||||
| AMI Survival Rate (1 – Mortality Rate) | −0.06 | −0.03 | −0.02 | −0.08 |
| HF Survival Rate (1 – Mortality Rate) | −0.03 | −0.01 | 0.00 | −0.08 |
| PN Survival Rate (1 – Mortality Rate) | −0.06 | −0.04 | −0.04 | −0.07 |
| Patient Safety Composite Score | −0.04 | −0.03 | −0.03 | −0.04 |
| CLABSI Score | −0.02 | 0.00 | −0.01 | −0.07 |
| Efficiency Domain | ||||
| Medicare-Spending-per-Beneficiary Ratio | 0.04 | 0.04 | 0.04 | 0.01 |
| AMI Survival Rate (1 – Mortality Rate) | HF Survival Rate (1 – Mortality Rate) | PN Survival Rate (1 – Mortality Rate) | Patient Safety Composite Score | CLABSI Score | Medicare-Spending-per-Beneficiary Ratio | |
|---|---|---|---|---|---|---|
| Outcomes Domain | ||||||
| AMI Survival Rate (1 – Mortality Rate) | 1.00 | |||||
| HF Survival Rate (1 – Mortality Rate) | 0.09 | 1.00 | ||||
| PN Survival Rate (1 – Mortality Rate) | −0.06 | 0.05 | 1.00 | |||
| Patient Safety Composite Score | −0.07 | −0.02 | 0.21 | 1.00 | ||
| CLABSI Score | 0.17 | 0.02 | −0.19 | 0.04 | 1.00 | |
| Efficiency Domain | ||||||
| Medicare-Spending-per-Beneficiary Ratio | −0.16 | −0.12 | 0.00 | −0.04 | −0.18 | 1.00 |
Footnotes
Publisher's Disclaimer: This is a PDF file of an unedited manuscript that has been accepted for publication. As a service to our customers we are providing this early version of the manuscript. The manuscript will undergo copyediting, typesetting, and review of the resulting proof before it is published in its final citable form. Please note that during the production process errors may be discovered which could affect the content, and all legal disclaimers that apply to the journal pertain.
References
- Burwell SM. Setting value-based payment goals – HHS efforts to improve U.S. health care. New England Journal of Medicine. 2015;372(10):897–899. doi: 10.1056/NEJMp1500445. [DOI] [PubMed] [Google Scholar]
- Centers for Medicare & Medicaid Services. Frequently asked questions hospital value-based purchasing program 2012a [Google Scholar]
- Centers for Medicare & Medicaid Services, Federal Register. Medicare program; hospital inpatient prospective payment systems for acute care hospitals and the long-term care hospital prospective payment system and fiscal year 2013 rates; hospitals’ resident caps for graduate medical education payment purposes; quality reporting requirements for specific providers and for ambulatory surgical centers. Final Rule. 2012b;77:53257–53750. [PubMed] [Google Scholar]
- Centers for Medicare & Medicaid Services. Hospital value-based purchasing program fact sheet 2013a [Google Scholar]
- Centers for Medicare & Medicaid Services. National provider call: Hospital value-based purchasing 2013b [Google Scholar]
- Chatterjee P, Joynt KE. Do cardiology quality measures actually improve patient outcomes? Journal of the American Heart Association. 2014;3(1) doi: 10.1161/JAHA.113.000404. [DOI] [PMC free article] [PubMed] [Google Scholar]
- Chen C, Ackerly D. Beyond ACOs and bundled payments: Medicare’s shift toward accountability in fee-for-service. Journal of the American Medical Association. 2014;311(7):673–674. doi: 10.1001/jama.2014.11. [DOI] [PubMed] [Google Scholar]
- Das A, Norton EC, Miller DC, Chen LM. Spending in the post-acute care setting accounts for a sizeable portion of spending associated with a hospitalization episode. Journal of the American Medical Association Internal Medicine. 2016a;176(1):117–119. [Google Scholar]
- Das A, Norton EC, Miller DC, Ryan AM, Birkmeyer JD, Chen LM. Adding a spending metric to Medicare’s value-based purchasing program rewarded low-quality hospitals. Health Affairs. 2016b;35(5):898–906. doi: 10.1377/hlthaff.2015.1190. [DOI] [PMC free article] [PubMed] [Google Scholar]
- Figueroa JF, Tsugawa Y, Zheng J, Orav EJ, Jha AK. Association between the value-based purchasing pay for performance program and patient mortality in US hospitals: observational study. BMJ. 2016;353:i2214. doi: 10.1136/bmj.i2214. [DOI] [PMC free article] [PubMed] [Google Scholar]
- Fryer RG. Teacher incentives and student achievement: Evidence from New York City public schools. Journal of Labor Economics. 2013;31(2):373–407. [Google Scholar]
- Gilman M, Adams EK, Hockenberry JM, Wilson IB, Milstein AS, Becker ER. California safety-net hospitals likely to be penalized by ACA value, readmission, and meaningful-use programs. Health Affairs (Project Hope) 2014;33(8):1314–1322. doi: 10.1377/hlthaff.2014.0138. [DOI] [PubMed] [Google Scholar]
- Gilman M, Hockenberry JM, Adams EK, Milstein AS, Wilson IB, Becker ER. The financial effect of value-based purchasing and the hospital readmissions reduction program on safety-net hospitals in 2014: A cohort study. Annals of Internal Medicine. 2015;163(6):427–436. doi: 10.7326/M14-2813. [DOI] [PubMed] [Google Scholar]
- Jacob BA. Accountability, incentives and behavior: The impact of high-stakes testing in the Chicago Public Schools. Journal of Public Economics. 2005;89(5–6):761–796. [Google Scholar]
- Holmstrom B, Milgrom P. Multitask Principal-Agent Analyses: Incentive Contracts, Asset Ownership, and Job Design. Journal of Law, Economics & Organization. 1991;7(SI):24–52. [Google Scholar]
- Mohan A, Grant J, Batalden M, McCormick D. The health of safety net hospitals following Massachusetts health care reform; Changes in volume, revenue, costs, and operating margins from 2006 to 2009. International Journal of Health Services. 2013;43:321–335. doi: 10.2190/HS.43.2.h. [DOI] [PubMed] [Google Scholar]
- Neal D. Handbook of Economics of Education. Vol. 4. Elsevier; North Holland: 2011. The Design of Performance Pay in Education. [Google Scholar]
- Quality Net. Medicare spending per beneficiary (MSPB) measure overview 2015 [Google Scholar]
- Ryan AM, Burgess JF, Jr, Pesko MF, Borden WB, Dimick JB. The early effects of Medicare’s mandatory hospital pay-for-performance program. Health Services Research. 2015;50(1):81–97. doi: 10.1111/1475-6773.12206. [DOI] [PMC free article] [PubMed] [Google Scholar]