Abstract
Study Design
Cross-sectional.
Objective
To assess the distribution of the ultra-short time-to-echo (UTE) Disc Sign (UDS) and its association with disc degeneration, other MRI phenotypes, pain and disability profiles.
Summary of Background Data
Disc degeneration has been conventionally assessed by T2-weighted (T2W) signal intensity on MRI; however, its clinical utility has been questionable. UTE MRI assesses short T2 components. The authors have identified a new imaging biomarker on UTE – the UDS.
Methods
108 subjects were recruited. T2W MRI assessed disc degeneration and other phenotypes, and T1-rho MRI values represented quantitative proteoglycan disc profiles of L1-S1. UDS was detected on UTE (i.e. hyper-/hypo-intense disc band). A UDS score (cumulative number of UDS levels) and T2W summated lumbar degenerated scores (cumulative disc degeneration score) were assessed. Subject demographics, chronic low back pain (LBP) and disability profiles (Oswestry Disability Index: ODI) were obtained.
Results
UDS was noted in 39.8% subjects, 61.4% occurred at the lower lumbar spine and 39.5% had multi-level UDS. UDS subjects had significantly greater severity and extent of disc degeneration, and Modic changes (p<0.05). By disc levels, a higher prevalence of disc degeneration/displacememt, Modic changes and spondylolisthesis were noted in UDS discs than non-UDS discs (p<0.05). T1-rho values were also lower in UDS discs (p=0.022). The majority of UDS could not be detected on T2W. The UDS score significantly correlated with worse ODI scores (r=0.311; p=0.001), whereas T2W cumulative disc degeneration score did not (r=0.13; p=0.19). LBP subjects exhibited more multi-level UDS (p<0.015) but not on T2W MRI (p=0.53). The UDS score was significantly related to LBP (p=0.009), whereas T2W cumulative disc degeneration score was not (p=0.127).
Conclusions
This is the first study to report “UDS” in humans. UDS is a novel imaging biomarker that is highly associated with degenerative spine changes, chronic LBP and disability than conventional T2W MRI.
Keywords: disc, spine, degeneration, imaging, ultra-short, UTE, UDS, T1-rho, MRI, biomarker, pain, disability
INTRODUCTION
Low back pain (LBP) is the world’s most disabling condition.1 Such pain is associated with tremendous socioeconomic and health-care consequences.2–4 Although LBP is a multifactorial complex disorder, several studies have noted lumbar disc degeneration as a risk factor.5–9
Disc degeneration is histologically characterized as loss of water and proteoglycan content.10,11,12 Traditionally, for over three decades, assessment of disc degeneration has been performed by T2-weighted (T2W) magnetic resonance imaging (MRI), which theoretically can detect water content (Figure 1A).3,6,13–18 A decrease in disc hydration has conventionally been regarded as a degenerative disc change (e.g. black disc). However, disc degeneration based on “conventional” T2W MRI has a questionable association with LBP.14,19–21 This current imaging is not highly sensitive and reliable, and as such may not be useful to “predict” future LBP episodes secondary to disc degeneration.14,19–21 This may be attributed to the long T2 component, whereby subtle tissue changes are missed; thereby, rendering this imaging modality not ideal to identify clinically-relevant imaging changes to guide clinical decision-making.15,22 Such shortcomings may provide a rationale as to why it is common to find symptomatic individuals with seemingly normal (i.e. non-degenerated) discs and asymptomatic individuals with degenerative disc changes on conventional MRI.20,21 This may account as to why proper diagnosis of LBP and identification of pain mechanisms are questionable, outcomes of LBP treatments are often tenuous and have been criticized, and prognostication potential of various pain and disability dimensions as well as management options have drawbacks.15,23–25 Thus, such limitations have led to increased health-care costs with often unsatisfactory patient outcomes.4 As such, identifying the source and natural history of the clinically relevant degenerative disc changes is imperative to help guide management and treatment options.
Figure 1.
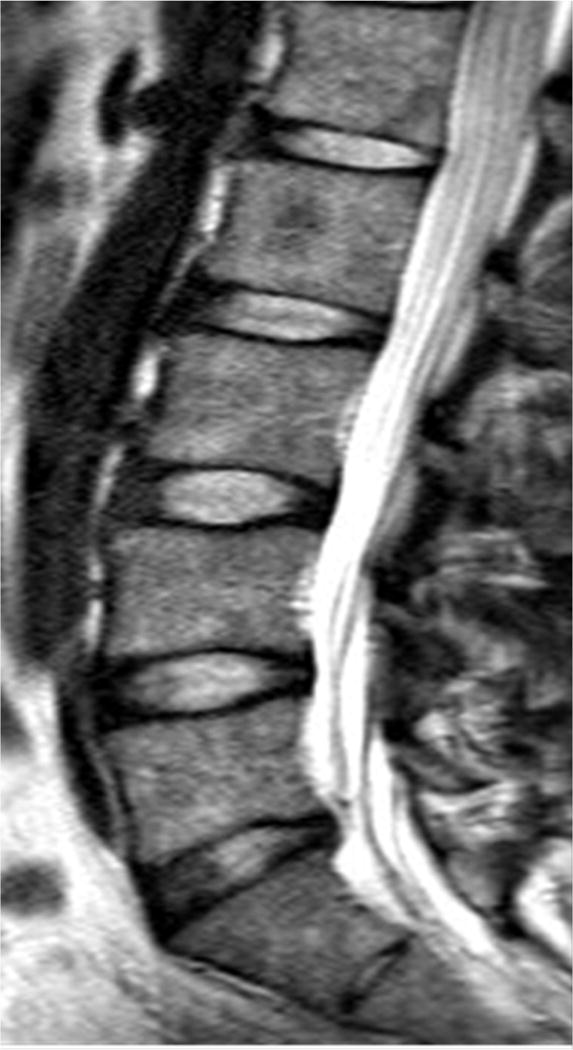
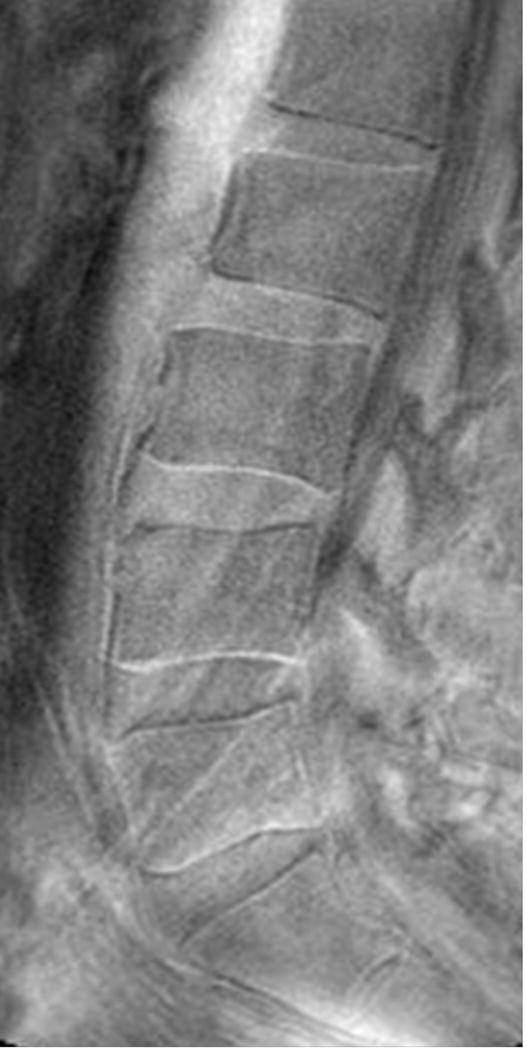
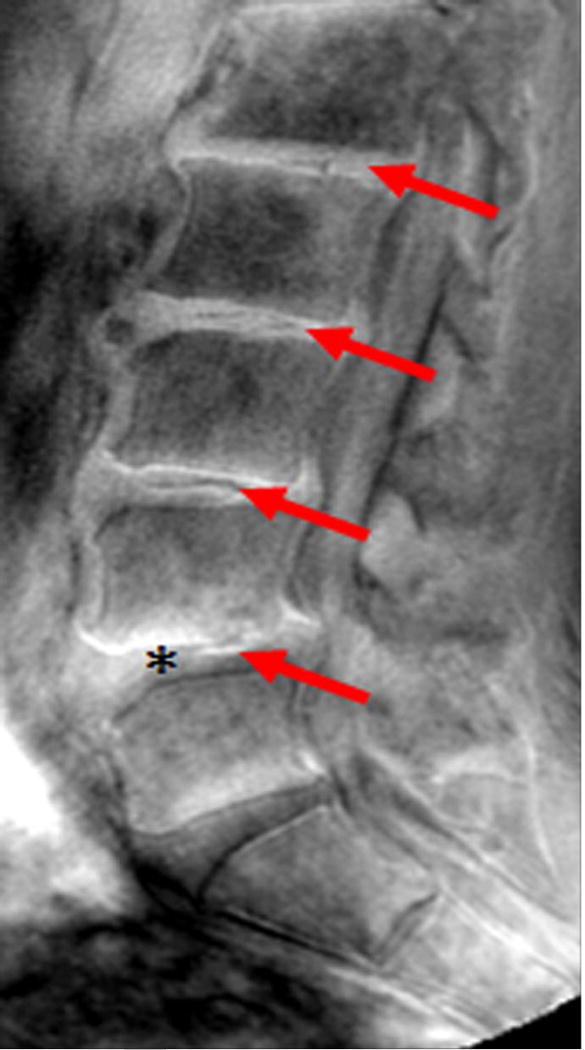
Sagittal magnetic resonance imaging (MRI) of the lumbar spine. (A) T2-weighted and (B) ultra-short time-to-echo (UTE) MRI of the same subject. Note, UTE does not demonstrate UTE Disc Sign (UDS) at any level. (C) UTE MRI of a different subject illustrating multi-level hypointense (red arrow) and hyperintense UDS (asterisk).
Due to the limitations with “conventional” T2W MRI in assessing the integrity of the lumbar discs and their clinical relevance, more sensitive imaging has been developed, such as T1-rho MRI, to best assess the biochemical constitution of the disc, which can quantitatively assess proteoglycan content.26,27 However, the clinical relevance of such imaging with pain remains inconclusive.
Ultra-short time-to-echo (UTE) MRI (Figure 1B) assesses MRI signal from short T2 components that are not detected on conventional T2W MRI. This is accomplished by combining half duration radiofrequency excitation pulses and radial sampling of the signal to reduce the time-to-echo below 1ms.28 UTE MRI has been applied to image short-T2 tissues, such as cortical bone, tendons and cartilage. Although the use of UTE to assess the disc endplate has gathered considerable attention recently,29,30 it has never been reported to assess disc changes and their clinical relevance. Utilizing UTE, our group has identified a new disc phenotype, which we have called the “UTE Disc Sign (UDS)” (Figure 1C). The UDS has been defined as a hyper- or hypo-intense band located within the disc (Figure 1C). As such, the following study reports for the first time the prevalence and distribution of the UDS in the lumbar spine, and its association with disc degeneration and associated MRI phenotypes (e.g. disc displacement, Modic changes) on T2W and T1-rho MRI in human subjects. In addition, we further assessed the association of the UDS with LBP and disability in comparison to conventional T2W MRI.
METHODS
Study Population
This was a cross-sectional study that consisted of 108 (n=540 discs) Southern Chinese volunteers (mean age: 52 years; 50% males), which were recruited from the Hong Kong Disc Degeneration Cohort (approximately 3,000 probands).5,7,8,22,31–37 This cohort was a population-based study whose subjects were consecutively enrolled over 15 years ago and were found to be representative of the Hong Kong population. Details of this cohort have been reported elsewhere.5,7,8,22,31–37 All subjects at baseline intake underwent T2W MRI evaluation, clinical profiling, blood assessment and environmental/lifestyle factors were also collected. Baseline imaging assessment was performed of all subjects to note the presence of various spinal phenotypes thoughout the whole spine. For the current study, following institutional review board approval, the subjects were recruited from this Hong Kong Disc Degeneration Cohort who at baseline imaging exhibited what were regarded at that time as endplate findings at any level. Subjects were randomly recruited from that pool of subjects, irrespective of demographics and the presence of pain, that exhibited such imaging phenotyping and were invited to be re-imaged via more novel imaging approaches (e.g. UTE, T1-rho MRI). As such, 108 subjects were invited to be re-imaged for this study. Available funding only allowed us to re-image 108 subjects. All subjects were consecutively enrolled and no subject who was asked to participate rejected. All subjects provided written informed consent to participate in the current study. Following, all 108 subjects were rescanned using T2W MRI, and also concurrently underwent UTE and T1-rho MRI scanning. At the same time of imaging, the clinical pain and disability profiles were assessed of each subject. For the analyses of the current study, none of the imaging phenotyping and clinical profile parameters of the subjects’ baseline data when they were initially recruited in the Hong Kong Disc Degeneration Cohort was used.
MRI Parameters
All subjects underwent imaging of the lumbar spine (i.e. L1-S1) via a 3T MRI scanner (Achieva, Philips Healthcare, Best, The Netherlands). Sagittal T2W MRI was acquired using a standard spin-echo imaging sequence with the following parameters: field of view (FoV) =200mm, slide thickness=2.4mm, acquisition matrix=400×232, and time echo time/repetition time (TE/TR)=120ms/2000ms. Sagittal T1-rho MRI were acquired using gradient-echo sequence with fat suppression using the following parameters: echo/repetition time = 2.3/4.7ms, flip angle = 30°, field-of-view =285×200mm2, slice thickness=10mm, acquisition matrix=385×270, and four spin-lock durations (TSL: 1, 25, 50, 75ms) with spin-lock amplitude corresponding to spin-lock frequency of 400 Hz. UTE MRI was acquired via the same 3T MRI scanner. A 3D UTE shifting TE phase-encoded stack of spirals trajectory was used. The UTE imaging parameters were as follows: FOV=200mm, TR=4.8ms, TE =140ms, and acquisition voxel size =0.5×0.5mm2.
MRI Assessment
The T2W MRI imaging analysis for lumbar intervertebral discs from L1/L2 to L5/S1 (n=540) was carried out by 2 independent rators blinded to the clinical information. Disc degeneration scores were assessed based on Schneiderman et al18 grading system, which was as follows: Grade 0: normal, well hydrated hyperintense disc with normal disc space height; Grade 1: slight decrease in signal intensity in the nucleus pulposus; Grade 2: generalized hypointense nucleus pulposus (i.e. black disc) with disc space height maintained; Grade 3: generalized hypointense nucleus pulposus (i.e. black disc) with disc space narrowing. A cumulative disc degeneration score was obtained from a summation of individual discs scored from L1 to S1 via the Schneiderman et al18 method. The potential range of the cumulative disc degeneration score ranged from 0 to 15. The clinical relevance of this method has been illustrated in various reports to be related to LBP.8,9,31 Any subject having a score of 6 or greater was regarded as having moderate/severe lumbar disc degeneration.8,9,31 Disc displacement was noted as either a bulge, extrusion or sequestration.38 Endplate irregularities/abnormalities/defects (e.g. Schmorl’s nodes) were noted if there was any deviation from the usual concavity of normal disc geometry as described by Mok et al35 and Samartzis et al.37 Modic changes were noted if there was any hyperintense/hypointense subchondral bone marrow and endplate lesion.7,33 The overall presence of Modic changes was only noted since T1W MRI was not available. High intensity zones (HIZ) were noted if there was any hyperintense region noted throughout the disc material proper.16 The presence of spondylolisthesis was noted if there was any forward or backward translation of the any vertebral body in relation to the adjacent vertebral segment.39,40 Previous reliability assessment of these MRI phenotypes by the investigators was noted as good to high inter- and intra-rator reliability (k>0.80).41
T1-rho values were calculated on a pixel-by-pixel basis by a linear regression of intensity data to an exponential decay function.42 Values were used to create 3-dimensional spatial maps of T1 rho using MATLAB (Mathworks, Cupertino, CA). Volume of interest of the disc was manually drawn by two independent investigators by MRICRON and the mean T1 rho value was computed within that region. Inter- and intra-rator reliability was also previously reported for T1-rho assessment of the disc.27,42 T1-rho was utilized in the context of the current study to assess the quantitative proteoglycan changes at each disc.
UDS was detected on UTE MRI, which was defined as a hyper- or hypointense band across the disc (Figure 1C). Two different individuals that those that assessed the other spinal phenotypes independently assessed the UTE MRIs to identify the UDS. Inter- and intra-rator reliability was independently assessed with regards to UDS identification. A cumulative “UDS Score” was obtained based on the summation of UDS discs from L1/L2 to L5/S1, representing a potential score ranging from 0 to 5.
Clinical Assessment
Subject demographics were noted, such as age (years), gender, body height (meters) and weight (kilograms), and body mass index (BMI: kg/m2). Low back pain occurring every day (chronic) during the past year and Oswestry Disability Index (ODI) were obtained of all subjects.
Statistical Analyses
SPSS version 22 software (IBM, Chicago, IL) was utilized for all statistical analyses. Descriptive and frequency statistics were performed to assess the various data parameters. Mean, standard deviations (SD±) and ranges were obtained of applicable data points. Non-parametric tests were used to assess continuous variables. Chi-square and Fisher’s Exact Test were utilized, where appropriate, to assess categorical data. For inter- and intra-rator reliability testing of the UDS, the strength was noted as follows based on kappa testing: excellent (k>0.90), good, (k>0.80), fair (k>70) and poor (k<0.60).43,44 A p-value of <0.05 was considered as the threshold for statistical significance.
RESULTS
One hundred eight subjects were assessed (54 males, 54 females), with a mean age of 52 years (range: 22–67, SD:7.7 years). The mean BMI was 24.6 kg/m2 (range: 18.13–39.5, SD:3.5 kg/m2). Overall, 88 subjects (81.5%) had some form of lumbar disc degeneration and the mean cumulative disc degeneration score on T2W MRI was 7.6 (range: 2.0–12.0; SD:2.0). There were 91 subjects (84.2%) with disc displacement, 63 (58.3%) with HIZ, 85 (78.7%) with endplate abnormalities, 57 (52.8%) with Modic changes, and 6 (5.6%) with spondylolisthesis.
Intervertebral disc-specific
Excellent inter and intra-rator reliabilities were noted in the identification of the UDS phenotype (k=1.00). Out of 540 intervertebral lumbar disc segments, UDS was noted in 71 segments (13.1%), whereas it was not noted in 470 segments (86.8%) (p<0.001). There was a higher prevalence of disc degeneration (p<0.001), disc bulges/extrusions (p<0.001), Modic changes (p<0.001) and spondylolisthesis (p=0.007) in UDS discs than non-UDS discs (Table 1). Additional associations with other MRI phenotypes are noted in Table 1.
Table 1.
The association of the ultra-short time-to-echo disc sign (UDS) with various imaging phenotypes on magnetic resonance imaging (MRI).
| Presence of UDS (Intervertebral Disc-Specific) | |||
|---|---|---|---|
| MRI Variables | No (n = 469, 86.8%) n (%) |
Yes (n=71, 13.2%) n (%) |
p-value |
| Disc degeneration | 219 (46.6%) | 60 (84.5%) | < 0.001* |
| Disc displacement‡ | 200 (42.6%) | 59 (83.1%) | <0.001* |
| High-intensity zones | 118 (25.1%) | 25 (35.2%) | 0.08 |
| Endplate abnormalities | 147 (31.3%) | 27 (38.0%) | 0.22 |
| Modic changes | 67 (14.3%) | 34 (47.8%) | <0.001* |
| Spondylolisthesis | 3 (0.63%) | 4 (5.63%) | 0.007* |
Note, the analysis entails the assessment of 540 lumbar intervertebral discs representing 108 subjects.
Subjects with disc bulge or extrusion
Denotes statistical significance (p<0.05)
Subject-specific
Based on overall subjects, the UDS was noted in 43 individuals (39.8%), whereas 65 (60.2 %) did not have signs of this phenotype. Of all subjects exhibiting the UDS, 62.7% involved the lower lumbar levels from L3/L4 to L5/S1. Multi-level UDS was present in 39.5% of the subjects. The mean cumulative UTE score in our current series was 0.6 (range: 0–5; SD:1.02). Various anthropometric and environmental factors stratified according to the presence of UDS are illustrated in Table 2. No statistically significant difference was noted between the two groups with respect to any of these variables (p>0.05) except age which was significantly higher in individuals with UDS (p=0.001) and may be attributed to more disc changes as often seen as a function of age.
Table 2.
The association of the ultra-short time-to-echo disc sign (UDS) with various anthropometric and environmental factors.
| Presence of UDS (Subject-Specific) | |||
|---|---|---|---|
| Variables | No (n = 65, 60.2%) |
Yes (n=43 39.8%) |
p-value |
| Age (years) mean (range,SD) |
50.0 (22–67, 8.2) | 55.02 (43–66, 5.8) | 0.001* |
| Weight (kg) mean (range,SD) |
65.2 (43.0–98.6, 12.5) | 67.3 (43.5–95.5, 13.3) | 0.41 |
| Height (cm) mean (range,SD) |
163.0 (144–181.0, 8.5) | 163.9 (141–182.0, 10.7) | 0.65 |
| BMI (kg/m2) mean (range, SD) |
24.4 (18.1–39.5, 3.8) | 24.8 (18.75–29.8, 2.9) | 0.5 |
| Smoking (Pack/year) mean (range, SD) |
3.0 (0–40, 8) | 2.8 (0–30,7.8) | 0.91 |
| Sex (Males) n (%) |
31 (47.6%) | 22 (51.1%) | 0.58 |
| Sports activity n (%) |
21 (32.3%) | 12 (27.9%) | 0.16 |
Note, the analysis represents 108 subjects.
SD: standard deviation, kg: kilograms, m: meters, BMI: body mass index, %: percentage
The associations of various MRI phenotypes to the presence of UDS are illustrated in Table 3. Overall, 40 UDS subjects (93%) had moderate/severe form of lumbar disc degeneration compared to 47 non-UDS subjects (72.3%; p<0.01). Multi-level disc degeneration and Modic changes were more prevalent in UDS subjects compared to non-UDS individuals (83.7% vs. 56.9%; p=0.01 and 67.4 % vs. 43%; p=0.01, respectively). No other MRI lumbar phenotypes statistically differed between the groups (p>0.05). The mean cumulative disc degeneration score on T2W MRI from L1/L2 to L5/S1 was 8.5 (range: 5–12; SD:1.7) and 7.0 (range: 2 to 10; SD:1.9) for UDS and non-UDS individuals, respectively (p<0.001) (Table 4). The mean cumulative T1-rho value was 63.5 (range: 43.3–122.4; SD: 14.8) and 70.8 (range:47.5–128.6; SD:15.8) for UDS and non-UDS individuals (p=0.022), noting lower proteoglycan disc content in UDS subjects (Table 4). Approximately, 64.8% of UDS could not be detected on T2W MRI.
Table 3.
The association of the ultra-short time-to-echo disc sign (UDS) with various imaging phenotypes on magnetic resonance imaging (MRI).
| Presence of UDS (Subject-Specific) | |||
|---|---|---|---|
| MRI variables | No (n = 65, 60.2%) n (%) |
Yes (n=43, 39.8%) n (%) |
p-value |
| Disc degeneration† | 47 (72.3%) | 40 (93.0%) | 0.01* |
| Multi-level disc degeneration | 37 (56.9%) | 36 (83.7%) | 0.01* |
| Disc displacement‡ | 52 (80.0%) | 40 (93.0%) | 0.26 |
| High-intensity zones | 36 (55.3%) | 27 (62.7%) | 0.55 |
| Endplate abnormalities | 51 (78.4%) | 33 (76.7%) | 0.81 |
| Modic changes | 28 (43.0%) | 29 (67.4%) | 0.01* |
| Spondylolisthesis | 2 (3.07%) | 4 (9.3%) | 0.21 |
Note, the analysis represents 108 subjects.
Subjects with a cumulative disc degeneration score from L1/2 to L5/S1 greater than 6.
Subjects with disc bulge or extrusion
Denotes statistical significance (p<0.05)
Table 4.
The association of the ultra-short time-to-echo disc sign (UDS) with disc degeneration on traditional T2-weighted and T1-rho magnetic resonance imaging (MRI).
| Presence of UDS (Subject-Specific) | |||
|---|---|---|---|
| MRI Variables | No (n = 65, 60.2%) mean (range,SD) |
Yes (n=43, 39.8%) mean (range,SD) |
p-value |
| T2-weighted Disc Degeneration Score† |
7.0 (2–10, 1.9) | 8.5 (5–12, 1.7) | <0.001* |
| T1-rho Value (ms) | 70.8 (47.5–128.6, 15.8) | 63.5 (43.3–122.4, 14.8) | 0.022* |
Note, the analysis represents 108 subjects.
SD: standard deviation, m/s:
Cumulative score that represents summated individual disc scores from L1/2 to L5/S1.
Denotes statistical significance (p<0.05)
Clinical profile
Clinical profile was available for 102 subjects, 66 (64.7%) had no chronic LBP (Figure 2AB). In individuals with chronic LBP (n=36, 35.2%), 52.7 % had no UDS, 16.6% had single-level UDS and 30.5% had multi-level UDS (i.e. ≥2 levels) (p=0.015) (Figure 3AB). In contrast, there were no (11.1%), single-(13.8%) and multi-level (75 %) disc degeneration findings on T2W MRI in relation to chronic LBP (p=0.53). Cumulative UDS Score was significantly associated with chronic LBP (p=0.009), whereas cumulative disc degeneration score on T2W MRI did not show any association with pain (p=0.127) (Table 5). In addition, cumulative UDS Score on UTE (r=0.311, p=0.001) was positively and significantly correlated to overall ODI score than cumulative disc degeneration score on conventional T2W MRI (r=0.134, p=0.19).
Figure 2.
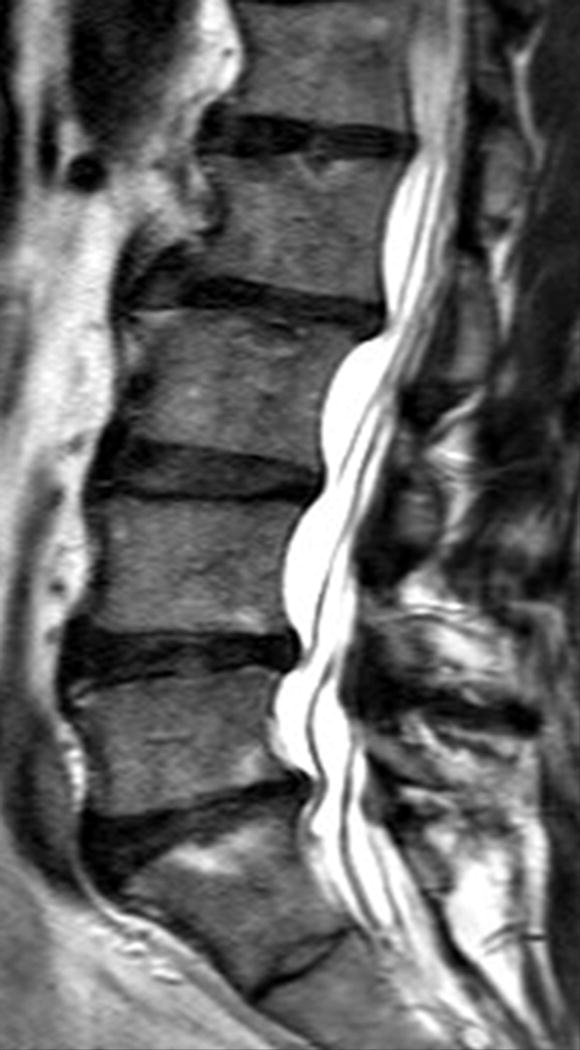
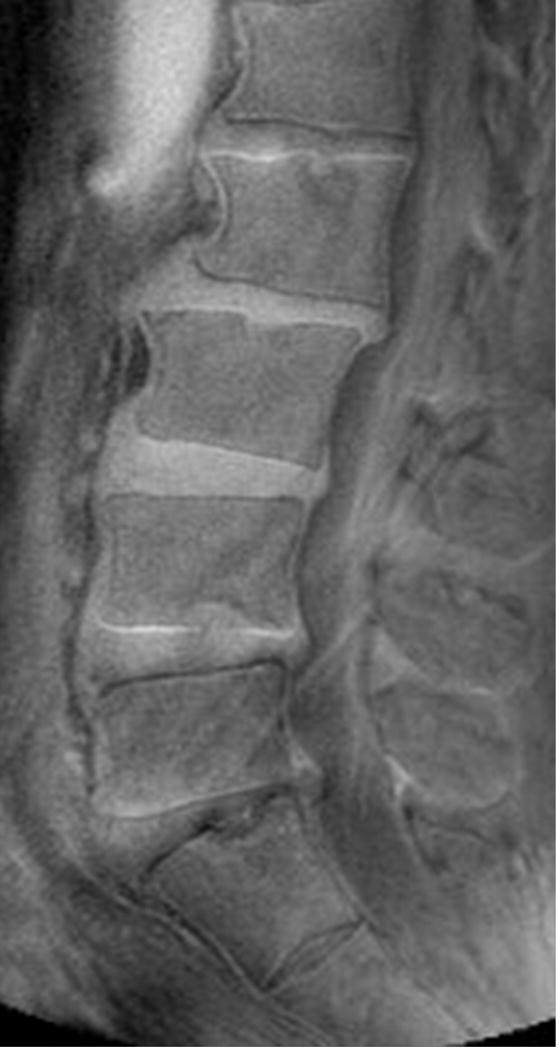
Sagittal magnetic resonance imaging (MRI) of the lumbar spine of a subject with no chronic low back pain. (A) T2-weighted MRI noting multi-level disc degeneration and Modic changes. (B) Ultra-short time-to-echo (UTE) MRI noting no UTE Disc Sign (UDS).
Figure 3.
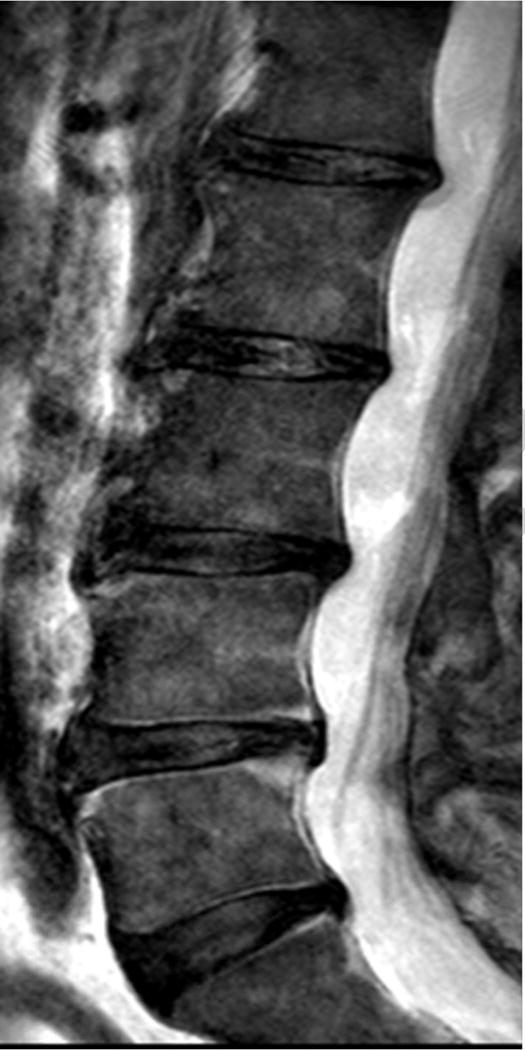
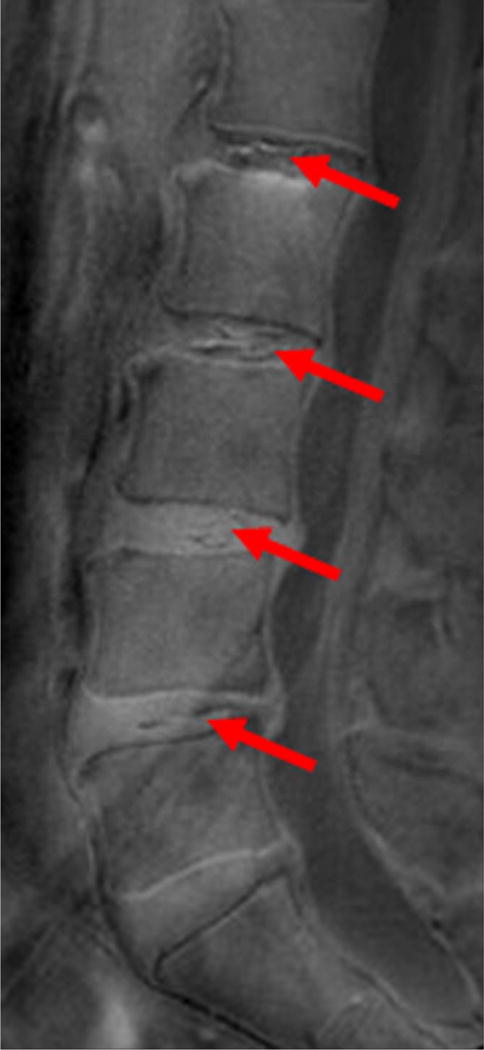
Sagittal magnetic resonance imaging (MRI) of the lumbar spine of a subject with chronic low back pain and disability. (A) T2-weighted MRI noting multi-level disc degeneration and Modic changes. (B) Ultra-short time-to-echo (UTE) MRI noting multilevel UTE Disc Sign (UDS), noted by red arrows.
Table 5.
The association of the presence of chronic low back pain with cumulative ultra-short time-to-echo disc sign (UDS) score on UTE and the cumulative disc degeneration score on T2-weighted magnetic resonance imaging (MRI).
| Presence of Chronic Low Back Pain
| |||
|---|---|---|---|
| MRI Cumulative Scores | No (n = 66, 64.7%) mean (range,SD) |
Yes (n=36, 35.2%) mean (range,SD) |
p-value |
| UDS Score | 0.5 (0–3, 0.7) | 1.05 (0–5, 1.4) | 0.009* |
| T2-weighted Disc Degeneration Score |
7.5 (3–10, 1.8) | 8.1 (4–12, 1.9) | 0.12 |
Note, the analysis represents 102 subjects. Cumulative scores represent summated individual disc scores from L1/2 to L5/S1.
SD: standard deviation
Denotes statistical significance (p<0.05)
DISCUSSION
This study was the first in humans to report the novel observation of the “UTE disc sign” (UDS) of the lumbar spine. The UDS was found to have excellent inter- and intra-rator reliability. The UDS was noted in 39.8% of the subjects, mainly occurring in the lower lumbar spine (i.e. L3/L4 to L5/S1) and significantly associated with chronic LBP and disability in comparison to various degenerative phenotypes based on conventional T2W MRI. Moreover, quantitative proteoglycan profiling based on T1-rho MRI noted significantly less proteoglycan content, a hallmark of disc degeneration, among individuals with UDS. In addition, the “UDS Score” was shown to be more clinically relevant than traditional disc degeneration scoring methods, increasing the likelihood of chronic LBP and being associated with disability. Furthermore, approximately 64.8% of UDS was not detected on T2W MRI, which implies that UDS is a separate imaging phenotype that warrants specific study.
Changes of the intervertebral disc can lead to discogenic (i.e. pain arising in the disc) and/or vertebrogenic (i.e. pain arising from the endplate/vertebra) LBP, and secondary changes at the motion segment (e.g. loss of disc hydration and height loss, osteophytes) that can affect biomechanics and can potentially lead to nerve root/spinal cord compression, and negatively affect spinal stability and function, which may necessitate treatment.45 Biological therapeutics (e.g. stem cells, growth factors) have been developed to help regenerate or halt degeneration of a disc.46 Also, being able to identify adjacent discs susceptible to degeneration/disease following a fusion or arthroplasty procedure is imperative. However, the limitations of conventional MRI, being not able to properly identify the clinically relevant and problematic disc, is a challenge, which may lead to undesirable outcomes.46 Furthermore, previous methods to identify symptomatic discs (e.g. discography) have also fallen out of favor since such procedures may risk progressive disc degeneration47 and future pain development.48 Surgery and other conservative methods (e.g. medication, injections, physiotherapy) also exist but their outcomes are often tenuous, most likely because decision-making has relied on conventional MRI.3,23 In response to this, novel imaging (e.g. T1-rho) has been developed that has aimed to provide a more sensitive snapshot of early disc changes as well as to identify “clinically relevant” disc alterations in hopes of identifying problematic discs to assist in patient selection and management.15,42,49,50 However, such imaging often has limitations as it can be very time consuming for a busy clinician, costly, and possess suboptimal reliability.15 As such, it is imperative to identify more user friendly, clinically relevant imaging that can shed light as to which discs are problematic (i.e. degenerated, painful) and have potential to “predict” the development and severity of LBP to assist in clinical decision-making, tailored treatment and improve patient outcomes.
Our study brings to the forefront an easily identifiable, simple, novel imaging biomarker – the UDS – that is not only associated with more degenerative disc findings but whereby the majority of subjects that possess this sign have LBP in comparison to conventional T2W MRI. Histologically, we do not understand what the UDS truly represents. We theorize it could represent disc re-arrangement/deformation, masked signs of inflammation, free-floating cartilaginous endplate breaks that may be informative of endplate damage/pain generation, and/or a time imprint of key disc changes and active pain generation. However, currently, we do not know whether the UDS is a clinically relevant imaging sign that may contribute to future degenerative disc and spine changes, predict the development of future LBP and pain severity, and if it is a distinct entity or more commonly noted among individuals that seek medical consultation. Nonetheless, UTE MRI for the lumbar spine can be performed at any MRI center and the scanning time lasts less than 20 minutes.
As with any clinical study, our study has some inherent limitations. For one, our cross-sectional study consists of 108 individuals, whereby larger-sized studies are naturally more preferable. However, our report presents the first to raise awareness of the UDS as a unique imaging biomarker, which we hope would contribute to future platforms of research and prospective studies to determine predictive utility. In line with that, histological research platforms can also be designed and pursued to have a better understanding as to what the UDS and its subtypes truly represent. Although we defined UDS as both hyper- and hypo-intense bands of the disc, larger studies in future can possess the sufficient power to further stratify the different types of UDS and further assess their clinical relevance. Furthermore, the generalizability of our findings to other ethnic groups has yet to be determined. However, we hope that our study would provide the foundation for further assessment in different populations and ethnic groups.
CONCLUSIONS
Our study is the first to report a novel, reliable and simple MRI biomarker, the UDS, found in humans to assess the intervertebral lumbar discs which may have immense clinical implications. The UDS was found to be related to degenerative spine changes, LBP and disability in comparison to the traditional T2W MRI grading schemes. The UDS may serve as a new imaging phenotype that may have potential implications in diagnostic, therapeutic and prognostic platforms in patients presenting with LBP or possibly be able to predict the development of pain. The UDS may also shed light upon the pathomechanism of disc changes; however, further study to determine its true role and representation must be addressed. Larger, prospective and multicenter studies are needed to further validate our findings, and assess the utility of the UDS on different clinical and research platforms.
Acknowledgments
The device(s)/drug(s) is/are FDA-approved or approved by corresponding national agency for this indication.
The Hong Kong Theme-Based Research Scheme (T12-708/12N) and the Hong Kong Research Grants Council (777111) grant funds were received in support of this work.
Relevant financial activities outside the submitted work: board membership, payment for lecture, stocks.
References
- 1.DALYs GBD, Collaborators H, Murray CJ, et al. Global, regional, and national disability-adjusted life years (DALYs) for 306 diseases and injuries and healthy life expectancy (HALE) for 188 countries, 1990–2013: quantifying the epidemiological transition. Lancet. 2015;386:2145–2191. doi: 10.1016/S0140-6736(15)61340-X. [DOI] [PMC free article] [PubMed] [Google Scholar]
- 2.Andersson GB. Epidemiological features of chronic low-back pain. Lancet. 1999;354:581–585. doi: 10.1016/S0140-6736(99)01312-4. [DOI] [PubMed] [Google Scholar]
- 3.Karppinen J, Shen FH, Luk KD, Andersson GB, Cheung KM, Samartzis D. Management of degenerative disk disease and chronic low back pain. Orthop Clin North Am. 2011;42:513–528, viii. doi: 10.1016/j.ocl.2011.07.009. [DOI] [PubMed] [Google Scholar]
- 4.Dagenais S, Caro J, Haldeman S. A systematic review of low back pain cost of illness studies in the United States and internationally. Spine J. 2008;8:8–20. doi: 10.1016/j.spinee.2007.10.005. [DOI] [PubMed] [Google Scholar]
- 5.Cheung KM, Karppinen J, Chan D, et al. Prevalence and pattern of lumbar magnetic resonance imaging changes in a population study of one thousand forty-three individuals. Spine (Phila Pa 1976) 2009;34:934–940. doi: 10.1097/BRS.0b013e3181a01b3f. [DOI] [PubMed] [Google Scholar]
- 6.de Schepper EI, Damen J, van Meurs JB, et al. The association between lumbar disc degeneration and low back pain: the influence of age, gender, and individual radiographic features. Spine (Phila Pa 1976) 2010;35:531–536. doi: 10.1097/BRS.0b013e3181aa5b33. [DOI] [PubMed] [Google Scholar]
- 7.Mok FP, Samartzis D, Karppinen J, Fong DY, Luk KD, Cheung KM. Modic changes of the lumbar spine: prevalence, risk factors, and association with disc degeneration and low back pain in a large-scale population-based cohort. Spine J. 2016;16:32–41. doi: 10.1016/j.spinee.2015.09.060. [DOI] [PubMed] [Google Scholar]
- 8.Samartzis D, Karppinen J, Mok F, Fong DY, Luk KD, Cheung KM. A population-based study of juvenile disc degeneration and its association with overweight and obesity, low back pain, and diminished functional status. J Bone Joint Surg Am. 2011;93:662–670. doi: 10.2106/JBJS.I.01568. [DOI] [PubMed] [Google Scholar]
- 9.Takatalo J, Karppinen J, Niinimaki J, et al. Does lumbar disc degeneration on MRI associate with low back symptom severity in young Finnish adults? Spine (Phila Pa 1976) 2011;36:2180–2189. doi: 10.1097/BRS.0b013e3182077122. [DOI] [PubMed] [Google Scholar]
- 10.Cassinelli EH, Hall RA, Kang JD. Biochemistry of intervertebral disc degeneration and the potential for gene therapy applications. Spine J. 2001;1:205–214. doi: 10.1016/s1529-9430(01)00021-3. [DOI] [PubMed] [Google Scholar]
- 11.Urban JP, McMullin JF. Swelling pressure of the lumbar intervertebral discs: influence of age, spinal level, composition, and degeneration. Spine. 1988;13:179–187. doi: 10.1097/00007632-198802000-00009. [DOI] [PubMed] [Google Scholar]
- 12.Adams MA, Roughley PJ. What is intervertebral disc degeneration, and what causes it? Spine (Phila Pa 1976) 2006;31:2151–2161. doi: 10.1097/01.brs.0000231761.73859.2c. [DOI] [PubMed] [Google Scholar]
- 13.Eskola PJ, Mannikko M, Samartzis D, Karppinen J. Genome-wide association studies of lumbar disc degeneration–are we there yet? Spine J. 2014;14:479–482. doi: 10.1016/j.spinee.2013.07.437. [DOI] [PubMed] [Google Scholar]
- 14.Jensen MC, Brant-Zawadzki MN, Obuchowski N, Modic MT, Malkasian D, Ross JS. Magnetic resonance imaging of the lumbar spine in people without back pain. N Engl J Med. 1994;331:69–73. doi: 10.1056/NEJM199407143310201. [DOI] [PubMed] [Google Scholar]
- 15.Samartzis D, Borthakur A, Belfer I, et al. Novel diagnostic and prognostic methods for disc degeneration and low back pain. Spine J. 2015;15:1919–1932. doi: 10.1016/j.spinee.2014.09.010. [DOI] [PMC free article] [PubMed] [Google Scholar]
- 16.Aprill C, Bogduk N. High-intensity zone: a diagnostic sign of painful lumbar disc on magnetic resonance imaging. Br J Radiol. 1992;65:361–369. doi: 10.1259/0007-1285-65-773-361. [DOI] [PubMed] [Google Scholar]
- 17.Pfirrmann CW, Metzdorf A, Zanetti M, Hodler J, Boos N. Magnetic resonance classification of lumbar intervertebral disc degeneration. Spine (Phila Pa 1976) 2001;26:1873–1878. doi: 10.1097/00007632-200109010-00011. [DOI] [PubMed] [Google Scholar]
- 18.Schneiderman G, Flannigan B, Kingston S, Thomas J, Dillin WH, Watkins RG. Magnetic resonance imaging in the diagnosis of disc degeneration: correlation with discography. Spine (Phila Pa 1976) 1987;12:276–281. doi: 10.1097/00007632-198704000-00016. [DOI] [PubMed] [Google Scholar]
- 19.Chou D, Samartzis D, Bellabarba C, et al. Degenerative magnetic resonance imaging changes in patients with chronic low back pain: a systematic review. Spine (Phila Pa 1976) 2011;36:S43–53. doi: 10.1097/BRS.0b013e31822ef700. [DOI] [PubMed] [Google Scholar]
- 20.Borenstein DG, O’Mara JW, Jr, Boden SD, et al. The value of magnetic resonance imaging of the lumbar spine to predict low-back pain in asymptomatic subjects : a seven-year follow-up study. J Bone Joint Surg Am. 2001;83-A:1306–1311. doi: 10.2106/00004623-200109000-00002. [DOI] [PubMed] [Google Scholar]
- 21.Boden SD, Davis DO, Dina TS, Patronas NJ, Wiesel SW. Abnormal magnetic-resonance scans of the lumbar spine in asymptomatic subjects. A prospective investigation. J Bone Joint Surg Am. 1990;72:403–408. [PubMed] [Google Scholar]
- 22.Samartzis D, Ito K, Wang JC. Disk degeneration and pain. Global Spine J. 2013;3:125–126. doi: 10.1055/s-0033-1351686. [DOI] [PMC free article] [PubMed] [Google Scholar]
- 23.Shen FH, Samartzis D, Andersson GB. Nonsurgical management of acute and chronic low back pain. J Am Acad Orthop Surg. 2006;14:477–487. doi: 10.5435/00124635-200608000-00005. [DOI] [PubMed] [Google Scholar]
- 24.Chou R, Fu R, Carrino JA, Deyo RA. Imaging strategies for low-back pain: systematic review and meta-analysis. Lancet. 2009;373:463–472. doi: 10.1016/S0140-6736(09)60172-0. [DOI] [PubMed] [Google Scholar]
- 25.Jarvik JG, Gold LS, Comstock BA, et al. Association of early imaging for back pain with clinical outcomes in older adults. JAMA. 2015;313:1143–1153. doi: 10.1001/jama.2015.1871. [DOI] [PubMed] [Google Scholar]
- 26.Zuo J, Joseph GB, Li X, et al. In vivo intervertebral disc characterization using magnetic resonance spectroscopy and T1rho imaging: association with discography and Oswestry Disability Index and Short Form-36 Health Survey. Spine (Phila Pa 1976) 2012;37:214–221. doi: 10.1097/BRS.0b013e3182294a63. [DOI] [PMC free article] [PubMed] [Google Scholar]
- 27.Auerbach JD, Johannessen W, Borthakur A, et al. In vivo quantification of human lumbar disc degeneration using T(1rho)-weighted magnetic resonance imaging. Eur Spine J. 2006;15(Suppl 3):S338–344. doi: 10.1007/s00586-006-0083-2. [DOI] [PMC free article] [PubMed] [Google Scholar]
- 28.Robson MD, Gatehouse PD, Bydder M, Bydder GM. Magnetic resonance: an introduction to ultrashort TE (UTE) imaging. J Comput Assist Tomogr. 2003;27:825–846. doi: 10.1097/00004728-200311000-00001. [DOI] [PubMed] [Google Scholar]
- 29.Law T, Anthony MP, Chan Q, et al. Ultrashort time-to-echo MRI of the cartilaginous endplate: technique and association with intervertebral disc degeneration. J Med Imaging Radiat Oncol. 2013;57:427–434. doi: 10.1111/1754-9485.12041. [DOI] [PubMed] [Google Scholar]
- 30.Chen KC, Tran B, Biswas R, et al. Evaluation of the disco-vertebral junction using ultrashort time-to-echo magnetic resonance imaging: inter-reader agreement and association with vertebral endplate lesions. Skeletal Radiol. 2016;45:1249–1256. doi: 10.1007/s00256-016-2413-8. [DOI] [PMC free article] [PubMed] [Google Scholar]
- 31.Cheung KM, Samartzis D, Karppinen J, Luk KD. Are “patterns” of lumbar disc degeneration associated with low back pain?: new insights based on skipped level disc pathology. Spine (Phila Pa 1976) 2012;37:E430–438. doi: 10.1097/BRS.0b013e3182304dfc. [DOI] [PubMed] [Google Scholar]
- 32.Cheung KM, Samartzis D, Karppinen J, et al. Intervertebral disc degeneration: new insights based on “skipped” level disc pathology. Arthritis Rheum. 2010;62:2392–2400. doi: 10.1002/art.27523. [DOI] [PubMed] [Google Scholar]
- 33.Maatta JH, Karppinen JI, Luk KD, Cheung KM, Samartzis D. Phenotype profiling of Modic changes of the lumbar spine and its association with other MRI phenotypes: a large-scale population-based study. Spine J. 2015;15:1933–1942. doi: 10.1016/j.spinee.2015.06.056. [DOI] [PubMed] [Google Scholar]
- 34.Maatta JH, Karppinen J, Paananen M, et al. Refined phenotyping of Modic changes: imaging biomarkers of prolonged severe low back pain and disability. Medicine (Baltimore) 2016;95:e3495. doi: 10.1097/MD.0000000000003495. [DOI] [PMC free article] [PubMed] [Google Scholar]
- 35.Mok FP, Samartzis D, Karppinen J, Luk KD, Fong DY, Cheung KM. ISSLS prize winner: prevalence, determinants, and association of Schmorl nodes of the lumbar spine with disc degeneration: a population-based study of 2449 individuals. Spine (Phila Pa 1976) 2010;35:1944–1952. doi: 10.1097/BRS.0b013e3181d534f3. [DOI] [PubMed] [Google Scholar]
- 36.Samartzis D, Karppinen J, Chan D, Luk KD, Cheung KM. The association of lumbar intervertebral disc degeneration on magnetic resonance imaging with body mass index in overweight and obese adults: a population-based study. Arthritis Rheum. 2012;64:1488–1496. doi: 10.1002/art.33462. [DOI] [PubMed] [Google Scholar]
- 37.Tomkins-Lane C, Melloh M, Lurie J, et al. 2016 ISSLS Clinical Prize: Consensus on the clinical diagnosis of lumbar spinal stenosis: results of an international Delphi study. Spine (Phila Pa 1976) 2016 doi: 10.1097/BRS.0000000000001476. [Epub ahead of print] [DOI] [PMC free article] [PubMed] [Google Scholar]
- 38.Fardon DF, Williams AL, Dohring EJ, Murtagh FR, Gabriel Rothman SL, Sze GK. Lumbar disc nomenclature: version 2.0: Recommendations of the combined task forces of the North American Spine Society, the American Society of Spine Radiology and the American Society of Neuroradiology. Spine J. 2014;14:2525–2545. doi: 10.1016/j.spinee.2014.04.022. [DOI] [PubMed] [Google Scholar]
- 39.Wiltse LL, Newman PH, Macnab I. Classification of spondylolisis and spondylolisthesis. Clin Orthop Relat Res. 1976:23–29. [PubMed] [Google Scholar]
- 40.Wiltse LL, Winter RB. Terminology and measurement of spondylolisthesis. J Bone Joint Surg Am. 1983;65:768–772. [PubMed] [Google Scholar]
- 41.Li Y, Samartzis D, Campbell D, et al. Two subtypes of intervertebral disc degeneration distinguished by a large-scale population-based study. Spine J. doi: 10.1016/j.spinee.2016.04.020. (Epub ahead of press) [DOI] [PubMed] [Google Scholar]
- 42.Borthakur A, Maurer PM, Fenty M, et al. T1ρ magnetic resonance imaging and discography pressure as novel biomarkers for disc degeneration and low back pain. Spine (Phila Pa 1976) 2011;36:2190–2196. doi: 10.1097/BRS.0b013e31820287bf. [DOI] [PMC free article] [PubMed] [Google Scholar]
- 43.Vangeneugden T, Laenen A, Geys H, Renard D, Molenberghs G. Applying concepts of generalizability theory on clinical trial data to investigate sources of variation and their impact on reliability. Biometrics. 2005;61:295–304. doi: 10.1111/j.0006-341X.2005.031040.x. [DOI] [PubMed] [Google Scholar]
- 44.Vavken P, Ganal-Antonio AK, Shen FH, Chapman JR, Samartzis D. Fundamentals of clinical outcomes assessment for spinal disorders: study designs, methodologies, and analyses. Global Spine J. 2015;5:156–164. doi: 10.1055/s-0035-1547525. [DOI] [PMC free article] [PubMed] [Google Scholar]
- 45.Lotz JC, Fields AJ, Liebenberg EC. The role of the vertebral end plate in low back pain. Global Spine J. 2013;3:153–164. doi: 10.1055/s-0033-1347298. [DOI] [PMC free article] [PubMed] [Google Scholar]
- 46.Yim RL, Lee JT, Bow CH, et al. A systematic review of the safety and efficacy of mesenchymal stem cells for disc degeneration: insights and future directions for regenerative therapeutics. Stem Cells Dev. 2014;23:2553–2567. doi: 10.1089/scd.2014.0203. [DOI] [PMC free article] [PubMed] [Google Scholar]
- 47.Carragee EJ, Don AS, Hurwitz EL, Cuellar JM, Carrino JA, Herzog R. 2009 ISSLS Prize Winner: Does discography cause accelerated progression of degeneration changes in the lumbar disc: a ten-year matched cohort study. Spine (Phila Pa 1976) 2009;34:2338–2345. doi: 10.1097/BRS.0b013e3181ab5432. [DOI] [PubMed] [Google Scholar]
- 48.Cuellar JM, Stauff MP, Herzog RJ, Carrino JA, Baker GA, Carragee EJ. Does provocative discography cause clinically important injury to the lumbar intervertebral disc? A 10-year matched cohort study. Spine J. 2016;16:273–280. doi: 10.1016/j.spinee.2015.06.051. [DOI] [PubMed] [Google Scholar]
- 49.Kim M, Chan Q, Anthony MP, Cheung KM, Samartzis D, Khong PL. Assessment of glycosaminoglycan distribution in human lumbar intervertebral discs using chemical exchange saturation transfer at 3 T: feasibility and initial experience. NMR Biomed. 2011;24:1137–1144. doi: 10.1002/nbm.1671. [DOI] [PubMed] [Google Scholar]
- 50.Zhang Z, Chan Q, Anthony MP, et al. Age-related diffusion patterns in human lumbar intervertebral discs: a pilot study in asymptomatic subjects. Magn Reson Imaging. 2012;30:181–188. doi: 10.1016/j.mri.2011.09.021. [DOI] [PubMed] [Google Scholar]


