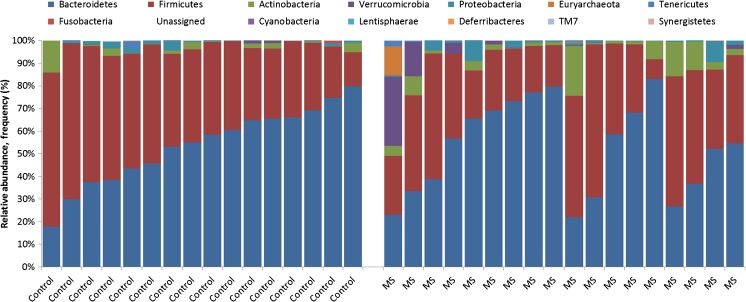
Fig. 1.
Relative abundance of the gut microbiota phyla for cases and controls using 16S rRNA sequencing [16]. Each bar represents 1 child; controls (left) and multiple sclerosis cases (right). The y-axis depicts relative abundance of the gut microbiota phyla, reported as a proportion for each child, relative to all cases and controls. Each phyla are color-coded as shown; e.g., as expected the predominant phyla in the guts of all children (cases and controls) with Bacteroidetes (blue) and Firmicutes (red)

