

Abstract
Despite advances in therapeutic strategies, colorectal cancer (CRC) remains the third cause of cancer-related deaths with a relatively low survival rate. Resistance to standard chemotherapy represents a major hurdle in disease management; therefore, developing new therapeutic agents demands a thorough understanding of their mechanisms of action. One of these compounds is ST1926, an adamantyl retinoid that has shown potent antitumor activities in several human cancer models. Here, we show that ST1926 selectively suppressed the proliferation of CRC cells while sparing normal counterparts, and significantly reduced tumor volume in a xenograft cancer mouse model. Next, we investigated the effects of ST1926 in CRC cells and observed early DNA damage, S-phase arrest, dissipation of mitochondrial membrane potential, and apoptosis induction, in a p53 and p21-independent manner. To address the underlying mechanism of resistance to ST1926, we generated ST1926-resistant HCT116 cells and sequenced DNA polymerase α (POLA1), which was reported to be a direct target to the drug’s parent molecule, CD437. We identified similar mutations in POLA1 that conferred resistance to ST1926 and CD437. These mutations were absent in 5-fluorouracil-resistant HCT116 cells, clearly validating the specificity of these mutations to the lack of DNA damage and acquired resistance to ST1926. ST1926 also inhibited POLA1 activity and reduced its protein expression levels. Further, in silico analysis of normal and malignant tissue expression data demonstrated that POLA1 levels are elevated in CRC cells and tissues compared to normal counterparts as well as to other cancer types. Our findings highlight previously uncharacterized mechanisms of action of ST1926 in CRC and suggest that elevated POLA1 expression is a pertinent molecular feature and an attractive target in CRC.
Keywords: ST1926, synthetic retinoid, POLA1, colorectal cancer, drug resistance
Introduction
Colorectal cancer (CRC) represents a global health threat due to its high incidence and mortality rates. Being the third most commonly diagnosed cancer and the third cause of cancer-related deaths in both men and women, CRC is estimated in 2017 to account for around 50,000 deaths in the United States [1]. Standard treatment of CRC is multidisciplinary and may include surgery, radiation therapy, and chemotherapy [2]. The commonly used anticancer drugs in the treatment of CRC include 5-Fluorouracil (5-FU), among others [3,4]. Despite recent advances in treatment strategies for CRC, the five-year survival rate does not exceed 65% [5]. Molecular heterogeneity among CRC subtypes affects treatment regimen and prognosis [6] and may contribute to the poor survival rates of CRC patients. Thus, therapeutically effective chemotherapy, accompanying or adjuvant to CRC surgery, requires the understanding of genetic and epigenetic aberrations in tumor formation. Accordingly, diagnosis, prognosis, and patient-tailored therapy can be optimized [7]. Targeted therapies such as drugs against vascular endothelial growth factor or epidermal growth factor receptor (EGFR) are now routinely clinically administered alone or in combination with chemotherapy. To date, these drugs demonstrated improved clinical outcome in metastatic CRC patients with combination chemotherapy [8,9], however, patients suffer from severe side effects and relapse [10]. In addition, patients with KRAS, NRAS, or BRAF mutations do not benefit from EGFR-targeted therapies [11]. Therefore, the development of safe and effective therapies is urgently needed to improve five-year survival rates and quality of life of CRC patients.
Retinoids are a class of chemical compounds well known for their role as tumor-suppressive agents due to their involvement in the regulation of cell proliferation and differentiation in embryonic development and adult life [12-14]. Retinoids comprise both natural and synthetic analogues with vitamin A (retinol) activity. All-trans retinoic acid (ATRA) is the major active metabolite of retinol. ATRA displays pleiotropic effects in cellular proliferation, differentiation, and cell death [15]. ATRA emerged as a cyto-differentiating agent and is being used as a treatment regimen in combination with other drugs for patients with acute promyelocytic leukemia (APL) to date [16,17]. Interestingly, studies identified aberrant retinoid-signaling in the pathogenesis of CRC where retinol dehydrogenase 5 and retinol dehydrogenase-like, two enzymes involved in the biosynthesis of retinoic acid, were shown to be downregulated in neoplastic colon [18]. As a result, natural retinoids gained a lot of attention in CRC prevention and treatment [19], and were evaluated in many preclinical studies but no clinical trials. The reasons can be attributed to their side effects [20] and resistance to treatment [19] as observed in other solid tumors, namely breast tumor [20], or their poorly understood mechanism of action [21]. Consequently, synthetic retinoids were developed with enhanced specificity and reduced toxicity [22,23]. Of interest, CD437, a retinoic acid receptor γ (RAR γ) agonist [24,25], and the CD437-derived adamantyl retinoid ST1926 showed promising antitumor activities in various hematological and solid malignancies [24,26-29].
CD437 and ST1926 share common effects by inducing early DNA damage, S-phase arrest, and apoptosis, trans-activating RARγ or working independently of RARs, and modulating the expression levels of similar genes [30]. In vitro studies demonstrated that ST1926 is superior to CD437, where sub-micromolar (µM) concentrations of ST1926 resulted in substantial growth inhibition and apoptosis in different tumor models [24,28]. Later studies reported that these sub-µM concentrations could be pharmacologically achieved in the plasma of mice [31] and humans [32], with a half-life of about 2 and 4 hours, respectively. Recently, Han et al. identified DNA polymerase α (POLA1) as a direct target for CD437 [33]. In fact, CD437-resistant CRC cells displayed missense mutations in POLA1 primary sequence: C691Y, L700S, L764S, I768T, and A772T/D [33]. Introducing one of these mutations into CD437-sensitive CRC cells conferred CD437 resistance [33]. In an attempt to identify ST1926 molecular targets, Fratelli et al. conducted target profiling by affinity chromatography coupled to mass spectrometry and identified the histone variant H2A.Z as a nuclear target, among others [34]. Binding of ST1926 to H2A.Z was then confirmed to be direct and reversible by surface plasmon resonance analysis under saturated and suprapharmacological concentrations of ST1926 [34]. Despite these findings, the mechanism of action of pharmacologically achievable concentrations of ST1926 remains largely unknown.
In the present study, we investigated the mechanism of action of ST1926 and ST1926-resistance in CRC models. We showed that sub-µM concentrations of ST1926 selectively inhibited the proliferation and induced death of several human CRC cell lines, but not of normal-like counterparts. ST1926 significantly decreased tumor progression in a xenograft CRC mouse model. Mechanistically, we demonstrated that ST1926 induced early massive DNA damage, apoptosis, and reduced both POLA1 activity and expression levels. We generated ST1926-resistant (HCT116-STR) and 5-FU-resistant (HCT116-FUR) CRC cell lines and showed that DNA damage and POLA1 are specifically involved in ST1926 mechanism of action and acquired drug resistance. Finally, we showed that POLA1 levels are elevated in CRC cells and tissues compared to normal counterparts and to other cancer types.
Materials and methods
Cell lines and culture conditions
The human CRC cell lines HT29, HCT116, and LoVo (American Tissue Culture Collection, ATCC, Manassas, VA), were cultured in RPMI medium supplemented with 10% fetal bovine serum (FBS), 1% sodium pyruvate and 1% penicillin-streptomycin. HCT116 p53-/- and HCT116 p21-/- cells [35] (kindly provided by Dr. Carlos Maria Galmarini, PharmaMar, Madrid, Spain) were cultured in DMEM medium supplemented with 10% FBS, 1% sodium pyruvate, 1% non-essential amino acids, and 1% penicillin-streptomycin. The NCM460 cell line (INCELL Corporation, LLC San Antonio, TX), derived from normal colon epithelium were cultured in M3:Base medium (INCELL Corporation, LLC) supplemented with 10% FBS. All cells were maintained at 37°C, 5% CO2, in a humidified incubator. HCT116-STR and HCT116-FUR cell lines were derived from the parental HCT116 cell line by incubating it with increasing concentrations of ST1926 (0.05 to 40 µM) and 5-FU (0.1 to 40 µM), respectively, for a total period of eight months.
Drug compounds
All-trans retinoic acid (Sigma R2625) was dissolved in dimethyl sulfoxide (DMSO) at a concentration of 3.3 × 10⁻² M and stored at -80°C. ST1926 and CD437 (kindly provided by BIOGEM, Ariano Irpino AV, Italy) were dissolved in DMSO at a concentration of 10-2 M and stored at -80°C. 5-Fluorouracil (Sigma) was dissolved in DMSO at 10-1 M concentration and stored at -20°C. ATRA and CD437 were handled under yellow light (λ & 500 nm).
Growth assay
Cells were treated for up to three days with the indicated concentrations of the drug compounds, or with similar DMSO concentrations for control cells. DMSO concentrations never exceeded 0.1% and these concentrations did not affect the growth of tested cell lines. Cell growth was assessed by the use of the Thiazolyl Blue Tetrazolium Bromide (MTT) assay (Sigma M5655), the formazan crystals were dissolved in a solubilization solution (6 M HCL, 10% SDS, and 5% isobutanol), and values were determined colorimetrically using an ELISA reader at 595 nm. Cell viability was confirmed by the trypan blue dye exclusion protocol.
Cell cycle analysis
Control and treated cells were harvested, washed with phosphate-buffered saline (PBS) and fixed in 80% cold ethanol for at least 1 hour. Fixed cells were incubated with 200 µg/ml RNAse A (Roche Diagnostics) for 1 hour and then stained with propidium-iodide (PI; 50 µg/ml) (Sigma). 10,000 cells were analyzed using FACSAria flow cytometer (Becton Dickinson) and cell cycle distribution was verified using FACSDiva software (Becton Dickinson).
Mitochondrial membrane potential analysis
Quantification of mitochondrial membrane dissipation was determined using Rhodamine (R123) dye retention (Sigma) as previously described [36]. Briefly, cells were collected, washed with PBS then with Rhodamine wash buffer, and incubated with 5 µM R123 for 45 minutes at 37°C. Labeled cells were washed and fluorescence was analyzed using flow cytometry.
Immunoblot analysis
Total proteins were extracted from treated and control cells using the 2X Laemmli buffer (BioRad). Total cellular proteins (50 µg) were loaded onto a 10% SDS-polyacrylamide gel, subjected to electrophoresis and immunoblotted with the following antibodies: p53 (sc-126), p21 (sc-397), and PARP (sc-7150) from Santa Cruz Biotechnology (Heidelberg, Germany), γ-H2AX (2577) from Cell Signaling, Danvers, MA, POLA1 (31777) from Abcam (Cambridge, UK), and GAPDH (MAB5476) (Abnova, Heidelberg, Germany). Secondary antibodies (Santa Cruz Biotechnology) were added at room temperature for 2 hours. Proteins were detected by enhanced chemiluminescence by exposing the membranes to X-Ray films using the X-Omat machine (Carestream®).
TUNEL assay
Apoptosis was assessed by terminal deoxynucleotidyl transferase-mediated deoxyuridine triphosphate nick end labeling (TUNEL) assay (Roche Diagnostics) according to manufacturer’s instructions. 10,000 cells were collected and analyzed using flow cytometry as previously described [26].
Animal studies
Sixteen CD-1 nude mice, female, 4-6 weeks old, were obtained from BIOGEM s.c.a.r.l. (Ariano Irpino AV, Italy). Animal experiments were conducted while abiding to the regulations and guidelines of Italy and the European Union (D. L.vo n°. 26, March 24th, 2014) and the NIH Principles of Laboratory Animal Care (NIH, publication no. 85-23, revised 1985), and in accordance with the official BIOGEM Veterinarian and by the ethics committee “Comitato Etico per la Sperimentazione Animale” (CESA) of IRGS, BIOGEM. Prior to tumor cell injection, mice were anesthetized via isoflurane inhalation and injected subcutaneously into the right flank with 5 × 10⁶ HT29 cells. Three days post-injection, mice were evaluated and subsequently divided into two groups of eight animals each: control and ST1926-treated group. Treatment with ST1926 (15 mg/kg) or vehicle (Ethanol:Cremophor® A25:water) was administered daily by gavage at a dose of 5 ml/kg three days post-injection, for five consecutive days, up to three weeks. Treatment was then halted for 10 days, and a last oral administration was carried out 24 hours before sacrifice. Mice were euthanized by isoflurane prior to cervical dislocation. Tumor tissues were collected for further analysis. Mice were housed in polysulfone cages with ad libitum access to water and normal diet (GLP 4RF21, Mucedola) under specific pathogen-free facility at 22°C ± 2°C temperature and 55% ± 15% relative humidity with 12 hour light:12 hour darkness cycle and 18 ± 2 changes of air per hour.
Tumor measurements and health status monitoring
Mice were daily monitored for signs of morbidity. Body weight recordings were carried out biweekly. Tumor volume (TV) was monitored biweekly using Mitutoyo caliper, and was calculated as TV (mm3) = [length (mm) × width (mm)2]/2, where the width and the length are the shortest and the longest diameters, respectively. Tumor volume inhibition percentage (TVI%) in control versus treated mice was calculated as: TVI% = 100-(mean TV treated/mean TV control × 100). Doubling Time (Dt) was calculated as: Dt = (ln2 x Ti)/[ln(Vi/Vo)], where Ti is interval time, Vi is initial volume, and Vo is tumor volume at the day of measurement.
POLA1 sequencing
Parental HCT116, HCT116-STR, and HCT116-FUR cells were resuspended in Trizol for total RNA extraction and quantification. One microgram of total RNA was then reverse transcribed with the QIAGEN Reverse Transcription Kit. Fifty nanograms of the latter cDNA were used as template into PCR reactions. Reactions were carried out using nine different primer pairs covering the POLA1 coding sequences. All samples were analyzed in duplicate, and the obtained PCR fragments were run on agarose gels, purified and sent to the GATC Biotech Institute (GATC Biotech, European Custom Sequencing Centre, Koeln, Germany) for Sanger sequencing. Forward and reverse primers that were used in the sequencing reactions are detailed in the table below (Table 1). The nucleotide sequences obtained for each fragment were end-trimmed, overlapped, and compared with POLA1 reference sequence (NM_016937) by using the publicly available Multiple Alignment Server (MUSCLE). The presence of missense, non-sense, or silent mutations was determined using the correspondent amino acid sequences, which were obtained by mean of the Expasy translate tool.
Table 1.
Forward and reverse primer sequences
| Primer Name | Sequence (5’-3’) |
|---|---|
| POLA1_1F | GCGACGACTCTCTGTCAGATT |
| POLA1_2F | GCAGTGACAAAACCGAACAA |
| POLA1_3F | TTTCTCCCGGATGTCTCTTG |
| POLA1_4F | AATGCCAGAGCTTCCTCAAG |
| POLA1_5F | TCCTGATATCATTGTGGGTCA |
| POLA1_6F | TGTGCCTGACAAGCAGATTT |
| POLA1_7F | TATGGTTGCCTGGGATTTTC |
| POLA1_8F | GTGTCCCAGTGAGCCAGTTT |
| POLA1_9F | GGTTCGGGAACAGATATGGA |
| POLA1_1R | AAACTCCATTGCCCCTGACT |
| POLA1_2R | GGTCCTGTTTCTTTCCCCGTA |
| POLA1_3R | TGACTGAAAGGGAGGCTTTG |
| POLA1_4R | GGCATCTTTCCAGGTGTGTT |
| POLA1_5R | GGCAAAATGCCCATTTCT |
| POLA1_6R | TCCTTTGAGCTCCTGTTTGG |
| POLA1_7R | TCTAAATTGGGTGGGGTCAA |
| POLA1_8R | AGTTTCTCCAGTGCACACTCC |
| POLA1_9R | TCCTGGGATTCCCTTAGGAT |
Primer extension assay
To determine whether ST1926 is able to directly act on POLA1 and inhibit its activity, an in vitro primer extension assay was performed as described by Han and colleagues with modifications [33]. CD437, already reported as a direct inhibitor of POLA1, was used as a positive control. Briefly, the primer extension substrate was generated by mixing 100 µl of a 5 M fluorescein labeled 15 nucleotide (nt) RNA oligo (5-Fluorescein-rGrGrArArArGrGrArCrGrArArArCrA-3), 100 µl of a 7.5 M 25 nt DNA oligo (5-(A)6CCGGTGTTTCGTCCTTTCC-3), and 100 µl of 10X reaction buffer (200 mM Tris-HCl, pH 7.8, 100 mM MgCl2, 20 mM DTT, and 500 mM NaCl). The mixture was heated to 75°C for 2 minutes and gradually cooled to room temperature. Serial dilutions of CD437 and ST1926 were first prepared in DMSO, and then diluted in water. The final concentrations used were 0, 0.069, 0.21, 0.62, 1.9, 5.6, 17, 50, and 100 µM. One microliter of diluted compounds was added to 1 unit of the full length POLA1 recombinant protein (Creative Biomart, Shirley, NY), 2 µl of 10 mg/ml BSA, and 0.4 µl of 2.5 mM dNTP and pre-incubated at 25°C for 15 minutes. Afterwards, 3 µl of the primer extension substrate was added to the mixture. The primer extension reaction was incubated at 25°C for 15 minutes, and then terminated by the addition of 1 volume of 2X TBE-UREA sample buffer (Life Technologies). The reaction products were boiled for 2 minutes at 90°C, resolved on a 15% TBE UREA gel, and visualized using the Fluorescein acquisition program on the ChemiDoc XRS (Biorad).
In silico analysis of POLA1 expression
Expression levels of POLA1 mRNA were evaluated in publicly available datasets comprised of colorectal tumors or colon adenocarcinomas as well as normal colonic tissues [37,38]. POLA1 expression was also investigated in malignant and premalignant (adenoma) lesions of the colon and rectum along with normal colonic and rectal tissues [39,40]. The Wilcoxon rank-sum test was used to statistically analyze differences in POLA1 mRNA between two groups and the Kruskal-Wallis test was employed for three groups or more. POLA1 expression was also assessed in a dataset that included malignant solid tumors from eleven different organ sites including the colon [41]. Statistical analysis of differences in POLA1 expression levels between colon adenocarcinomas and other solid tumors via multiple comparisons was performed using ANOVA and Tukey’s honest significance difference test. P values less than 0.05 were considered statistically significant. Statistical analyses and generation of graphical displays were performed in the R language and environment (version 3.2.5).
Statistical analysis
Statistical comparisons were done using Microsoft Excel 2010. F-test for equal variance was used to check for equal variance followed by t-test to compare control and treated groups. P values less than 0.05 were considered significant. *, **, and ***indicate P values less than 0.05, 0.01, and 0.001, respectively. For tumor volume analysis, Wilcoxon test was used for statistical analysis between control and treatment group; differences were considered significant only when P values were less than 0.05. Statistical comparisons for in silico analysis of POLA1 expression were performed as described above.
Results
ST1926 inhibits cell growth of ATRA-resistant human colorectal malignant cells and reduces tumor formation in xenograft mice
We tested the effects of the synthetic retinoid ST1926 on the growth and viability of five human CRC cell lines, HT29, HCT116, HCT116 p53 -/-, HCT116 p21 -/-, and LoVo, as well as the human colon cells, NCM460, derived from normal intestinal mucosa. HCT116 and HT29 cells contain wild-type and mutated p53, respectively [42], whereas HCT116 p53 -/- and HCT116 p21 -/- cells harbor deleted p53 and p21, respectively [43]. While these CRC cell lines were shown to be resistant to ATRA even at 10 µM supra-pharmacological concentrations (data not shown and available upon request), ST1926 treatment at sub-µM concentrations resulted in growth inhibition in all tested cancer cells as shown by the MTT assay (Figure 1A). ST1926-induced growth inhibition was time-dependent, and a threshold of 0.5 µM was noted with comparable effects to concentrations up to 3 µM. In general, HT29, HCT116, and LoVo tumor cells were highly sensitive to ST1926 as growth was inhibited by at least 80% at day 3 post-treatment, whereas HCT116 cells with p53 or p21 knocked down genes were slightly less affected at similar concentrations (Figure 1A). Importantly, the normal-like NCM460 colon cells were resistant to ST1926 even at concentrations as high as 3 µM (Figure 1A). We have selected HT29, HCT116, HCT116 p53 -/-, and HCT116 p21 -/-, to carry out the remainder of our mechanistic studies, and have confirmed the inhibition of cell viability by ST1926 using the trypan blue exclusion assay in these cells (data not shown and available upon request).
Figure 1.
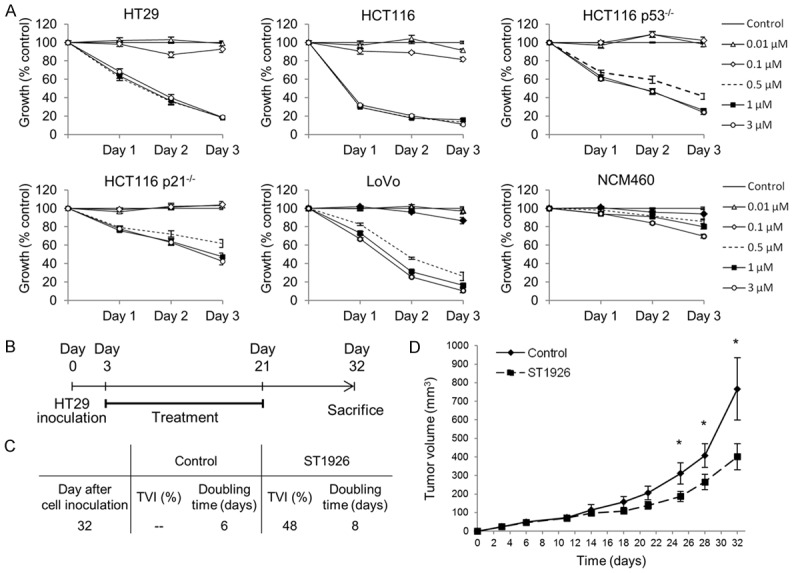
ST1926 inhibits the growth of ATRA-resistant human colorectal cancer but not of normal cells, and reduces tumor burden in a colorectal cancer xenograft mouse model. A. Effect of ST1926 treatment on cell growth of human colorectal cancer cells and their normal counterpart. HT29, HCT116, HCT116 p53-/-, HCT116 p21-/-, and LoVo colorectal cancer cells were seeded in 96-well plates at a density of 5,000 cells/well, while the normal-derived human colon mucosa cells, NCM460, were seeded at a density of 10,000 cells/well. Cells were treated with the indicated concentrations of ST1926 for up to three days, and cell growth was measured in triplicate wells using the MTT cell proliferation assay. Results are expressed as percentage of control (0.1% DMSO), and represent the average of at least three independent experiments ± SEM. B. Experimental scheme for ST1926 treatment. Three days after subcutaneous inoculation of HT29 colorectal cancer cells in CD-1 nude female mice, 18-day-treatment was initiated. One last ST1926 dose was administered 24 hours before sacrifice. Mice were sacrificed at Day 32. C. The effect of ST1926 on the doubling time was calculated at day 32 upon sacrifice and tumor volume inhibition percentage (TVI%) in the ST1926 group was calculated compared to the control group. D. The effect of ST1926 on tumor volume progression in HT29-inoculated mice was recorded from day 3 to day 32. *P < 0.05, statistically significant.
We tested for the antitumor effect of ST1926 in vivo. We used CD-1 nude mice that were subcutaneously injected with HT29 cells. Three days later, mice (n = 8) were orally treated with ST1926 at a concentration of 15 mg/kg daily for five consecutive days, for three weeks, and a last dose of ST1926 was administered to mice 24 hours before they were sacrificed at day 32 (Figure 1B). The control mice (n = 8) were treated with the vehicle following the same treatment regimen. The tumor volume doubling time was six days in the control group and was increased to eight days in the ST1926-treated mice (Figure 1C). Interestingly, ST1926-treated mice had a tumor volume inhibition of 48% calculated at 32 days post-cell injection (Figure 1C). These results are consistent with the observation that tumor volume of ST1926-treated mice was 30-40% smaller than controls as early as 18 days (Figure 1C and 1D). This tumor reduction further increased until the termination of the experiment at day 32, reaching approximately 50% tumor volume inhibition (Figure 1D). These results highlight the antitumor potential of ST1926 in CRC in vivo.
ST1926 induces S-phase cell cycle arrest and apoptosis in colorectal cancer cells independently of p53 and p21
We investigated the mechanism of ST1926-induced CRC cell growth inhibition by cell cycle analysis. HT29, HCT116, HCT116 p53 -/-, and HCT116 p21 -/- cells were treated with 1 µM ST1926 for up to 48 hours. All tested cell lines showed an accumulation in the sub-G1 region of the cell cycle as early as 24 hours of treatment reaching approximately 35% of the total cell population for HT29 and HCT116, and 25% for HCT116 p53-/- and HCT116 p21-/- (Figure 2A). The distribution of cycling cells in the different phases of the cell cycle upon ST1926 treatment was analyzed and showed S-phase arrest in all tested cells (Figure 2B). ST1926 treatment for 24 hours induced an S-phase increase by 114% in HT29, 50% in HCT116, 115% in HCT116 p53 -/-, and 79% in HCT116 p21 -/- cells (Figure 2B). A similar S-phase increase was observed in 48 hour-treated cells (Figure 2B). The accumulation of ST1926-treated cells in the sub-G1 phase of the cell cycle presumably indicates apoptotic cells. Apoptosis was confirmed by the observed increase in TUNEL positivity in ST1926-treated cells reaching 12%, 48%, 25%, and 22%, for HT29, HCT116, HCT116 p53-/-, and HCT116 p21-/-, respectively at day 2 post-treatment (Figure 2C). In addition, PARP cleavage was detected in ST1926-treated CRC cells (Figure 2D). Altogether, these results indicate that ST1926 induces S-phase arrest and apoptosis in CRC cells independently of p53 and p21 status.
Figure 2.

ST1926 induces S-phase arrest and apoptosis in colorectal cancer cells. A. ST1926 treatment causes accumulation of cells in the sub-G1 region. B. Cell cycle distribution of colorectal cancer cells. HT29, HCT116, HCT116 p53-/-, and HCT116 p21-/- cells were treated with 0.1% DMSO or 1 μM ST1926 up to two days and stained with propidium iodide (50 mg/ml). The sub-G1 percentage presumably indicates apoptotic cells. The sum of G0/G1, S, and G2/M phases is a percentage of nonapoptotic cells at days one and two post-ST1926 treatment. Percentage cells in the G0/G1 phase are calculated as 100 - (S+G2/M). Results represent the average of three independent experiments (± SEM). C. TUNEL analysis of colorectal cancer cells treated with 0.1% DMSO or 1 μM ST1926 up to two days. Histograms are representative of two independent experiments and numbers indicate percentage of TUNEL-positive cells. D. ST1926 causes PARP cleavage in colorectal cancer cells. Cells were treated with 0.1% DMSO or 1 μM ST1926 up to two days. Total SDS protein lysates (50 µg/lane) were immunoblotted against PARP antibody. Arrow indicates cleaved PARP subunit. Similar trends were observed in three independent experiments. *P < 0.05, **P < 0.01, statistically significant.
ST1926 treatment of colorectal cancer cells results in dissipation of mitochondrial membrane potential and massive DNA damage independently of p53 and p21
To further study ST1926-induced cell death in CRC cells, we assessed disturbance in the mitochondrial membrane potential as a key indicator of apoptosis. Treatment with 1 μM ST1926 dissipated mitochondrial membrane potential in HCT116, HCT116 p53-/-, HCT116 p21-/- cells by 47%, 39%, and 36%, respectively, and by 10% in HT29 cells (Figure 3A). These results are in agreement with the lower TUNEL positivity observed in HT29 treated cells compared to the other tested CRC cell lines (Figure 2C). We measured p53 and p21 protein levels in CRC treated cells up to 48 hours. We observed a substantial increase in total p53 protein levels in HT29, HCT116, and HCT116 p21-/- treated cells while only HT29 and HCT116 upregulated their p21 protein levels upon ST1926 treatment (Figure 3B). As expected, p53 and p21 protein levels were undetectable in HCT116 p53-/- cells (Figure 3B).
Figure 3.
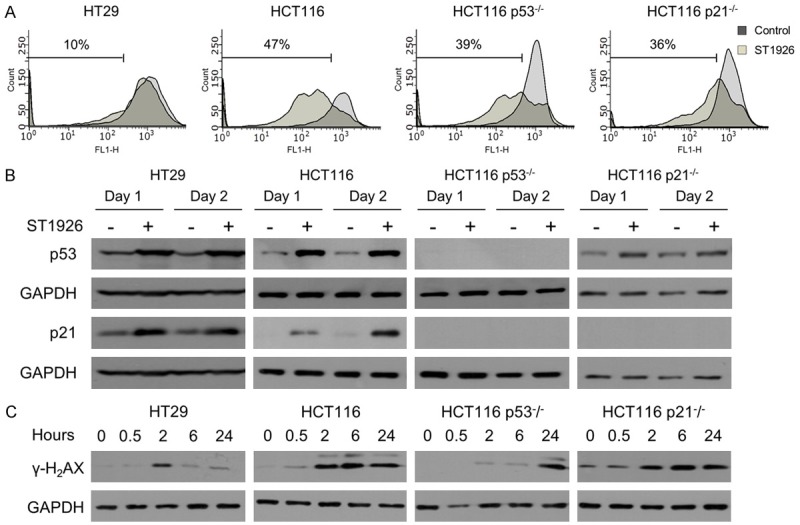
ST1926 treatment results in loss of mitochondrial membrane potential and early DNA damage, independently of p53 and p21. (A) Dissipation of the mitochondrial membrane potential of colorectal cancer cells by ST1926. HT29, HCT116, HCT116 p53-/-, and HCT116 p21-/- cells were treated with 0.1% DMSO or 1 µM ST1926 for two days, then stained with Rhodamine-123. Accumulation of Rhodamine-123 fluorescent dye was measured by flow cytometry, and is represented in histograms showing an overlay of ST1926-treated cells over control cells. Results are representative of three independent experiments and numbers indicate percentage of cells with mitochondrial dissipation. (B) ST1926 increases the protein levels of p53 and p21, and (C) γ-H2AX in HT29, HCT116, HCT116 p53-/-, and HCT116 p21-/- cells. Cells were treated with 0.1% DMSO or 1 μM ST1926 for up to two days. Total SDS protein lysates (50 µg/lane) were immunoblotted against p53, p21, and γ-H2AX antibodies. Similar trends in protein levels were observed in three independent experiments. All blots were reprobed with GAPDH antibody to ensure equal protein loading (B, C).
ST1926 has been well-characterized as a genotoxic agent that induces early DNA damage in various solid tumors [26,31,44,45]. To validate these observations in CRC, gamma-H2AX (γ-H2AX) protein levels, sensitive markers of DNA damage, were monitored up to 24 hours (Figure 3C). ST1926 upregulated γ-H2AX protein levels as early as 2 hours, in tested cells independently of p53 and p21 status (Figure 3C). DNA damage induction in ST1926-treated HCT116 p53-/- and HCT116 p21-/- cells was also confirmed by the COMET assay (data not shown and available upon request).
ST1926-resistant colorectal cells are resistant to CD437 and both compounds inhibit POLA1 activity
ST1926 mediates its antitumor activities through DNA damage induction, which is impaired or delayed upon acquired resistance to ST1926 in lung and neuroblastoma cancer cells [45,46]. We generated HCT116-STR by culturing the cells in increasing concentrations of ST1926 (10-9 to 5 × 10⁻⁶ M) for over 8 months. HCT116-STR cells were resistant to ST1926 concentrations that induced substantial cell death in the HCT116 parental cells (Figure 4A). The HCT116-STR cells displayed an impaired DNA damage response to ST1926, as assessed by the lack of any detectable γ-H2AX protein levels up to 24 hours (Figure 4B). Furthermore, treatment of HCT116-STR with 1 μM ST1926 for 48 hours resulted in 6% TUNEL-positivity (Figure 4C) as opposed to 48% in the treated HCT116 parental cells (Figure 2C). These observations highlight the critical role of the DNA damage response in mediating ST1926-induced apoptosis; yet, ST1926 targets remain unknown.
Figure 4.

ST1926-resistant cells are cross-resistant to CD437 and both compounds inhibit POLA1 activity. A. Effect of ST1926 treatment on the growth of human HCT116-STR. ST1926-resistant cells (HCT116-STR) were generated by treating the parental cell line with increasing concentrations of ST1926 over a period of eight months. HCT116-STR cells were seeded in 96-well plates at a density of 5,000 cells/well, and treated with the indicated concentrations of ST1926 for up to three days. Cell growth was assayed in triplicate wells using the MTT assay. Results are expressed as percentage of control (0.1% DMSO), and represent the average of three independent experiments ± SEM. B. HCT116-STR DNA damage response to ST1926 treatment. Cells were treated with 0.1% DMSO or 1 μM ST1926 for up to 24 hours. Total SDS protein lysates (50 µg/lane) were immunoblotted against γ-H2AX antibody. Similar trends in protein levels were observed in three independent experiments. Blots were reprobed with GAPDH antibody to ensure equal protein loading. C. TUNEL analysis of HCT116-STR cells treated with 0.1% DMSO or 1 μM ST1926 up to 48 hours. Results are representative of two independent experiments. D. Effect of CD437 treatment on HCT116 and HCT116-STR cell growth. Cells were treated with the indicated concentrations of CD437 for up to three days. Cell growth was assayed in triplicate wells using the MTT assay. Results are expressed as percentage of control (0.1% DMSO), and represent the average of at least three independent experiments ± SEM. E. Primer extension assay was evaluated in the presence of increasing concentrations of ST1926 and CD437 (0.069, 0.21, 0.62, 1.9, 5.6, 17, 50, and 100 μM). “-” represents the control (DMSO). The activity of POLA1 was determined by the detection of primer of a 25-nucleotide product, and a gel representative of two independent experiments is shown.
Since ST1926 was developed as an analogue to CD437 [24], and CD437 strongly inhibited HCT116 proliferation and growth of other CRC cell lines (Figure 4D and data not shown and available upon request), we evaluated whether HCT116-STR were also resistant to CD437. We demonstrate that HCT116-STR cells also developed resistance to CD437 (Figure 4D). These data show that resistance mechanisms of the two adamantyl retinoids CD437 and ST1926 are similar thus suggesting comparable targets for these agents in CRC cells. CD437 was previously shown to inhibit POLA1 activity [33], we therefore tested whether ST1926 can also reduce POLA1 activity using the in vitro primer extension assay. We observed that ST1926 and CD437 abrogated primer extension in vitro by POLA1 (Figure 4E). These results suggest that ST1926 has a similar mechanism of action as CD437 in inhibiting POLA1 activity.
POLA1 is involved in the mechanism of action of ST1926
A recent report has demonstrated the involvement of POLA1 in the mechanism of action of CD437 as a direct and irreversible inhibitor of this enzyme [33]. Mutations in POLA1 prevent the binding of CD437 and reduce its anti-proliferative activities on CRC cells, including HCT116 [33]. Since HCT116-STR cells have developed cross-resistance to CD437, and in order to determine ST1926 mechanism of action, we have sequenced the full coding sequence of POLA1 in HCT116 and HCT116-STR cells. Interestingly, two missense mutations, T2291C and G2314A, have been exclusively identified in the HCT116-STR cells in exon 21 of POLA1 (Figure 5A). In order to verify whether this mechanism of resistance is specific to ST1926, we have generated HCT116 cells that are resistant to another DNA-damaging agent, 5-FU, which is the widely used drug in the treatment of CRC [4]. While 5-FU inhibited HCT116 cell growth in a dose- and time-dependent manner, 5-FU concentrations up to 40 µM barely reduced the growth of HCT116-FUR cells, for up to three days (Figure 5B). The full coding sequence of POLA1 gene was subsequently sequenced in HCT116-FUR cells. Using the Expasy translate tool, the sequences of POLA1 genes in HCT116, HCT116-STR, and HCT116-FUR cells were translated and aligned. We noted that the L762S and A772T variants found in HCT116-STR POLA1 protein, located at 70 and 60 amino acids upstream of the enzyme’s catalytic domain, respectively, were absent in the parental HCT116 and HCT116-FUR cells (Figure 5C). These results underscore the specificity of ST1926 mechanism of resistance and most importantly highlight a new mechanism of action for this drug on POLA1.
Figure 5.
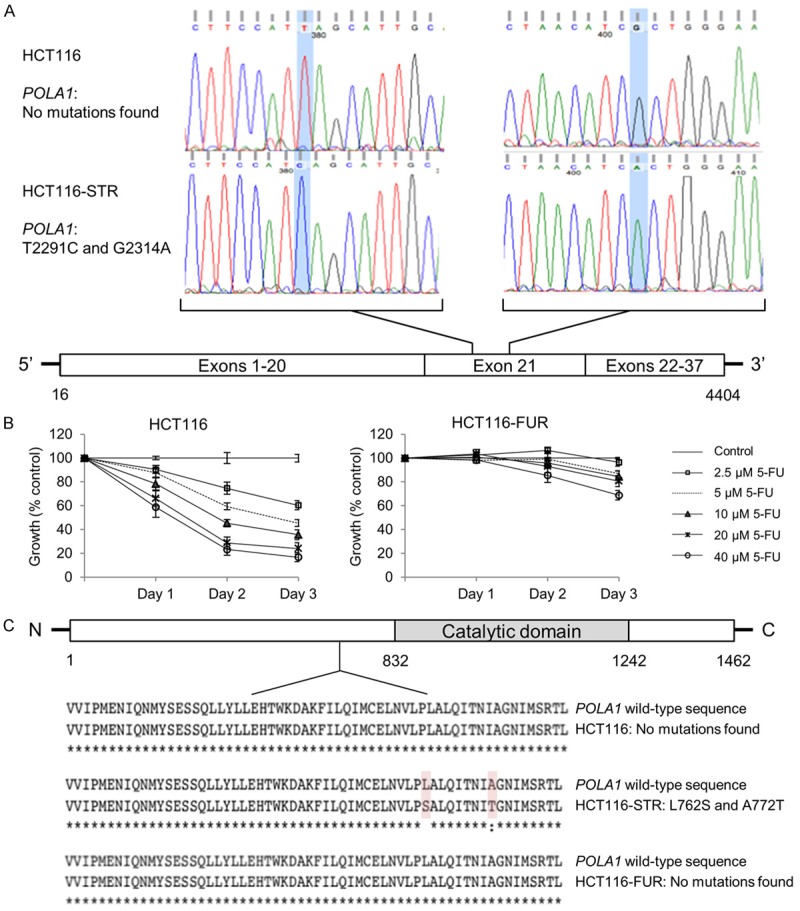
HCT116-resistant ST1926 cells exclusively harbor two missense mutations in POLA1. A. Schematic representation of POLA1 mutations identified in ST1926-resistant HCT116 cells (HCT116-STR). RNA was extracted from HCT116-parental and HCT116-STR cells and reverse transcribed, POLA1 cDNA was sequenced by the Sanger method. The panels of DNA sequencing were compared and relevant regions in exon 21 of POLA1 are shown. B. Effect of 5-fluorouracil (5-FU) treatment on the growth of HCT116 and 5-FU resistant (HCT116-FUR) cells. Cells were seeded in 96-well plates at a density of 5,000 cells/well, and treated with the indicated concentrations of 5-FU for up to three days. Cell growth was assayed in triplicate wells using the MTT assay. Results are expressed as percentage of control (0.1% DMSO), and represent the average of at least three independent experiments ± SEM. C. DNA sequences were translated using the Multiple alignment server (MUSCLE) and protein sequences were compared in HCT116, HCT116-STR, and HCT116-FUR cells. Only relevant regions of the sequences are shown.
POLA1 levels are decreased by ST1926 and are up-regulated in CRC cell lines and tissues relative to normal counterparts and other solid malignancies
The finding that ST1926 inhibited POLA1 activity led us to investigate its effect on POLA1 expression. ST1926 reduced POLA1 protein levels in all tested CRC cell lines (Figure 6A). These CRC cell lines had higher basal POLA1 protein levels relative to their normal NCM460 counterparts (Figure 6B). These results prompted us to extrapolate the relevance of POLA1 findings to resected CRC tissues. Using publicly available array expression datasets, we first probed POLA1 mRNA levels in CRC tumors relative to normal tissues. POLA1 expression levels were significantly elevated in colorectal tumors (P = 3.7 × 10⁻⁷; [37]) or colon adenocarcinomas (P = 0.001; [38]) (Figure 6C). Using publicly available cohorts [39,40], we also interrogated POLA1 expression patterns in either premalignant and malignant colon or rectal tissues. This analysis demonstrated that POLA1 expression levels were significantly elevated in both colon and rectal adenomas, as well as in colon carcinoma, relative to their respective normal tissues (all P < 0.001 of the Kruskal-Wallis test; Figure 6C). We next investigated POLA1 expression in tumors of different lineages and tissues-of-origin. We statistically analyzed POLA1 expression in the publicly available cohort by Su and colleagues comprised of solid tumors obtained from eleven different tissue sites including the colon [41]. We noted that POLA1 expression, among the eleven queried types of solid tumors, was highest in colon adenocarcinomas (Figure 6D). Specifically, POLA1 expression levels were significantly higher in colon adenocarcinomas relative to carcinomas of the bladder, kidney, liver, and ovary (all P < 0.05 of ANOVA-Tukey’s test for multiple comparisons). Our findings suggest that elevated POLA1 expression is a pertinent molecular feature and attractive target in CRC.
Figure 6.

POLA1 levels are elevated in colorectal cancer and ST1926 decreases its expression. A. ST1926 reduces POLA1 protein levels in colorectal cell lines. Cells were treated with 0.1% DMSO or 1 μM ST1926 for up to two days. Total SDS protein lysates (80 µg/lane) were immunoblotted against POLA1 antibody. Similar trends in protein levels were observed in two independent experiments. B. POLA1 basal protein levels are elevated in CRC cell lines compared to the normal-like NCM460 cells. Total SDS protein lysates (80 µg/lane) were immunoblotted against POLA1 antibody. Similar trends were observed in two independent experiments. Blots were reprobed with GAPDH antibody to ensure equal protein loading. C. Expression levels of POLA1 mRNA were evaluated in publicly available datasets comprised of malignant and premalignant (adenoma) lesions of the colon and rectum along with normal colonic and rectal tissues [37-40]. D. POLA1 expression was analyzed in a dataset that included solid tumors from eleven organ sites [41]. P values < 0.05 are considered statistically significant.
Discussion
Retinoids have been implicated in the regulation of cell proliferation, cell death, and differentiation in embryonic development and adult life [12]. Retinoids’ anticancer activities were exploited in several types of hematological and solid tumors [15,17,20]. However, the major drawback for the use of ATRA in the clinical setting is its toxic effects and acquired drug resistance [20,47]. In CRC, natural retinoids, and to a lesser extent synthetic ones, were tested in several pre-clinical studies, but none reached clinical trials. The need for retinoids with more potent, specific and safe action became warranted. Of interest, the adamantyl retinoid ST1926 [24] is relatively nontoxic, can be administered orally [28], and is effective at pharmacologically achievable sub-µM concentrations [31,32].
Here, we evaluated the effects of ST1926 in the treatment of CRC cancer, and characterized its underlying mode of action and drug resistance mechanisms. We showed that sub-µM ST1926 concentrations caused cell growth arrest and apoptosis in ATRA-resistant CRC cells while sparing normal-like colon epithelial cells. ST1926 induced massive and early DNA damage, S-phase arrest, and apoptosis in CRC cells as previously shown in other tumor models [26,28-31,44,48]. Important ST1926 treatment decreased the tumor doubling time and significantly alleviated tumor burden in a xenograft CRC model.
To study ST1926 mechanism of action, we observed that ST1926 upregulated the expression of p53 and p21. However, ST1926 also worked independently of those signaling pathways in CRC cells, highlighting the clinical relevance of this drug as these tumor suppressor genes are commonly deregulated in CRC patients [49]. Recently, Han et al. identified POLA1 as a direct and irreversible target of CD437, the parent molecule of ST1926 [33]. The authors used forward genetic strategy to show that CD437-resistant HCT116 cells displayed missense mutations in POLA1 peptide sequence: C691Y, L700S, L764S, I768T, and A772T/D. Introducing one of these mutations into CD437-sensitive HCT116 cells resulted in drug resistance [33]. So far, CD437 and ST1926 were shown to exhibit similar antitumor properties, however ST1926 is more bioavailable and potent than CD437 [28,30,50]. Based on these observations, and since the tested CRC cells used in this study are sensitive to CD437, we hypothesized that ST1926 may also target POLA1. To address this question, we generated HCT116-STR cells through prolonged selection in increasing concentrations of ST1926. These latter cells had impaired DNA damage response and apoptosis upon ST1926 treatment and displayed cross-resistance to CD437. Sequencing of POLA1 in HCT116-STR versus the parental cell line revealed two missense mutations (T2291C and G2314A), corresponding to the residues L764S and A772T, respectively. The identified mutations were similar to those identified in CD437-resistant HCT116 cells [33].
To confirm the specificity of the identified mutations in our model, we generated HCT116-FUR cells resistant to another commonly used DNA damaging agent. Interestingly, no similar mutations were observed in POLA1 sequences of HCT116-FUR cells. Altogether, our data suggest that ST1926 may be working similarly to CD437 through targeting of POLA1. Importantly, we have previously shown that ST1926-induced growth inhibition is irreversible [26,29,48] which may suggest an irreversible binding of ST1926 to POLA1 in cancer cells, making this drug specific to cancer cells as normal cells may be able to repair the DNA damage. We have established that ST1926 inhibited POLA1 activity by blocking primer extension in vitro, and reduced its protein levels in treated CRC cells. It remains to be determined whether ST1926 binds directly to POLA1 and modulates mutant variants of POLA1. Here we show that POLA1 levels are higher in CRC cell lines and tissues compared to their normal counterparts which is in accordance with previous studies [51,52]. POLA1 mutations are not known to be driver events and are rather passenger mutations that tend to develop later in cancer genomes [53]. Indeed, a pan-cancer survey of POLA1 mutations in various datasets from the cancer genome atlas (www.cbioportal.org; [54,55]) demonstrated that variants in the gene are common across various tumor subtypes and are very likely to be implicated as “passengers” in cancer pathogenesis (analysis not shown and available upon request). Therefore, POLA1 mutations do not usually cause cancer but may be due to alterations that are acquired during drug resistance. The fact that POLA1 is located on the X chromosome might explain the reason we were successful in generating ST1926-resistant cells derived from male patients but faced difficulties in generating resistant tumor cells derived from female ones, as the latter harbor two alleles of POLA1. It remains to be determined whether POLA1 mutations confer drug resistance in other ST1926-sensitive cancer cells and to confirm the irreversible and direct binding of ST1926 to POLA1. It would be valuable to compare the mutational status of POLA1 in clinically resistant CRC patients compared to responsive ones, and to study the prevalence of these mutations among resistant patients. Equally interesting would be to verify whether clinical resistance to other DNA damaging agents, may be due to mutations in POLA1 and to check the relevance of these mutations in cancer patients and their respective prognosis.
Resistance to retinoids has been a major hurdle in advancing retinoid-based therapy in the clinic. Several factors were shown to contribute to natural retinoid resistance, namely the high expression levels of cytochrome-P450-isoform-26 that metabolically inactivates ATRA [56], the aberrant RAR signaling pathway [17,18], and aberrant epigenetics, which suppress retinoid-sensitive genes [57]. Here, we propose the development of ST1926 in CRC and other ATRA-resistant cancer cells overexpressing POLA1 [58]. POLA1 initiates the first 10-20 base pairs of DNA providing substrate for the other DNA polymerases to pursue synthesis [59]. This may have major therapeutic implications, as so far, only the approved antibiotic aphidicolin, has been described as POLA1 inhibitor. However, this latter drug is toxic at the working concentrations and its binding to POLA1 is reversible [60]. Importantly, ST1926 is more bioavailable than CD437 and selectively induces cell death at concentrations that spare normal as well as human mesenchymal and hematopoietic stem cells [48]. Our studies support the clinical development of ST1926 in diseases associated with aberrant DNA replication, namely cancer, autoimmune diseases, viral, and bacterial infections, and reveal POLA1 as an attractive target for CRC therapy.
Acknowledgements
This work was supported by a grant from the Lebanese National Council for Scientific Research to Nadine Darwiche. The authors thank Dr. Marwan El-Sabban for his insightful scientific discussions and Ms. Berthe Hayar for her technical assistance.
Disclosure of conflict of interest
None.
References
- 1.Siegel RL, Miller KD, Jemal A. Cancer statistics, 2017. CA Cancer J Clin. 2017;67:7–30. doi: 10.3322/caac.21387. [DOI] [PubMed] [Google Scholar]
- 2.Blackmore AE, Wong MT, Tang CL. Evolution of laparoscopy in colorectal surgery: an evidence-based review. World J Gastroenterol. 2014;20:4926–4933. doi: 10.3748/wjg.v20.i17.4926. [DOI] [PMC free article] [PubMed] [Google Scholar]
- 3.Chandran SP, Natarajan SB, Chandraseharan S, Mohd Shahimi MS. Nano drug delivery strategy of 5-fluorouracil for the treatment of colorectal cancer. Journal of Cancer Research and Practice. 2017;4:45–48. [Google Scholar]
- 4.Longley DB, Harkin DP, Johnston PG. 5-fluorouracil: mechanisms of action and clinical strategies. Nat Rev Cancer. 2003;3:330–338. doi: 10.1038/nrc1074. [DOI] [PubMed] [Google Scholar]
- 5.Siegel RL, Miller KD, Fedewa SA, Ahnen DJ, Meester RG, Barzi A, Jemal A. Colorectal cancer statistics, 2017. CA Cancer J Clin. 2017;67:177–193. doi: 10.3322/caac.21395. [DOI] [PubMed] [Google Scholar]
- 6.Siegel R, Naishadham D, Jemal A. Cancer statistics, 2012. CA Cancer J Clin. 2012;62:10–29. doi: 10.3322/caac.20138. [DOI] [PubMed] [Google Scholar]
- 7.Vaiopoulos AG, Athanasoula K, Papavassiliou AG. Epigenetic modifications in colorectal cancer: molecular insights and therapeutic challenges. Biochim Biophys Acta. 2014;1842:971–980. doi: 10.1016/j.bbadis.2014.02.006. [DOI] [PubMed] [Google Scholar]
- 8.Hurwitz H. Integrating the anti-VEGF-A humanized monoclonal antibody bevacizumab with chemotherapy in advanced colorectal cancer. Clin Colorectal Cancer. 2004;4(Suppl 2):S62–68. doi: 10.3816/ccc.2004.s.010. [DOI] [PubMed] [Google Scholar]
- 9.Van Cutsem E, Rivera F, Berry S, Kretzschmar A, Michael M, DiBartolomeo M, Mazier MA, Canon JL, Georgoulias V, Peeters M, Bridgewater J, Cunningham D, First Bi. Safety and efficacy of first-line bevacizumab with FOLFOX, XELOX, FOLFIRI and fluoropyrimidines in metastatic colorectal cancer: the BEAT study. Ann Oncol. 2009;20:1842–1847. doi: 10.1093/annonc/mdp233. [DOI] [PubMed] [Google Scholar]
- 10.George TJ Jr, Laplant KD, Walden EO, Davis AB, Riggs CE, Close JL, George SN, Lynch JW. Managing cetuximab hypersensitivity-infusion reactions: incidence, risk factors, prevention, and retreatment. J Support Oncol. 2010;8:72–77. [PubMed] [Google Scholar]
- 11.Hsu HC, Thiam TK, Lu YJ, Yeh CY, Tsai WS, You JF, Hung HY, Tsai CN, Hsu A, Chen HC, Chen SJ, Yang TS. Mutations of KRAS/NRAS/BRAF predict cetuximab resistance in metastatic colorectal cancer patients. Oncotarget. 2016;7:22257–22270. doi: 10.18632/oncotarget.8076. [DOI] [PMC free article] [PubMed] [Google Scholar]
- 12.Altucci L, Gronemeyer H. The promise of retinoids to fight against cancer. Nat Rev Cancer. 2001;1:181–193. doi: 10.1038/35106036. [DOI] [PubMed] [Google Scholar]
- 13.Rhinn M, Dolle P. Retinoic acid signalling during development. Development. 2012;139:843–858. doi: 10.1242/dev.065938. [DOI] [PubMed] [Google Scholar]
- 14.Uray IP, Dmitrovsky E, Brown PH. Retinoids and rexinoids in cancer prevention: from laboratory to clinic. Semin Oncol. 2016;43:49–64. doi: 10.1053/j.seminoncol.2015.09.002. [DOI] [PMC free article] [PubMed] [Google Scholar]
- 15.di Masi A, Leboffe L, De Marinis E, Pagano F, Cicconi L, Rochette-Egly C, Lo-Coco F, Ascenzi P, Nervi C. Retinoic acid receptors: from molecular mechanisms to cancer therapy. Mol Aspects Med. 2015;41:1–115. doi: 10.1016/j.mam.2014.12.003. [DOI] [PubMed] [Google Scholar]
- 16.Breitman TR, Collins SJ, Keene BR. Terminal differentiation of human promyelocytic leukemic cells in primary culture in response to retinoic acid. Blood. 1981;57:1000–1004. [PubMed] [Google Scholar]
- 17.de The H, Chen Z. Acute promyelocytic leukaemia: novel insights into the mechanisms of cure. Nat Rev Cancer. 2010;10:775–783. doi: 10.1038/nrc2943. [DOI] [PubMed] [Google Scholar]
- 18.Jette C, Peterson PW, Sandoval IT, Manos EJ, Hadley E, Ireland CM, Jones DA. The tumor suppressor adenomatous polyposis coli and caudal related homeodomain protein regulate expression of retinol dehydrogenase L. J Biol Chem. 2004;279:34397–34405. doi: 10.1074/jbc.M314021200. [DOI] [PubMed] [Google Scholar]
- 19.Applegate CC, Lane MA. Role of retinoids in the prevention and treatment of colorectal cancer. World J Gastrointest Oncol. 2015;7:184–203. doi: 10.4251/wjgo.v7.i10.184. [DOI] [PMC free article] [PubMed] [Google Scholar]
- 20.Garattini E, Bolis M, Garattini SK, Fratelli M, Centritto F, Paroni G, Gianni M, Zanetti A, Pagani A, Fisher JN, Zambelli A, Terao M. Retinoids and breast cancer: from basic studies to the clinic and back again. Cancer Treat Rev. 2014;40:739–749. doi: 10.1016/j.ctrv.2014.01.001. [DOI] [PubMed] [Google Scholar]
- 21.Blomhoff R, Blomhoff HK. Overview of retinoid metabolism and function. J Neurobiol. 2006;66:606–630. doi: 10.1002/neu.20242. [DOI] [PubMed] [Google Scholar]
- 22.Dawson MI, Jong L, Hobbs PD, Xiao D, Feng KC, Chao WR, Pan C, Fontana JA, Zhang XK. 4-[3-(5,6,7,8-Tetrahydro-5,5,8,8-tetramethyl-2-naphthalenyl)phenyl] benzoic acid and heterocyclic-bridged analogues are novel retinoic acid receptor subtype and retinoid X receptor alpha agonists. Bioorg Med Chem Lett. 2000;10:1311–1313. doi: 10.1016/s0960-894x(00)00244-4. [DOI] [PubMed] [Google Scholar]
- 23.Ortiz MA, Bayon Y, Lopez-Hernandez FJ, Piedrafita FJ. Retinoids in combination therapies for the treatment of cancer: mechanisms and perspectives. Drug Resist Updat. 2002;5:162–175. doi: 10.1016/s1368-7646(02)00050-x. [DOI] [PubMed] [Google Scholar]
- 24.Cincinelli R, Dallavalle S, Merlini L, Penco S, Pisano C, Carminati P, Giannini G, Vesci L, Gaetano C, Illy B, Zuco V, Supino R, Zunino F. A novel atypical retinoid endowed with proapoptotic and antitumor activity. J Med Chem. 2003;46:909–912. doi: 10.1021/jm025593y. [DOI] [PubMed] [Google Scholar]
- 25.Garattini E, Gianni M, Terao M. Retinoid related molecules an emerging class of apoptotic agents with promising therapeutic potential in oncology: pharmacological activity and mechanisms of action. Curr Pharm Des. 2004;10:433–448. doi: 10.2174/1381612043453351. [DOI] [PubMed] [Google Scholar]
- 26.Aouad P, Saikali M, Abdel-Samad R, Fostok S, El-Houjeiri L, Pisano C, Talhouk R, Darwiche N. Antitumor activities of the synthetic retinoid ST1926 in two-dimensional and threedimensional human breast cancer models. Anticancer Drugs. 2017;28:757–770. doi: 10.1097/CAD.0000000000000511. [DOI] [PubMed] [Google Scholar]
- 27.El Hajj H, Khalil B, Ghandour B, Nasr R, Shahine S, Ghantous A, Abdel-Samad R, Sinjab A, Hasegawa H, Jabbour M, Hall WW, Zaatari G, Dbaibo G, Pisano C, Bazarbachi A, Darwiche N. Preclinical efficacy of the synthetic retinoid ST1926 for treating adult T-cell leukemia/lymphoma. Blood. 2014;124:2072–2080. doi: 10.1182/blood-2014-03-560060. [DOI] [PubMed] [Google Scholar]
- 28.Garattini E, Parrella E, Diomede L, Gianni M, Kalac Y, Merlini L, Simoni D, Zanier R, Ferrara FF, Chiarucci I, Carminati P, Terao M, Pisano C. ST1926, a novel and orally active retinoid-related molecule inducing apoptosis in myeloid leukemia cells: modulation of intracellular calcium homeostasis. Blood. 2004;103:194–207. doi: 10.1182/blood-2003-05-1577. [DOI] [PubMed] [Google Scholar]
- 29.Nasr RR, Hmadi RA, El-Eit RM, Iskandarani AN, Jabbour MN, Zaatari GS, Mahon FX, Pisano CC, Darwiche ND. ST1926, an orally active synthetic retinoid, induces apoptosis in chronic myeloid leukemia cells and prolongs survival in a murine model. Int J Cancer. 2015;137:698–709. doi: 10.1002/ijc.29407. [DOI] [PubMed] [Google Scholar]
- 30.Valli C, Paroni G, Di Francesco AM, Riccardi R, Tavecchio M, Erba E, Boldetti A, Gianni M, Fratelli M, Pisano C, Merlini L, Antoccia A, Cenciarelli C, Terao M, Garattini E. Atypical retinoids ST1926 and CD437 are S-phase-specific agents causing DNA double-strand breaks: significance for the cytotoxic and antiproliferative activity. Mol Cancer Ther. 2008;7:2941–2954. doi: 10.1158/1535-7163.MCT-08-0419. [DOI] [PubMed] [Google Scholar]
- 31.Basma H, Ghayad SE, Rammal G, Mancinelli A, Harajly M, Ghamloush F, Dweik L, El-Eit R, Zalzali H, Rabeh W, Pisano C, Darwiche N, Saab R. The synthetic retinoid ST1926 as a novel therapeutic agent in rhabdomyosarcoma. Int J Cancer. 2016;138:1528–1537. doi: 10.1002/ijc.29886. [DOI] [PubMed] [Google Scholar]
- 32.Sala F, Zucchetti M, Bagnati R, D’Incalci M, Pace S, Capocasa F, Marangon E. Development and validation of a liquid chromatography-tandem mass spectrometry method for the determination of ST1926, a novel oral antitumor agent, adamantyl retinoid derivative, in plasma of patients in a phase I study. J Chromatogr B Analyt Technol Biomed Life Sci. 2009;877:3118–3126. doi: 10.1016/j.jchromb.2009.08.001. [DOI] [PubMed] [Google Scholar]
- 33.Han T, Goralski M, Capota E, Padrick SB, Kim J, Xie Y, Nijhawan D. The antitumor toxin CD437 is a direct inhibitor of DNA polymerase alpha. Nat Chem Biol. 2016;12:511–515. doi: 10.1038/nchembio.2082. [DOI] [PMC free article] [PubMed] [Google Scholar]
- 34.Fratelli M, Fisher JN, Paroni G, Di Francesco AM, Pierri F, Pisano C, Godl K, Marx S, Tebbe A, Valli C, Gianni M, Stravalaci M, Gobbi M, Terao M, Garattini E. New insights into the molecular mechanisms underlying sensitivity/resistance to the atypical retinoid ST1926 in acute myeloid leukaemia cells: the role of histone H2A. Z, cAMP-dependent protein kinase A and the proteasome. Eur J Cancer. 2013;49:1491–1500. doi: 10.1016/j.ejca.2012.11.013. [DOI] [PubMed] [Google Scholar]
- 35.Bunz F, Dutriaux A, Lengauer C, Waldman T, Zhou S, Brown JP, Sedivy JM, Kinzler KW, Vogelstein B. Requirement for p53 and p21 to sustain G2 arrest after DNA damage. Science. 1998;282:1497–1501. doi: 10.1126/science.282.5393.1497. [DOI] [PubMed] [Google Scholar]
- 36.Darwiche N, Hatoum A, Dbaibo G, Kadara H, Nasr R, Abou-Lteif G, Bazzi R, Hermine O, de The H, Bazarbachi A. N-(4-hydroxyphenyl) retinamide induces growth arrest and apoptosis in HTLV-I-transformed cells. Leukemia. 2004;18:607–615. doi: 10.1038/sj.leu.2403245. [DOI] [PubMed] [Google Scholar]
- 37.Hong Y, Downey T, Eu KW, Koh PK, Cheah PY. A ‘metastasis-prone’ signature for earlystage mismatch-repair proficient sporadic colorectal cancer patients and its implications for possible therapeutics. Clin Exp Metastasis. 2010;27:83–90. doi: 10.1007/s10585-010-9305-4. [DOI] [PubMed] [Google Scholar]
- 38.Notterman DA, Alon U, Sierk AJ, Levine AJ. Transcriptional gene expression profiles of colorectal adenoma, adenocarcinoma, and normal tissue examined by oligonucleotide arrays. Cancer Res. 2001;61:3124–3130. [PubMed] [Google Scholar]
- 39.Sabates-Bellver J, Van der Flier LG, de Palo M, Cattaneo E, Maake C, Rehrauer H, Laczko E, Kurowski MA, Bujnicki JM, Menigatti M, Luz J, Ranalli TV, Gomes V, Pastorelli A, Faggiani R, Anti M, Jiricny J, Clevers H, Marra G. Transcriptome profile of human colorectal adenomas. Mol Cancer Res. 2007;5:1263–1275. doi: 10.1158/1541-7786.MCR-07-0267. [DOI] [PubMed] [Google Scholar]
- 40.Skrzypczak M, Goryca K, Rubel T, Paziewska A, Mikula M, Jarosz D, Pachlewski J, Oledzki J, Ostrowski J. Modeling oncogenic signaling in colon tumors by multidirectional analyses of microarray data directed for maximization of analytical reliability. PLoS One. 2010:5. doi: 10.1371/journal.pone.0013091. [DOI] [PMC free article] [PubMed] [Google Scholar]
- 41.Su AI, Welsh JB, Sapinoso LM, Kern SG, Dimitrov P, Lapp H, Schultz PG, Powell SM, Moskaluk CA, Frierson HF Jr, Hampton GM. Molecular classification of human carcinomas by use of gene expression signatures. Cancer Res. 2001;61:7388–7393. [PubMed] [Google Scholar]
- 42.Barberi-Heyob M, Vedrine PO, Merlin JL, Millon R, Abecassis J, Poupon MF, Guillemin F. Wild-type p53 gene transfer into mutated p53 HT29 cells improves sensitivity to photodynamic therapy via induction of apoptosis. Int J Oncol. 2004;24:951–958. [PubMed] [Google Scholar]
- 43.Han Z, Wei W, Dunaway S, Darnowski JW, Calabresi P, Sedivy J, Hendrickson EA, Balan KV, Pantazis P, Wyche JH. Role of p21 in apoptosis and senescence of human colon cancer cells treated with camptothecin. J Biol Chem. 2002;277:17154–17160. doi: 10.1074/jbc.M112401200. [DOI] [PubMed] [Google Scholar]
- 44.Zuco V, Zanchi C, Cassinelli G, Lanzi C, Supino R, Pisano C, Zanier R, Giordano V, Garattini E, Zunino F. Induction of apoptosis and stress response in ovarian carcinoma cell lines treated with ST1926, an atypical retinoid. Cell Death Differ. 2004;11:280–289. doi: 10.1038/sj.cdd.4401304. [DOI] [PubMed] [Google Scholar]
- 45.Zuco V, Zanchi C, Lanzi C, Beretta GL, Supino R, Pisano C, Barbarino M, Zanier R, Bucci F, Aulicino C, Carminati P, Zunino F. Development of resistance to the atypical retinoid, ST1926, in the lung carcinoma cell line H460 is associated with reduced formation of DNA strand breaks and a defective DNA damage response. Neoplasia. 2005;7:667–677. doi: 10.1593/neo.05127. [DOI] [PMC free article] [PubMed] [Google Scholar]
- 46.Di Francesco AM, Cusano G, Franzese O, Orienti I, Falconi M, Vesci L, Riccardi R. Resistance to the atypical retinoid ST1926 in SK-NAS cells selected the subline rAS-ST with enhanced sensitivity to ATRA mediated by not conventional mechanisms: DNA damage, G2 accumulation and late telomerase inhibition. Toxicol In Vitro. 2015;29:1628–1638. doi: 10.1016/j.tiv.2015.06.017. [DOI] [PubMed] [Google Scholar]
- 47.Schenk T, Stengel S, Zelent A. Unlocking the potential of retinoic acid in anticancer therapy. Br J Cancer. 2014;111:2039–2045. doi: 10.1038/bjc.2014.412. [DOI] [PMC free article] [PubMed] [Google Scholar]
- 48.El-Houjeiri L, Saad W, Hayar B, Aouad P, Tawil N, Abdel-Samad R, Hleihel R, Hamie M, Mancinelli A, Pisano C, El Hajj H, Darwiche N. Antitumor effect of the atypical retinoid ST1926 in acute myeloid leukemia and nanoparticle formulation prolongs lifespan and reduces tumor burden of xenograft mice. Mol Cancer Ther. 2017;16:2047–2057. doi: 10.1158/1535-7163.MCT-16-0785. [DOI] [PubMed] [Google Scholar]
- 49.Li XL, Zhou J, Chen ZR, Chng WJ. P53 mutations in colorectal cancer-molecular pathogenesis and pharmacological reactivation. World J Gastroenterol. 2015;21:84–93. doi: 10.3748/wjg.v21.i1.84. [DOI] [PMC free article] [PubMed] [Google Scholar]
- 50.Parrella E, Gianni M, Fratelli M, Barzago MM, Raska I Jr, Diomede L, Kurosaki M, Pisano C, Carminati P, Merlini L, Dallavalle S, Tavecchio M, Rochette-Egly C, Terao M, Garattini E. Antitumor activity of the retinoid-related molecules (E)-3-(4’-hydroxy-3’-adamantylbiphenyl-4-yl)acrylic acid (ST1926) and 6-[3-(1-adamantyl)-4-hydroxyphenyl] -2-naphthalene carboxylic acid (CD437) in F9 teratocarcinoma: role of retinoic acid receptor gamma and retinoid-independent pathways. Mol Pharmacol. 2006;70:909–924. doi: 10.1124/mol.106.023614. [DOI] [PubMed] [Google Scholar]
- 51.Abdueva D, Wing M, Schaub B, Triche T, Davicioni E. Quantitative expression profiling in formalin-fixed paraffin-embedded samples by affymetrix microarrays. J Mol Diagn. 2010;12:409–417. doi: 10.2353/jmoldx.2010.090155. [DOI] [PMC free article] [PubMed] [Google Scholar]
- 52.Furniss CS, Bennett RN, Bacon JR, LeGall G, Mithen RF. Polyamine metabolism and transforming growth factor-beta signaling are affected in Caco-2 cells by differentially cooked broccoli extracts. J Nutr. 2008;138:1840–1845. doi: 10.1093/jn/138.10.1840. [DOI] [PubMed] [Google Scholar]
- 53.Stratton MR, Campbell PJ, Futreal PA. The cancer genome. Nature. 2009;458:719–724. doi: 10.1038/nature07943. [DOI] [PMC free article] [PubMed] [Google Scholar]
- 54.Cerami E, Gao J, Dogrusoz U, Gross BE, Sumer SO, Aksoy BA, Jacobsen A, Byrne CJ, Heuer ML, Larsson E, Antipin Y, Reva B, Goldberg AP, Sander C, Schultz N. The cBio cancer genomics portal: an open platform for exploring multidimensional cancer genomics data. Cancer Discov. 2012;2:401–404. doi: 10.1158/2159-8290.CD-12-0095. [DOI] [PMC free article] [PubMed] [Google Scholar]
- 55.Gao J, Aksoy BA, Dogrusoz U, Dresdner G, Gross B, Sumer SO, Sun Y, Jacobsen A, Sinha R, Larsson E, Cerami E, Sander C, Schultz N. Integrative analysis of complex cancer genomics and clinical profiles using the cBioPortal. Sci Signal. 2013;6:pl1. doi: 10.1126/scisignal.2004088. [DOI] [PMC free article] [PubMed] [Google Scholar]
- 56.Nelson CH, Buttrick BR, Isoherranen N. Therapeutic potential of the inhibition of the retinoic acid hydroxylases CYP26A1 and CYP26B1 by xenobiotics. Curr Top Med Chem. 2013;13:1402–1428. doi: 10.2174/1568026611313120004. [DOI] [PMC free article] [PubMed] [Google Scholar]
- 57.Sirchia SM, Ren M, Pili R, Sironi E, Somenzi G, Ghidoni R, Toma S, Nicolo G, Sacchi N. Endogenous reactivation of the RARbeta2 tumor suppressor gene epigenetically silenced in breast cancer. Cancer Res. 2002;62:2455–2461. [PubMed] [Google Scholar]
- 58.Albertella MR, Lau A, O’Connor MJ. The overexpression of specialized DNA polymerases in cancer. DNA Repair (Amst) 2005;4:583–593. doi: 10.1016/j.dnarep.2005.01.005. [DOI] [PubMed] [Google Scholar]
- 59.Muzi-Falconi M, Giannattasio M, Foiani M, Plevani P. The DNA polymerase alpha-primase complex: multiple functions and interactions. ScientificWorldJournal. 2003;3:21–33. doi: 10.1100/tsw.2003.05. [DOI] [PMC free article] [PubMed] [Google Scholar]
- 60.Prasad G, Edelson RA, Gorycki PD, Macdonald TL. Structure-activity relationships for the inhibition of DNA polymerase alpha by aphidicolin derivatives. Nucleic Acids Res. 1989;17:6339–6348. doi: 10.1093/nar/17.15.6339. [DOI] [PMC free article] [PubMed] [Google Scholar]