

ABSTRACT
Metagenomics analysis of food samples promises isolation-independent detection and subtyping of foodborne bacterial pathogens in a single workflow. The selective concentration of Salmonella genomic DNA by immunomagnetic separation (IMS) and multiple displacement amplification (MDA) shortened the time for culture enrichment of Salmonella-spiked raw chicken breast samples by over 12 h while permitting serotyping and high-fidelity single nucleotide polymorphism (SNP) typing of the pathogen using short shotgun sequencing reads. The herein-termed quasimetagenomics approach was evaluated on Salmonella-spiked lettuce and black peppercorn samples as well as retail chicken parts naturally contaminated with different serotypes of Salmonella. Culture enrichment of between 8 and 24 h was required for detecting and subtyping naturally occurring Salmonella from unspiked chicken parts compared with 4- to 12-h culture enrichment when Salmonella-spiked food samples were analyzed, indicating the likely need for longer culture enrichment to revive low levels of stressed or injured Salmonella cells in food. A further acceleration of the workflow was achieved by real-time nanopore sequencing. After 1.5 h of analysis on a potable sequencer, sufficient data were generated from sequencing the IMS-MDA products of a cultured-enriched lettuce sample to enable serotyping and robust phylogenetic placement of the inoculated isolate.
IMPORTANCE Both culture enrichment and next-generation sequencing remain time-consuming processes for food testing, whereas rapid methods for pathogen detection are widely available. Our study demonstrated a substantial acceleration of these processes by the use of immunomagnetic separation (IMS) with multiple displacement amplification (MDA) and real-time nanopore sequencing. In one example, the combined use of the two methods delivered a less than 24-h turnaround time from the collection of a Salmonella-contaminated lettuce sample to the phylogenetic identification of the pathogen. An improved efficiency such as this is important for further expanding the use of whole-genome and metagenomics sequencing in the microbial analysis of food. Our results suggest the potential of the quasimetagenomics approach in areas where rapid detection and subtyping of foodborne pathogens are important, such as for foodborne outbreak response and the precision tracking and monitoring of foodborne pathogens in production environments and supply chains.
KEYWORDS: Salmonella, detection, subtyping, metagenomics, MinION
INTRODUCTION
The detection and subtyping of foodborne pathogens are typically separate. After a pathogen is detected, further subtyping assays may ensue. According to the United States Food and Drug Administration's bacteriological analytical manual (BAM) (https://www.fda.gov/food/foodscienceresearch/laboratorymethods/ucm2006949.htm) and the U.S. Department of Agriculture Food Safety and Inspection Service's microbiology laboratory guidebook (MLG) (https://www.fsis.usda.gov/wps/portal/fsis/topics/science/laboratories-and-procedures/guidebooks-and-methods/microbiology-laboratory-guidebook/microbiology-laboratory-guidebook), the confirmed detection of bacterial foodborne pathogens from food and environmental samples requires a culture isolation of bacterial isolates and a confirmatory identification by biochemical or molecular tests. The isolation and identification of major bacterial foodborne pathogens take 5 to 7 days or even longer using these isolate-centric workflows. Then, the isolates may be further characterized by a variety of pheno- and genotyping methods (1), which can further increase the laboratory turnaround time.
Faster alternatives for the detection and subtyping of foodborne pathogens have been developed and implemented. A wide array of rapid detection methods, including nucleic acid-based, immunology-based, and biosensor-based techniques, is commercially available for selected pathogens (2). While most of these methods still require culture enrichment for 8 to 48 h, they typically enable a much faster presumptive detection of specific pathogens in certain food matrices than culture-based detection methods. The routine use of whole-genome sequencing (WGS) promises a substantial reduction of the time and cost for public health laboratories by providing a one-stop platform for various subtyping methods. Using WGS data, multiple subtyping analyses can be integrated into a single in silico workflow, including serotyping (3), single nucleotide polymorphism (SNP) typing (4), multilocus sequence typing (MLST) (5, 6), and antimicrobial resistance profiling (7). However, most rapid detection methods do not yield bacterial isolates, which are required for current practices of WGS. In addition, standard laboratory procedures for WGS, which consist of regrowth of the pathogen, genomic DNA purification, and library preparation in addition to actual sequencing, take 5 to 7 days to complete. That means the entire process from the collection of a contaminated food sample to the determination of the pathogen genome sequences can take up to 10 to 14 days.
Recent studies using metagenomics sequencing demonstrated isolation-independent detection and subtyping of Shiga toxin-producing Escherichia coli (STEC) from spinach (8, 9). The direct capture and characterization of STEC genomic sequences was made possible by sequencing the metagenomes derived from enrichment cultures of spinach samples. Using this method, pathogen detection and subtyping can be effectively combined into a single workflow uninterrupted by culture isolation.
Such applications also underscored the importance of culture enrichment for a metagenomics analysis of pathogen analytes. In the aforementioned studies, both nonselective preenrichment and selective enrichment with a variety of antibiotics were performed to effectively enrich for STEC (8, 9). In fact, metagenomics sequencing has been used as a tool to evaluate and rationalize culture enrichment methods for detecting STEC on fresh spinach (8), Listeria monocytogenes in ice cream (10), and Salmonella enterica from the tomato phyllosphere (11) and on cilantro (12). These studies collectively suggest that the often low levels of pathogen cells in food samples, the presence of competitive or antagonist organisms against the analyte, and the food processing and storage conditions detrimental to optimal growth of target pathogens can all pose challenges for effective culture enrichment. Therefore, alternative methods to partially replace culture enrichment are needed to improve the efficiency of analyte DNA concentration and to accelerate the workflow of metagenomics food testing.
Besides culture enrichment, sequencing itself is another time-consuming step for detecting foodborne pathogens. A full sequencing run on an Illumina MiSeq platform takes ∼24 to 56 h (150- to 300-bp paired-end reads), whereas rapid pathogen detection methods for the microbiological analysis of food generally involve assays that can be completed within minutes and hours excluding culture enrichment (13). The advent of nanopore sequencing on a portable device has enabled rapid and in-field detection and analysis of clinical pathogens (14). This technology allows real-time analysis of sequencing data as they are being generated, permitting a rapid identification of bacterial and viral pathogens by whole-genome sequencing (15) and metagenomics sequencing (16).
In this study, we aimed to improve and expedite metagenomics detection and subtyping of foodborne pathogens through the selective concentration of analyte DNA and real-time nanopore sequencing of concentrated DNA samples. Using Salmonella-spiked chicken breast as a model system, we first investigated whether culture enrichment could be shortened via targeted cell capture by immunomagnetic separation (IMS) and whole-genome amplification by multiple displacement amplification (MDA). Unlike culture enrichment, which is intrinsically restricted in speed by the length of the cell cycle, MDA provides a rapid and highly efficient alternative to enriching analyte DNA for the molecular detection of bacteria. Using bacteriophage ϕ29 DNA polymerase, MDA was reported to generate sufficient amounts of DNA from single E. coli cells for whole-genome sequencing (17). The ϕ29 DNA polymerase has high processivity (18) and high proofreading activity (19). Its reaction can be performed isothermally at 30°C without the need of a thermocycler. The IMS-MDA method enabled sequencing-based culture-independent detection of Chlamydia trachomatis, an obligate intracellular pathogen, from clinical samples (20). We have recently shown that IMS-MDA led to real-time PCR detection of low levels of Salmonella from raw chicken breast with no or shortened (4 h) culture enrichment (21). Unlike previous studies that were focused on optimizing culture enrichment prior to metagenomics sequencing (8–12, 22), we aimed to reduce the need for culture enrichment via the alternative method of IMS-MDA. To differentiate it from conventional metagenomics sequencing without selective analyte concentration, the shotgun sequencing of IMS-MDA products was termed quasimetagenomics sequencing in this study. We further evaluated the method with Salmonella-spiked iceberg lettuce, black peppercorns, and peanut butter, as well as with naturally contaminated retail chicken parts. Finally, we demonstrated the rapid detection and phylogenetic identification of Salmonella from a lettuce sample using quasimetagenomics sequencing on a MinION device (Oxford Nanopore Technologies, Oxford, UK).
RESULTS
Comparison of culture enrichment methods.
Both buffered peptone water (BPW) (23) and Rappaport-Vassiliadis (RV) broth (24) have been used to enrich Salmonella from chicken. The preenrichment in BPW followed by a selective enrichment in RV was reported to increase the sensitivity of PCR detection of Salmonella in poultry (23). Each medium alone and the combination of both were evaluated to identify optimal conditions for increasing the abundance of S. enterica serotype Enteritidis relative to background flora on raw chicken breast. Real-time PCR threshold cycles (CTs) were used to estimate the relative abundance of S. Enteritidis (21). The CT values were obtained from real-time PCR assays using DNA extracted from enrichment cultures as the PCR templates. After enrichment, S. Enteritidis cells were enumerated on xylose-lysine-tergitol-4 (XLT) agar that is selective for Salmonella. The level of microorganisms after enrichment, including both S. Enteritidis and background flora, was estimated on tryptic soy agar (TSA). As shown in Table S1 in the supplemental material, while BPW was most effective in enriching S. Enteritidis by yielding the lowest CT value and the highest S. Enteritidis count on XLT, it also resulted in the highest level of background flora as measured by the difference between CFU counts on TSA and XLT. The combination of BPW and RV broth was least effective in enriching S. Enteritidis relative to background flora as indicated by the highest CT value. Therefore, RV broth was selected for S. Enteritidis enrichment prior to IMS and MDA because of its balanced performance in enriching S. Enteritidis and in suppressing the excessive growth of background flora.
Effects of IMS, MDA, and IMS-MDA on recovering the S. Enteritidis genome by shotgun sequencing.
After culture enrichment, IMS was used to selectively capture S. Enteritidis cells, and MDA was used to generate DNA from captured cells for shotgun sequencing. Their individual and combined effects on improving the sequencing yield of S. Enteritidis among chicken and microbial DNAs were assessed. When IMS was performed alone without MDA, the DNA extracted from cells that bound to immunomagnetic beads was insufficient for sequencing (below the 10-pg/μg quantification limit of the Qubit HS dsDNA assay). When MDA was used, alone or in combination with IMS, all the resulting DNA samples enabled the construction of libraries for Illumina MiSeq sequencing. The sequencing results were evaluated by multiple metrics as shown in Table 1. The raw reads from all the MDA and IMS-MDA samples enabled an accurate serotype prediction using SeqSero (3). When MDA was used alone without IMS after 12 h of RV broth enrichment, only an average of 4.74% of all sequencing reads were classified as Salmonella. In contrast, using IMS in conjunction with MDA after enrichment substantially increased the percentage of Salmonella reads to an average of 48.14%. The increased sequencing output of Salmonella by IMS-MDA led to substantial improvements in the sequencing parameters for the S. Enteritidis genome. The sequencing depth normalized by 100 million bases of sequencing data increased from 1.01× by MDA to 9.82× by IMS-MDA. The N50 of a draft S. Enteritidis genome assembly using metagenomically classified Salmonella reads increased by 31-fold with the use of IMS-MDA instead of just MDA after RV broth enrichment. The values of normalized sequencing depth and N50 were equivalent to those obtained by WGS of S. Enteritidis genomes prepared from pure cultures (25).
TABLE 1.
Effect of IMS and MDA on selective concentration of Salmonella
| Sample prepna | CT | Output (Mb)b | Coverage (%)c | Depth ratiod | N50e | Serotype | Salmonella reads (%)f | Salmonella abundance (%)g |
|---|---|---|---|---|---|---|---|---|
| RV12-MDAh | 20.12 | 725 | 96.26 | 1.01 | 5106 | Enteritidis | 4.74 | 96.37 |
| RV12-IMS-MDAh | 17.25 | 606 | 99.09 | 9.82 | 156488 | Enteritidis | 48.14 | 99.35 |
| RV4-IMS-MDAh | 22.67 | 546 | 21.61 | 0.12 | N/A | Enteritidis | 0.59 | 31.49 |
| RV8-IMS-MDAh | 24.21 | 607 | 67.60 | 0.78 | 2173 | Enteritidis | 3.83 | 54.63 |
| RV0 | NAi | 140 | 0.27 | 0.00 | NA | NA | 0.02 | 0.05 |
| RV4 | NA | 307 | 0.37 | 0.00 | NA | NA | 0.01 | 0.03 |
| RV8 | NA | 170 | 0.42 | 0.01 | NA | NA | 0.03 | 0.18 |
| RV12h | 25.55 | 162 | 11.04 | 0.10 | 576 | NA | 0.49 | 1.22 |
| RV24h | 14.1 | 254 | 98.87 | 3.60 | 34048 | Enteritidis | 16.74 | 18.00 |
All samples were inoculated with S. Enteritidis at ∼1 CFU/g; RV12, enrichment in RV broth for 12 h; RV12-IMS-MDA, IMS-MDA treatment after 12 h of RV broth enrichment.
Total output size (million bases) of raw reads per sample.
Percentage of S. Enteritidis reference genome (NCBI reference sequence NC_011294.1) that was mapped by sequencing reads.
Average depth of sequencing was calculated as the ratio between the total size of Salmonella sequences per 100 million bases of sequencing data and the size of the S. Enteritidis reference genome.
N50 was calculated from de novo assemblies of sequencing reads classified as Salmonella.
Percentage of Salmonella reads among all sequencing reads.
Percentage of Salmonella reads among all bacterial reads.
Average of two replicate samples.
NA, no result was obtained. For serotyping, the result was recorded as NA unless both replicates were serotyped.
IMS-MDA shortened culture enrichment for quasimetagenomics detection of S. Enteritidis.
To evaluate how IMS-MDA could improve the selective concentration of Salmonella in comparison to that by culture enrichment alone, we further sequenced (i) DNA samples prepared immediately after S. Enteritidis inoculation on chicken breast (∼1 CFU/g) and after RV broth enrichment of the inoculated samples for 4, 8, 12, and 24 h, and (ii) IMS-MDA products after RV broth enrichment for 4, 8, and 12 h. As shown in Fig. 1A and in Table 1, the percentage of Salmonella organisms in the chicken microbiome (i.e., Salmonella abundance) increased slowly in the first 12 h of RV broth enrichment and rose to only 18.00% after culturing for 24 h. In comparison, IMS-MDA treatment after 4 h of enrichment increased Salmonella abundance to 31.49%. Furthermore, RV broth enrichment alone for 12 h enabled only 11.04% of the target S. Enteritidis genome to be sequenced, while IMS-MDA was able to recover 21.61% of the genome after only 4 h of enrichment and almost the entire genome (99.09%) after 12 h of enrichment (Fig. 1B and Table 1). IMS-MDA also improved the overall Salmonella sequencing output among all sequencing reads, including those from chicken DNA. Forty-eight percent of all sequencing reads were classified as Salmonella after 12 h of RV broth enrichment followed by IMS-MDA compared with 16.74% after 24 h of RV broth enrichment alone (Fig. 1C and Table 1). These results showed that IMS-MDA, a 2- to 3-h process, could reduce culture enrichment by at least 12 h as evaluated by different descriptive measures.
FIG 1.

Comparison of quasimetagenomics sequencing performance using different sample preparation methods. (A) Percentages of sequences from Salmonella and other individual genera among all microbial sequences generated by sequencing. Results from various sample preparation methods were evaluated. RV_8h, enrichment by RV broth for 8 h; RV-IMS-MDA_4h, enrichment by RV broth for 4 h followed by IMS and MDA. (B) Percentages of the S. Enteritidis (SE) reference genome that were sequenced by the quasimetagenomics approach using DNA samples prepared from RV broth enrichment alone and RV broth enrichment followed by IMS-MDA. (C) Percentages of Salmonella reads among all sequencing reads, including host/chicken DNA. DNA samples were prepared from RV broth enrichment alone and RV broth enrichment followed by IMS-MDA. In all samples, ∼1 CFU/g of S. Enteritidis was inoculated in each 25-g aliquot of raw chicken breast.
Detection and high-fidelity subtyping by shotgun sequencing following IMS-MDA.
The ability of the quasimetagenomics approach to distinguish the spiked analyte from other S. Enteritidis strains was evaluated using the Center for Food Safety and Applied Nutrition (CFSAN) SNP pipeline (26). In addition to the raw chicken breast samples that were inoculated with the S. Enteritidis strain at ∼1 CFU/g as previously described, samples with additional inoculum levels at ∼0.1 and 10 CFU/g were prepared and analyzed. An uninoculated sample was enriched for 12 h before going through the entire IMS-MDA and shotgun sequencing process as a negative control. The sample was further confirmed to be Salmonella negative by culture enrichment (data not shown). The results from all the samples are summarized in Table 2.
TABLE 2.
Quasimetagenomics sequencing of S. Enteritidis from raw chicken breast at different inoculation levels and after different culture enrichment durations
| Sample prepna | Inoculum (CFU/g) | CT | Output (Mb)b | Coverage (%)c | Depth ratiod | N50e | Serotype | Salmonella reads (%)f | Salmonella abundance (%)g |
|---|---|---|---|---|---|---|---|---|---|
| 4-h enrichment | |||||||||
| RV4-IMS-MDA | 0.1 | 28.76 | 487 | 10.72 | 0.08 | NAh | NA | 0.38 | 18.37 |
| RV4-IMS-MDA | 1 | 22.67 | 546 | 21.61 | 0.12 | NA | Enteritidis | 0.59 | 31.49 |
| RV4-IMS-MDA | 10 | 20.08 | 480 | 72.66 | 0.64 | 1,461 | Enteritidis | 3.15 | 68.49 |
| 8-h enrichment | |||||||||
| RV8-IMS-MDA | 0.1 | 25.52 | 597 | 33.13 | 0.16 | NA | Enteritidis | 0.77 | 39.95 |
| RV8-IMS-MDA | 1 | 24.21 | 607 | 67.60 | 0.78 | 2,173 | Enteritidis | 3.83 | 54.63 |
| RV8-IMS-MDA | 10 | 19.64 | 583 | 99.04 | 8.23 | 104,352 | Enteritidis | 39.8 | 99.46 |
| 12-h enrichment | |||||||||
| RV12-IMS-MDA | 0.1 | 19.73 | 515 | 92.92 | 4.48 | 71,749 | Enteritidis | 21.66 | 97.77 |
| RV12-IMS-MDA | 1 | 17.25 | 606 | 99.09 | 9.82 | 156,488 | Enteritidis | 48.14 | 99.35 |
| RV12-IMS-MDA | 10 | 16.83 | 783 | 99.10 | 11.46 | 337,433 | Enteritidis | 54.76 | 99.55 |
| Negative control | NA | NA | 833 | 0.02 | 0.00 | NA | NA | 0.15 | 0.15 |
All results (except for the negative control) are reported as the averages from two replicates.
Total output size (million bases) of raw reads per sample.
Percentage of S. Enteritidis reference genome (NCBI reference sequence NC_011294.1) that was mapped by sequencing reads.
Average depth of sequencing was calculated as the ratio between the total size of Salmonella sequences per 100 million bases of sequencing data and the size of the S. Enteritidis reference genome.
N50 was calculated from de novo assemblies of sequencing reads classified as Salmonella.
Percentage of Salmonella reads among all sequencing reads.
Percentage of Salmonella reads among all bacterial reads.
NA, no result was obtained. For serotyping, the result was recorded as NA unless both replicates were serotyped.
An average of 569 Mb of sequences was generated from the inoculated samples by shotgun sequencing on an Illumina MiSeq instrument, which accounted for ∼5% of the total output of a MiSeq run (MiSeq reagent kit V3, according to the manufacturer's specifications).
Accurate serotype predictions using the sequencing reads were achieved for all the inoculated samples except when the lowest inoculation level (0.1 CFU/g) was coupled with the shortest culture enrichment duration (4 h). The lowest sequencing coverage permitting serotyping from Illumina reads was 21.61%. At least 10% of the reference S. Enteritidis genome was recovered by quasimetagenomics sequencing of the inoculated samples. The minimum sequencing coverage of an inoculated sample was 10.72%, which was obtained at the lowest inoculum level of 0.1 CFU/g with shortest culture enrichment of 4 h. When 12 h of culture enrichment was performed, more than 90% of the S. Enteritidis genome was mapped by sequencing reads at all inoculation levels. In contrast, 0.02% of the reference genome was mapped by the sequencing reads from the negative-control sample.
For each inoculated sample, a core genome SNP phylogeny was constructed to include the quasimetagenomics sample and a total of 52 S. Enteritidis isolates representing 16 major outbreaks and 3 sporadic cases in the United States between 2001 and 2012 (4). As shown in Fig. 2, tight clustering of the quasimetagenomics sample (target) and the WGS sample of the spiked strain (reference) was achieved in all the nine combinations of inoculation levels and culture enrichment durations, indicating the equivalence of the two methods in supporting core-genome SNP typing. When spiked chicken samples were culture enriched for 12 h, a perfect match between each pair of quasimetagenomics and WGS samples was observed with a 0-SNP distance in between (Fig. 2). Besides the clustering of the quasimetagenomics and WGS samples, the rest of the phylogenetic tree was congruent across all the trials. These results suggest that high-fidelity subtyping with phylogenetic discrimination can be achieved by the quasimetagenomics approach with culture enrichment for 12 h or shorter, even when the contamination level was low (∼0.1 CFU/g).
FIG 2.

Phylogenetic clustering of the spiked chicken breast samples sequenced by the quasimetagenomics method (target) on an Illumina MiSeq platform and the genomes of recent outbreak and sporadic strains. The WGS of the spiked strain (reference) is also included. Each of the 9 dotted-line boxes shows the highlighted part of the respective tree that includes the target and reference and corresponds to a specific combination of inoculum level (0.1, 1, or 10 CFU/g) and RV broth enrichment time (4, 8, or 12 h). Bars represent unit distances of 2, 5, or 50 SNPs.
Detection and subtyping of Salmonella from unspiked retail raw chicken meat.
The performance of the quasimetagenomics approach was further assessed by analyzing naturally contaminated retail chicken samples. As opposed to spiked samples, the naturally contaminated samples were retail products that had been contaminated by Salmonella during production. A total of 76 retail chicken part samples (25-g aliquots), including breasts (n = 24), wings (n = 27), thighs (n = 12), drumsticks (n = 9), ground chicken (n = 2), gizzards (n = 2), and hearts (n = 2), were screened for Salmonella by RV broth enrichment. In parallel, IMS-MDA real-time PCR was performed after 4, 8, 12, and 24 h of enrichment (21). Salmonella was isolated from three wing samples by culture enrichment. WGS of the isolated strains was performed, and their serotypes were determined to be Enteritidis (sample A), Typhimurium (sample B), and Heidelberg (sample C) using WGS data (Table 3).
TABLE 3.
Quasimetagenomics detection and serotyping of Salmonella in unspiked raw chicken parts
| Sample prepn | MPN/g | CT | Output (Mb)a | Coverage (%)b | Depth ratioc | N50d | Serotype | Salmonella reads (%)e | Salmonella abundance (%)f |
|---|---|---|---|---|---|---|---|---|---|
| Sample A | |||||||||
| RV8-IMS-MDA | 43 | 23.30 | 227 | 13.31 | 0.41 | 665 | Enteritidis | 1.74 | 9.87 |
| RV12-IMS-MDA | 43 | 17.60 | 248 | 61.00 | 0.88 | 731 | Enteritidis | 4.08 | 8.31 |
| Sample B | |||||||||
| RV24-IMS-MDA | <3 | 22.20 | 245 | 89.25 | 1.74 | 2,121 | Typhimurium | 8.26 | 9.79 |
| Sample C | |||||||||
| RV24-IMS-MDA | <3 | 25.24 | 289 | 12.53 | 0.31 | 2,169 | NAg | 1.35 | 2.41 |
Total output size (million bases) of raw reads per sample.
Percentage of S. Enteritidis reference genome (NCBI reference sequence NC_011294.1) that was mapped by sequencing reads.
Average depth of sequencing was calculated as the ratio between the total size of Salmonella sequences per 100 million bases of sequencing data and the size of the S. Enteritidis reference genome.
N50 was calculated from de novo assemblies of sequencing reads classified as Salmonella.
Percentage of Salmonella reads among all sequencing reads.
Percentage of Salmonella reads among all bacterial reads.
No result was obtained, but was determined as serotype Heidelberg by WGS.
The same three samples were also determined to be Salmonella positive by IMS-MDA real-time PCR and were further analyzed using a three-tube most probable number (MPN) method (Table 3). Using IMS-MDA real-time PCR, Salmonella was first detected after 8 h of enrichment in sample A and after 24 h of enrichment in samples B and C. The longer enrichment time required by samples B and C was likely due to the low level of Salmonella contamination (MPN of <3/g) compared with that in sample A (MPN of 43/g). Quasimetagenomics sequencing was performed on selected IMS-MDA products prepared from positive wing samples. As shown in Table 3 and Fig. S1, correct serotyping (Enteritidis and Typhimurium) and accurate phylogenetic placement were achieved from sample A and sample B. Sample C had a low sequencing coverage of 12.53%, which did not permit serotyping and strain-level phylogenetic placement (data not shown). Instead, the genome distance between sample C and a set of 258 complete Salmonella reference genomes of 57 serotypes was estimated using Mash (27). The eight closest genomes to sample C were all of serotype Heidelberg (see Table S2), supporting the detection and preliminary identification of a Heidelberg isolate from this sample.
Detection and subtyping of S. Enteritidis from other selected food samples.
In addition to raw chicken parts, the IMS-MDA-shotgun sequencing method was further evaluated with other selected food samples, including lettuce, black peppercorn, and peanut butter, all of which were linked to recent Salmonella outbreaks (28–30). With 12 h of culture enrichment, strain-level high-fidelity subtyping was achieved in both lettuce and peppercorn samples at all inoculation levels (∼0.1, 1, and 10 CFU/g) as shown by the clustering of IMS-MDA shotgun sequencing and in WGS samples with a 0- or 1-SNP distance (Table 4; see also Fig. S2). While IMS-MDA enabled a real-time PCR detection of S. Enteritidis from peanut butter samples at all inoculation levels after 12 h of culture enrichment (data not shown), the CT values were 25 or higher, and insufficient DNA samples were obtained for shotgun sequencing. The high fat content in peanut butter likely compromised the effective capture of S. Enteritidis by IMS beads.
TABLE 4.
Quasimetagenomics detection and serotyping of S. Enteritidis on inoculated black pepper and lettuce samples
| Sample and inoculum (CFU/g) | CT | Output (Mb)a | Coverage (%)b | Depth ratioc | N50d | Serotype | Salmonella reads (%)e | Salmonella abundance (%)f |
|---|---|---|---|---|---|---|---|---|
| Black pepper | ||||||||
| 0.1 | 17.30 | 199 | 99.06 | 20.63 | 226,848 | Enteritidis | 97.58 | 99.83 |
| 1 | 18.70 | 343 | 99.10 | 20.52 | 117,116 | Enteritidis | 96.28 | 99.27 |
| 10 | 18.70 | 385 | 99.11 | 20.62 | 7,544 | Enteritidis | 96.22 | 99.57 |
| Lettuce | ||||||||
| 0.1 | 19.70 | 345 | 98.76 | 8.21 | 49,289 | Enteritidis | 38.33 | 99.12 |
| 1 | 16.20 | 332 | 99.06 | 19.40 | 70,588 | Enteritidis | 90.49 | 99.91 |
| 10 | 15.50 | 354 | 99.08 | 20.65 | 175,495 | Enteritidis | 96.49 | 99.93 |
Total output size (million bases) of raw reads per sample.
Percentage of S. Enteritidis reference genome (NCBI reference sequence NC_011294.1) that was mapped by sequencing reads.
Average depth of sequencing was calculated as the ratio between the total size of Salmonella sequences per 100 million bases of sequencing data and the size of the S. Enteritidis reference genome.
N50 was calculated from de novo assemblies of sequencing reads classified as Salmonella.
Percentage of Salmonella reads among all sequencing reads.
Percentage of Salmonella reads among all bacterial reads.
Rapid quasimetagenomics detection and subtyping of S. Enteritidis from lettuce using MinION sequencing.
IMS-MDA products prepared after 12 h of culture enrichment from a spiked lettuce sample (1 CFU/g) were sequenced on a MinION device. Sequencing data were collected hourly until the full run finished after 48.5 h. The same sample had been sequenced on a MiSeq platform (Table 4). After 1.5 h of sequencing, a total of 14,760 one direction (1D) and two direction (2D) reads with an average length of 2,362 bp were generated. These reads covered 65.19% of the S. Enteritidis reference genome and enabled an accurate prediction of its serotype as Enteritidis (see Table S3). Using core-genome SNP typing, the MinION quasimetagenomics sample was accurately placed on the phylogenetic tree that included 52 previously described outbreak and clinical S. Enteritidis isolates. As shown in Fig. 3, the 1.5-h MinION sample clustered closely with the WGS reference of the inoculated isolate. Similar results were obtained using MinION data after 48.5 h of sequencing (Fig. 3), which contained 197,070 1D and 2D reads with an average length of 2,388 bp. The SNP distances between the quasimetagenomics sample and the WGS reference were 70 and 65 after 1.5 h and 48.5 h of MinION sequencing, respectively.
FIG 3.
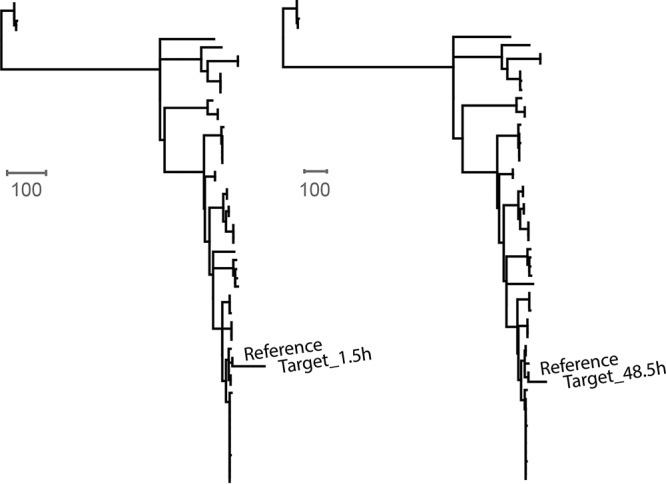
Phylogenetic clustering of a spiked lettuce sample sequenced by the quasimetagenomics method on a MinION device after 1.5 h (target_1.5 h) and 48 h (target_48.5 h) of sequencing. The WGS of the spiked strain (reference) is also included. Bars represent a unit distance of 100 SNPs on the tree.
Correlation between CT value and sequencing coverage.
Prior to shotgun sequencing on an Illumina MiSeq instrument, all the IMS-MDA processed samples (n = 28) in this study were analyzed by real-time PCR. The resulting CT values displayed a positive correlation with shotgun sequencing coverage (R2 = 0.76) (Fig. 4). This observation suggests that the CT value is a useful indicator of target genome output by shotgun sequencing. When CT values were lower than 25, the majority (>50%) of the S. Enteritidis genome was likely to be sequenced. Serotype prediction from raw sequencing reads was successful in every sample tested in the study when the CT value was below 26. Therefore, CT values can be used as a performance parameter for developing and optimizing the quasimetagenomics method or as a quality check before committing to sequencing.
FIG 4.
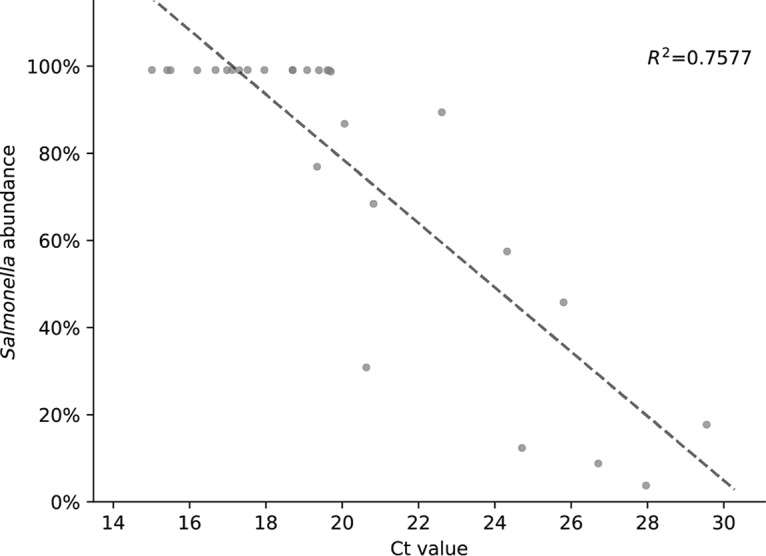
Positive correlation between percentages of the target genome sequenced by the quasimetagenomics approach (x axis) and the CT values from real-time PCR analysis of the IMS-MDA products (y axis). A total of 28 samples were analyzed.
DISCUSSION
The conventional metagenomics approach relies on deep sequencing to identify low-abundant microbial species directly from environmental samples. This strategy can be impractical, if not ineffective, for detecting low levels of bacterial pathogen contaminants in food samples. As shown by previous studies (8–12), an adequate concentration of pathogen analytes prior to sequencing is critical for metagenomics identification of the pathogen sequences. Culture enrichment alone was used in these studies to concentrate target pathogen cells. Given sufficient time, when the analyte rose to become a dominant species in the enrichment culture, nearly full recovery of the analyte genome could be achieved from sequencing enriched samples. This enabled a variety of subtyping analyses to be performed on shotgun metagenomics data, generating rich information about the analyte in addition to its detection. In this study, we improved and accelerated the isolation-independent shotgun sequencing-based detection and subtyping of Salmonella from selected food samples using selective enrichment of the analyte genomic DNA by IMS-MDA real-time nanopore sequencing by MinION and streamlined bioinformatics analysis of sequencing data.
First, culture enrichment time was substantially shortened by IMS-MDA. While necessary and effective in the microbial analysis of food samples, culture enrichment alone can be time consuming, especially when low levels of pathogen contaminants are present in food samples together with competing flora and, in some cases, antimicrobial substances. With an approximate detection sensitivity of <103 CFU/g (13), IMS enabled the selective capture of Salmonella cells before they reached high abundances in the enrichment culture. Subsequent MDA generated sufficient genomic DNA for shotgun sequencing from small amounts of captured cells. This method differed from those of previous studies that focused on optimized media to shorten target pathogen enrichment. For example, it was recently reported that nonselective preenrichment could reduce the levels of inoculated competitive bacteria, enabling an early Salmonella recovery (22). The shorter enrichment time enabled by IMS-MDA also helped address culture enrichment biases unfavorable for Salmonella detection, such as the microbiota shift from Proteobacteria, which includes Salmonella, to Firmicutes after extended (24 h) culturing (11, 12, 31). As shown in Fig. 1A and B, when using RV broth enrichment alone, sharp increases of both sequencing coverage and percentage of Salmonella reads occurred between 12 h and 24 h of culturing, indicating the start and continuation of the exponential phase of the Salmonella growth cycle. IMS-MDA enabled strain-level phylogenetic placement of the spiked isolate after only 4 h of enrichment (Fig. 2), likely before the majority of S. Enteritidis cells entered the exponential phase. After 12 h of enrichment when the S. Enteritidis population appeared to be at the beginning or at an early stage of exponential phase, IMS-MDA led to 99.09% coverage and a 9.82× average sequencing depth of the S. Enteritidis genome (Table 1). In comparison, an only 3.60× average sequencing depth was obtained by sequencing the metagenome of the 24-h enrichment culture without IMS-MDA (Table 1). Besides the demonstrated efficiency in selective concentration of Salmonella genomic DNA, both IMS and MDA are mature techniques featuring acceptable costs, rapid turnaround, and straightforward procedures. IMS is included in the Food Safety and Inspection Service (FSIS) MLG method for the selective capture of E. coli O157:H7 and non-O157 Shiga toxin-producing E. coli. MDA has been widely used to isothermally amplify low concentration DNA samples for metagenomics sequencing (8).
As shown in Fig. 2, the SNP distance between the quasimetagenomics sample (target) and the WGS of the inoculated strain (reference) was dependent upon inoculation level and enrichment time. A perfect match (i.e., 0-SNP distance) between the target and the reference was observed when 12-h enrichment was performed regardless of the inoculation level and when 8-h enrichment was performed with a 10 CFU/g inoculum (Fig. 2). In such cases, the genome coverage by quasimetagenomics sequencing was above 90% (Table 2). Therefore, we recommend the use of genome coverage as an empirical quality metric to interpret quasimetagenomics sequencing data, especially when high-fidelity SNP typing is needed, such as during outbreak investigations. Our results suggested that when over 90% of genome coverage was achieved, the quasimetagenomics sequencing data were equivalent to those of WGS of pure cultures for genome-wide SNP typing. Totals of 5 (8-h enrichment/0.1 CFU/g inoculum), 6 (8-h enrichment/1 CFU/g inoculum), and 7 (4-h enrichment/10 CFU/g inoculum) SNPs were identified between the target and the reference (Fig. 2) when the genome coverage ranged from 33% to 73% (Table 2). While a SNP distance smaller than 10 SNPs was commonly used in surveillance and outbreak investigations to determine epidemiologically related isolates (32, 33), caution should be taken when evaluating the SNP distance obtained from quasimetagenomics data when the genome coverage is less optimal. When low inoculation levels (0.1 and 1 CFU/g) were combined with the shortest enrichment duration of 4 h, only a fraction of the S. Enteritidis genome was recovered (11% and 22%, respectively) (Table 2). SNP distances obtained from such low genome coverages may not be used as a reliable quantitative measure of genetic relatedness. Despite this, the target and the reference still clustered among sampled outbreak and sporadic isolates (Fig. 2), suggesting that enough SNPs were captured to reconstruct the phylogeny of the analyzed isolates. This finding is consistent with a previous report showing that partial SNP genotypes obtained from low-coverage genome data sets enabled an accurate phylogenetic placement of bacterial strains (34). Similar results were obtained when analyzing naturally contaminated chicken samples. Robust genome-wide SNP typing was possible when 12- and 24-h enrichment was performed (Fig. S1), leading to 61% and 89% genome coverage, respectively (Table 3).
By concentrating Salmonella cells and amplifying the target genomic DNA, the IMS-MDA technique significantly changed the taxonomic composition of the food metagenome (Fig. 1A). Shotgun sequencing after IMS-MDA was hence termed quasimetagenomics sequencing to reflect the much reduced microbial diversity due to the IMS-MDA treatment.
The quasimetagenomics approach was shown to be effective in detecting and subtyping naturally occurring Salmonella of three serotypes in retail chicken samples. For two positive samples, an extended culture enrichment up to 24 h was needed for phylogenetic placement using quasimetagenomics sequencing data. Salmonella contamination levels in both samples were determined to be low at an MPN of <3/g (MLG appendix 2.05). For the third positive sample with an MPN of 43/g, 8 h of enrichment was sufficient to enable both serotyping and phylogenetic placement of the Salmonella contaminant. These results stressed the importance of culture enrichment. Key performance parameters of quasimetagenomics sequencing, such as the limit of detection and coverage of the analyte genome, were affected by the effectiveness of culture enrichment, which increased with enrichment duration. The duration of culture enrichment required to achieve a certain limit of detection depends on multiple factors, such as the food microbiome composition, the type of food matrix, the length of the lag phase, and the growth dynamics of the target pathogen (10). Therefore, optimizations of culture enrichment and sample preparation methods are needed for specific food samples and pathogens.
Second, further acceleration of the quasimetagenomics analysis was achieved by using nanopore real-time sequencing on a MinION device. The total turnaround time from the collection of the spiked lettuce sample to the phylogenetic placement of the inoculated strain was less than 24 h, including 12 h for culture enrichment, 3 h for IMS-MDA, 4 h for sequencing library preparation, and 1.5 h for sequencing. Notably, extending MinION sequencing to a complete run for 48.5 h resulted in only a minor improvement in core SNP typing accuracy, with the SNP distance between the quasimetagenomics sample and the WGS of the inoculated strain reduced from 70 to 65. The error rate of MinION long reads was still substantially higher than that of Illumina short reads. The same quasimetagenomics sample sequenced on a MiSeq platform had a 0-SNP distance compared with the WGS reference (Fig. S2). Despite these errors, the MinION reads acquired after only 1.5 h of quasimetagenomics sequencing supported a robust phylogenetic identification of the spiked strain, indicating MinION′s potential as a rapid and nimble alternative to Illumina platforms for the screening of Salmonella from food samples. In comparison, a full Illumina MiSeq run takes ∼39 h to complete and generates an output of ∼8 Gb (250-bp paired-end reads, according to the manufacturer's specifications), which is enough to accommodate ∼14 quasimetagenomics samples based on the average size of the MiSeq sequenced samples (569 Mb) in this study. Therefore, sequencing on Illumina platforms is cost and time effective when operated in a high-throughput manner.
Finally, standard bioinformatics tools and pipelines were used for sequencing data analyses. Regardless of the sequencing platforms, taxonomic identification was performed on raw sequencing reads using Kraken (35), Salmonella serotyping was performed using SeqSero (3), and strain-level subtyping was performed using the CFSAN SNP pipeline (26). After the extraction of Salmonella reads according to the taxonomic labels assigned by Kraken, the analytical workflow largely overlaps with that of WGS-based subtyping of Salmonella, an increasingly routine practice for Salmonella surveillance. In fact, the selective concentration of Salmonella genomic DNA by IMS-MDA reduced the microbial diversity of the quasimetagenome to facilitate bioinformatics analysis using the aforementioned tools.
As a limitation of this study, we did not test a sample that had been cocontaminated by different strains, as in the case of a recent papaya outbreak that involved Salmonella strains of multiple serotypes (https://www.cdc.gov/salmonella/kiambu-07-17/index.html). The potential and limits of subtyping multiple strains in the same sample using a metagenomics approach need to be investigated in future studies.
MATERIALS AND METHODS
Microorganism.
A S. Enteritidis strain (CFS039) was isolated from a poultry source in Georgia and used throughout the study. Cultures of the S. Enteritidis strain isolated from a poultry source were prepared by growing the stock culture in tryptic soy broth ([TSB] Difco Laboratories, Detroit, MI) overnight at 37°C before inoculation. To obtain viable Salmonella counts, 10-fold serial dilutions of overnight cultures were made in phosphate-buffered saline ([PBS] pH 7.2; Amresco, Cleveland, OH), and 100 μl of the dilutions was plated on TSA (Difco Laboratories). The plates were incubated at 37°C overnight, and then single colonies were enumerated from the appropriate dilutions.
Inoculation of S. Enteritidis to chicken breast, lettuce, black peppercorns, and peanut butter and sample preparation.
Raw chicken breast, iceberg lettuce, black peppercorns, and peanut butter were purchased from grocery stores in Athens, Georgia, on 22 May 2017. According to MLG 4.09, 25-g portions of food samples were aseptically placed in sterile Whirl-pak filter bags (Nasco, Fort Atkinson, WI) and then inoculated with 2 ml of S. Enteritidis inocula of different concentrations. Inocula were prepared from 10-fold serial dilutions of overnight 37°C tryptic soy broth cultures in PBS. Each 2-ml inoculum was evenly placed on the surface of each food sample in approximately 5 drops. Then, the inoculated food sample within the Whirl-pak bag was hand massaged for 1 min to enable homogenous distribution of the inoculum. Uninoculated food samples were also prepared by adding 2 ml of PBS as negative controls.
Culture enrichment.
To compare culture enrichment methods, chicken samples (25 g each) were inoculated with S. Enteritidis at the level of ∼1 CFU/g of chicken. The samples were divided into three groups according to different enrichment methods: (i) enrichment in 225 ml of buffered peptone water ([BPW] Difco Laboratories) at 37°C for 12 h, (ii) enrichment in 225 ml of Rappaport-Vassiliadis (RV) broth (Oxoid, Basingstoke, Hampshire, UK) at 42°C for 12 h, and (iii) enrichment in 225 ml of BPW at 37°C for 6 h followed by the transferring of 1 ml of enriched BPW culture to 10 ml of RV broth and incubating at 42°C for 6 h. The samples were homogenized by hand massage for 30 s in 225 ml of BPW or RV broth. After incubating, enriched media were 10-fold serially diluted in PBS, and 100 μl of each of the dilutions was plated on XLT and TSA. In addition, DNA was extracted from 1 ml of enriched medium using a DNeasy blood and tissue kit (Qiagen, Valencia, CA), and real-time PCR was performed for the relative quantification of Salmonella as previously described (18).
For sequencing, all food samples, including raw chicken breast, lettuce, black peppercorns, and peanut butter (25 g each), inoculated with S. Enteritidis at the level of ca. 0.1, 1, and 10 CFU/g were homogenized by hand massage for 30 s in 225 ml RV broth and incubated at 42°C for 12 h. Homogenates of 50-ml aliquots were collected after 4, 8, and 12 h of enrichment.
IMS-MDA.
Before IMS-MDA, the 50-ml homogenates were centrifuged at 100 × g for 10 min to remove solid debris. Then, each supernatant was carefully recovered and centrifuged at 3,000 × g for 10 min to harvest the cell pellet. The pellet was resuspended in 5 ml of BPW.
IMS and MDA were performed using anti-Salmonella Dynabeads (2.5-μm diameter; Thermo Fisher Scientific, Waltham, MA, USA) and an Illustra GenomiPhi V2 DNA amplification kit (GE Healthcare Life Sciences, Piscataway, NJ, USA), respectively, as previously described (18). For IMS, 1 ml of the resuspended cell pellet in BPW was incubated with 20 μl of beads at room temperature using a rotating mixer (Thermo Fisher Scientific) for 30 min. After incubating, the bead-Salmonella complexes were magnetically separated from the suspension using a magnetic particle concentrator (Thermo Fisher Scientific) for 3 min, and then washed three times with 1 ml of PBS containing 0.05% (vol/vol) Tween 20 (Thermo Fisher Scientific) to remove nonspecifically binding bacteria from the complex.
The bead-Salmonella complexes from IMS were resuspended in 9 μl of sample buffer and incubated at 95°C for 3 min for denaturation for MDA. After cooling to 4°C on ice, 9 μl of reaction buffer and 1 μl of enzyme mix were added to each sample on ice to enable annealing of random hexamer primers. The sample buffer, reaction buffer, and enzyme mix were supplied by the Illustra GenomiPhi V2 DNA amplification kit (GE Healthcare Life Sciences). After incubating at 30°C for 2 h for amplification, the samples were heated to 65°C for 10 min to inactivate the ϕ29 DNA polymerase and cooled to 4°C on ice. Then, the final products (approximately 20 μl) were stored at −20°C until they were used for real-time PCR and whole-genome sequencing.
Real-time PCR.
For real-time PCRs, MDA product (2 μl) was added to 18 μl of a PCR mixture. The mixture contained TaqMan Universal PCR master mix (10 μl; Thermo Fisher Scientific), forward primer (2 μl, 900 nM), reverse primer (2 μl, 900 nM), probe (2.5 μl, 250 nM), and distilled water (2 μl). The sequences for the Salmonella-specific oligonucleotide primers and probe were designed to amplify a 94-bp segment of the ttr gene (GenBank accession no. AF_282268) (27). An optimized real-time PCR protocol was used that specified two holding periods, one at 50°C for 2 min and another at 95°C for 10 min, followed by 40 cycles of 95°C for 15 s and 60°C for 60 s. The threshold cycle (CT), which is the intersection between each fluorescence curve and a threshold line, was calculated using StepOne real-time PCR software version 2.0 (Thermo Fisher Scientific). Negative results corresponded to CT values ≥40 or samples with CT values higher than that of negative control.
Preparation of unspiked retail chicken part samples.
A total of 76 chicken parts, including breasts (n = 24), wings (n = 27), thighs (n = 12), drumsticks (n = 9), ground chicken meats (n = 2), and gizzards and hearts (n = 2), were purchased from grocery stores in Athens, Georgia, between 29 March and 23 April 2017. Each sample (25 g) was homogenized in 225 ml of RV broth and incubated at 42°C for 24 h. Then, 50 ml from each of the homogenates was collected after 4, 8, 12, and 24 h of enrichment and used for IMS-MDA.
MPN and culture-based detection of Salmonella from unspiked chicken samples.
A 3-tube MPN assay using 0.1, 0.01, and 0.001 ml was performed to estimate the Salmonella contamination levels of three Salmonella-positive wing samples according to the MPN procedure of the MLG with the modification of using 225 ml RV broth instead of BPW to rinse the samples, as RV broth was used as the enrichment broth in this study. Salmonella organisms were isolated by culture enrichment according to MLG 4.09 with the modification that preenrichment was carried out in RV broth at 42°C instead of in BPW at 37°C. After a 24-h preenrichment, aliquots of 0.1 ml RV broth cultures were transferred to 10 ml of Rappaport-Vassiliadis soya (RVS) broth (Oxoid, Basingstoke, Hampshire, UK) and Muller–Kauffmann tetrathionate–novobiocin (MKTTn) broth (Oxoid) and incubated for 24 h at 42°C. After the selective enrichment, a loopful of each enriched sample was streaked on differential media, XLT and Brilliant green sulfa agar ([BGS] contains 0.1% sodium sulfapyridine; Oxoid). The presumptive Salmonella colonies from the selective agar were plated on TSA, followed by confirmation using real-time PCR.
Shotgun sequencing on MiSeq.
Sample DNA concentrations were determined using a Qubit BR dsDNA assay kit (Invitrogen). Concentrations were diluted to 0.2 ng/μl and libraries were prepared following the Illumina Nextera XT DNA library prep kit reference guide with the following exceptions. Forty microliters of PCR product was transferred to a new MIDI plate, and 20 μl of AMPure XP beads (Beckman Coulter) was added to each well and incubated at room temperature for 5 min without shaking. After 80% ethanol washes, beads were allowed to air dry for 12 min. Then, the beads were resuspended in 53 μl of reticulocyte standard buffer (RSB) and incubated at room temperature for 2 min without shaking.
The concentrations of sample libraries were determined using the Qubit dsDNA HS assay kit (Invitrogen), and libraries were diluted to a 2 nM concentration and combined in equal volumes to form the pooled library. The pooled library was denatured to obtain a 10 pM final library according to the Illumina denature and dilute libraries guide protocol A. Six hundred microliters of the denatured 10 pM library was loaded into the MiSeq reagent cartridge.
Shotgun sequencing on MinION.
The DNA library was prepared according to the 2D low-input genomic DNA protocol for MinION (SQK-LSK208; Oxford Nanopore Technologies). Briefly, each IMS-MDA product was sheared using a Covaris g-tube (Covaris) to obtain 8-kb fragments. Fragments were end repaired using an NEBNext Ultra II end-repair kit (New England BioLabs) and cleaned using AMPure XP beads and two 70% ethanol washes. End-prepped DNA was mixed with a blunt/TA ligase master mix and PCR adapters, and then incubated at room temperature for 10 min. Samples were cleaned again with AMPure beads and two 70% ethanol washes. The adapted DNA was mixed with 2× LongAmp Taq master mix (New England BioLabs) and a PCR was run for 18 cycles. The above-described cleaning steps and end repair were performed on the resulting PCR products. A ligation reaction was performed using TA ligase master mix (New England BioLabs). Cleanup was performed using washed MyOne C1 beads (Invitrogen). Beads were pelleted on a magnetic rack and washed with BBB solution from the MinION SQK-LS208 kit. Finally, the library was eluted from the beads with the elution buffer supplied in the kit and quantified using a Qubit fluorimeter.
The MinION flow cell was primed, and the DNA library was mixed with run buffer and library loading beads from the kit. The prepared library was added to the flow cell, and a 48-h sequencing run was started in the MinKnow software. Once the sequencing run started, the reads were uploaded to the Metrichor analysis platform (Metrichor Ltd.) for base calling. The base-called reads were downloaded to a local database.
Sequencing read trimming, filtering, and classification.
Trimmomatic (27) was used to remove low-quality reads. The leading three and the trailing three nucleotides were removed from the reads, and a 4-nucleotide sliding window was used to remove nucleotides from the 3′ ends when the average Phred score dropped below 20. Additionally, reads shorter than 50 bp were discarded after trimming. Trimmed and filtered reads were taxonomically classified using Kraken (35). Reads classified as Salmonella were extracted for further analysis.
De novo assembly and serotyping.
The extracted Salmonella reads were assembled using SPAdes (29) with the “–careful” option. QUAST (30) was used to evaluate the quality of the draft genome assemblies and to determine the N50 value for each assembly. SeqSero (3) was used to predict Salmonella serotype from the extracted Salmonella reads.
SNP detection and phylogenetic analysis.
Core-genome SNPs were identified using the CFSAN SNP pipeline v0.8.0 with default quality filters (22). Specifically, the minimum base quality was 20, the minimum mapping quality was 15, and the minimum fraction of reads for SNP calls was 0.6. The genomes of S. Enteritidis strain P125109 (NCBI reference sequence NC_011294.1) and S. enterica serotype Typhimurium strain SL1344 (NCBI accession FQ312003.1) were used as reference genomes for read mapping. Default pipeline settings were used for MiSeq reads. For MinION reads, read mapping was performed using BWA-MEM (35) with the “-x ont2d′” option. A SNP matrix and alignment concatenated SNPs were produced with custom Python scripts from each quasimetagenomics or WGS sample processed by the CFSAN SNP pipeline. Finally, maximum likelihood (ML) phylogenetic trees were constructed using PhyML (33).
Accession number(s).
Quasimetagenomics sequencing data from this study are available in the NCBI Sequence Read Archive (SRA) under accession number PRJNA404022.
Supplementary Material
ACKNOWLEDGMENT
This work was supported in part by the USDA National Institute of Food and Agriculture Hatch project no. 1006141.
Footnotes
Supplemental material for this article may be found at https://doi.org/10.1128/AEM.02340-17.
REFERENCES
- 1.Hyytia-Trees EK, Cooper K, Ribot EM, Gerner-Smidt P. 2007. Recent developments and future prospects in subtyping of foodborne bacterial pathogens. Future Microbiol 2:175–185. doi: 10.2217/17460913.2.2.175. [DOI] [PubMed] [Google Scholar]
- 2.Valderrama WB, Dudley EG, Doores S, Cutter CN. 2016. Commercially available rapid methods for detection of selected food-borne pathogens. Crit Rev Food Sci Nutr 56:1519–1531. doi: 10.1080/10408398.2013.775567. [DOI] [PubMed] [Google Scholar]
- 3.Zhang S, Yin Y, Jones MB, Zhang Z, Deatherage Kaiser BL, Dinsmore BA, Fitzgerald C, Fields PI, Deng X. 2015. Salmonella serotype determination utilizing high-throughput genome sequencing data. J Clin Microbiol 53:1685–1692. doi: 10.1128/JCM.00323-15. [DOI] [PMC free article] [PubMed] [Google Scholar]
- 4.Deng X, Shariat N, Driebe EM, Roe CC, Tolar B, Trees E, Keim P, Zhang W, Dudley EG, Fields PI, Engelthaler DM. 2015. Comparative analysis of subtyping methods against a whole-genome-sequencing standard for Salmonella enterica serotype Enteritidis. J Clin Microbiol 53:212–218. doi: 10.1128/JCM.02332-14. [DOI] [PMC free article] [PubMed] [Google Scholar]
- 5.Moura A, Criscuolo A, Pouseele H, Maury MM, Leclercq A, Tarr C, Bjorkman JT, Dallman T, Reimer A, Enouf V, Larsonneur E, Carleton H, Bracq-Dieye H, Katz LS, Jones L, Touchon M, Tourdjman M, Walker M, Stroika S, Cantinelli T, Chenal-Francisque V, Kucerova Z, Rocha EP, Nadon C, Grant K, Nielsen EM, Pot B, Gerner-Smidt P, Lecuit M, Brisse S. 2016. Whole genome-based population biology and epidemiological surveillance of Listeria monocytogenes. Nat Microbiol 2:16185. doi: 10.1038/nmicrobiol.2016.185. [DOI] [PMC free article] [PubMed] [Google Scholar]
- 6.Chen Y, Gonzalez-Escalona N, Hammack TS, Allard MW, Strain EA, Brown EW. 2016. Core genome multilocus sequence typing for identification of globally distributed clonal groups and differentiation of outbreak strains of Listeria monocytogenes. Appl Environ Microbiol 82:6258–6272. doi: 10.1128/AEM.01532-16. [DOI] [PMC free article] [PubMed] [Google Scholar]
- 7.McDermott PF, Tyson GH, Kabera C, Chen Y, Li C, Folster JP, Ayers SL, Lam C, Tate HP, Zhao S. 2016. Whole-genome sequencing for detecting antimicrobial resistance in nontyphoidal Salmonella. Antimicrob Agents Chemother 60:5515–5520. doi: 10.1128/AAC.01030-16. [DOI] [PMC free article] [PubMed] [Google Scholar]
- 8.Leonard SR, Mammel MK, Lacher DW, Elkins CA. 2015. Application of metagenomic sequencing to food safety: detection of Shiga toxin-producing Escherichia coli on fresh bagged spinach. Appl Environ Microbiol 81:8183–8191. doi: 10.1128/AEM.02601-15. [DOI] [PMC free article] [PubMed] [Google Scholar]
- 9.Leonard SR, Mammel MK, Lacher DW, Elkins CA. 2016. Strain-level discrimination of Shiga toxin-producing Escherichia coli in spinach using metagenomic sequencing. PLoS One 11:e0167870. doi: 10.1371/journal.pone.0167870. [DOI] [PMC free article] [PubMed] [Google Scholar]
- 10.Ottesen A, Ramachandran P, Reed E, White JR, Hasan N, Subramanian P, Ryan G, Jarvis K, Grim C, Daquiqan N, Hanes D, Allard M, Colwell R, Brown E, Chen Y. 2016. Enrichment dynamics of Listeria monocytogenes and the associated microbiome from naturally contaminated ice cream linked to a listeriosis outbreak. BMC Microbiol 16:275. doi: 10.1186/s12866-016-0894-1. [DOI] [PMC free article] [PubMed] [Google Scholar]
- 11.Ottesen AR, Gonzalez A, Bell R, Arce C, Rideout S, Allard M, Evans P, Strain E, Musser S, Knight R, Brown E, Pettengill JB. 2013. Co-enriching microflora associated with culture based methods to detect Salmonella from tomato phyllosphere. PLoS One 8:e73079. doi: 10.1371/journal.pone.0073079. [DOI] [PMC free article] [PubMed] [Google Scholar]
- 12.Jarvis KG, White JR, Grim CJ, Ewing L, Ottesen AR, Beaubrun JJ, Pettengill JB, Brown E, Hanes DE. 2015. Cilantro microbiome before and after nonselective pre-enrichment for Salmonella using 16S rRNA and metagenomic sequencing. BMC Microbiol 15:160. doi: 10.1186/s12866-015-0497-2. [DOI] [PMC free article] [PubMed] [Google Scholar]
- 13.Feng P. 2007. Rapid methods for the detection of foodborne pathogens: current and next-generation technologies. ASM Press, Washington, DC. [Google Scholar]
- 14.Jain M, Olsen HE, Paten B, Akeson M. 2016. The Oxford nanopore MinION: delivery of nanopore sequencing to the genomics community. Genome Biol 17:239. doi: 10.1186/s13059-016-1103-0. [DOI] [PMC free article] [PubMed] [Google Scholar]
- 15.Quick J, Ashton P, Calus S, Chatt C, Gossain S, Hawker J, Nair S, Neal K, Nye K, Peters T, De Pinna E, Robinson E, Struthers K, Webber M, Catto A, Dallman TJ, Hawkey P, Loman NJ. 2015. Rapid draft sequencing and real-time nanopore sequencing in a hospital outbreak of Salmonella. Genome Biol 16:114. doi: 10.1186/s13059-015-0677-2. [DOI] [PMC free article] [PubMed] [Google Scholar]
- 16.Greninger AL, Naccache SN, Federman S, Yu G, Mbala P, Bres V, Stryke D, Bouquet J, Somasekar S, Linnen JM, Dodd R, Mulembakani P, Schneider BS, Muyembe-Tamfum JJ, Stramer SL, Chiu CY. 2015. Rapid metagenomic identification of viral pathogens in clinical samples by real-time nanopore sequencing analysis. Genome Med 7:99. doi: 10.1186/s13073-015-0220-9. [DOI] [PMC free article] [PubMed] [Google Scholar]
- 17.Rodrigue S, Malmstrom RR, Berlin AM, Birren BW, Henn MR, Chisholm SW. 2009. Whole genome amplification and de novo assembly of single bacterial cells. PLoS One 4:e6864. doi: 10.1371/journal.pone.0006864. [DOI] [PMC free article] [PubMed] [Google Scholar]
- 18.Blanco L, Bernad A, Lazaro JM, Martin G, Garmendia C, Salas M. 1989. Highly efficient DNA synthesis by the phage phi 29 DNA polymerase. Symmetrical mode of DNA replication. J Biol Chem 264:8935–8940. [PubMed] [Google Scholar]
- 19.Garmendia C, Bernad A, Esteban JA, Blanco L, Salas M. 1992. The bacteriophage phi 29 DNA polymerase, a proofreading enzyme. J Biol Chem 267:2594–2599. [PubMed] [Google Scholar]
- 20.Seth-Smith HM, Harris SR, Skilton RJ, Radebe FM, Golparian D, Shipitsyna E, Duy PT, Scott P, Cutcliffe LT, O'Neill C, Parmar S, Pitt R, Baker S, Ison CA, Marsh P, Jalal H, Lewis DA, Unemo M, Clarke IN, Parkhill J, Thomson NR. 2013. Whole-genome sequences of Chlamydia trachomatis directly from clinical samples without culture. Genome Res 23:855–866. doi: 10.1101/gr.150037.112. [DOI] [PMC free article] [PubMed] [Google Scholar]
- 21.Hyeon JY, Deng X. 2017. Rapid detection of Salmonella in raw chicken breast using real-time PCR combined with immunomagnetic separation and whole genome amplification. Food Microbiol 63:111–116. doi: 10.1016/j.fm.2016.11.007. [DOI] [PubMed] [Google Scholar]
- 22.Daquigan N, Grim CJ, White JR, Hanes DE, Jarvis KG. 2016. Early recovery of Salmonella from food using a 6-hour non-selective pre-enrichment and reformulation of tetrathionate broth. Front Microbiol 7:2103. doi: 10.3389/fmicb.2016.02103. [DOI] [PMC free article] [PubMed] [Google Scholar]
- 23.Myint MS, Johnson YJ, Tablante NL, Heckert RA. 2006. The effect of pre-enrichment protocol on the sensitivity and specificity of PCR for detection of naturally contaminated Salmonella in raw poultry compared to conventional culture. Food Microbiol 23:599–604. doi: 10.1016/j.fm.2005.09.002. [DOI] [PubMed] [Google Scholar]
- 24.Vassiliadis P. 1983. The Rappaport-Vassiliadis (RV) enrichment medium for the isolation of salmonellas: an overview. J Appl Bacteriol 54:69–76. doi: 10.1111/j.1365-2672.1983.tb01302.x. [DOI] [PubMed] [Google Scholar]
- 25.Deng X, Desai PT, den Bakker HC, Mikoleit M, Tolar B, Trees E, Hendriksen RS, Frye JG, Porwollik S, Weimer BC, Wiedmann M, Weinstock GM, Fields PI, McClelland M. 2014. Genomic epidemiology of Salmonella enterica serotype Enteritidis based on population structure of prevalent lineages. Emerg Infect Dis 20:1481–1489. doi: 10.3201/eid2009.131095. [DOI] [PMC free article] [PubMed] [Google Scholar]
- 26.Davis SPJ, Luo Y, Payne J, Shpuntoff A, Rand H, Strain E. 2015. CFSAN SNP Pipeline: an automated method for constructing SNP matrices from next-generation sequence data. PeerJ Comput Sci 1:e20. doi: 10.7717/peerj-cs.20. [DOI] [Google Scholar]
- 27.Ondov BD, Treangen TJ, Melsted P, Mallonee AB, Bergman NH, Koren S, Phillippy AM. 2016. Mash: fast genome and metagenome distance estimation using MinHash. Genome Biol 17:132. doi: 10.1186/s13059-016-0997-x. [DOI] [PMC free article] [PubMed] [Google Scholar]
- 28.Horby PW, O'Brien SJ, Adak GK, Graham C, Hawker JI, Hunter P, Lane C, Lawson AJ, Mitchell RT, Reacher MH, Threlfall EJ, Ward LR. 2003. A national outbreak of multi-resistant Salmonella enterica serovar Typhimurium definitive phage type (DT) 104 associated with consumption of lettuce. Epidemiol Infect 130:169–178. doi: 10.1017/S0950268802008063. [DOI] [PMC free article] [PubMed] [Google Scholar]
- 29.Gieraltowski L, Julian E, Pringle J, Macdonald K, Quilliam D, Marsden-Haug N, Saathoff-Huber L, Von Stein D, Kissler B, Parish M, Elder D, Howard-King V, Besser J, Sodha S, Loharikar A, Dalton S, Williams I, Barton Behravesh C. 2013. Nationwide outbreak of Salmonella Montevideo infections associated with contaminated imported black and red pepper: warehouse membership cards provide critical clues to identify the source. Epidemiol Infect 141:1244–1252. doi: 10.1017/S0950268812001859. [DOI] [PMC free article] [PubMed] [Google Scholar]
- 30.Centers for Disease Control and Prevention. 2009. Multistate outbreak of Salmonella infections associated with peanut butter and peanut butter-containing products–United States, 2008–2009. MMWR Morb Mortal Wkly Rep 58:85–90. [PubMed] [Google Scholar]
- 31.Pettengill JB, McAvoy E, White JR, Allard M, Brown E, Ottesen A. 2012. Using metagenomic analyses to estimate the consequences of enrichment bias for pathogen detection. BMC Res Notes 5:378. doi: 10.1186/1756-0500-5-378. [DOI] [PMC free article] [PubMed] [Google Scholar]
- 32.Taylor AJ, Lappi V, Wolfgang WJ, Lapierre P, Palumbo MJ, Medus C, Boxrud D. 2015. Characterization of foodborne outbreaks of Salmonella enterica serovar Enteritidis with whole-genome sequencing single nucleotide polymorphism-based analysis for surveillance and outbreak detection. J Clin Microbiol 53:3334–3340. doi: 10.1128/JCM.01280-15. [DOI] [PMC free article] [PubMed] [Google Scholar]
- 33.Inns T, Ashton PM, Herrera-Leon S, Lighthill J, Foulkes S, Jombart T, Rehman Y, Fox A, Dallman T, de Pinna E, Browning L, Coia JE, Edeghere O, Vivancos R. 2017. Prospective use of whole genome sequencing (WGS) detected a multi-country outbreak of Salmonella Enteritidis. Epidemiol Infect 145:289–298. doi: 10.1017/S0950268816001941. [DOI] [PMC free article] [PubMed] [Google Scholar]
- 34.Sahl JW, Schupp JM, Rasko DA, Colman RE, Foster JT, Keim P. 2015. Phylogenetically typing bacterial strains from partial SNP genotypes observed from direct sequencing of clinical specimen metagenomic data. Genome Med 7:52. doi: 10.1186/s13073-015-0176-9. [DOI] [PMC free article] [PubMed] [Google Scholar]
- 35.Wood DE, Salzberg SL. 2014. Kraken: ultrafast metagenomic sequence classification using exact alignments. Genome Biol 15:R46. doi: 10.1186/gb-2014-15-3-r46. [DOI] [PMC free article] [PubMed] [Google Scholar]
Associated Data
This section collects any data citations, data availability statements, or supplementary materials included in this article.