

ABSTRACT
The molecular epidemiology of Listeria monocytogenes was investigated in a longitudinal study of three Finnish dairy farms during 2013 to 2016. A total of 186 bulk tank milk (BTM), 224 milk filter sock (MFS), and 1,702 barn environment samples were analyzed, and isolates of L. monocytogenes were genotyped using pulsed-field gel electrophoresis. L. monocytogenes occurred throughout the year in all sample types, and the prevalence in MFS increased significantly during the indoor season. L. monocytogenes was more prevalent in MFS (29%) than in BTM (13%) samples. However, the prevalence of L. monocytogenes varied more between farms in samples of MFS (13 to 48%) than in BTM (10 to 16%). For each farm, the L. monocytogenes genotypes detected were classified by persistence (defined as persistent if isolated from ≥3 samples during ≥6 months) and predominance (defined as predominant if >5% prevalence on at least one farm visit). The prevalence of sporadic genotypes was 4 to 5% on all three farms. In contrast, the prevalence of persistent predominant genotypes varied between farms by 4% to 16%. The highest prevalence of persistent predominant genotypes was observed on the farm with the poorest production hygiene. Persistent predominant genotypes were most prevalent on feeding surfaces, water troughs, and floors. Genotypes isolated from the milking system or from cow udders had a greater relative risk of occurring in BTM and MFS than genotypes that only occurred elsewhere in the farm, supporting the hypothesis that L. monocytogenes is transmitted to milk from contamination on the udder surface or in the milking equipment.
IMPORTANCE Listeria monocytogenes is a ubiquitous environmental bacterium and the causative agent of a serious foodborne illness, listeriosis. Dairy products are common vehicles of listeriosis, and dairy cattle farms harbor L. monocytogenes genotypes associated with human listeriosis outbreaks. Indeed, dairy cattle farms act as a reservoir of L. monocytogenes, and the organism is frequently detected in bulk tank milk (BTM) and in the feces of clinically healthy cows. The ecology of L. monocytogenes in the farm environment is complex and poorly understood. Isolates of the same L. monocytogenes genotype can occur in the farm for years, but the factors contributing to the persistence of genotypes on dairy farms are unknown. Knowledge of the persistence patterns and contamination routes of L. monocytogenes on dairy farms can improve management of the contamination pressure in the farm environment and aid in the development of focused control strategies to reduce BTM contamination.
KEYWORDS: listeriosis, food safety, milk hygiene, molecular epidemiology, persistence
INTRODUCTION
The saprophytic bacterium Listeria monocytogenes is the causative agent of the foodborne illness listeriosis. With a $2.6 billion estimated annual cost of illness and loss of 9,400 quality-adjusted life years, listeriosis is among the three most economically impactful foodborne pathogens in the United States (1). In the United States, the annual incidence of listeriosis is approximately 0.3 cases per 100,000 population, with a case fatality rate of 21% (2). In the European Union in 2015, the incidence of listeriosis was 0.46 cases per 100,000 population, with a case fatality rate of 18% (3). Although a wide variety of ready-to-eat foods can mediate listeriosis, approximately half of the outbreaks are linked to contaminated dairy products (4, 5). L. monocytogenes is a common contaminant of raw milk, as the observed prevalence of L. monocytogenes in bulk tank milk (BTM) of the dairy cow is frequently in the range of 2 to 7% (6–12). The consumption of unpasteurized raw milk contaminated with L. monocytogenes poses a listeriosis risk (13, 14). Moreover, the occurrence of L. monocytogenes in BTM can lead to cross-contamination of dairy processing plants and pasteurized dairy products (15–17). The development of effective control measures against raw milk contamination requires an in-depth understanding of the epidemiology of L. monocytogenes in on dairy farms and its contamination routes from the farm environment to BTM.
Dairy cattle farms represent an important reservoir of L. monocytogenes (18–23) and harbor L. monocytogenes genotypes associated with human outbreaks (24–26). While L. monocytogenes may be transmitted to the farm environment from a multitude of sources, poor-quality silage is considered a major contamination source (10, 15, 18, 19, 21). Healthy cattle frequently shed L. monocytogenes in feces, disseminating the pathogen into the farm environment (26, 27). L. monocytogenes is proposed to be transmitted to BTM from fecal or environmental contamination of the udder surface (18, 19, 28). Additionally, Latorre et al. (29, 30) documented the presence of L. monocytogenes biofilms in the milking equipment that contributed to a high prevalence of L. monocytogenes in BTM and in-line milk filter socks (MFS). Excretion of L. monocytogenes directly into milk from infected udders is considered an uncommon contamination route to BTM, due to the low incidence of listerial mastitis (31). Knowledge of the contamination routes of L. monocytogenes from the farm environment into BTM enables better management of the contamination pressure and helps reduce BTM contamination with L. monocytogenes.
L. monocytogenes isolates of identical or nearly identical genotypes can occur for years on dairy farms (26, 32). Whether the persistence of specific genotypes on dairy farms typically results from repeated reintroduction from an external point contamination source or from circulation within the farm environment is still unestablished. Moreover, where L. monocytogenes persists on the farm and how L. monocytogenes is transmitted from the sites of persistence to the remaining farm environment remain poorly understood. Prevention of the on-farm persistence of L. monocytogenes requires knowledge of the survival and dissemination of persistent L. monocytogenes genotypes in the dairy farm environment.
The objective of the present study was to investigate the molecular epidemiology of L. monocytogenes on three dairy cattle farms to (i) determine the occurrences of L. monocytogenes in BTM, in-line milk filter socks (MFS), and the dairy farm environment; (ii) explore the role of persistent L. monocytogenes genotypes in the dairy farm environment; (iii) establish the routes of L. monocytogenes transmission in the dairy farm environment and contamination routes into BTM and MFS; (iv) assess seasonal variations in the prevalence of L. monocytogenes in BTM, MFS, feces, and feeds; and (v) evaluate the effect of production hygiene on the occurrence of L. monocytogenes on dairy farms.
RESULTS
L. monocytogenes occurred frequently in BTM, MFS, and the farm environment.
Of all samples collected, 17% (farm A, 24%; farm B, 10%; farm C, 18%) were positive for L. monocytogenes (Table 1). Overall, L. monocytogenes was approximately twice as prevalent in MFS (29%) than in BTM (13%). However, the prevalence of L. monocytogenes in MFS varied between farms (A, 48%; B, 13%; C, 24%) more than the prevalence of L. monocytogenes in BTM (A, 16%; B, 14%; C, 10%). There was no significant association between the detection of L. monocytogenes in the paired BTM and MFS samples (Pearson's chi-square test, χ2[1] = 2.22, P > 0.05). Overall, 50 (79%) of the 63 L. monocytogenes-positive MFS samples paired with L. monocytogenes-negative BTM, and 12 (48%) of the 25 L. monocytogenes-positive BTM samples paired with L. monocytogenes-negative MFS samples. Of the 13 positive MFS samples that paired with positive BTM samples, 55% contained a different L. monocytogenes genotype than that in the BTM sample.
TABLE 1.
Prevalence of Listeria monocytogenes in samples of BTM, in-line MFS, and the farm environment from three Finnish dairy cattle farms
| Farm | BTMa |
MFS |
Farm environmentb |
||||||
|---|---|---|---|---|---|---|---|---|---|
| No. of samples collected | No. of samples positive for L. monocytogenes | % positive for L. monocytogenes (Wilson's 95% CI) | No. of samples collected | No. of samples positive for L. monocytogenes | % positive for L. monocytogenes (Wilson's 95% CI) | No. of samples collected | No. of samples positive for L. monocytogenes | % positive for L. monocytogenes (Wilson's 95% CI) | |
| A | 75 | 12 | 16 (9–26) | 75 | 36 | 48 (37–59) | 686 | 150 | 21 (19–25) |
| B | 59 | 8 | 14 (7–25) | 55 | 7 | 13 (6–24) | 682 | 68 | 10 (8–12) |
| C | 52 | 5 | 10 (4–20) | 94 | 23 | 24 (17–34) | 334 | 57 | 17 (14–22) |
| Total | 186 | 25 | 13 (9–19) | 224 | 66 | 29 (24–36) | 1,702 | 275 | 16 (14–18) |
Composite samples of five simultaneously collected 50-ml aliquots of bulk tank milk.
Samples collected from the dairy farm environment, including feed, feces, and milking system.
Each BTM sample comprised five individually analyzed milk sample aliquots. In total, 920 milk sample aliquots were analyzed, with 375 aliquots from farm A, 295 aliquots from farm B, and 260 aliquots from farm C. The mean prevalence of L. monocytogenes in milk sample aliquots was 4% (6%, farm A; 4%, farm B; 2%, farm C). Most of the L. monocytogenes-positive BTM samples consisted of only one L. monocytogenes-positive milk sample aliquot (see Table S2 in the supplemental material). BTM samples with 3 to 5 positive aliquots were only collected from farm A. The most probable number (MPN) of L. monocytogenes in the BTM samples, derived from the number of aliquots positive for L. monocytogenes after enrichment, was very low, at <0.1 CFU/ml. The MPN was indeterminable for one BTM sample composed of five positive aliquots. Direct plating of a 1-ml volume of each milk sample aliquot revealed low L. monocytogenes counts: on farm A, 3/375 (1%) milk sample aliquots contained L. monocytogenes counts on direct plating, yielding concentrations between 1 and 4 CFU/ml; on farm B, 4/295 (1%) milk sample aliquots were positive on direct plating, with counts of 1 to 2 CFU/ml; and on farm C, 2/250 (1%) milk sample aliquots were positive on direct plating, with counts of 1 to 3 CFU/ml.
L. monocytogenes was detected in nearly all sampled sites on the dairy farms investigated (Table 2), occurring most frequently on floor surfaces of the waiting area (52%) and the milking station (48%). L. monocytogenes was also prevalent on the milk room floors (42%), which are not accessible to cows. L. monocytogenes was slightly more prevalent on feeding surfaces (27%) than in silage (17%) or feed concentrates (16%). Likewise, the overall prevalence of L. monocytogenes was markedly higher on water trough surfaces (26%) than in water samples collected from the troughs (5%). L. monocytogenes was occasionally present in clean unused bedding material, indicating that bedding material can be contaminated intrinsically or prior to its application in the barn. The prevalence of L. monocytogenes in bedding materials was notably higher on farm A (38%) than on farms B (5%) and C (15%). Although both A and B used peat as bedding material, farm A was the only farm that employed a bedded pack system and occasionally supplemented the peat bedding with straw (Table S1). In the milking system, L. monocytogenes occurred most frequently in the milk filter tubes (4%).
TABLE 2.
Prevalence of Listeria monocytogenes in samples collected from the farm environment of three Finnish dairy cattle farmsa
| Sampling site | Farm A |
Farm B |
Farm C |
All |
||||
|---|---|---|---|---|---|---|---|---|
| No. of samples collected | No. (%) of L. monocytogenes-positive samples | No. of samples collected | No. (%) of L. monocytogenes-positive samples | No. of samples collected | No. (%) of L. monocytogenes-positive samples | No. of samples collected | No. (%) of L. monocytogenes-positive samples | |
| Waiting area floor | 11 | 7 (64) | 14 | 5 (36) | 6 | 4 (67) | 31 | 16 (52) |
| Milking station floor | 36 | 21 (58) | 31 | 8 (26) | 13 | 9 (69) | 80 | 38 (48) |
| Milk room floor | 14 | 5 (36) | 11 | 5 (45) | 13 | 6 (46) | 38 | 16 (42) |
| Water trough surface | 77 | 22 (29) | 69 | 13 (19) | 42 | 13 (31) | 188 | 48 (26) |
| Feeding surfacesb | 61 | 19 (31) | 51 | 12 (24) | 19 | 3 (16) | 131 | 34 (26) |
| Bedding, in barn | 34 | 13 (38) | 21 | 1 (5) | 13 | 2 (15) | 68 | 16 (24) |
| Feces | 65 | 19 (29) | 65 | 7 (11) | 39 | 13 (33) | 169 | 39 (23) |
| Udder surface | 42 | 13 (31) | 24 | 1 (4) | 15 | 0 (0) | 81 | 14 (17) |
| Silage | 53 | 12 (23) | 53 | 8 (15) | 20 | 1 (5) | 126 | 21 (17) |
| Feed concentrate | 7 | 2 (29) | 11 | 1 (9) | 7 | 1 (14) | 25 | 4 (16) |
| Udder wipes, used | 19 | 4 (21) | 18 | 2 (11) | 8 | 0 (0) | 45 | 6 (13) |
| Bedding, in storage | 23 | 4 (17) | 25 | 1 (4) | NC | NA | 5 | 48 (10) |
| Milk sample cup | 18 | 2 (11) | 12 | 0 (0) | NC | NA | 2 | 30 (7) |
| Water in troughs | 24 | 1 (4) | 42 | 2 (5) | 17 | 1 (6) | 83 | 4 (5) |
| Milk filter tube | 30 | 1 (3) | 37 | 2 (5) | 25 | 1 (4) | 92 | 4 (4) |
| Teat cup rack | 20 | 2 (10) | 19 | 0 (0) | 9 | 0 (0) | 48 | 2 (4) |
| Stall mats | NC | NA | 35 | 0 (0) | 26 | 2 (8) | 61 | 2 (3) |
| Milking line rinse water | 16 | 1 (6) | 16 | 0 (0) | NC | NA | 32 | 1 (3) |
| Bulk milk tank outlet | 36 | 1 (3) | 27 | 0 (0) | 11 | 1 (9) | 74 | 2 (3) |
| Milk collector | 34 | 1 (3) | 40 | 0 (0) | 17 | 0 (0) | 91 | 1 (1) |
| Teat cups | 66 | 0 (0) | 61 | 0 (0) | 34 | 0 (0) | 161 | 0 (0) |
NC, not collected; NA, not applicable.
Includes samples of feed troughs (farms A to C) and feed tables (farms A and B).
Farms had varied prevalences of persistent L. monocytogenes genotypes.
A total of 728 L. monocytogenes isolates were genotyped using pulsed-field gel electrophoresis (PFGE) and clustered into 74 different genotypes (Fig. 1). Altogether, 44 different L. monocytogenes genotypes were isolated from farm A, 33 genotypes from farm B, and 23 genotypes from farm C. Classification of the genotypes by predominance and persistence revealed that differences in the overall prevalences of L. monocytogenes between farms arose primarily from differences in the prevalences of persistent predominant genotypes (Table 3). The prevalence of persistent predominant genotypes was significantly higher in samples collected from farms A (16%; 95% confidence interval [CI], 14 to 19%) and C (11%; 95% CI, 9 to 15%) than in samples from farm B (4%; 95% CI, 3 to 6%). In contrast, the prevalences of sporadic genotypes were similar (4 to 5%) on all three farms. On all three farms, the prevalences of persistent nonpredominant genotypes and nonpersistent predominant genotypes were low (1 to 4%).
FIG 1.

Similarity analysis of 74 L. monocytogenes genotypes (GT) isolated from three dairy farms, F(A) to F(C), obtained by pulsed-field gel electrophoresis (PFGE) using restriction enzymes ApaI and AscI. Similarity analysis of the combined ApaI and AscI fingerprint profiles was performed with the unweighted pair group method with average linkages (UPGMA), using the Dice coefficient with a 1.5% position tolerance limit and 1% optimization. Serogroups (SG) were determined by PCR. For each farm, the prevalence pattern of the genotype is designated either “−” (not detected), “S” (sporadic), “P” (persistent nonpredominant), “D” (nonpersistent predominant), or “PD” (persistent predominant), followed by the number of positive samples in parentheses.
TABLE 3.
Prevalence of Listeria monocytogenes genotype groups in samples collected from farms A to C
| Genotype groupa | Farm A (n = 836) |
Farm B (n = 796) |
Farm C (n = 480) |
|||
|---|---|---|---|---|---|---|
| No. of positive samples | % positive (Wilson's 95% CI) | No. of positive samples | % positive (Wilson's 95% CI) | No. of positive samples | % positive (Wilson's 95% CI) | |
| Persistent predominant | 137 | 16 (14–19) | 34 | 4 (3–6) | 56 | 12 (9–15) |
| Persistent nonpredominant | 30 | 4 (3–5) | 18 | 2 (1–4) | 13 | 3 (2–5) |
| Nonpersistent predominant | 10 | 1 (0.6–2) | 12 | 2 (1–3) | 3 | 1 (0.2–2) |
| Sporadic | 44 | 5 (4–7) | 31 | 4 (3–5) | 24 | 5 (3–7) |
Persistent predominant, genotypes isolated on ≥3 sampling dates in ≥6 months, with >5% prevalence on ≥1 farm visit; persistent nonpredominant, genotypes isolated on ≥3 sampling dates in ≥6 months, with ≤5% prevalence on all farm visits; nonpersistent predominant, genotypes not isolated on ≥3 sampling dates in ≥6 months, with >5% prevalence on ≥1 farm visit; sporadic, genotypes not isolated on ≥3 sampling dates in ≥6 months, with ≤5% prevalence on all farm visits.
Different genotypes were classified as persistent predominant for all three farms (Fig. 1). Nevertheless, L. monocytogenes genotypes with a persistent or predominant pattern on one farm were often sporadic on the other two farms, suggesting that strains occurring in a persistent predominant pattern may be more common in the geographic region than the strains which only occurred in a sporadic pattern. Of the eight genotypes that occurred on all three farms, four were classified as predominant persistent on one farm, and only one genotype was classified as sporadic on all three farms. Five (71%) of the seven genotypes classified as persistent predominant occurred on more than one farm. In contrast, of the 55 genotypes that merely occurred sporadically, only nine (16%) genotypes were detected on more than one farm.
On all three farms, persistent predominant genotypes were isolated from floors, water troughs, feed troughs, and bedding, indicating that a variety of sites in the farm environment can act as ecological niches for the persistence of L. monocytogenes (Fig. S1 to S3). Persistent predominant genotypes comprised the majority of L. monocytogenes contamination detected on floors, water troughs, the milking system, BTM, and MFS of farms A and C, whereas on farm B, contamination in these sites consisted mostly of nonpersistent genotypes. On all three farms, persistent predominant genotypes comprised the majority of L. monocytogenes contamination on feeding surfaces. Moreover, persistent predominant genotypes were more prevalent on feeding surfaces (15 to 26%) than in feed samples (2 to 15%). In contrast, sporadic L. monocytogenes genotypes were either less prevalent (farms A and C) or equally prevalent (farm B) in samples of feeding surfaces (0 to 7%) as in feed samples (4 to 8%). Interestingly, persistent predominant genotypes were isolated from all BTM samples that contained ≥3 positive milk sample aliquots.
Of the 74 L. monocytogenes genotypes, 67 genotypes belonged to L. monocytogenes PCR serogroup IIa, six genotypes to serogroup IVb, and one genotype to IIb. All persistent predominant genotypes belonged to serogroup IIa. Additionally, serogroup IVb genotypes were occasionally isolated from the BTM, MFS, feces, floors, water troughs, and bedding of farms B and C. Serogroup IIb isolates only occurred on the floors and fecal samples of farm C.
L. monocytogenes contamination in BTM is likely to arise from the milking system and the udder surface.
Potential contamination routes of L. monocytogenes in the farm environment were identified by investigating associations in the occurrence (presence/absence) of genotypes between sampling sites. Additionally, the relative risk of a genotype occurring in a specific sampling site in the farm environment to also occur in BTM or MFS was calculated (Tables S4 and S5). There was a significant association between the genotypes occurring in the milking system (n = 5) and the genotypes occurring in BTM (n = 19) (Fisher's exact test, P < 0.01). Furthermore, the relative risk of genotypes occurring in the milking system to occur in BTM was 7.3-fold (95% CI, 4.5- to 11.9-fold) greater than that of other genotypes present in sites other than the milking system. Although there was no significant association between the genotypes occurring in udder samples (n = 13) and the genotypes occurring in BTM (Fisher's exact test, P > 0.05), the genotypes detected in udder samples were 2.6-fold (95% CI, 1.1-fold to 6.0-fold) more likely to be detected in BTM than genotypes occurring elsewhere in the farm environment. Moreover, there was a significant association between the genotypes occurring in udder samples and the genotypes occurring in MFS samples (n = 40) (Fisher's exact test, P < 0.01). Genotypes isolated from udder samples were 2.4-fold (95% CI, 1.6-fold to 3.7-fold) more likely detected in MFS than other genotypes. These data support a model where L. monocytogenes is transmitted from the farm environment to BTM via the milking system or the surface of udders (Fig. 2). The occurrence of genotypes in sites other than the milking system or udders was not significantly associated with the occurrence of the same genotypes in BTM or MFS.
FIG 2.
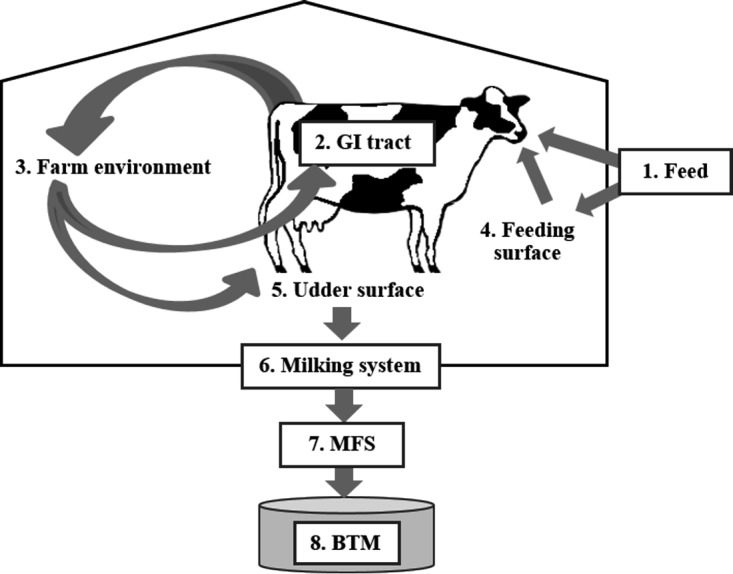
Model for L. monocytogenes circulation in the dairy farm environment. The ingestion of contaminated feeds (1) can lead to the dissemination of L. monocytogenes in cattle feces (2) into the barn environment (3). The persistence of L. monocytogenes on the feeding surfaces (4), water troughs, floors, or bedding (3) can prolong the exposure of cattle to L. monocytogenes, facilitating reinfection and further dissemination. Environmental or fecal contamination of the udder surface (5) or L. monocytogenes biofilms nested in the milking system (6) may lead to contamination of the milk filter socks (MFS; 7) and, eventually, the bulk tank milk (BTM; 8).
The occurrence of L. monocytogenes genotypes on water troughs and on feeding surfaces was significantly associated with the occurrence of these genotypes in nearly all sampling sites (Fig. S4), suggesting that genotypes contaminating the feeding surfaces and water troughs are likely to be widespread in the farm environment. Interestingly, there was a significant association between genotypes occurring in feed and on feeding surfaces (Fisher's exact test, P < 0.01) and between genotypes occurring on feeding surfaces and in feces (Fisher's exact test, P < 0.01), but not between genotypes occurring in feces and in feed (Fisher's exact test, P > 0.05). These findings suggest that feeding surfaces may act as an intermediary between feed and feces, where the contamination of feeding surfaces may exacerbate fecal dissemination by prolonging the oral exposure of cattle to L. monocytogenes (Fig. 2). The occurrence of L. monocytogenes genotypes in bedding was also significantly associated with a large number of sampling sites in the farm environment. Notably, there was a significant relationship between the occurrence of genotypes in bedding and udder samples (Fisher's exact test, P < 0.01). The relative risk of genotypes present in bedding being isolated from udder samples was 5.7 (95% CI, 2.2 to 14.5). The majority of the genotypes isolated from bedding and udder samples occurred on farm A. These findings suggest that on farm A, the markedly high prevalence of L. monocytogenes in bedding contributed to the high prevalence of L. monocytogenes in udder samples, which in turn contributed to the high prevalence of L. monocytogenes in MFS.
The prevalence of L. monocytogenes in MFS peaked during the indoor season.
The prevalence of L. monocytogenes was significantly higher in MFS samples collected during the indoor season from November to April (26%; 95% CI, 19 to 34%) than during the outdoor season from May to October (11%; 95% CI, 7 to 17%) (Table 4). The highest prevalence of L. monocytogenes in MFS samples was observed from January to April (30 to 32%) and the lowest from July to October (9%). In samples of BTM, feces, feeds, and feeding surfaces, L. monocytogenes occurred throughout the year without significant differences between seasons.
TABLE 4.
Seasonal prevalence of Listeria monocytogenes in BTM, MFS, feces of dairy cows, and in feed and feed trough surface samples collected from three Finnish dairy cattle farms during 2013 to 2016
| Sampling period | BTM |
MFS |
Feces |
Feed and feeding surfaces |
||||
|---|---|---|---|---|---|---|---|---|
| % samples positive for L. monocytogenes | Wilson's 95% CI | % samples positive for L. monocytogenes | Wilson's 95% CI | % samples positive for L. monocytogenes | Wilson's 95% CI | % samples positive for L. monocytogenes | Wilson's 95% CI | |
| Indoor season (November–April) | 13 | 8–20 | 26 | 19–34 | 22 | 14–31 | 19 | 12–25 |
| Outdoor season (May–October) | 13 | 8–21 | 11 | 7–17 | 22 | 15–32 | 20 | 14–27 |
| January-February | 12 | 5–27 | 32 | 19–47 | 15 | 6–34 | 18 | 10–32 |
| March-April | 9 | 3–22 | 30 | 19–45 | 26 | 14–43 | 16 | 9–29 |
| May-June | 17 | 8–33 | 14 | 7–27 | 28 | 14–48 | 16 | 8–29 |
| July-August | 11 | 4–25 | 9 | 4–22 | 20 | 9–39 | 32 | 20–47 |
| September-October | 11 | 5–26 | 9 | 4–22 | 19 | 9–36 | 14 | 7–26 |
| November-December | 17 | 8–33 | 15 | 7–30 | 23 | 11–40 | 19 | 11–31 |
High prevalence of L. monocytogenes correlated with poor production hygiene.
Differences in production hygiene were observed between farms (Table 5). Using a scale of 1 to 3, farms B and C received higher overall hygiene scores (2.6 to 2.8) than farm A (1.7). There was a significant positive correlation between farm hygiene score ranking and ranking based on L. monocytogenes prevalence (Spearman's rho = 0.69, P < 0.01), suggesting that sites where deficits in the hygienic maintenance were observed also maintained a higher prevalence of L. monocytogenes (Table S3). Differences in production hygiene may account for the significantly higher prevalence of L. monocytogenes in MFS of farm A than in farms B and C. MFS samples from farm A were often visibly dirty (Fig. S5), suggestive of shortcomings in milking hygiene on this farm. Deviations from normal farm routines (n = 92), as reported in a questionnaire filled by the farm staff at each BTM and MFS sampling, were not significantly associated with L. monocytogenes-positive samples of BTM or MFS (Fisher's exact test, P > 0.05).
TABLE 5.
Evaluation of hygiene on the investigated dairy farmsa
| Area or score type | Hygiene score by farm and date (mo/yr) |
|||||
|---|---|---|---|---|---|---|
| Farm A |
Farm B |
Farm C |
||||
| 11/2013 | 11/2015 | 4/2014 | 4/2016 | 9/2014 | 9/2015 | |
| Milk roomb | 3 | 3 | 3 | 3 | 3 | 2 |
| Milking stationc | 1 | 1 | 3 | 3 | 2 | 2 |
| Waiting area | 1 | 1 | 3 | 3 | 1 | 2 |
| Manure passage | 1 | 1 | 2 | 2 | 3 | 3 |
| Resting area | 2 | 2 | 3 | 3 | 3 | 3 |
| Cow cleanliness | 2 | 2 | 3 | 3 | 3 | 3 |
| Feed troughs | 1 | 2 | 2 | 2 | 3 | 3 |
| Water troughs | 2 | 2 | 3 | 3 | 3 | 3 |
| Mean score of evaluation | 1.6 | 1.8 | 2.8 | 2.8 | 2.6 | 2.6 |
| Overall mean hygiene score | 1.7 | 2.8 | 2.6 | |||
The cleanliness of the premises was evaluated at the beginning and end of the study period. Each area received a full score from 1 to 3, where 1 is major deficits in production hygiene, 2 is minor deficits in production hygiene, and 3 is no notable deficits in production hygiene.
Includes the milk room and, if present, the milk kitchen.
Refers to the milking parlor (farms A and B) or the milking unit of an automatic milking system (farm C).
DISCUSSION
The prevalence of L. monocytogenes in BTM samples was notably higher (13%) than in the individual BTM sample aliquots (4%), suggesting that the analysis of a single milk aliquot can underestimate the true prevalence of L. monocytogenes in BTM. The lower prevalence in milk sample aliquots is likely attributable to the low contamination levels of L. monocytogenes in BTM (33). Indeed, the MPN of the BTM samples and the plate counts of L. monocytogenes in individual BTM sample aliquots were consistently low in the present study (≤4 CFU/ml). The prevalence of L. monocytogenes in BTM was fairly high (10 to 16%) on all three farms investigated, despite the differences in farm size, management practices, and allocated hygiene scores. Interestingly, no relationship between the presence of L. monocytogenes and elevated total aerobic bacterial counts or Escherichia coli counts was found in a previous study of Finnish BTM (9). Therefore, while poor milking hygiene may facilitate the transmission of L. monocytogenes from the environment to BTM, good milking hygiene alone cannot entirely prevent contamination.
In-line MFS, which are placed between the milking station and the bulk tank, are a common alternative to BTM as sample material for L. monocytogenes surveillance (11, 28, 34). In the present study, L. monocytogenes was more prevalent in MFS than in BTM samples, suggesting that contamination levels that are undetectable from BTM in a scheme of five aliquots may concentrate to detectable levels in the MFS. However, the prevalence of L. monocytogenes was more varied between farms in MFS (13 to 48%) than in BTM (10 to 16%) samples. Moreover, MFS samples performed poorly as indicators of L. monocytogenes contamination in BTM, especially as positive BTM samples were frequently collected with negative MFS samples. Therefore, while MFS screening may improve the likelihood of detecting L. monocytogenes at the farm level, the detection of L. monocytogenes in MFS analysis should not be solely relied upon to justify contamination of BTM. Poor milking hygiene may increase the proportion of L. monocytogenes captured by the MFS, as excess debris on the MFS surface can facilitate the attachment of L. monocytogenes to the MFS (28). Since the highest prevalence of L. monocytogenes in MFS samples was observed on the farms with the highest environmental prevalence of L. monocytogenes (farms A and C), the MFS may act as an indirect indicator of both milking hygiene and the contamination pressure from the farm environment.
The three dairy farms investigated were exposed to a large variety of L. monocytogenes genotypes. The strain diversity may be attributable to the multitude of potential contamination sources in the farm environment, such as feeds, wild and domesticated animals, farm staff and visitors, and contaminated machinery (19, 21, 26, 35). The majority of the genotypes detected in this study were presumably sporadic on the farms investigated. Interestingly, the prevalences of the sporadic genotypes were remarkably similar on all three farms (4 to 5%), suggesting that a “baseline” L. monocytogenes contamination by sporadically occurring genotypes may be present in all dairy cattle farm environments. However, the prevalence of persistent predominant genotypes varied notably between farms (4 to 16%), suggesting that farm-specific factors influence the prevalence of persistent predominant genotypes. Persistent predominant genotypes were most prevalent on the farm with the lowest hygiene score (farm A) and least prevalent on the farm with the highest hygiene score (farm B), suggesting that the contamination load from persistent predominant genotypes can be reduced with good production hygiene. In general, environmental sites with the lowest hygiene scores had the highest prevalence of L. monocytogenes.
L. monocytogenes occurred more frequently on surface swab samples from feeding surfaces and water troughs than in feed or water, suggesting that L. monocytogenes accumulates on the surfaces of the farm premises. The frequent detection of persistent predominant strains on the surface of floors, feeding surfaces, and water troughs suggests that these sites act as niches for on-site persistence of L. monocytogenes. Additionally, genotypes present on feeding surfaces and water troughs were exceptionally widespread in the farm environment. The persistence and proliferation of L. monocytogenes on feeding surfaces and water troughs may increase the oral exposure of cows to L. monocytogenes, further contributing to the fecal spread of these genotypes to multiple sites in the farm environment. L. monocytogenes genotypes occurring on udders or the milking system were more likely to contaminate BTM and MFS than genotypes that only occurred in other sampling sites in the farm environment. Indeed, all five genotypes detected in the milking system were also detected in milk. These findings support the proposition that L. monocytogenes is transmitted to BTM both from the udder surface (18, 19, 28) and from the milking equipment (29, 30). However, an association between the occurrence of genotypes in the milking system and BTM can also arise from milk acting as the source of contamination in the milking system. Samples of the milking system were collected after routine cleaning, indicating that L. monocytogenes isolates from the milking system remained attached and viable though the cleaning procedure. Since no genotype was detected in the milking system on two consecutive visits, the genotypes were unlikely to persist in the sampled areas of the milking system.
All of the persistent predominant strains belonged to PCR serogroup IIa (lineage II), which is the most commonly occurring serogroup implicated in human listeriosis in Finland (36). Cluster analysis of fingerprint profiles revealed that persistent predominant genotypes were a genetically diverse group. Several fingerprint profiles of persistent predominant genotypes shared a high degree of similarity with profiles of exclusively sporadic genotypes. Closely related “persistent groups” of L. monocytogenes genotypes have been found to occur on dairy farms, occasionally for several years (26, 30). It is possible that the genotypes within persistent groups originate from the same environmental reservoir hosting a common ancestor. Alternatively, persistent groups may represent clades that are particularly common and spread across a variety of geographical areas and environments (26). Potential factors determining the occurrence and persistence of L. monocytogenes genotypes on a farm include the prevalence of the genotypes in the geographic region, the sources of contamination to the farm environment, farm management, housing system and herd size, phenotypic and genomic characteristics of the strain, and the microevolution and adaptation of the strain to various habitats and selection pressures. Cattle likely contribute to the amplification and dissemination of L. monocytogenes in the farm (21, 26, 27), but the ability of persistent L. monocytogenes strains to survive and replicate in the bovine gastrointestinal tract remains uncertain.
Significant seasonal variation in the prevalence of L. monocytogenes was only observed in MFS samples, in which the prevalence was higher during the indoor season than the outdoor season. Of note, the analysis of seasonal variation was limited by the short study period. Seasonal variation in the prevalence of L. monocytogenes in MFS, BTM, and bovine feces was found to be insignificant in several studies (28, 35, 37), whereas others identified significant seasonal differences, with different seasons reported as having higher prevalence than others (23, 38–40). Differences in climate and farm management between different geographical regions, as well as variations in study design, may account for the disparity regarding seasonal prevalence.
In conclusion, the detection of low contamination levels of L. monocytogenes in BTM can be facilitated by the analysis of multiple milk sample aliquots or by the analysis of MFS. MFS sampling provided a higher overall prevalence for L. monocytogenes than did BTM sampling; however, MFS performed poorly as an indicator of L. monocytogenes contamination in BTM. Samples from all three farms contained a similar prevalence of sporadic genotypes but varied prevalence of persistent predominant genotypes. The highest prevalence of persistent predominant genotypes was detected on the farm with the lowest hygiene score. Each farm contained a unique set of persistent predominant genotypes, of which several were sporadically occurring on the other two farms. Persistent predominant genotypes were widespread in the farm environment, and on all three farms, all persistent predominant genotypes presented on feeding surfaces and water troughs, suggesting that these sites are ecological niches for L. monocytogenes persistence. L. monocytogenes genotypes isolated from udders and the milking system had a higher relative risk of occurring in BTM than genotypes isolated from other locations, which suggests that the udder surface and, potentially, the milking system, are important routes of contamination for L. monocytogenes into BTM. The findings of this study contribute to a better understanding of the epidemiology of L. monocytogenes on dairy cattle farms and can be used to implement improved surveillance and control strategies against L. monocytogenes in dairy production.
MATERIALS AND METHODS
Farms.
The sample material was collected during 2013 to 2016 from three Finnish dairy cattle farms with different housing systems, management practices, and herd sizes (Table S1). No history of clinical listeriosis in dairy cows had been observed in any of the farms. Sampling took place on farm A from November 2013 to November 2015, on farm B from April 2014 to April 2016, and on farm C from September 2014 to September 2015.
Sampling.
During the sampling period, each farm was visited bimonthly, for a total of 13 visits to farms A and B and 7 visits to farm C. On each farm visit, approximately 50 samples (30 to 35 surface swab samples, 5 to 6 samples of feces, 4 to 5 samples of bedding, 4 to 5 samples of feed, 1 to 2 water samples, and one milking line rinse water sample) were collected, amounting to 686 samples from farm A, 682 samples from farm B, and 334 samples from farm C. Surface swab samples were collected from floors, feeding surfaces (feed tables and troughs), water troughs, uncleaned udders, used udder wipes, milk collectors, teat cups, teat cup racks, milk filter tubes, and the bulk tank outlets. All samples of the milking equipment were collected after routine cleaning in place (CIP) from the surfaces that come into direct contact with milk. Fecal samples were collected as composite samples of freshly laid feces from 2 to 5 cows on farms A and B and from 5 to 10 cows on farm C. Samples of feed and bedding were collected using disposable gloves or sterilized forceps into 1-liter zip-lock bags by selecting representative sample material from several locations. Drinking water from troughs and rinse water from the milking pipeline were collected into 50-ml samples in polypropylene centrifuge tubes (Falcon). All samples collected on the farm visits were transported in coolers directly to the laboratory, and sample analysis was initiated on the day of the sample collection.
BTM and MFS sampling was performed every 1 to 2 weeks throughout the surveillance period, for a total of 75 times on farm A, 59 times on farm B, and 55 times on farm C. At each sampling, five 50-ml milk sample aliquots were collected from the bulk tank through the outlet. Additionally, 1 to 2 in-line MFS samples through which the milk collected in the bulk tank had been filtered were collected into Minigrip bags. The milk sample aliquots and the MFS samples were collected by the farm staff and delivered to the laboratory within 24 h in packages containing ice packs. The samples were analyzed immediately upon arrival to the laboratory. Each of the five milk sample aliquots was analyzed individually but together composed one BTM sample: the BTM sample was considered negative if all five aliquots were negative, and it was considered positive if any one of the five aliquots tested positive for L. monocytogenes. The utility of MFS samples as indicators of BTM contamination with L. monocytogenes was explored in simultaneously collected pairs of BTM and MFS samples (n = 182). In the possible case where two MFS samples were collected with a BTM sample, such a BTM sample was paired with a positive MFS sample if either of the two MFS samples was positive, and it was paired with a negative MFS sample if both of the two MFS samples were negative.
With each sampling, the farm staff also completed a questionnaire to report any deviations from routine farm management, namely, nonroutine cleaning and maintenance procedures of the milking equipment and farm premises, recruitment of new staff or the use of substitute workers, presence of visitors on the farm, purchase of new animals, animal health issues, and changes in feeding or feed quality (Appendix S1). Associations between the reported deviations and the occurrence of L. monocytogenes in BTM and MFS samples were explored both by the presence/absence of any reported deviation and by each survey question individually.
Bacterial analysis.
L. monocytogenes was isolated from the samples according to the standard procedure NCFA 136:2010 (41), using Harlequin chromogenic Listeria agar plates (Lab M Limited, Bury, United Kingdom) and Listeria monocytogenes blood agar plates (LMBA; Lab M Limited) for samples of BTM, MFS, water, and environmental swabs and Palcam agar plates (Lab M Limited) and LMBA plates for samples of feed, fecal, and bedding. Entire milk filter socks, sponge swabs, and swab sticks were used as sample material for primary enrichment in the half Fraser broth; for the remaining sample types, a 25-g subset of the sample was selected for primary enrichment. Colonies with a morphology representative of L. monocytogenes were identified using a multiplex PCR method targeted to the listeriolysin O gene hlyA (42). Serogroups of the L. monocytogenes isolates were determined by a multiplex PCR assay (43) that recognizes L. monocytogenes PCR serogroups IIa (serovars 1/2a and 3a), IIc (serovars 1/2c and 3c), IIb (serovars 1/2b, 3b, and 7), and IVb (serovars 4b, 4d, and 4e). L. monocytogenes serogroups IIa and IIc stem from evolutionary lineage II, and serogroups IIb and IVb stem from evolutionary lineage I (43).
Genotyping.
Genotyping of L. monocytogenes isolates was performed using pulsed-field gel electrophoresis (PFGE) with the restriction enzymes ApaI and AscI (New England BioLabs, Ipswich, MA). When L. monocytogenes colonies were observed in the direct plating of milk sample aliquots, one L. monocytogenes isolate from the direct plating was selected for genotyping. Following sample enrichment, one L. monocytogenes isolate was selected for genotyping from each positive selective agar plate. Altogether, 1 to 5 isolates were genotyped for each positive sample. PFGE was performed as described by Autio et al. (44). PFGE profiles were analyzed using the BioNumerics software version 5.10 (Applied Maths, Sint-Martens-Latem, Belgium). Bands were assigned automatically and adjusted manually after visual assessment. The isolates were clustered into genotypes based on similarity analysis of the combined ApaI and AscI fingerprint profiles, performed with the unweighted pair group method with average linkages (UPGMA), using the Dice coefficient with a 1.5% position tolerance limit and 1% optimization.
L. monocytogenes genotypes were classified as described by Latorre et al. (30), with modifications, into (i) persistent predominant, (ii) nonpersistent predominant, (iii) persistent nonpredominant, and (iv) sporadic genotypes. Genotypes were considered persistent if they occurred at least on three different sampling dates, with a minimum interval of 6 months between the first and the last dates of isolation, indicating that these genotypes were reoccurring or surviving on the farm. Genotypes were considered predominant if they occurred with a >5% sample prevalence at least on one farm visit, indicating that these genotypes were widespread in the farm environment during one or more farm visits. If a genotype did not fulfill the criteria for the predominant or persistent genotype, it was considered to be sporadic.
Evaluation of production hygiene.
Production hygiene was evaluated on each farm, based on the cleanliness of the premises on farm visits at the beginning and end of the surveillance period. Aspects to be evaluated included, where appropriate, overall cleanliness; hygienic design and condition of materials; routing of milk, animals, feed, and feces; drainage; air quality; lighting; and pest control. Full scores on a scale of 1 to 3 were allocated for each of the evaluated sites (Table 5), where a score of “1” corresponded to a major deficit in production hygiene, “2” to a minor deficit in production hygiene, and “3” to no notable deficit in production hygiene. A hygiene deficit was considered minor if the issue was localized and unlikely to reduce milk hygiene (e.g., slow drainage of rinsing water from an area of the milking parlor). The deficit was considered major if the issue presented throughout the evaluated site or it was likely to reduce milk hygiene (e.g., insufficient cleaning of the milking parlor after milking). All evaluations were conducted by the same veterinarian (HC).
To investigate the relationship between production hygiene and the occurrence of L. monocytogenes, the association between the farm ranking based on hygiene score and farm ranking based on L. monocytogenes prevalence was explored. For each evaluated site, the three farms were ranked by hygiene score, so that the farm with the highest hygiene score was ranked first, and the farm with the lowest hygiene score was ranked third. If two scores were equal for any given site, the two farms shared the higher rank. Furthermore, for each evaluated site, the farms were ranked on the basis of L. monocytogenes prevalence in samples collected from that site, where the lowest prevalence was ranked first and highest prevalence was ranked third.
Data analysis.
The 95% confidence intervals for prevalence estimates were calculated using the Wilson score interval method (45). The most probable number (MPN) of L. monocytogenes in bulk tank milk and the MPN confidence intervals were calculated using the application developed by Jarvis et al. (46) for Microsoft Excel. The IBM SPSS Statistics version 23 was used to run two-tailed t tests, Pearson's chi-square tests, and Fisher's exact tests and to calculate relative risk ratios. A significance level of 0.05 was used in the statistical analyses.
Supplementary Material
ACKNOWLEDGMENTS
This work was funded by the Finnish Ministry of Agriculture and Forestry (grant 1879/312/2012), the Walter Ehrström Foundation, and the University of Helsinki Doctoral Programme in Food Chain and Health.
We are grateful for cooperation with the dairy farms that participated in this study.
Footnotes
Supplemental material for this article may be found at https://doi.org/10.1128/AEM.02000-17.
REFERENCES
- 1.Hoffmann S, Batz MB, Morris JG Jr. 2012. Annual cost of illness and quality-adjusted life year losses in the United States due to 14 foodborne pathogens. J Food Prot 75:1292–1302. doi: 10.4315/0362-028X.JFP-11-417. [DOI] [PubMed] [Google Scholar]
- 2.Centers for Disease Control and Prevention (CDC). 2013. Vital signs: Listeria illnesses, deaths, and outbreaks—United States, 2009–2011. MMWR Morb Mortal Wkly Rep 62:448–452. [PMC free article] [PubMed] [Google Scholar]
- 3.European Food Safety Authority (EFSA). 2016. EU summary report on trends and sources of zoonoses, zoonotic agents and food-borne outbreaks in 2015. EFSA J 14:4634. doi: 10.2903/j.efsa.2016.4634. [DOI] [PMC free article] [PubMed] [Google Scholar]
- 4.Lundén J, Tolvanen R, Korkeala H. 2004. Human listeriosis outbreaks linked to dairy products in Europe. J Dairy Sci 87:E6–E12. doi: 10.3168/jds.S0022-0302(04)70056-9. [DOI] [Google Scholar]
- 5.Cartwright EJ, Jackson KA, Johnson SD, Graves LM, Silk BJ, Mahon BE. 2013. Listeriosis outbreaks and associated food vehicles, United States, 1998–2008. Emerg Infect Dis 19:1–9. doi: 10.3201/eid1901.120393. [DOI] [PMC free article] [PubMed] [Google Scholar]
- 6.De Reu K, Grijspeerdt K, Herman L. 2004. A Belgian survey of hygiene indicator bacteria and 710 pathogenic bacteria in raw milk and direct marketing of raw milk farm products. J Food Saf 24:17–36. doi: 10.1111/j.1745-4565.2004.tb00373.x. [DOI] [Google Scholar]
- 7.Jayarao BM, Donaldson SC, Straley BA, Sawant AA, Hegde NV, Brown JL. 2006. A survey of foodborne pathogens in bulk tank milk and raw milk consumption among farm families in Pennsylvania. J Dairy Sci 89:2451–2458. doi: 10.3168/jds.S0022-0302(06)72318-9. [DOI] [PubMed] [Google Scholar]
- 8.Kalorey DR, Warke SR, Kurkure NV, Rawool DB, Barbuddhe SB. 2008. Listeria species in bovine raw milk: a large survey of central India. Food Control 19:109–112. doi: 10.1016/j.foodcont.2007.02.006. [DOI] [Google Scholar]
- 9.Ruusunen M, Salonen M, Pulkkinen H, Huuskonen M, Hellström S, Revez J, Hänninen ML, Fredriksson-Ahomaa M, Lindström M. 2013. Pathogenic bacteria in Finnish bulk tank milk. Foodborne Pathog Dis 10:99–106. doi: 10.1089/fpd.2012.1284. [DOI] [PubMed] [Google Scholar]
- 10.Vilar MJ, Yus E, Sanjuán ML, Diéguez FJ, Rodríguez-Otero JL. 2007. Prevalence of and risk factors for Listeria species on dairy farms. J Dairy Sci 90:5083–5088. doi: 10.3168/jds.2007-0213. [DOI] [PubMed] [Google Scholar]
- 11.Van Kessel JA, Karns JS, Lombard JE, Kopral CA. 2011. Prevalence of Salmonella enterica, Listeria monocytogenes, and Escherichia coli virulence factors in bulk tank milk and in-line filters from U.S. dairies. J Food Prot 74:759–768. doi: 10.4315/0362-028X.JFP-10-423. [DOI] [PubMed] [Google Scholar]
- 12.Castro H, Ruusunen M, Lindström M. 2017. Occurrence and growth of Listeria monocytogenes in packaged raw milk. Int J Food Microbiol 261:1–10. doi: 10.1016/j.ijfoodmicro.2017.08.017. [DOI] [PubMed] [Google Scholar]
- 13.Latorre AA, Pradhan AK, Van Kessel JAS, Karns JS, Boor KJ, Rice DH, 771 Mangione KJ, Gröhn YT, Schukken YH. 2011. Quantitative risk assessment of listeriosis due to consumption of raw milk. J Food Prot 74:1268–1281. doi: 10.4315/0362-028X.JFP-10-554. [DOI] [PubMed] [Google Scholar]
- 14.Centers for Disease Control and Prevention (CDC). 2016. Multistate outbreak of listeriosis linked to raw milk produced by Miller's Organic Farm in Pennsylvania. Centers for Disease Control and Prevention, Atlanta, GA: https://www.cdc.gov/listeria/outbreaks/raw-milk-03-16/index.html. [Google Scholar]
- 15.Arimi SM, Ryser ET, Pritchard TJ, Donnelly CW. 1997. Diversity of Listeria ribotypes recovered from dairy cattle, silage, and dairy processing environments. J Food Prot 60:811–816. doi: 10.4315/0362-028X-60.7.811. [DOI] [PubMed] [Google Scholar]
- 16.Rudolf M, Scherer S. 2001. High incidence of Listeria monocytogenes in European red smear cheese. Int J Food Microbiol 63:91–98. doi: 10.1016/S0168-1605(00)00413-X. [DOI] [PubMed] [Google Scholar]
- 17.Fox E, Hunt K, O'Brien M, Jordan K. 2011. Listeria monocytogenes in Irish farmhouse cheese processing environments. Int J Food Microbiol 145:S39–S45. doi: 10.1016/j.ijfoodmicro.2010.10.012. [DOI] [PubMed] [Google Scholar]
- 18.Husu JR, Seppänen JT, Sivelä SK, Rauramaa AL. 1990. Contamination of raw milk by Listeria monocytogenes on dairy farms. Zoonoses Public Health 37:268–275. doi: 10.1111/j.1439-0450.1990.tb01058.x. [DOI] [PubMed] [Google Scholar]
- 19.Sanaa M, Poutrel B, Menard JL, Serieys F. 1993. Risk factors associated with contamination of raw milk by Listeria monocytogenes in dairy farms. J Dairy Sci 76:2891–2898. doi: 10.3168/jds.S0022-0302(93)77628-6. [DOI] [PubMed] [Google Scholar]
- 20.Borucki MK, Reynolds J, Gay CC, McElwain KL, Kim SH, Knowles DP, Hu J. 2004. Dairy farm reservoir of Listeria monocytogenes sporadic and epidemic strains. J Food Prot 67:2496–2499. doi: 10.4315/0362-028X-67.11.2496. [DOI] [PubMed] [Google Scholar]
- 21.Nightingale KK, Fortes ED, Ho AJ, Schukken YH, Gröhn YT, Wiedmann M. 2005. Evaluation of farm management practices as risk factors for clinical listeriosis and fecal shedding of Listeria monocytogenes in ruminants. J Am Vet Med Assoc 227:1808–1814. doi: 10.2460/javma.2005.227.1808. [DOI] [PubMed] [Google Scholar]
- 22.Fox E, O'Mahony TO, Clancy M, Dempsey R, O'Brien MA, Jordan K. 2009. Listeria monocytogenes in the Irish dairy farm environment. J Food Prot 72:1450–1456. doi: 10.4315/0362-028X-72.7.1450. [DOI] [PubMed] [Google Scholar]
- 23.Mohammed HO, Stipetic K, McDonough PL, Gonzalez RN, Nydam DV, Atwill ER. 2009. Identification of potential on-farm sources of Listeria monocytogenes in herds of dairy cattle. Am J Vet Res 70:383–388. doi: 10.2460/ajvr.70.3.383. [DOI] [PubMed] [Google Scholar]
- 24.Borucki MK, Gay CC, Reynolds J, McElwain KL, Kim SH, Call DR, Knowles DP. 2005. Genetic diversity of Listeria monocytogenes strains from a high-prevalence dairy farm. Appl Environ Microbiol 71:5893–5899. doi: 10.1128/AEM.71.10.5893-5899.2005. [DOI] [PMC free article] [PubMed] [Google Scholar]
- 25.Rocha PR, Lomonaco S, Bottero MT, Dalmasso A, Dondo A, Grattarola C, Zuccon F, Iulini B, Knabel SJ, Capucchio MT, Casalone C. 2013. Ruminant rhombencephalitis-associated Listeria monocytogenes strains constitute a genetically homogeneous group related to human outbreak strains. Appl Environ Microbiol 79:3059–3066. doi: 10.1128/AEM.00219-13. [DOI] [PMC free article] [PubMed] [Google Scholar]
- 26.Haley BJ, Sonnier J, Schukken YH, Karns JS, Van Kessel JA. 2015. Diversity of Listeria monocytogenes within a U.S. dairy herd, 2004–2010. Foodborne Pathog Dis 12:844–850. doi: 10.1089/fpd.2014.1886. [DOI] [PubMed] [Google Scholar]
- 27.Ho AJ, Ivanek R, Gröhn YT, Nightingale KK, Wiedmann M. 2007. Listeria monocytogenes fecal shedding in dairy cattle shows high levels of day-to-day variation and includes outbreaks and sporadic cases of shedding of specific L. monocytogenes subtypes. Prev Vet Med 80:287–305. doi: 10.1016/j.prevetmed.2007.03.005. [DOI] [PubMed] [Google Scholar]
- 28.Hassan L, Mohammed HO, McDonough PL. 2001. Farm-management and milking practices associated with the presence of Listeria monocytogenes in New York state dairy herds. Prev Vet Med 51:63–73. doi: 10.1016/S0167-5877(01)00207-0. [DOI] [PubMed] [Google Scholar]
- 29.Latorre AA, Van Kessel JAS, Karns JS, Zurakowski MJ, Pradhan AK, Boor KJ, Jayarao BM, Houser BA, Daugherty CS, Schukken YH. 2010. Biofilm in milking equipment on a dairy farm as a potential source of bulk tank milk contamination with Listeria monocytogenes. J Dairy Sci 93:2792–2802. doi: 10.3168/jds.2009-2717. [DOI] [PubMed] [Google Scholar]
- 30.Latorre AA, Van Kessel JAS, Karns JS, Zurakowski MJ, Pradhan AK, Boor KJ, Adolph E, Sukhnanand S, Schukken YH. 2011. Increased in vitro adherence and on-farm persistence of predominant and persistent Listeria monocytogenes strains in the milking system. Appl Environ Microbiol 77:3676–3684. doi: 10.1128/AEM.02441-10. [DOI] [PMC free article] [PubMed] [Google Scholar]
- 31.Jensen NE, Aarestrup FM, Jensen J, Wegener HC. 1996. Listeria monocytogenes in bovine mastitis. Possible implication for human health. Int J Food Microbiol 32:209–216. doi: 10.1016/0168-1605(96)01105-1. [DOI] [PubMed] [Google Scholar]
- 32.Latorre AA, Van Kessel JAS, Karns JS, Zurakowski MJ, Pradhan AK, Zadoks RN, Boor KJ, Schukken YH. 2009. Molecular ecology of Listeria monocytogenes: evidence for a reservoir in milking equipment on a dairy farm. Appl Environ Microbiol 75:1315–1323. doi: 10.1128/AEM.01826-08. [DOI] [PMC free article] [PubMed] [Google Scholar]
- 33.Meyer-Broseta S, Diot A, Bastian S, Rivière J, Cerf O. 2003. Estimation of low bacterial concentration: Listeria monocytogenes in raw milk. Int J Food Microbiol 80:1–5. doi: 10.1016/S0168-1605(02)00117-4. [DOI] [PubMed] [Google Scholar]
- 34.Giacometti F, Serraino A, Finazzi G, Daminelli P, Losio MN, Bonilauri P, Arrigoni N, Garigliani A, Mattioli R, Alonso S, Piva S, Florio D, Riu R, Zanoni RG. 2012. Foodborne pathogens in in-line milk filters and associated on-farm risk factors in dairy farms authorized to produce and sell raw milk in northern Italy. J Food Prot 75:1263–1269. doi: 10.4315/0362-028X.JFP-12-028. [DOI] [PubMed] [Google Scholar]
- 35.Mohammed HO, Atwill E, Dunbar L, Ward T, McDonough P, Gonzalez R, Stipetic K. 2010. The risk of Listeria monocytogenes infection in beef cattle operations. J Appl Microbiol 108:349–356. doi: 10.1111/j.1365-2672.2009.04446.x. [DOI] [PubMed] [Google Scholar]
- 36.Jaakkola S, Lyytikäinen O, Rimhanen-Finne R, Salmenlinna S, Savolainen-Kopra C, Liitsola K, Jalava J, Toropainen M, Nohynek H, Löflund JE, Kuusi M, Salminen M. 2017. Tartuntataudit Suomessa 2016. Finnish National Institute for Health and Welfare report 5. (In Finnish.) National Institute for Health and Welfare, Helsinki, Finland: http://urn.fi/URN:ISBN:978-952-302-890-6. [Google Scholar]
- 37.Gaya P, Sanchez J, Medina M, Nuñez M. 1998. Incidence of Listeria monocytogenes and other Listeria species in raw milk produced in Spain. Food Microbiol 15:551–555. doi: 10.1006/fmic.1997.0175. [DOI] [Google Scholar]
- 38.Husu JR. 1990. Epidemiological studies on the prevalence of Listeria monocytogenes in the feces of dairy cattle. J Vet Med B Infect Dis Vet Public Health 37:276–282. doi: 10.1111/j.1439-0450.1990.tb01059.x. [DOI] [PubMed] [Google Scholar]
- 39.Hutchison ML, Walters LD, Avery SM, Munro F, Moore A. 2005. Analyses of livestock production, waste storage, and pathogen levels and prevalences in farm manures. Appl Environ Microbiol 71:1231–1236. doi: 10.1128/AEM.71.3.1231-1236.2005. [DOI] [PMC free article] [PubMed] [Google Scholar]
- 40.Dalzini E, Bernini V, Bertasi B, Daminelli P, Losio MN, Varisco G. 2016. Survey of prevalence and seasonal variability of Listeria monocytogenes in raw cow milk from northern Italy. Food Control 60:466–470. doi: 10.1016/j.foodcont.2015.08.019. [DOI] [Google Scholar]
- 41.Loncarevic S, Økland M, Sehic E, Norli HS, Johansson T. 2008. Validation of NMKL method no. 136—Listeria monocytogenes, detection and enumeration in foods and feed. Int J Food Microbiol 124:154–163. doi: 10.1016/j.ijfoodmicro.2008.03.032. [DOI] [PubMed] [Google Scholar]
- 42.Bansal NS, McDonell FHY, Smith A, Arnold G, Ibrahim GF. 1996. Multiplex PCR assay for the routine detection of Listeria in food. Int J Food Microbiol 33:293–300. doi: 10.1016/0168-1605(96)01161-0. [DOI] [PubMed] [Google Scholar]
- 43.Doumith M, Buchrieser C, Glaser P, Jacquet C, Martin P. 2004. Differentiation of the major Listeria monocytogenes serovars by multiplex PCR. J Clin Microbiol 42:3819–3822. doi: 10.1128/JCM.42.8.3819-3822.2004. [DOI] [PMC free article] [PubMed] [Google Scholar]
- 44.Autio T, Hielm S, Miettinen M, Sjöberg AM, Aarnisalo K, Björkroth J, Mattila-Sandholm T, Korkeala H. 1999. Sources of Listeria monocytogenes contamination in a cold-smoked rainbow trout processing plant detected by pulsed-field gel electrophoresis typing. Appl Environ Microbiol 65:150–155. [DOI] [PMC free article] [PubMed] [Google Scholar]
- 45.Brown LD, Cat TT, DasGupta A. 2001. Interval estimation for a proportion. Stat Sci 16:101–133. doi: 10.1214/ss/1009213286. [DOI] [Google Scholar]
- 46.Jarvis B, Wilrich C, Wilrich PT. 2015. Reconsideration of the derivation of most probable numbers, their standard deviations, confidence bounds and rarity values. J Appl Microbiol 119:905–905. doi: 10.1111/jam.12901. [DOI] [PubMed] [Google Scholar]
Associated Data
This section collects any data citations, data availability statements, or supplementary materials included in this article.