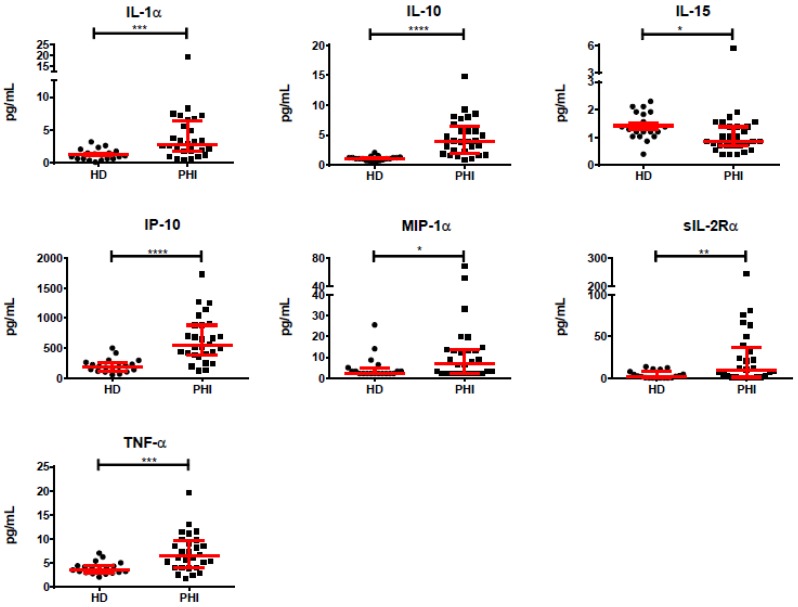
Figure 3.
Plasma levels of IL-1α, IL-10, IL-15, IP-10, MIP-1α, sIL-2Rα, and TNF-α in samples obtained at enrollment of recently infected HIV+ subjects (PHI, baseline samples) and healthy donors (HD). Dots represent data from individual subjects. Median and interquartile ranges (IQR25–75) are shown in red. p-values were calculated using Mann–Whitney test. Asterisks denote p-values as follows: * p < 0.05, ** p < 0.01, *** p < 0.005, **** p < 0.0001. After false discovery rate (FDR) adjustment, all but macrophage inflammatory protein (MIP)-1α remained significantly different.

