

Abstract
Background
In response to increasing opioid overdoses, US prevention efforts have focused on prescriber education and supply, demand and harm reduction strategies. Limited evidence informs which interventions are effective. We evaluated Project Lazarus, a centralised statewide intervention designed to prevent opioid overdose.
Methods
Observational intervention study of seven strategies. 74 of 100 North Carolina counties implemented the intervention. Dichotomous variables were constructed for each strategy by county-month. Exposure data were: process logs, surveys, addiction treatment interviews, prescription drug monitoring data. Outcomes were: unintentional and undetermined opioid overdose deaths, overdose-related emergency department (ED) visits. Interrupted time-series Poisson regression was used to estimate rates during preintervention (2009–2012) and intervention periods (2013–2014). Adjusted IRR controlled for prescriptions, county health status and time trends. Time-lagged regression models considered delayed impact (0–6 months).
Results
In adjusted immediate-impact models, provider education was associated with lower overdose mortality (IRR 0.91; 95% CI 0.81 to 1.02) but little change in overdose-related ED visits. Policies to limit ED opioid dispensing were associated with lower mortality (IRR 0.97; 95% CI 0.87 to 1.07), but higher ED visits (IRR 1.06; 95% CI 1.01 to 1.12). Expansions of medication-assisted treatment (MAT) were associated with increased mortality (IRR 1.22; 95% CI 1.08 to 1.37) but lower ED visits in time-lagged models.
Conclusions
Provider education related to pain management and addiction treatment, and ED policies limiting opioid dispensing showed modest immediate reductions in mortality. MAT expansions showed beneficial effects in reducing ED-related overdose visits in time-lagged models, despite an unexpected adverse association with mortality.
INTRODUCTION
Overdose deaths attributable to prescription opioid analgesics (OA) in the US increased by 200% from 2000 to 2014.1 While OA non-medical use has remained steady or has slightly decreased in recent years, heroin use has increased,2 as has the use of potent illicitly manufactured opioids.3,4 This crisis is unparalleled in the US since the AIDS epidemic, and will require substantial changes to healthcare delivery and societal norms to reverse.
The White House Office of National Drug Control Policy (ONDCP) in 2015 (with updates in 2016) announced broad federal initiatives and funding to address the crisis.5 Among these are OA prescriber training, use of medication-assisted treatment (MAT), encouraging the use of prescription drug monitoring programmes (PDMPs) and expanding naloxone distribution. In addition, ONDCP has promoted community education, and other agencies have suggested similar solutions.6
Prior to national prevention efforts, a centralised statewide intervention to reduce overdose was initiated in 2013 in North Carolina (NC). It comprised a set of ‘bottom up’ opioid overdose prevention strategies implemented by community-based coalitions in conjunction with ‘top down’ efforts to change healthcare policies and prescriber behaviour.7 The intervention was coordinated by the state’s Medicaid authority, Community Care of North Carolina (CCNC)8 and the Mountain Area Health Education Centre (MAHEC). County-level coalitions were invited to select and implement strategies they considered appropriate for their community from among those included in the ‘Project Lazarus’ model. This intervention model comprises seven supply, demand and harm reduction strategies (see online supplementary methods); pilot results showed a 69% reduction in opioid overdose in one NC county.9
The seven intervention strategies are similar to national efforts, including the US Food and Drug Administration Risk Evaluation and Mitigation Strategies (REMS).10 The effects of the intervention on opioid overdose mortality and morbidity were evaluated during 2 years of implementation (2013 through 2014). We investigated which strategies were most effective and thus most promising.
METHODS
Design and setting
NC is a large state in the southeastern US, with overdose rates similar to the national average. An observational study was conducted to examine the effects of a centralised statewide intervention to reduce opioid overdose among NC residents (population 9 943 964 in 2014). The intervention and evaluation were conducted by county (n = 100). Data were collected from multiple sources and aggregated at the county-month level. Statistical models employed an interrupted time-series approach (see online supplementary methods). All 100 counties were included in all analyses.
Seven intervention strategies
The seven strategies in the intervention model that we provided coalitions were intended to be implemented together. (1) Community education promoted public awareness of prescription opioid overdose. (2) Provider education focused on educating medical professionals in chronic pain treatment, including group trainings and in-office ‘academic detailing,’ or tailored instruction. The NC Medical Board’s published guidelines for pain management were referenced in trainings.11 (3) Hospital emergency department (ED) policies revised hospital practices to limit ED OA prescribing and require checking the PDMP before prescribing. (4) Diversion control was designed to remove unused medications and train law enforcement on OA diversion. (5) Support programmes for patients with pain provided support groups, case management and pain clinic vetting and referrals. (6) Naloxone policies promoted the adoption of policies to disseminate the opioid antagonist naloxone to opioid users, first responders and caregivers. (7) Addiction treatment was intended to remove barriers to accessing MAT, specifically using methadone and buprenorphine (see table 1 in online supplementary methods).
Coalition development and support
The intervention was made available by CCNC to 84 counties in central and eastern NC, and by MAHEC in 16 western counties, with support from Project Lazarus, the non-profit organisation that developed the intervention model. When requested by coalitions, these organisations conducted stakeholder presentations and community forums, provided training, technical assistance, model ED policies and toolkits on chronic pain and addiction, and guided coalition development and community education. Beginning in late 2012, these organisations solicited applications from coalitions that demonstrated a commitment to adopt the intervention model. Coalitions received annual grants of $6500 to $34 400, supported by 12 funding organisations contributing via a coordinated mechanism (see Funding in online supplementary methods). Coalitions were required to implement at least three of the seven strategies. Tailored materials were developed for tribal communities and military installations.
Intervention data
The intervention was implemented starting in March 2013. Data collection included a preintervention period (January 2009–February 2013) and an intervention period (March 2013–December 2014). A dichotomous variable was constructed for each strategy by county-month, with ‘0’ indicating no implementation and ‘1’ indicating any implementation of that strategy.
Surveys of community coalition leaders and coordinators
Coalition and CCNC coordinator activities were monitored using retrospective biannual online surveys. Surveys mapped county-level implementation of each strategy. Surveys were used to ascertain naloxone policies, support programmes for patients with pain, ED policies, provider education and community education.
Addiction treatment admissions
Removing barriers to MAT was a goal of the intervention, with coalition messaging destigmatising these therapies and encouraging prescribers to become certified for office-based buprenorphine treatment. Data on drug treatment admissions were available from the North Carolina Treatment Outcomes and Programme Performance System, a quality monitoring system. Counts of new patients entering methadone treatment were collected from intake interviews. Using PDMP data, the number of new patients receiving pharmacy-dispensed oral buprenorphine for addiction treatment (eg, Subutex, Suboxone) was added to clinic methadone admission counts to create a population utilisation rate for MAT.
Diversion Control
Information concerning the location of fixed site disposal bins and pill take-back events was collected by surveys. Data on law enforcement trainings were provided by the NC State Bureau of Investigation.
Outcome data
Mortality data
Vital statistics data on overdose mortality were obtained from a public repository.12 ICD-10 codes were used to identify all opioid poisoning deaths with unintentional and undetermined intent.13 Deaths were included if the medical examiner attributed them to prescription opioid analgesics or illicitly manufactured opioids (eg, fentanyl-laced heroin) as a primary or contributing cause.
Morbidity data from EDs
Data from hospital EDs (n = 124) were obtained from the North Carolina Disease Event Tracking and Epidemiologic Collection Tool.14,15 Visit-level records were abstracted using ICD-9-CM codes to identify acute opioid overdoses arising from all intents.16 Due to possible missing data arising from heterogeneity in data transmission, the proportion of injury cases without E-codes was used to adjust counts and standard errors.17
Covariate data
Since the intervention did not explicitly attempt to reduce the amount of opioids dispensed but rather promulgated the message that opioids should be used appropriately, OA dispensing rates were treated as a covariate instead of an outcome. PDMP data on all outpatient dispensed OA prescriptions, patients and providers were abstracted at the county-month level. An interpolated composite value of county health factors, derived from the Robert Wood Johnson Foundation County Health Rankings,18 was included as a covariate to account for differences over time in county-level general health status. Immediate-effect, adjusted models also accounted for seasonal variation and detrending for secular (annual) effects.
Statistical models
Unadjusted average rate differences were calculated for intervention and non-intervention counties before and during the intervention. We used generalised estimating equations in scaled Poisson regression models to estimate incidence rate ratios (IRR) comparing intervention to non-intervention county-months, using the resident population as the offset (ie, denominator for rates). The number of county-months was 7200. Implementation of the seven strategies was modelled as dichotomous variables for each intervention. In the adjusted models, inclusion of all seven variables can be interpreted as the estimate of the effectiveness of each strategy while controlling for the implementation of the other six. Immediate impact models considered the effect of overdose outcomes in the same month as the intervention. Time-lagged regression models considered delayed impact of interventions by staggering outcomes 0 to 6 months after the intervention, with adjustment for opioid prescriptions and county health status only. Both approaches addressed mortality and morbidity outcomes separately.
Ethics review
This study was approved by the institutional review board of the University of North Carolina (IRB 12–2570).
RESULTS
General trends over the study period
The annual prevalence of unique OA patients statewide decreased by 6.9% over the study period, from 23.0% of all state residents in 2009 to 21.4% in 2014 (figure 1). In contrast, annual prescriptions dispensed for OA increased by 17.3%, from 6.22 million to 7.30 million, an 11.4% increase (0.66 to 0.73 per person-year). The most commonly dispensed OAs were hydrocodone, oxycodone, codeine and morphine.
Figure 1.
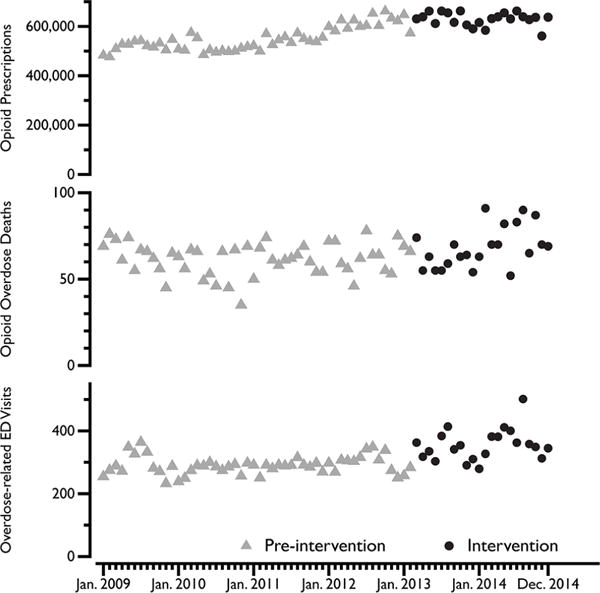
Monthly counts of outcomes before and during intervention, North Carolina, 2009–2014. Statewide, monthly counts of outpatient opioid analgesic (OA) prescriptions dispensed, opioid overdose mortality and overdose-related hospital emergency department (ED) visits. In subsequent modelling, OA prescriptions dispensed was treated as a covariate, while overdose was the outcome variable. Grey triangles represent the pre-intervention period used in models (January 2009 to February 2013) and the black dots represent the intervention period (March 2013 to December 2014). By the end of the intervention period, the intervention was implemented in 74 of 100 counties, representing 70% of the total population.
The rate of unintentional/undetermined deaths associated with all opioids increased by 10.2% statewide over the period 2009 to 2014, from 8.1 per 100000 person-years to 9.0. The rate of opioid overdose-related ED visits increased by 18.6% statewide over the same period, from 37.4 to 44.3 per 100000 person years.
Intervention implementation
A total of 74 out of 100 counties implemented intervention components by the end of 2014, covering 70% of the state population. Non-implementing counties were those that did not submit an application for funding or were ineligible due to a lack of resources.
Overdose mortality rates at baseline were lower in counties participating in the intervention than those with no direct involvement, 6.19 per 1 000 000 person-months versus 6.93, respectively. At the end of the observation period, average overdose death rates remained lower in intervention counties (6.79 vs 7.18 during the intervention period), but with a postintervention versus preintervention risk difference that was 0.21 per 1000000 person-months higher in intervention counties. Initially, ED visit rates for overdose were lower in intervention counties than non-intervention counties at baseline, 29.7 per 1000000 person-months versus 31.4, respectively. During the intervention period, ED visits remained lower in intervention counties (34.4 vs 39.4 during the intervention period). The postintervention versus preintervention risk difference was 3.15 per 1000000 person-months lower in intervention counties. However, these unadjusted rates do not take into account community health status, the presence of multiple interventions, secular time trends or the persistence of interventions, as subsequent models do.
Immediate impact of intervention
In adjusted regression models, the seven strategies were treated as independent exposures simultaneously, comparing implementation to no activity, adjusted for rate of OA prescriptions, county health status, time trends and seasonality. These models assumed an immediate impact of the intervention in the same month as implementation. Compared to unadjusted models of each strategy, adjusted models (tables 1 and 2) yielded directionally similar results, but adjustment resulted in IRRs closer to the null.
Table 1.
Intervention effect on overdose mortality, by strategy, North Carolina, 2009–2014 (n=7200)
|
|
Unadjusted models
|
Adjusted model
|
|||||||
|---|---|---|---|---|---|---|---|---|---|
| Strategy | Level | County-months | Deaths | IRR | 95% CI | CIR | IRR | 95% CI | CIR |
| No activity | 4971 | 2642 | 1 | 1 | |||||
| Diversion control | Implementation | 2229 | 1939 | 1.04 | 0.98 to 1.11 | 1.12 | 1.10 | 0.98 to 1.24 | 1.12 |
|
| |||||||||
| No activity | 6216 | 3780 | 1 | 1 | |||||
| Naloxone policies | Implementation | 984 | 801 | 1.02 | 0.94 to 1.10 | 1.16 | 1.04 | 0.94 to 1.16 | 1.16 |
|
| |||||||||
| No activity | 5969 | 3381 | 1 | 1 | |||||
| Community education | Implementation | 1231 | 1200 | 1.02 | 0.95 to 1.09 | 1.14 | 1.06 | 0.95 to 1.19 | 1.14 |
|
| |||||||||
| No activity | 4962 | 2961 | 1 | 1 | |||||
| Provider education | Implementation | 2238 | 1620 | 0.96 | 0.90 to 1.02 | 1.13 | 0.91 | 0.81 to 1.02 | 1.13 |
|
| |||||||||
| No activity | 6684 | 3830 | 1 | 1 | |||||
| Support for patients with pain | Implementation | 516 | 751 | 0.76 | 0.70 to 0.82 | 1.17 | 1.07 | 0.95 to 1.21 | 1.17 |
|
| |||||||||
| No activity | 5485 | 3196 | 1 | 1 | |||||
| Hospital ED policy | Implementation | 1715 | 1385 | 1.09 | 1.03 to 1.16 | 1.13 | 0.97 | 0.87 to 1.07 | 1.13 |
|
| |||||||||
| No activity | 1581 | 1252 | 1 | 1 | |||||
| Addiction treatment | Implementation | 5619 | 3329 | 1.84 | 1.73 to 1.97 | 1.14 | 1.22 | 1.08 to 1.37 | 1.14 |
ED, emergency department. CIR, confidence interval ratio.
Table 2.
Intervention effect on overdose-related hospital emergency department visits, by strategy, North Carolina, 2009–2014 (n=7200)
|
|
Unadjusted models
|
Adjusted model
|
|||||||
|---|---|---|---|---|---|---|---|---|---|
| Strategy | Level | county-months | ED Visits | IRR | 95% CI | CIR | IRR | 95% CI | CIR |
| No activity | 4971 | 12409 | 1 | 1 | |||||
| Diversion control | Implementation | 2229 | 9917 | 1.14 | 1.11 to 1.17 | 1.05 | 1.01 | 0.95 to 1.07 | 1.12 |
|
| |||||||||
| No activity | 6216 | 18328 | 1 | 1 | |||||
| Naloxone policies | Implementation | 984 | 3998 | 1.05 | 1.01 to 1.08 | 1.07 | 1.09 | 1.04 to 1.14 | 1.10 |
|
| |||||||||
| No activity | 5969 | 15858 | 1 | 1 | |||||
| Community education | Implementation | 1231 | 6468 | 1.17 | 1.14 to 1.21 | 1.06 | 1.04 | 0.98 to 1.09 | 1.11 |
|
| |||||||||
| No activity | 4962 | 13614 | 1 | 1 | |||||
| Provider education | Implementation | 2238 | 8712 | 1.12 | 1.09 to 1.15 | 1.06 | 1.01 | 0.95 to 1.07 | 1.12 |
|
| |||||||||
| No activity | 6684 | 17960 | 1 | 1 | |||||
| Support for patients with pain | Implementation | 516 | 4366 | 0.94 | 0.91 to 0.97 | 1.07 | 1.06 | 1.00 to 1.12 | 1.12 |
|
| |||||||||
| No activity | 5485 | 15347 | 1 | 1 | |||||
| Hospital ED policy | Implementation | 1715 | 6979 | 1.15 | 1.12 to 1.18 | 1.06 | 1.06 | 1.01 to 1.12 | 1.10 |
|
| |||||||||
| No activity | 1581 | 7242 | 1 | 1 | |||||
| Addiction treatment | Implementation | 5619 | 15084 | 1.44 | 1.40 to 1.48 | 1.06 | 1.00 | 0.95 to 1.07 | 1.12 |
ED, emergency department. CIR, confidence interval ratio.
While most adjusted-model strategies did not have adequate precision for formal statistical significance, directional results were evident (figures 2 and 3). In adjusted models of immediate impact, healthcare provider education was associated with 9.1% (IRR 0.91; 95% CI 0.81 to 1.02) lower overdose mortality, but little change in overdose-related ED visits. Policies to limit OA dispensing in EDs were associated with 3% lower mortality (IRR 0.97; 95% CI 0.87 to 1.07), but 6% higher overdose-related ED visits (IRR 1.06; 95% CI 1.01 to 1.12). Naloxone policies, community education and support for patients with pain were associated with small increases in overdose mortality (table 1). Diversion control (IRR 1.10; 95% CI 0.98 to 1.24) and greater use of addiction treatment (IRR 1.22; 95% CI 1.08 to 1.37) were associated with higher same-month mortality rates. In adjusted models of overdose-related ED visits, same-month implementation showed small increased associations with all strategies (table 2).
Figure 2.
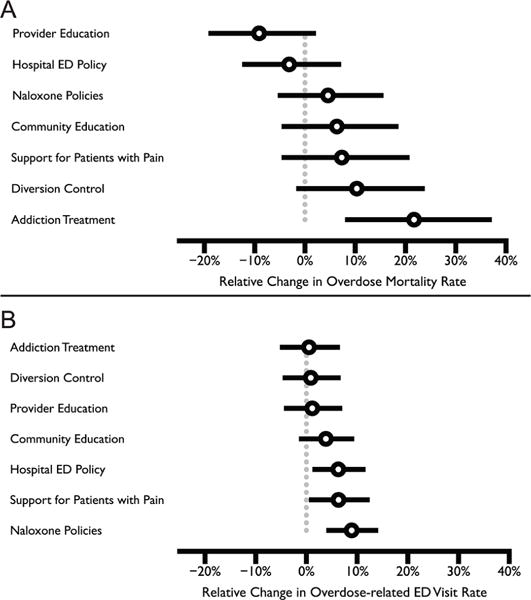
Effects of implementing intervention strategies on overdose mortality and overdose-related emergency department (ED) visits. The outcome for A and B are overdose mortality and overdose-related ED visits, respectively. Results from multivariate regression models considered all seven intervention strategies simultaneously, after adjusting for the rate of opioid analgesic prescriptions, county health status, annual trends and seasonality. The models used to generate the figures used 0 for the referent group, and 1 for the implementation of the strategy, with indicator coding. IRRs (tables 1 and 2) were converted to percent change, represented by open circles. The horizontal bars are the model-based 95% CI. The grey vertical line represents the null.
Figure 3.
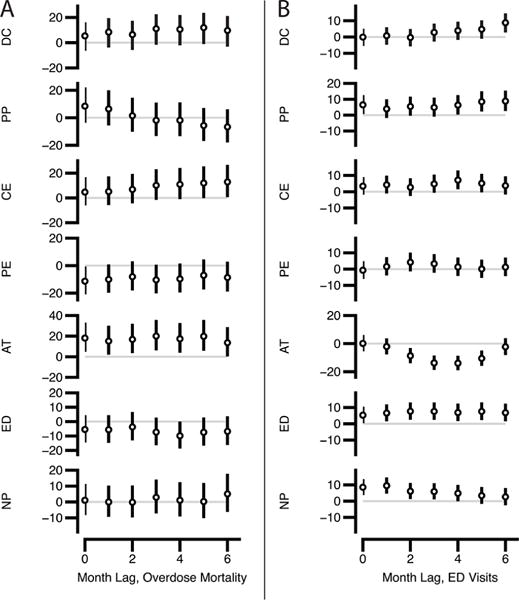
Effects of implementing intervention strategies in time-lagged regression models of delayed impact of intervention.The vertical axis is percent change in overdose rates between intervention and non-intervention counties; the outcome in A is overdose mortality and B is overdose-related emergency department (ED) visits. Results from time-lagged (0 to 6 months) multivariate regression models considered all seven intervention strategies simultaneously, after adjusting for the rate of opioid analgesic prescriptions and county health status. AT, greater utilisation of addiction treatment; CE, community education; DC, diversion control; NP, take-home naloxone policies; PE, prescriber education on pain management and addiction; PP, support programme for patients with pain.
Delayed impact of intervention
Most intervention strategies showed similar time-delayed effects as to models of same-month impact on overdose mortality (figure 3). An exception was support programmes for patients with pain, which were associated with lower mortality rates in models with greater uptake periods after implementation. Diversion control was associated with gradual increases in overdose-related ED visits after 3 months, whereas naloxone policies were associated with gradual decreases at 5 and 6 months. Addiction treatment utilisation showed the greatest time-lagged effect, with significantly lower ED visits in models with 2 to 5 months of outcome lag (greatest reduction at 4 months; IRR 0.86, 95% CI 0.81 to 0.91), but returning to the null at 6 months.
DISCUSSION
We sought to evaluate which of the seven prevention strategies that constituted the Project Lazarus model most effectively reduced opioid overdose. Prescriber education concerning pain management and addiction, and ED policies limiting OA prescribing and encouraging PDMP checks, had the greatest, though modest and not statistically significant, immediate impact on mortality. MAT, in the form of buprenorphine and methadone, showed gradual reductions in overdose-related ED visits after 2 to 5 months of uptake. While this effect of MAT on ED visits is consistent with prior epidemiological studies19 and meta-analyses,20–22 our findings extend current knowledge by demonstrating that reductions in overdose may be persistent even after controlling for other interventions. However, MAT was associated with increased overdose mortality in both immediate-impact and delayed-impact models, which differed from previous findings.23 These divergent results, and the persistent magnitude of the association in our lagged models, suggest that the populations that use MAT are not the populations contributing excess mortality.
While community coalition-based interventions have not been uniformly prioritised as national policy, our experience in NC suggests the critical role that coalitions can play in promoting the prominence of the overdose issue and improving sustainability of interventions.24 While no immediate impact on overdose was observed from diversion control, naloxone policies or community education, these strategies were intended to broaden the base of stakeholders involved in the initiative, and were particularly important for engaging law enforcement, pharmacists, faith communities and schools.25,26
Study results are expected to generalise to other areas of the country because efforts to reduce overdose are now present in every state. Studies of a five-strategy intervention to reduce OA overdose deaths in Staten Island (New York City), which emphasised promulgating pain treatment guidelines, documented a 29% decline in overdose deaths from 2011 to 2013 and changes in OA prescribing, although it did not attempt to isolate the impact of individual strategies, nor did it focus on addiction treatment.27,28 A comprehensive opioid utilisation programme instituted by a health insurance provider in Massachusetts showed declines in opioid prescribing.29 Patient support and education programme have also been shown to be effective.30,31 Considered collectively, these studies reinforce findings that a multimodal approach with medical and community components may offer solutions for reducing overdose.
Previous research has demonstrated reductions in mortality after the implementation of take-home naloxone programme.23,32 However, the strategy evaluated in this analysis was limited to the development of policies to encourage take-home naloxone, not actual reversals, and thus may take longer to demonstrate an effect than the time period under analysis. State legislation removing legal barriers to naloxone distribution was enacted in April 2013; while subsequent local policies took the form of standing orders from local health departments and training of law enforcement to use naloxone, uptake was limited. During the study period, the largest naloxone distribution programme, implemented by the North Carolina Harm Reduction Coalition, was starting, but reported 242 reversal events by the end of December 2014 (R Childs, personal communication, NCHRC, 2015). Because most reversals were clustered in a handful of cities and involved predominantly heroin overdoses, the reversal count was too geo-temporally sparse to incorporate into models. Project Lazarus encouraged naloxone co-prescribing, distributed kits that contained educational materials and disseminated trainings and toolkits. Physicians reported overdose reversals in social media during the study period from addiction treatment programme, but due to the decentralised nature of naloxone distribution, records of reversals were not systematically documented.
The statewide effort to address the opioid crisis fostered unprecedented collaboration between stakeholders, and afforded the opportunity to bring together disparate secondary data sources into a single evaluation framework. The results constitute one of the nation’s largest observational evaluations of coalition effectiveness. An earlier review found that only 10 of 34 studies reported improvements in community health that could be attributed with confidence to coalition activity.33 Caution must be used in assigning causality to the efforts of the coalitions, due to the lack of an experimental design in this study.
While intervention counties consistently had lower overdose rates than non-intervention counties, there was an increase in the absolute number of opioid overdoses statewide, similar to national trends.1 An increase in heroin overdose deaths was noted during the study period,34 which may be due in part to reductions in the supply of diverted OA, although the data we collected do not address this issue. In the pilot implementation,9 an absolute reduction in overdose deaths took 3 years to manifest, suggesting that continued monitoring is warranted.
Study limitations
The study’s greatest limitation was our inability to control for allocation of the intervention due to funder priorities and the voluntary nature of funding applications. As a result, uncontrolled or residual confounding may be present. Measures with temporal and geographic specificity were not accessible for factors suspected to affect overdose rates or coalition effectiveness: fluctuations in heroin purity and the proliferation of fentanyl-heroin, law enforcement arrests, quality of coalition leadership,35 history of collaboration among organisations,36 PDMP query rates by prescribers37 and commercial health insurer policy changes.29 Our models necessarily assumed the effect of these potential confounders to be non-differential. Similarly, we assumed that the REMS had no differential impact on county outcomes since they were intended to be implemented uniformly, were not fully implemented during the study period38 or only applied to very limited numbers of prescriptions.39 In addition, there may have been ‘contamination’ of effects and outcomes across adjacent counties and residual misclassification bias from non-reporting sites. The effect of prescriber education and law enforcement trainings may have been attenuated in models because the exact location of each attendee was not available, and the training was allocated to the county in which it was conducted. Data on the use of naltrexone for opioid addiction were not available, and should be considered in future studies. The use of dichotomously coded exposures was necessitated by both the goals of the analysis and the nature of the survey data (see online supplementary methods). Finally, in the original pilot study of the Project Lazarus model, the strongest effects were observed after 3 years of implementation. A longer observation period of the statewide implementation may provide stronger evidence of the effects.
Mortality data have inherent flaws,40 mainly lack of specificity of both substances and intent. Despite these shortcomings, overdose deaths were analysed because they were the primary target of the interventions and vital statistics are the standard source. NC medical examiners have a standardised methodology for causal attribution of overdose, using death scene investigation reports, PDMP data, medical records, interviews and postmortem toxicology assays that do not rely solely on the presence of opioid or predetermined concentration thresholds.
CONCLUSIONS
These findings provide guidance as to which strategies may be most effective in reducing opioid overdose. Among the seven strategies, prescriber education and hospital ED policies showed modest immediate reductions in mortality, whereas addiction treatment showed beneficial effects in reducing ED-related overdose visits in time-lagged models, despite an unexpected adverse association with mortality. Future research should consider experimental designs, the resources available to communities and the universe of available data.
Supplementary Material
What is already known on this subject
-
►
Opioid analgesic overdoses have increased in the US for over 20 years.
-
►
In response, policy has focused on prescriber education and on supply, demand and harm reduction strategies.
What this study adds
-
►
74 of 100 North Carolina counties adopted the Project Lazarus model, comprised of seven distinct overdose prevention strategies, with funding beginning in 2013.
-
►
Prescriber education related to pain management and addiction treatment, and emergency department (ED) policies limiting opioid dispensing showed modest immediate reductions in mortality (9% and 3%, respectively).
-
►
Medication-assisted treatment expansions showed beneficial effects in reducing ED-related overdose visits in time-lagged models (up to a 14% reduction), despite an unexpected adverse association with mortality (a 22% increase).
Acknowledgments
The authors thank a wide range of collaborators for funding, data, and expertise. The authors are grateful to coalitions and their leaders, CCNC Coordinators, local health departments, public health advocates, and other stakeholders who implemented the intervention, and are too numerous to name, but whose contributions were essential (see Funding in online supplementary methods).
Funding This evaluation study was funded by the United States Centers for Disease Control and Prevention (CDC; Cooperative Agreement 5U01CE002162-02), the Kate B. Reynolds Charitable Trust (KBR), a private foundation, and the Office of Rural Health (ORH), NC Department of Health and Human Services. The latter two entities (KBR and ORH) selected the order in which counties received funding for intervention implementation, but had no role in collection, management, analysis, and interpretation of the data; nor preparation, review, or approval of the manuscript; nor decision to submit the manuscript for publication.
Footnotes
Additional material is published online only. To view please visit the journal online (http://dx.doi.org/10.1136/injuryprev-201 7-042396).
Contributors AAA, AM, CLR, NS, CS, SWM and ND were involved in study design. Data collection instruments were designed by AM, CLR, NS, CS and ND. AAA, AM and NS were directly involved in data collection. The analyses were conducted by AAA, ND and SWM. AAA and ND had full access to all of the data in the study and take responsibility for the integrity of the data and the accuracy of the data analysis. KM and SWM contributed to the manuscript’s intellectual development and revisions, in addition to the other authors. All authors have given final approval of the version to be published. AAA and ND had full access to all of the data in the study and take responsibility for the integrity of the data and the accuracy of the data analysis.
Disclaimer The findings and conclusions in this report are those of the authors and do not necessarily represent the official position of the Centers for Disease Control and Prevention.
Competing interests KM is an employee of the United States Centers for Disease Control and Prevention, which funded the evaluation of the study.
Ethics approval University of North Carolina at Chapel Hill (IRB 12-2570).
Provenance and peer review Not commissioned; externally peer reviewed.
Data sharing statement The data set used in analysis containing exposure and contextual variables is available for collaborative sharing upon request to the authors. For many variables public data were used and the authors can direct interested parties to the original sources. Data on prescriptions, hospital emergency department visits and drug treatment admissions can be made available for public use but require separate data use agreements directly with the NC Department of Health and Human Services, and cannot be disclosed by the authors without their written permission. Geographic identifiers for low population areas may be anonymised due to privacy concerns.
References
- 1.Rudd RA, Aleshire N, Zibbell JE, et al. Increases in drug and opioid overdose deaths– United States, 2000-2014. MMWR Morb Mortal Wkly Rep. 2016;64:1378–82. doi: 10.15585/mmwr.mm6450a3. [DOI] [PubMed] [Google Scholar]
- 2.Center for Behavioral Health Statistics and Quality. Behavioral Health Trends in the United States: Results from the 2014 National Survey on Drug Use and Health. Rockville, Maryland: Substance Abuse and Mental Health Services Administration; 2015. (HHS Publication No. SMA 15-4927, NSDUH Series H-50). [Google Scholar]
- 3.Gladden RM, Martinez P, Seth P. Fentanyl Law Enforcement Submissions and increases in Synthetic Opioid-Involved Overdose Deaths – 27 States, 2013–2014. MMWR Morb Mortal Wkly Rep. 2016;65:837–43. doi: 10.15585/mmwr.mm6533a2. [DOI] [PubMed] [Google Scholar]
- 4.Peterson AB, Gladden RM, Delcher C, et al. Increases in Fentanyl-Related Overdose Deaths – Florida and Ohio, 2013-2015. MMWR Morb Mortal Wkly Rep. 2016;65:844–9. doi: 10.15585/mmwr.mm6533a3. [DOI] [PubMed] [Google Scholar]
- 5.United States. National drug control strategy. Washington, DC: Office of National Drug Control Policy, Executive Office of the President; 2015. [Google Scholar]
- 6.Volkow ND, McLellan TA. Curtailing diversion and abuse of opioid analgesics without jeopardizing pain treatment. JAMA. 2011;305:1346–7. doi: 10.1001/jama.2011.369. [DOI] [PubMed] [Google Scholar]
- 7.Finch JW, McEwen S. Educating medical practitioners about safe opioid prescribing: training from the Governor’s Institute on Substance Abuse. N C Med J. 2013;74:233–4. [PubMed] [Google Scholar]
- 8.Lancaster M, McKee J, Mahan A. The chronic pain initiative and community care of North Carolina. N C Med J. 2013;74:237–41. [PubMed] [Google Scholar]
- 9.Albert S, Brason FW, Sanford CK, et al. Project Lazarus: community-based overdose prevention in rural North Carolina. Pain Med. 2011;12(Suppl 2):S77–85. doi: 10.1111/j.1526-4637.2011.01128.x. [DOI] [PubMed] [Google Scholar]
- 10.Center For Drug Evaluation And Research, Food And Drug Administration. Blueprint for prescriber continuing education program. J Pain Palliat Care Pharmacother. 2012;26:127–30. doi: 10.3109/15360288.2012.680013. [DOI] [PubMed] [Google Scholar]
- 11.Trado CE. Addressing pain management and palliative care: the official position of the North Carolina Medical Board. N C Med J. 2004;65:236–41. [PubMed] [Google Scholar]
- 12.State Center for Health Statistics. North Carolina Vital Statistics – Deaths 2009–2014. UNC Dataverse v1. Chapel Hill, North Carolina: Odum Institute Dataverse – University of North Carolina; 2011. p. 16. [Google Scholar]
- 13.Injury Surveillance Workgroup 7. Consensus recommendations for National and State Poisoning Surveillance. The Safe States Alliance; Atlanta, GA: 2012. [Google Scholar]
- 14.Waller AE, Ising AI, Deyneka L, et al. Running the numbers. North Carolina Emergency Department visit data available for public health surveillance. N C Med J. 2007;68:289–91. [PubMed] [Google Scholar]
- 15.Samoff E, Waller A, Fleischauer A, et al. Integration of syndromic surveillance data into public health practice at state and local levels in North Carolina. Public Health Rep. 2012;127:310–7. doi: 10.1177/003335491212700311. [DOI] [PMC free article] [PubMed] [Google Scholar]
- 16.Ising A, Proescholdbell S, Harmon KJ, et al. Use of syndromic surveillance data to monitor poisonings and drug overdoses in state and local public health agencies. Inj Prev. 2016;22(Suppl 1):i43–9. doi: 10.1136/injuryprev-2015-041821. [DOI] [PubMed] [Google Scholar]
- 17.Reardon JM, Harmon KJ, Schult GC, et al. Use of diagnosis codes for detection of clinically significant opioid poisoning in the emergency department: a retrospective analysis of a surveillance case definition. BMC Emerg Med. 2016;16:11. doi: 10.1186/s12873-016-0075-4. [DOI] [PMC free article] [PubMed] [Google Scholar]
- 18.Remington PL, Catlin BB, Gennuso KP. The County Health Rankings: rationale and methods. Popul Health Metr. 2015;13:11. doi: 10.1186/s12963-015-0044-2. [DOI] [PMC free article] [PubMed] [Google Scholar]
- 19.Emmanuelli J, Desenclos JC. Harm reduction interventions, behaviours and associated health outcomes in France, 1996-2003. Addiction. 2005;100:1690–700. doi: 10.1111/j.1360-0443.2005.01271.x. [DOI] [PubMed] [Google Scholar]
- 20.Mattick RP, Breen C, Kimber J, et al. Methadone maintenance therapy versus no opioid replacement therapy for opioid dependence. Cochrane Database Syst Rev. 2009:CD002209. doi: 10.1002/14651858.CD002209. [DOI] [PubMed] [Google Scholar]
- 21.Mattick RP, Breen C, Kimber J, et al. Buprenorphine maintenance versus placebo or methadone maintenance for opioid dependence. Cochrane Database Syst Rev. 2014:CD002207. doi: 10.1002/14651858.CD002207.pub2. [DOI] [PubMed] [Google Scholar]
- 22.Nielsen S, Larance B, Degenhardt L, et al. Opioid agonist treatment for pharmaceutical opioid dependent people. Cochrane Database Syst Rev. 2016:CD011117. doi: 10.1002/14651858.CD011117.pub2. [DOI] [PubMed] [Google Scholar]
- 23.Walley AY, Xuan Z, Hackman HH, et al. Opioid overdose rates and implementation of overdose education and nasal naloxone distribution in Massachusetts: interrupted time series analysis. BMJ. 2013;346:f174. doi: 10.1136/bmj.f174. [DOI] [PMC free article] [PubMed] [Google Scholar]
- 24.Sanford CK, Ringwalt C, McCort A. Lessons learned from Implementing Project Lazarus. North Carolina: Injury Prevention Research Center, University of North Carolina at Chapel Hill; 2016. [Google Scholar]
- 25.Barnes PA, Schaefer S, Middlestadt S, et al. Who’s who in the crew? Exploring participant involvement in the Active Living Coalition. Eval Program Plann. 2015;50:88–95. doi: 10.1016/j.evalprogplan.2014.11.006. [DOI] [PubMed] [Google Scholar]
- 26.Kegler MC, Rigler J, Honeycutt S. The role of community context in planning and implementing community-based health promotion projects. Eval Program Plann. 2011;34:246–53. doi: 10.1016/j.evalprogplan.2011.03.004. [DOI] [PubMed] [Google Scholar]
- 27.Paone D, Tuazon E, Kattan J, et al. Decrease in rate of opioid analgesic overdose deaths – Staten Island, New York City, 201 1-2013. MMWR Morb Mortal Wkly Rep. 2015;64:491–4. [PMC free article] [PubMed] [Google Scholar]
- 28.Kattan JA, Tuazon E, Paone D, et al. Public Health Detailing-A successful strategy to promote judicious opioid analgesic prescribing. Am J Public Health. 2016;106:1430–8. doi: 10.2105/AJPH.2016.303274. [DOI] [PMC free article] [PubMed] [Google Scholar]
- 29.Garcia MC, Dodek AB, Kowalski T, et al. Declines in opioid prescribing after a private Insurer Policy Change – Massachusetts, 2011–2015. MMWR Morb Mortal Wkly Rep. 2016;65:1125–31. doi: 10.15585/mmwr.mm6541a1. [DOI] [PubMed] [Google Scholar]
- 30.de la Cruz M, Reddy A, Balankari V, et al. The impact of an Educational program on patient Practices for Safe Use, Storage, and disposal of opioids at a Comprehensive Cancer center. Oncologist. 2017;22:115–21. doi: 10.1634/theoncologist.2016-0266. [DOI] [PMC free article] [PubMed] [Google Scholar]
- 31.Reddy A, de la Cruz M, Rodriguez EM, et al. Patterns of storage, use, and disposal of opioids among cancer outpatients. Oncologist. 2014;19:780–5. doi: 10.1634/theoncologist.2014-0071. [DOI] [PMC free article] [PubMed] [Google Scholar]
- 32.Wheeler E, Jones TS, Gilbert MK, et al. Opioid overdose Prevention Programs Providing Naloxone to Laypersons – United States, 2014. MMWR Morb Mortal Wkly Rep. 2015;64:631–5. [PMC free article] [PubMed] [Google Scholar]
- 33.Roussos ST, Fawcett SB. A review of collaborative partnerships as a strategy for improving community health. Annu Rev Public Health. 2000;21:369–402. doi: 10.1146/annurev.publhealth.21.1.369. [DOI] [PubMed] [Google Scholar]
- 34.Dasgupta N, Creppage K, Austin A, et al. Observed transition from opioid analgesic deaths toward heroin. Drug Alcohol Depend. 2014;145:238–41. doi: 10.1016/j.drugalcdep.2014.10.005. [DOI] [PubMed] [Google Scholar]
- 35.Kegler MC, Steckler A, McLeroy K, et al. Factors That Contribute to Effective Community Health Promotion Coalitions: A Study of 10 Project ASSIST Coalitions in North Carolina. Health Education & Behavior. 1998;25:338–53. doi: 10.1177/109019819802500308. [DOI] [PubMed] [Google Scholar]
- 36.Kegler MC, Rigler J, Honeycutt S. How does community context influence coalitions in the formation stage? A multiple case study based on the Community Coalition Action Theory. BMC Public Health. 2010;10:90. doi: 10.1186/1471-2458-10-90. [DOI] [PMC free article] [PubMed] [Google Scholar]
- 37.Delcher C, Wagenaar AC, Goldberger BA, et al. Abrupt decline in oxycodone-caused mortality after implementation of Florida’s Prescription Drug Monitoring Program. Drug Alcohol Depend. 2015;150:63–8. doi: 10.1016/j.drugalcdep.2015.02.010. [DOI] [PubMed] [Google Scholar]
- 38.Cepeda MS, Coplan PM, Kopper NW, et al. ER/LA Opioid Analgesics REMS: overview of ongoing assessments of its Progress and its impact on Health Outcomes. Pain Med. 2017;18:78–85. doi: 10.1093/pm/pnw129. [DOI] [PMC free article] [PubMed] [Google Scholar]
- 39.Food and Drug Administration, Public Health Service, U.S. Department of Health and Human Services. Shared risk evaluation mitigation strategy for all immediate-release transmucosal fentanyl dosage forms. J Pain Palliat Care Pharmacother. 2012;26:123–6. [Google Scholar]
- 40.Webster LR, Dasgupta N. Obtaining adequate data to determine causes of opioid-related overdose deaths. Pain Med. 2011;12(Suppl 2):S86–92. doi: 10.1111/j.1526-4637.2011.01132.x. [DOI] [PubMed] [Google Scholar]
Associated Data
This section collects any data citations, data availability statements, or supplementary materials included in this article.