

Abstract
Nonalcoholic fatty liver disease (NAFLD) is the most prevalent chronic liver disease in the world. The complete natural history of NAFLD is unknown because few high‐quality follow‐up studies have been conducted. Our aim was to find variables predicting disease severity through an extended follow‐up with serial biopsies. In a prospective cohort study, 129 patients who enrolled between 1988 and 1993 were asked to participate in a follow‐up study on two occasions; biochemical, clinical, and histologic data were documented. The mean time between biopsies was 13.7 (±1.7) and 9.3 (±1.0) years, respectively. At the end of the study period, 12 patients (9.3%) had developed end‐stage liver disease and 34% had advanced fibrosis. Out of the 113 patients with baseline low fibrosis (<3), 16% developed advanced fibrosis. Fibrosis progression did not differ among the different stages of baseline fibrosis (P = 0.374). Fifty‐six patients (43%) had isolated steatosis, of whom 9% developed advanced fibrosis (3 patients with biopsy‐proven fibrosis stage F3‐F4 and 2 patients with end‐stage liver disease). Fibrosis stage, ballooning, and diabetes were more common in patients who developed end‐stage liver disease; however, there were no baseline clinical, histologic, or biochemical variables that predicted clinical significant disease progression. Conclusion: NAFLD is a highly heterogeneous disease, and it is surprisingly hard to predict fibrosis progression. Given enough time, NAFLD seems to have a more dismal prognosis then previously reported, with 16% of patients with fibrosis stage <3 developing advanced fibrosis and 9.3% showing signs of end‐stage liver disease. (Hepatology Communications 2018;2:199–210)
Abbreviations
- ALT
alanine aminotransferase
- APRI
AST to platelet ratio index
- AST
aspartate aminotransferase
- BARD
BMI, AST/ALT ratio, diabetes
- BMI
body mass index
- CI
confidence interval
- FIB‐4
fibrosis‐4
- GUCI
Göteborg University cirrhosis index
- NAFLD
nonalcoholic fatty liver disease
- NASH
nonalcoholic steatohepatitis
Introduction
Nonalcoholic fatty liver disease (NAFLD) is the most prevalent chronic liver disease in the Western world, affecting up to 25% of the world's population1 and expected to rise in parallel with the epidemic of obesity. NAFLD is commonly associated with components of metabolic syndrome2 and is an independent risk factor for cardiovascular disease.3, 4
The histologic features of NAFLD range from isolated steatosis to nonalcoholic steatohepatitis (NASH), the latter being characterized by hepatic steatosis, lobular inflammation, and signs of hepatocyte injury (ballooning) with or without fibrosis.5 Some patients with NAFLD develop progressive fibrosis and subsequent cirrhosis with an increased risk of hepatocellular carcinoma.6 The prevalence of cirrhosis among patients with NAFLD is approximately 5%, and patients with NAFLD have an increased mortality compared to control populations.7, 8, 9 Today, NAFLD is the second leading etiology among adult patients awaiting liver transplant in the United States.10
NASH has long been associated with a worse prognosis, speculated to catalyze fibrosis progression11 and increase mortality. However, recent longitudinal studies have shown that only fibrosis and no other histologic features predicts mortality in patients with NAFLD.12, 13
There are few paired biopsy studies with approximately 520 patients in total,7, 8, 14, 15, 16, 17, 18, 19, 20, 21, 22, 23, 24 and all but two studies have a median follow‐up time of less than 7 years (range, 3.0‐7.0 years). Albeit, some studies only include patients with NASH, the rate of fibrosis progression does not seem to be affected by the presence of steatohepatitis. Moreover, some studies also show that simple steatosis can progress to steatohepatitis and advanced fibrosis.22, 23, 24
The natural history of NAFLD is not completely understood. NAFLD is a slowly progressive disease,11 and most follow‐up studies have too short a follow‐up time to assess fibrosis progression.24 Fibrosis progression is seen in 27%‐52% of patients7, 8, 19, 21, 22, 24 over a mean of 3.0‐13.8 years of follow‐up, with the majority of patients with NAFLD having static or regressive fibrosis. Baseline variables predicting fibrosis progression have been hard to determine.
In this study, we present a large cohort of patients with NAFLD with repeat liver biopsy with a follow‐up time of almost 3 decades. Our aim was to define the clinical, biochemical, and histologic disease progression of patients with NAFLD and to assess predictors of disease progression.
Patients and Methods
SUBJECTS
In this prospective longitudinal cohort study, we included patients referred between 1988 and 1993 to the Department of Gastroenterology and Hepatology, University Hospital, Linköping, or to the Department of Internal Medicine, Oskarshamn County Hospital, for evaluation of chronically (>6 months) elevated serum alanine aminotransferase (ALT; defined as >41 U/L), and/or aspartate aminotransferase (AST; defined as >41 U/L), and/or serum alkaline phosphatase (defined as >106 U/L for both sexes). At inclusion, a diagnostic workup was performed, including physical examination, laboratory investigation, and liver biopsy, as well as a review of their medical chart. After excluding other chronic liver diseases and significant alcohol consumption (≥140 g per week), 137 patients were diagnosed with NAFLD. During follow‐up, 8 patients were reclassified as alcoholic fatty liver disease, and therefore the final cohort constituted of 129 patients with NAFLD. A previous follow‐up study of this cohort (first follow‐up) was conducted between 2003 and 2005 (details of data collection and results have been reported elsewhere8). The current follow‐up (second follow‐up) was conducted between 2013 and 2015.
Each subject in the study cohort was currently identified by linking his or her unique personal identification number to the National Registry of Population. All medical records from primary health care centers and hospitals were reviewed. Subjects who had died during follow‐up were identified, and their causes of death were obtained by reviewing their medical records and the information obtained from the Registry of Causes of Death. All participants in the study cohort who were still living were asked to participate in this second follow‐up study. Those who accepted were offered clinical and biochemical investigation and a biopsy of the liver.
All participating subjects gave written informed consent. The study design was approved by the ethics committee at the University Hospital in Linköping (02‐454, amendments: 2011/468‐32, 2012/229‐32, and 2013/72‐32).
DATA COLLECTION
At second follow‐up, a hepatologist (S.K., M.E., or P.N.) recorded each patient's medical history, including pharmacologic treatments. Alcohol consumption was assessed through an oral interview and the AUDIT‐C questionnaire.25 Blood pressure, waist circumference, body weight, and height were measured. Blood samples were taken from all subjects for analysis of routine biochemical parameters. At second follow‐up, transient elastography was available and performed during the clinical evaluation. All patients without contraindications were asked to undergo a liver biopsy. The liver biopsy was performed within 3 months of the hepatologist's evaluation.
As outcome, patients were evaluated for signs of fibrosis progression and clinically significant disease progression. Fibrosis progression was defined as an increase of ≥1 in fibrosis stage between first and second/third liver biopsy. Patients with end‐stage liver disease were defined as fibrosis stage 4. Clinically significant disease progression was defined as: 1) an increase in fibrosis stage from none (F0) to significant (F2); 2) development of advanced fibrosis (F3‐F4); 3) development of end‐stage liver disease; 4) NAFLD fibrosis score >0.676 or 5), liver stiffness >7.2 kPa as measured with transient elastography.
BIOCHEMICAL ANALYSIS
Subjects had blood drawn in the fasting state for a complete blood count, analysis of prothrombin, iron, transferrin, transferrin saturation, ferritin, AST, ALT, alkaline phosphatase, gamma glutamyl transferase, bilirubin, thyroid stimulating hormone, anti‐transglutaminase antibodies, total cholesterol, low‐ and high‐density lipoprotein, glucose, serum insulin, ceruloplasmin, and plasma protein electrophoresis, including, among others, albumin, α1‐antitrypsin, and immunoglobulins. Patients who had not previously been diagnosed with diabetes mellitus type 2 underwent a 75‐g oral glucose tolerance test. In addition, blood was drawn for detection of hepatitis B surface antigen, hepatitis B virus DNA, anti‐hepatitis C virus antibodies, hepatitis C virus RNA, anti‐nuclear antibodies, smooth muscle antibodies, and anti‐mitochondrial antibodies. In addition, all patients had blood obtained to identify the C282Y, H63D, and S65C mutations in the human hemochromatosis (HFE) gene as well as the S and Z mutations in the serine protease inhibitor A1 (SERPINA1) (Pi) gene.
Overweight was defined as body mass index (BMI) ≥25 kg/m2 but <30 kg/m2, obesity as BMI ≥30 kg/m2, diabetes as fasting plasma glucose ≥126 mg/dL requiring treatment or plasma glucose >199 mg/dL 2 h after oral administration of 75 g of glucose, impaired glucose tolerance as plasma glucose >140 mg/dL but ≤199 mg/dL 2 h after oral administration of 75 g of glucose, hypertension as blood pressure ≥130/85 or requiring treatment, and hypertriglyceridemia as fasting triglycerides ≥150 mg/dL. Metabolic syndrome was defined as having a BMI >30 kg/m2 or waist circumference ≥94 cm in men or ≥80 cm in women plus two of the following four factors: (1) fasting triglycerides ≥150 mg/dL or treatment for this lipid abnormality; (2) reduced fasting high‐density lipoprotein <40 mg/dL in men or <50 mg/dL in women or treatment for this lipid abnormality; (3) systolic blood pressure ≥130 mm Hg or diastolic blood pressure ≥85 mm Hg or treatment of previously diagnosed hypertension; (4) fasting plasma glucose ≥100 mg/dL or previously diagnosed diabetes mellitus type 2.
NAFLD fibrosis score,26 BMI, AST/ALT ratio, diabetes (BARD) score,27 Göteborg University cirrhosis index (GUCI) score,28 fibrosis‐4 (FIB‐4) score,29 and AST to platelet ratio index (APRI) score30 were calculated using biochemical and clinical data.
TRANSIENT ELASTOGRAPHY
Transient elastography was performed using FibroScan (Echosens, Paris, France) by experienced hepatologists (S.K., M.E., or P.N.) as part of the clinical workup, according to the described method.31
LIVER BIOPSY
All liver biopsies were performed percutaneously with ultrasonography guidance and a 1.6‐mm Biopince needle. All biopsies where read by two experienced liver pathologists who were blinded to patient details. All biopsies where graded according to NAFLD activity score and fibrosis stage according to Kleiner et al.32
STATISTICAL ANALYSIS
All statistical analyses were performed using SPSS version 24.0 (SPSS Inc., Chicago, IL). Data are expressed as mean ± SD or as total numbers with percentages if applicable. To compare the means of normally distributed variables between groups, the independent two‐sided Student t test was performed. Longitudinal changes in continuous variables were assessed by paired‐sample t test or Wilcoxon rank‐sum test. The Mann‐Whitney test was used to compare continuous data between two groups; if more than two groups were analyzed, the Kruskal‐Wallis one‐way analysis of variance was used. The χ2 test was used for categorical data. Survival curves were made according to the Kaplan‐Meier method, and the log‐rank test was applied for determination of difference in survival. P < 0.05 was considered significant.
Results
STUDY POPULATION AND CLINICAL CHARACTERISTICS
Originally, 129 patients with NAFLD were prospectively enrolled in a clinical study between 1988 and 1993, and all patients alive were invited for a first and second follow‐up. At the end of the study, 50 patients had died. Mean follow‐up time was 19.8 ± 6.0 years with 2,587 person‐years of follow‐up. At first follow‐up, 104 patients were alive and 88 patients (85%) accepted clinical evaluation; at second follow‐up, 79 patients were alive and 59 patients (75%) agreed to participate (Fig. 1). At inclusion, patients were middle aged (51.0 ± 12.9 years) with a male predominance (67%), 11 patients (8.5%) had previously diagnosed diabetes, and 14 patients (11%) had manifest cardiovascular disease. The clinical and biochemical data of the study cohort at inclusion and first and second follow‐up are presented in Table 1.
Figure 1.
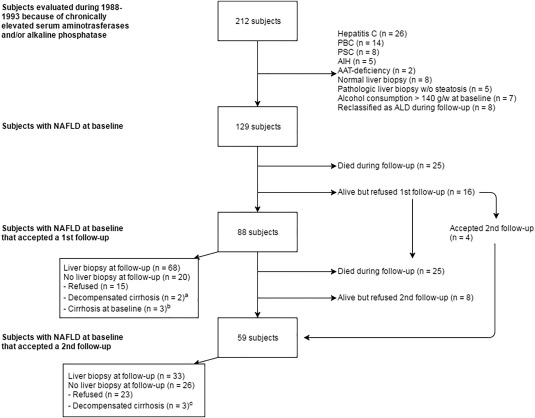
Details about patients studied, showing reasons for exclusions. aBoth patients were diagnosed with hepatocellular carcinoma at follow‐up; 1 patient died shortly after diagnostic workup at follow‐up. bOne patient developed hepatocellular carcinoma and underwent orthoptic liver transplantation during follow‐up. cOne patient developed hepatocellular carcinoma, 1 developed ascites, and 1 developed gastric antral vascular ectasia. Abbreviations: AAT, α1‐antitrypsin; AIH, autoimmune hepatitis; ALD, alcoholic liver disease; g/w, grams per weight; PBC, primary biliary cirrhosis; PSC, primary sclerosing cholangitis; w/o, without.
Table 1.
Clinical and Biochemical Data of The Cohort at Inclusion, First Follow‐Up, and Second Follow‐Up
| Inclusion (n = 129) | 1st Follow‐Up (n = 88) | 2nd Follow‐Up (n = 59) | |
|---|---|---|---|
| Age (years) | 51.0 ± 12.9 | 61.0 ± 11.0 | 66.3 ± 10.3 |
| Sex (male) | 87 (67%) | 62 (70%) | 47 (81%) |
| BMI (kg/m2) | 28.3 ± 3.8 | 29.1 ± 4.7 | 29.1 ± 4.0 |
| Overweight | 72 (56%) | 49 (56%) | 25 (42%) |
| Obese | 37 (29%) | 29 (33%) | 24 (41%) |
| Previously diagnosed diabetes | 11 (8.5%) | 6 (6.8%) | 3 (5.1%) |
| Diabetes/IGT diagnosed at first follow‐up | NA | 69 (78%) | 42 (71%) |
| Diabetes/IGT diagnosed at second follow‐up | NA | NA | 47 (80%) |
| Hypertensive | 93 (72%) | 83 (94%) | 55 (93%) |
| Manifest cardiovascular disease | 14 (11%) | 16 (18%) | 17 (29%) |
| Hypertriglyceridemia | 74 (57%) | 35 (40%) | 39 (66%) |
| Metabolic syndrome | NA | 70 (80%) | 51 (86%) |
| ALT (U/L) | 76 ± 43 | 60 ± 35 | 50 ± 34 |
| AST (U/L) | 45 ± 23 | 35 ± 15 | 42 ± 23 |
| AST/ALT ratio | 0.6 ± 0.2 | 0.7 ± 0.3 | 0.9 ± 0.4 |
| ALP (U/L) | 61 ± 33 | 65 ± 37 | 72 ± 31 |
| Bilirubin (mg/dL) | 0.64 ± 0.30 | 0.78 ± 0.33 | 0.8 ± 0.8 |
| Albumin (g/dL) | 4.1 ± 0.3 | 4.2 ± 0.4 | 4.0 ± 0.4 |
| Platelet count ( × 109/L) | 235 ± 67 | 194 ± 94 | 222 ± 57 |
| Prothrombin (INR) | 1.0 ± 0.1 | 1.0 ± 0.2 | 1.1 ± 0.4 |
| Ferritin (μg/L) | 232 ± 317 | 192 ± 159 | 257 ± 230 |
| Glucose (mg/dL) | NA | 125 ± 38 | 135 ± 45 |
| IR HOMA | NA | 3.8 ± 3.5 | 9.6 ± 13 |
| Triglycerides (mg/dL) | 190 ± 134 | 157 ± 89 | 170 ± 109 |
| Cholesterol (mg/dL) | 236 ± 59 | 202 ± 43 | 178 ± 53 |
| HDL (mg/dL) | NA | 51 ± 19 | 48 ± 16 |
| LDL (mg/dL) | NA | 123 ± 37 | 100 ± 44 |
| Negative for HBsAg/ anti‐HCV | NA | 88/88 | 59/59 |
| Negative for HBV DNA/HCV RNA | NA/NA | 88/88 | 59/59 |
| Positive for transglutaminase antibodies | NA | 0 (0%) | 1 (1.7%) |
| Mutation in HFE gene: | |||
| C282Y homozygosity/C282Y heterozygosity | NA | 2/6 | 1/3 |
| H63D homozygosity/H63D heterozygosity | NA | 3/16 | 1/10 |
| S65C homozygosity/S65C heterozygosity | NA | 0/2 | 0/2 |
| C282Y/H63D compound heterozygosity | NA | 0 | 0 |
| Mutation in SERPINA1 gene (ZZ/ SZ/ MZ/ MS) | NA | 0/0/10/3 | 0/0/8/0 |
| Ceruloplasmin < 0.20 g/L | 0 (0%) | 0 (0%) | 1 (1.7%) |
Abbreviations: ALP, alkaline phosphatase; HBsAg, hepatitis B surface antigen; HBV, hepatitis B virus; HCV, hepatitis C virus; HDL, high‐density lipoprotein; IGT, impaired glucose tolerance; INR, international normalized ratio; IRHOMA, insulin resistance according to homeostasis model assessment; LDL, low‐density lipoprotein; NA, not available.
CAUSE OF DEATH
Fifty patients died during follow‐up: 24 patients died from cardiovascular disease (48%), 11 from extrahepatic malignancies (22%), 5 from end‐stage liver disease, including hepatocellular carcinoma (10%), 5 from infectious disease (10%), 3 from kidney disease (6%), 1 from respiratory disease (2%), and 1 from neurologic disease (2%).
REPEAT LIVER BIOPSY
At inclusion, all patients underwent liver biopsy. At first follow‐up, 88 patients accepted follow‐up (77%) and 68 patients underwent a second liver biopsy; at second follow‐up, 59 patients accepted second follow‐up (76%) and 33 patients underwent liver biopsy. The mean time between first and second, second and third, and first and third liver biopsies was 13.7 ± 1.5 years, 9.3 ± 1.0 years, and 22.8 ± 1.3 years, respectively. In total, 29 patients had three consecutive liver biopsies.
Patients who accepted follow‐up but showed signs of end‐stage liver disease (esophageal variceal bleeds, ascites, spontaneous bacterial peritonitis, hepatic encephalopathy, hepatorenal syndrome, or hepatocellular carcinoma) were excluded from biopsy but included as fibrosis stage 4. Therefore, fibrosis stage as well as biochemical and clinical data were available in 32 patients at inclusion and first and second follow‐up.
DEVELOPMENT AND PREDICTION OF END‐STAGE LIVER DISEASE AND ADVANCED FIBROSIS
At the end of follow‐up, 12 patients (9.3%) had developed symptoms of end‐stage liver disease. The presenting symptom was ascites (n = 5), hepatocellular carcinoma (n = 4), variceal hemorrhage (n = 2), and gastric antral vascular ectasia (n = 1). Baseline fibrosis stage in the 12 patients that developed symptoms of end‐stage liver disease was: stage 0 (n = 2), stage 1 (n = 2), stage 2 (n = 4), stage 3 (n = 3), and stage 4 (n = 1).
At baseline, patients with NAFLD who progressed to end‐stage liver disease had a higher prevalence of diabetes (33% versus 8.5%, P = 0.026), higher levels of AST (57 ± 30 versus 42 ± 22 U/L, P = 0.046), ALT (103 ± 66 versus 73 ± 40 U/L, P = 0.022), and ferritin (436 ± 834 versus 211 ± 201 mikrog/L, P = 0.018). A higher grade of ballooning (0 [0‐2] versus 0 [0‐1], P = 0.015) and fibrosis stage (2 [0‐4] versus 1 [0‐4], P = 0.004) were also seen in patients who developed end‐stage liver disease. Moreover, patients with end‐stage liver disease had a higher NAFLD fibrosis score (–1.055 ± 1.721 versus –2.077 ± 1.265, P = 0.020) at baseline. Clinical, histologic, and biochemical data are presented in Supporting Table S1.
At baseline, 16 patients (12%) had biopsy‐proven advanced fibrosis stage 3 (n = 12) and stage 4 (n = 4). At first follow‐up, 9 patients with previous low‐stage fibrosis (<3) had developed advanced fibrosis in their second liver biopsy and 3 patients developed symptoms of end‐stage liver disease. At second follow‐up, 3 patients with previous low‐stage fibrosis had developed advanced fibrosis in their third liver biopsy and 3 additional patients developed symptoms of end‐stage liver disease.
In total, 34 patients (26%) were diagnosed with advanced fibrosis at inclusion or developed advanced fibrosis during the study period; 28 patients had biopsy‐proven fibrosis stage 3 or 4, and 6 patients showed symptoms of end‐stage liver disease with previous low‐stage fibrosis. In the 113 patients with initial low fibrosis stage, 18 patients (16%) developed advanced fibrosis or end‐stage liver disease. When comparing baseline data of the 13 patients who developed advanced fibrosis with the 95 patients who did not, there was no significant difference in biochemical data or clinical characteristics, although there were differences in NAFLD fibrosis, FIB‐4, APRI, and GUCI scores (Table 2).
Table 2.
Comparison of Baseline Data of Patients With and Without Advanced Fibrosis at The End Of The Studya
| Developed Advanced Fibrosis (n = 18) | Did Not Develop Advanced Fibrosis (n = 95) | P Value | |
|---|---|---|---|
| Age (years) | 51 ± 11 | 50 ± 13 | 0.677 |
| Sex (male) | 12 (67%) | 66 (69%) | 0.788 |
| BMI (kg/m2) | 29 ± 2.5 | 28 ± 3.8 | 0.185 |
| Overweight | 10 (56%) | 57 (60%) | 0.796 |
| Obese | 7 (39%) | 23 (24%) | 0.245 |
| Diabetes | 4 (22%) | 8 (8.4%) | 0.098 |
| Hypertensive | 14 (78%) | 68 (72%) | 1.000 |
| Manifest cardiovascular disease | 2 (11%) | 9 (9.5%) | 0.687 |
| Hypertriglyceridemia | 12 (67%) | 46 (48%) | 0.185 |
| ALT (U/L) | 82 ± 53 | 69 ± 29 | 0.148 |
| AST (U/L) | 44 ± 17 | 40 ± 15 | 0.276 |
| AST/ALT ratio | 0.6 ± 0.2 | 0.6 ± 0.2 | 0.837 |
| ALP (U/L) | 59 ± 28 | 60 ± 34 | 0.883 |
| Bilirubin (mg/dL) | 0.7 ± 0.6 | 0.6 ± 0.2 | 0.152 |
| Albumin (g/dL) | 4.1 ± 0.3 | 4.1 ± 0.4 | 0.915 |
| Platelet count ( × 109/L) | 193 ± 49 | 232 ± 63 | 0.964 |
| Prothrombin (INR) | 1.0 ± 0.1 | 1.0 ± 0.1 | 0.201 |
| Ferritin (μg/L) | 200 ± 130 | 187 ± 178 | 0.772 |
| Triglycerides (mg/dL) | 214 ± 214 | 181 ± 121 | 0.355 |
| Cholesterol (mg/dL) | 254 ± 90 | 232 ± 53 | 0.155 |
| NAFLD activity score | 3 (1‐4) | 2 (1‐4) | 0.089 |
| Steatosis | 3 (1‐3) | 2 (1‐3) | 0.096 |
| Ballooning | 0 (0‐1) | 0 (0‐1) | 0.903 |
| Inflammation | 0 (0‐1) | 0 (0‐1) | 0.347 |
| Fibrosis | 1 (0‐2) | 0 (0‐2) | 0.015 |
| F0 | 6 (33%) | 54 (57%) | |
| F1 | 4 (22%) | 27 (28%) | |
| F2 | 8 (44%) | 14 (15%) | |
| F3 | 0 (0%) | 0 (0%) | |
| F4 | 0 (0%) | 0 (0%) | |
| NAFLD fibrosis score | –1.478 ± 1.487 | –2.222 ± 1.260 | 0.039 |
| BARD | 1 (0‐4) | 0 (0‐4) | 0.056 |
| FIB‐4 | 1.7 ± 1.7 | 1.2 ± 0.8 | 0.067 |
| APRI | 0.6 ± 0.4 | 0.4 ± 0.3 | 0.023 |
| GUCI | 0.6 ± 0.5 | 0.4 ± 0.3 | 0.028 |
Patients who at inclusion presented with advanced fibrosis (F3 or F4, n = 16) were excluded from this table. Continuous data were assessed with independent Student t test if not normally distributed, or for a nonparametric method, the Mann‐Whitney U test was used. Dichotomous variables were assessed with the χ2 test. Numbers in bold are significant.
Abbreviations: ALP, alkaline phosphatase; INR, international normalized ratio.
DISEASE PROGRESSION
Clinically Significant Disease Progression
During the first follow‐up, 22 out of 129 patients (17%) had clinically significant disease progression (as defined in Patients and Methods; Data Collection), and during the second follow‐up, an additional 13 patients (10%) had clinically significant disease progression. Two patients out of the 22 patients that initially progressed between inclusion and first follow‐up also progressed between first and second follow‐up. Between baseline and second follow‐up, 3 (2.3%) patients had an increase of just one stage in fibrosis at each follow‐up but a two‐stage increase between baseline and second follow‐up in total. Moreover, 2 patients who did not have a biopsy at the first follow‐up accepted biopsy at the second follow‐up and had clinically significant disease progression (1 from F0‐F2 and 1 with F0‐variceal bleeding). In total, 38 patients (29%) developed clinically significantly disease progression at some point during follow‐up.
Excluding the 16 patients with advanced fibrosis at inclusion, 34 patients (30%) had clinically significant disease progression at the end of the study period. There were no statistically significant differences in baseline clinical, biochemical, or histologic characteristics between patients with clinically significant disease progression and patients with clinically stable disease (Supporting Table S2). Even when excluding the 16 patients with baseline advanced fibrosis, no biochemical, clinical, or histologic differences were seen between patients with disease progression and patients with clinically stable disease (data not presented).
Fibrosis Progression
Between the first and second biopsy, 30 (42.3%) patients progressed in fibrosis stage (median stage 1.5, range 1‐3), 30 (42.3%) patients were stable, and 11 patients regressed (8.5%). Of those who regressed, no patient regressed more than one fibrosis stage. Between the second and third biopsy, 12 (38.7%) patients progressed (stage 1.5, range 1‐3), 14 (45.2%) patients were stable, and 5 (16.1%) patients regressed. Of those who regressed, no patient regressed more than one fibrosis stage.
Between the first and third biopsy, a comparison of fibrosis stage at inclusion with final biopsy (including counting clinical signs of end‐stage liver disease as fibrosis stage 4) showed that 40 (52.6%) patients progressed (stage 2, range 1‐4), 26 (34.2%) patients were stable, and 10 (13.2%) patients showed signs of regression. Of those who regressed, no patient regressed more than one fibrosis stage.
In patients with F0, 23 (59%) patients progressed histologically; the corresponding numbers for F1, F2, and F3 were 8 (40%), 7 (58.3%), and 2 (50%) patients, respectively; there was no significant difference between groups (P = 0.374). In total, 40 (52.6%) patients with repeat biopsies showed signs of fibrosis progression during the study period.
FOLLOW‐UP OF PATIENTS WITH THREE CONSECUTIVE BIOPSIES
The data of the 32 patients with three consecutive biopsies are presented in Table 3. None of the patients with three consecutive biopsies had advanced fibrosis at baseline. At first follow‐up, 4 patients (12%) had developed advanced fibrosis, and at second follow‐up, 7 patients (22%) had developed advanced fibrosis.
Table 3.
Biochemical, Clinical, and Histologic Characteristics of Patients That Underwent Three Consecutive Biopsies During The Follow‐Up Period
| Baseline (n = 32) | 1st Follow‐Up (n = 32) | 2nd Follow‐Up (n = 32) | P Value Baseline vs. 1st Follow‐Up | P Value 1st Follow‐Up vs. 2nd Follow‐Up | P Value Baseline vs. 2nd Follow‐Up | |
|---|---|---|---|---|---|---|
| Age (years) | 43.3 ± 10.6 | 57.0 ± 10.5 | 66.1 ± 10.3 | |||
| Sex (male) | 28 (88%) | 28 (88%) | 28 (88%) | |||
| BMI (kg/m2) | 27.9 ± 4.3 | 29.5 ± 5.2 | 29.0 ± 4.4 | <0.0001 | 0.513 | 0.107 |
| Overweight | 19 (59%) | 20 (63%) | 15 (47%) | 1.000 | 0.625 | 0.727 |
| Obese | 6 (19%) | 11 (34%) | 12 (38%) | 0.063 | 1.000 | 0.031 |
| Diabetes/IGT | 2 (6%) | 24 (75%) | 24 (75%) | <0.0001 | 1.000 | <0.0001 |
| Hypertensive | 22 (69%) | 30 (94%) | 29 (91%) | 1.000 | 1.000 | 1.000 |
| Manifest cardiovascular disease | 0 (0%) | 2 (6%) | 7 (22%) | 0.500 | 0.063 | 0.016 |
| Hypertriglyceridemia | 15 (47%) | 17 (53%) | 12 (38%) | 1.000 | 0.344 | 0.289 |
| Metabolic syndrome | NA | 26 (81%) | 26 (81%) | NA | 0.688 | NA |
| ALT (U/L) | 74 ± 40 | 63 ± 33 | 47 ± 31 | 0.186 | 0.023 | <0.0001 |
| AST (U/L) | 38 ± 13 | 34 ± 19 | 42 ± 27 | 0.318 | 0.087 | 0.360 |
| AST/ALT ratio | 0.5 ± 0.1 | 0.6 ± 0.2 | 0.9 ± 0.3 | 0.298 | <0.0001 | <0.0001 |
| ALP (U/L) | 53 ± 24 | 57 ± 17 | 73 ± 34 | 0.278 | 0.027 | 0.016 |
| Bilirubin (mg/dL) | 0.7 ± 0.5 | 0.7 ± 0.4 | 0.9 ± 1.1 | 0.166 | 0.496 | 0.344 |
| Albumin (g/dL) | 4.2 ± 0.3 | 4.3 ± 0.4 | 4.0 ± 0.5 | 0.721 | 0.011 | 0.016 |
| Platelet count ( × 109/L) | 220 ± 60 | 223 ± 55 | 229 ± 66 | 0.623 | 0.835 | 0.995 |
| Prothrombin (INR) | 0.96 ± 0.10 | 0.98 ± 0.07 | 1.07 ± 0.29 | 0.172 | 0.050 | 0.018 |
| Ferritin (μg/L) | 202 ± 155 | 220 ± 167 | 278 ± 263 | 0.626 | 0.242 | 0.209 |
| Glucose (mg/dL) | NA | 119 ± 37 | 129 ± 40 | NA | 0.188 | NA |
| IR HOMA | NA | 3.1 ± 1.9 | 8.7 ± 13.4 | NA | 0.031 | NA |
| Triglycerides (mg/dL) | 185 ± 178 | 169 ± 95 | 173 ± 114 | 0.567 | 0.926 | 0.564 |
| Cholesterol (mg/dL) | 240 ± 73 | 204 ± 42 | 188 ± 54 | 0.015 | 0.056 | 0.001 |
| HDL (mg/dL) | NA | 54 ± 25 | 50 ± 16 | NA | 0.203 | NA |
| LDL (mg/dL) | NA | 127 ± 37 | 112 ± 45 | NA | 0.081 | NA |
| NAFLD activity score | 3 (1‐4) | 2 (0‐4) | 2 (0‐5) | 0.226 | 0.946 | 0.513 |
| Steatosis | 1.5 (0‐3) | 3 (1‐3) | 2 (0‐3) | 0.027 | 0.047 | 0.001 |
| Ballooning | 0 (0‐1) | 0 (0‐2) | 0 (0‐2) | 0.014 | 0.038 | 0.013 |
| Inflammation | 0 (0) | 0 (0‐1) | 0 (0‐2) | 0.317 | 0.011 | 0.007 |
| Fibrosis | 0 (0‐2) | 0.5 (0‐4) | 1.5 (0‐4) | 0.007 | 0.041 | 0.013 |
| F0 (%) | 20 (63%) | 16 (50%) | 13 (41%) | |||
| F1 (%) | 10 (31%) | 9 (28%) | 3 (9%) | |||
| F2 (%) | 2 (6%) | 3 (9%) | 9 (28%) | |||
| F3 (%) | 0 | 3 (9%) | 4 (13%) | |||
| F4 (%) | 0 | 1 (3%) | 3 (9%) | |||
| NAFLD fibrosis score | –2.536 ± 1.203 | –1.074 ± 1.375 | –0.212 ± 1.355 | <0.0001 | <0.0001 | <0.0001 |
| FIB‐4 | 1.0 ± 0.5 | 1.2 ± 0.6 | 2.0 ± 1.3 | 0.072 | <0.0001 | <0.0001 |
| APRI | 0.43 ± 0.23 | 0.39 ± 0.29 | 0.44 ± 0.32 | 0.560 | 0.197 | 0.614 |
| GUCI | 0.41 ± 0.23 | 0.38 ± 0.28 | 0.57 ± 0.74 | 0.631 | 0.101 | 0.164 |
| BARD | 0 (0‐2) | 1 (0‐3) | 2 (0‐4) | 0.001 | 0.003 | <0.0001 |
| Fibroscan (kPa) | NA | NA | 8.0 ± 4.1 | NA | NA | NA |
Continuous data were assessed with dependent t test if not normally distributed, or for a nonparametric method, the Wilcoxon rank‐sum test was used. Dichotomous variables were assessed with the χ2 test. Numbers in bold are significant.
Abbreviations: ALP, alkaline phosphatase; HDL, high‐density lipoprotein; IGT, impaired glucose tolerance; IRHOMA, insulin resistance according to homeostasis model assessment; LDL, low‐density lipoprotein; NA, not available.
Of the 11 patients (34%) that progressed between baseline and first follow‐up, 5 patients (45%) also progressed during second follow‐up and 1 patient went from fibrosis stage 4 to end‐stage liver disease. Of the remaining 21 patients (66%) that were stable or showed a regression in fibrosis stage between baseline and first follow‐up, 8 (38%) showed signs of progression at second follow‐up. The individual data of the 32 patients with three serial biopsies are shown in Supporting Table S3.
There were no significant differences at baseline between those who progressed and those who were stable or regressed between baseline and first follow‐up. Likewise, there were no significant differences at first follow‐up between those who progressed and those who were stable or regressed between first and second follow‐up (data not presented).
Nine patients (28%) had fibrosis stage 0 at baseline and first and second follow‐up, representing a nonprogressive NAFLD. When comparing baseline variables of the nonprogressive patients with NAFLD with patients that developed any stage of fibrosis during baseline or follow‐up, there was a significantly lower frequency of patients with hypertriglyceridemia (11% versus 61%, P = 0.023). Patients with nonprogressive NAFLD also showed lower stages of the NAFLD activity score (2 [1‐3] versus 3 [1‐4], P = 0.047), fibrosis stage (0 [0] versus 1 [0‐2], P = 0.022), and BARD (0 [0‐1] versus 1 [0‐2], P = 0.043). There was also a trend toward lower stages of hepatic steatosis (2 [1‐3] versus 3 [1‐3], P = 0.053), APRI score (0.3 ± 0.1 versus 0.5 ± 0.2, P = 0.075), and GUCI score (0.3 ± 0.1 versus 0.5 ± 0.2, P = 0.061).
FOLLOW‐UP OF PATIENTS WITH NAFLD AND ISOLATED STEATOSIS
Of the 129 patients in the initial cohort, 56 patients (43%) had isolated steatosis, defined as having only steatosis and no other features of NASH (lobular inflammation and/or ballooning) or any stage of fibrosis. Generally, the 56 patients were younger and had lower AST, ALT, ferritin, and NAFLD fibrosis score (Supporting Table S4). The cumulative survival between the two groups showed better survival among patients with isolated steatosis at baseline compared with patients with NAFLD (Fig. 2).
Figure 2.
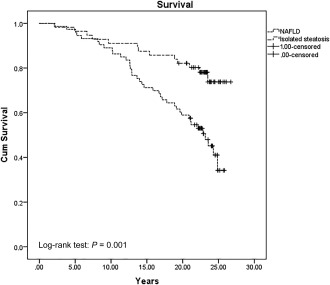
Cumulative survival probability comparing patients with isolated steatosis to NAFLD over time. Abbreviation: Cum, cumulative.
In total, 5 patients (9%) with isolated steatosis at baseline developed biopsy‐proven advanced fibrosis (n = 3) or clinical signs of end‐stage liver disease (n = 2). At baseline, these patients had a higher steatosis grade (3 [2‐3] versus 2 [1‐3], P = 0.032) and also presented with a higher prevalence of type 2 diabetes (2% versus 20%, P = 0.04) and hypertriglyceridemia (44% versus 100%, P = 0.021) as well as higher levels of bilirubin mg/dL (1.1 ± 1.1 versus 0.6 ± 0.2, P = 0.014) and triglycerides mg/dL (331 ± 363 versus 175 ± 125, P = 0.037). There were no other baseline clinical, biochemical, or histologic differences between the groups (data not presented).
Mean follow‐up from baseline in the 3 patients with biopsy‐proven advanced fibrosis was 16.5 ± 4.2 years. Of the 2 patients that developed clinical signs of end‐stage liver disease, 1 developed variceal bleeds 13.7 years after inclusion and died 6 months after the first sign of decompensation in an infectious disease; the second patient developed hepatocellular carcinoma 18.9 years after inclusion and died 1 month later.
Discussion
In this prospective cohort study of well‐defined patients with NAFLD, we have shown that 26% of patients had advanced fibrosis and 12 patients (9.3%) had developed end‐stage liver disease after an extended period of follow up. Even in patients without advanced fibrosis (fibrosis stage <3) at inclusion, a significant proportion (16%) developed advanced fibrosis.
Our findings showed more patients developed end‐stage liver disease compared to what has been reported (1.2%‐5.4%).7, 8, 13, 33 Angulo et al.13 showed 4.2% of all patients developed end‐stage liver disease. Theirs was a retrospective study with 619 patients and with a high loss to follow‐up (15.7%). In our previous report of this cohort, 5.4% had developed end‐stage liver disease after a follow‐up of 13.7 years,8 which is in line with Angulo et al. who reported almost equal frequency after 12.6 years of follow‐up. In addition, Adams et al.7 showed an end‐stage liver disease frequency of 3% after 7.8 years. In the long‐term follow‐up by Dam‐Larsen et al.,33 only 1.2% developed end‐stage liver disease after 20.4 years of follow‐up. Although this number is lower than previous studies, in the study by Dam‐Larsen et al. only a minority of the patients with NAFLD were followed up and the mean age at inclusion was 39.5 years, reflecting the slow progressive nature of NAFLD and the age dependence of fibrosis progression. In our extended follow‐up study, patients were prospectively enrolled and followed over a long period with enough time for liver‐related events to occur. Also, the meticulous follow‐up by either clinical assessment or by extensive chart review reduced the risk of misdiagnosing patients with end‐stage liver disease.
In 25% of patients, three consecutive liver biopsies approximately 10 years apart were performed. Albeit, these patients originally were younger, healthier, and had a low fibrosis stage (<3), 22% developed advanced fibrosis during follow‐up. No baseline biochemical, clinical, or histologic characteristic could predict progression to advanced fibrosis or significant disease progression over time. However, patients who developed end‐stage liver disease had more frequent type 2 diabetes and higher levels of ferritin, AST, and ALT levels as wells as higher incidence of ballooning on liver biopsy. Nevertheless, these patients also had higher levels of fibrosis stage on baseline liver biopsy, with 4 patients (33%) having advanced fibrosis, which could skewer the results.
It is generally believed that isolated steatosis is a benign condition with low clinical relevance. Patients with NAFLD with isolated steatosis showed a better overall prognosis compared to other patients with NAFLD, although 3 (5.4%) patients with isolated steatosis developed advanced fibrosis and 2 (3.6%) patients developed end‐stage liver disease. Interestingly, these 5 patients showed a higher steatosis grade and a higher prevalence of diabetes mellitus type 2. However, these subanalyses should be interpreted with caution because of the inherently small number of patients. In comparison with previous studies with paired biopsies, the study by Wong et al.22 showed fibrosis progression in 28% of patients with nonalcoholic fatty liver (defined as NAFLD activity score <3) over a 3‐year period. The studies by Pais et al.23 and McPherson et al.24 showed fibrosis progression in 24% and 37% of patients with nonalcoholic fatty liver (defined as isolated steatosis or isolated steatosis and mild inflammation) over a follow‐up time of 3.7 and 8 years, respectively. The latter study also showed a trend for more aggressive disease progression in patients with steatosis and mild inflammation compared to patients with isolated steatosis (P = 0.07).24 In our study with a mean follow‐up time of 19.8 years, fibrosis progression ≥1 stage was seen in 61% (22 out of 36) of patients with isolated steatosis at inclusion, of whom 5 patients developed advanced fibrosis or end‐stage liver disease. Although baseline characteristics for predicting histologic disease progression are hard to identify in patients with isolated steatosis with or without inflammation, patients who have fibrosis progression show a trend toward more frequent type 2 diabetes at baseline. In the studies by Pais et al.23 and McPherson et al.,24 patients who progressed also seemed to show a trend toward gaining weight or developing type 2 diabetes a priori to the follow‐up biopsy, indicating an intricate relationship between the metabolic syndrome and histologic disease progression in patients with nonalcoholic fatty liver.
One of the main aims of this study was to determine if there were any clinical or biochemical data that could predict disease progression among patients with NAFLD. Although patients that developed end‐stage liver disease showed baseline signs of higher levels of AST and ALT and necroinflammatory changes, patients with NAFLD with significant disease progression or fibrosis progression could not be distinguished from benign NAFLD.
The interval for follow‐up should mainly be based on the stage of fibrosis. This is supported by a recent study of 646 patients with biopsy‐proven NAFLD and a mean follow‐up of 20 years.34 In that study, the mean time for development of end‐stage liver disease in 90% of patients per stage of fibrosis was 33.4 years for F0 (95% confidence interval [CI], 24.2, 42.6), 34.1 years for F1 (95% CI, 25.1, 43.2), 22.7 years for F2 (95% CI, 13.7, 31.7), 11.8 years for F3 (95% CI, 4.3, 19.4), and 5.6 years for F4 (95% CI, 0.9, 10.3). Because liver biopsy carries some procedural risks and the number of patients with NAFLD constantly increases, the need for noninvasive staging of hepatic fibrosis is imperative in a clinical setting.
The strength of our study is the unique cohort, which was prospectively enrolled and rigorously followed for 25 years. All patients included at baseline were part of a prospective study in which patients with mild to moderate elevation of liver function tests were consecutively investigated with liver biopsy, reducing selection bias. The low frequency of NASH and comorbid conditions (e.g., type 2 diabetes) as well as the low mean BMI in the cohort strengthens the validity of our outcomes concerning mortality and liver‐related events.
This study has some limitations. First, as with all studies using liver biopsy as the gold standard, sampling error as well as interassessment and intra‐assessment variability is a fact.35 Second, although many patients accepted a first and second follow‐up, the high frequency of death because of the time between follow‐ups resulted in a stagnating number of patients to follow‐up as time progressed, reducing the number of clinical and biochemical parameters and decreasing the outcome of patients who developed severe liver disease. Moreover, 23 patients (47%) died of cardiovascular diseases, which is a competing risk for development of severe liver disease.
In conclusion, we have shown that NAFLD has a more dismal prognosis then previously reported, with 16% of patients with NAFLD with fibrosis stage <3 developing advanced fibrosis and 9.3% developing end‐stage liver disease. We have also shown that it is surprisingly difficult to predict fibrosis progression in individual patients with NAFLD. There seems to be an association between a worsening of metabolic risk factors, i.e., type 2 diabetes, obesity, and fibrosis progression. These findings emphasize the need for robust noninvasive biomarkers suitable to monitor a large number of patients.
Author names in bold designate shared co‐first authorship.
Supporting information
Additional Supporting Information may be found at onlinelibrary.wiley.com/doi/10.1002/hep4.1134/full.
Supporting Information 1
Potential conflict of interest: Nothing to report.
Supported by ALF Grants from Region Östergötland and funding from the Research Council of Southeast Sweden (FORSS).
REFERENCES
- 1. Younossi ZM, Koenig AB, Abdelatif D, Fazel Y, Henry L, Wymer M. Global epidemiology of nonalcoholic fatty liver disease‐meta‐analytic assessment of prevalence, incidence, and outcomes. Hepatology 2016;64:73‐84. [DOI] [PubMed] [Google Scholar]
- 2. Marchesini G, Brizi M, Bianchi G, Tomassetti S, Bugianesi E, Lenzi M, et al. Nonalcoholic fatty liver disease: a feature of the metabolic syndrome. Diabetes 2001;50:1844‐1850. [DOI] [PubMed] [Google Scholar]
- 3. Targher G, Day CP, Bonora E. Risk of cardiovascular disease in patients with nonalcoholic fatty liver disease. N Engl J Med 2010;363:1341‐1350. [DOI] [PubMed] [Google Scholar]
- 4. Targher G, Byrne CD, Lonardo A, Zoppini G, Barbui C. Non‐alcoholic fatty liver disease and risk of incident cardiovascular disease: a meta‐analysis. J Hepatol 2016;65:589‐600. [DOI] [PubMed] [Google Scholar]
- 5. Chalasani N, Younossi Z, Lavine JE, Diehl AM, Brunt EM, Cusi K, et al. The diagnosis and management of non‐alcoholic fatty liver disease: practice Guideline by the American Association for the Study of Liver Diseases, American College of Gastroenterology, and the American Gastroenterological Association. Hepatology 2012;55:2005‐2023. [DOI] [PubMed] [Google Scholar]
- 6. Farrell GC, Larter CZ. Nonalcoholic fatty liver disease: from steatosis to cirrhosis. Hepatology 2006;43(Suppl. 1):S99‐S112. [DOI] [PubMed] [Google Scholar]
- 7. Adams LA, Lymp JF, St Sauver J, Sanderson SO, Lindor KD, Feldstein A, et al. The natural history of nonalcoholic fatty liver disease: a population‐based cohort study. Gastroenterology 2005;129:113‐121. [DOI] [PubMed] [Google Scholar]
- 8. Ekstedt M, Franzén LE, Mathiesen UL, Thorelius L, Holmqvist M, Bodemar G, et al. Long‐term follow‐up of patients with NAFLD and elevated liver enzymes. Hepatology 2006;44:865‐873. [DOI] [PubMed] [Google Scholar]
- 9. Söderberg C, Stål P, Askling J, Glaumann H, Lindberg G, Marmur J, et al. Decreased survival of subjects with elevated liver function tests during a 28‐year follow‐up. Hepatology 2010;51:595‐602. [DOI] [PubMed] [Google Scholar]
- 10. Wong RJ, Aguilar M, Cheung R, Perumpail RB, Harrison SA, Younossi ZM, et al. Nonalcoholic steatohepatitis is the second leading etiology of liver disease among adults awaiting liver transplantation in the United States. Gastroenterology 2015;148:547‐555. [DOI] [PubMed] [Google Scholar]
- 11. Singh S, Allen AM, Wang Z, Prokop LJ, Murad MH, Loomba R. Fibrosis progression in nonalcoholic fatty liver vs nonalcoholic steatohepatitis: a systematic review and meta‐analysis of paired‐biopsy studies. Clin Gastroenterol Hepatol 2015;13:643‐654.e641‐649. [DOI] [PMC free article] [PubMed] [Google Scholar]
- 12. Ekstedt M, Hagström H, Nasr P, Fredrikson M, Stål P, Kechagias S, et al. Fibrosis stage is the strongest predictor for disease‐specific mortality in NAFLD after up to 33 years of follow‐up. Hepatology 2015;61:1547‐1554. [DOI] [PubMed] [Google Scholar]
- 13. Angulo P, Kleiner DE, Dam‐Larsen S, Adams LA, Bjornsson ES, Charatcharoenwitthaya P, et al. Liver fibrosis, but no other histologic features, is associated with long‐term outcomes of patients with nonalcoholic fatty liver disease. Gastroenterology 2015;149:389‐397.e310. [DOI] [PMC free article] [PubMed] [Google Scholar]
- 14. Lee RG. Nonalcoholic steatohepatitis: a study of 49 patients. Hum Pathol 1989;20:594‐598. [DOI] [PubMed] [Google Scholar]
- 15. Powell EE, Cooksley WG, Hanson R, Searle J, Halliday JW, Powell LW. The natural history of nonalcoholic steatohepatitis: a follow‐up study of forty‐two patients for up to 21 years. Hepatology 1990;11:74‐80. [DOI] [PubMed] [Google Scholar]
- 16. Teli MR, James OF, Burt AD, Bennett MK, Day CP. The natural history of nonalcoholic fatty liver: a follow‐up study. Hepatology 1995;22:1714‐1719. [PubMed] [Google Scholar]
- 17. Evans CD, Oien KA, MacSween RN, Mills PR. Non‐alcoholic steatohepatitis: a common cause of progressive chronic liver injury? J Clin Pathol 2002;55:689‐692. [DOI] [PMC free article] [PubMed] [Google Scholar]
- 18. Ratziu V, Giral P, Charlotte F, Bruckert E, Thibault V, Theodorou I, et al. Liver fibrosis in overweight patients. Gastroenterology 2000;118:1117‐1123. [DOI] [PubMed] [Google Scholar]
- 19. Harrison SA, Torgerson S, Hayashi PH. The natural history of nonalcoholic fatty liver disease: a clinical histopathological study. Am J Gastroenterol 2003;98:2042‐2047. [DOI] [PubMed] [Google Scholar]
- 20. Fassio E, Alvarez E, Domínguez N, Landeira G, Longo C. Natural history of nonalcoholic steatohepatitis: a longitudinal study of repeat liver biopsies. Hepatology 2004;40:820‐826. [DOI] [PubMed] [Google Scholar]
- 21. Hui AY, Wong VW, Chan HL, Liew CT, Chan JL, Chan FK, et al. Histological progression of non‐alcoholic fatty liver disease in Chinese patients. Aliment Pharmacol Ther 2005;21:407‐413. [DOI] [PubMed] [Google Scholar]
- 22. Wong VW, Wong GL, Choi PC, Chan AW, Li MK, Chan HY, et al. Disease progression of non‐alcoholic fatty liver disease: a prospective study with paired liver biopsies at 3 years. Gut 2010;59:969‐974. [DOI] [PubMed] [Google Scholar]
- 23. Pais R, Charlotte F, Fedchuk L, Bedossa P, Lebray P, Poynard T, et al.; LIDO Study Group . A systematic review of follow‐up biopsies reveals disease progression in patients with non‐alcoholic fatty liver. J Hepatol 2013;59:550‐556. [DOI] [PubMed] [Google Scholar]
- 24. McPherson S, Hardy T, Henderson E, Burt AD, Day CP, Anstee QM. Evidence of NAFLD progression from steatosis to fibrosing‐steatohepatitis using paired biopsies: implications for prognosis & clinical management. J Hepatol 2015;62:1148‐1155. [DOI] [PubMed] [Google Scholar]
- 25. Bush K, Kivlahan DR, McDonell MB, Fihn SD, Bradley KA. The AUDIT alcohol consumption questions (AUDIT‐C): an effective brief screening test for problem drinking. Ambulatory Care Quality Improvement Project (ACQUIP). Alcohol Use Disorders Identification Test. Arch Intern Med 1998;158:1789‐1795. [DOI] [PubMed] [Google Scholar]
- 26. Angulo P, Hui JM, Marchesini G, Bugianesi E, George J, Farrell GC, et al. The NAFLD fibrosis score: a noninvasive system that identifies liver fibrosis in patients with NAFLD. Hepatology 2007;45:846‐854. [DOI] [PubMed] [Google Scholar]
- 27. Harrison SA, Oliver D, Arnold HL, Gogia S, Neuschwander‐Tetri BA. Development and validation of a simple NAFLD clinical scoring system for identifying patients without advanced disease. Gut 2008;57:1441‐1447. [DOI] [PubMed] [Google Scholar]
- 28. Islam S, Antonsson L, Westin J, Lagging M. Cirrhosis in hepatitis C virus‐infected patients can be excluded using an index of standard biochemical serum markers. Scand J Gastroenterol 2005;40:867‐872. [DOI] [PubMed] [Google Scholar]
- 29. Sterling RK, Lissen E, Clumeck N, Sola R, Correa MC, Montaner J, et al.; APRICOT Clinical Investigators . Development of a simple noninvasive index to predict significant fibrosis in patients with HIV/HCV coinfection. Hepatology 2006;43:1317‐1325. [DOI] [PubMed] [Google Scholar]
- 30. Wai CT, Greenson JK, Fontana RJ, Kalbfleisch JD, Marrero JA, Conjeevaram HS, et al. A simple noninvasive index can predict both significant fibrosis and cirrhosis in patients with chronic hepatitis C. Hepatology 2003;38:518‐526. [DOI] [PubMed] [Google Scholar]
- 31. Sandrin L, Fourquet B, Hasquenoph JM, Yon S, Fournier C, Mal F, et al. Transient elastography: a new noninvasive method for assessment of hepatic fibrosis. Ultrasound Med Biol 2003;29:1705‐1713. [DOI] [PubMed] [Google Scholar]
- 32. Kleiner DE, Brunt EM, Van Natta M, Behling C, Contos MJ, Cummings OW, et al.; Nonalcoholic Steatohepatitis Clinical Research Network . Design and validation of a histological scoring system for nonalcoholic fatty liver disease. Hepatology 2005;41:1313‐1321. [DOI] [PubMed] [Google Scholar]
- 33. Dam‐Larsen S, Becker U, Franzmann MB, Larsen K, Christoffersen P, Bendtsen F. Final results of a long‐term, clinical follow‐up in fatty liver patients. Scand J Gastroenterol 2009;44:1236‐1243. [DOI] [PubMed] [Google Scholar]
- 34. Hagström H, Nasr P, Ekstedt M, Hammar U, Stål P, Hultcrantz R, et al. Fibrosis stage but not NASH predicts mortality and time to development of severe liver disease in biopsy‐proven NAFLD. J Hepatol 2017;67:1265‐1273. [DOI] [PubMed] [Google Scholar]
- 35. Ratziu V, Charlotte F, Heurtier A, Gombert S, Giral P, Bruckert E, et al.; LIDO Study Group . Sampling variability of liver biopsy in nonalcoholic fatty liver disease. Gastroenterology 2005;128:1898‐1906. [DOI] [PubMed] [Google Scholar]
Associated Data
This section collects any data citations, data availability statements, or supplementary materials included in this article.
Supplementary Materials
Additional Supporting Information may be found at onlinelibrary.wiley.com/doi/10.1002/hep4.1134/full.
Supporting Information 1