Viral infection during pregnancy is correlated with increased frequency of neurodevelopmental disorders. This phenomenon has been studied in mice prenatally subjected to maternal immune activation (MIA). We previously showed that maternal T helper 17 (Th17) cells promote the development of cortical and behavioral abnormalities in MIA-affected offspring. Here, we show that cortical abnormalities are preferentially localized to a region encompassing the dysgranular zone of the primary somatosensory cortex (S1DZ). Moreover, activation of pyramidal neurons in this cortical region was sufficient to induce MIA-associated behavioral phenotypes in wild-type animals, while reduction in neural activity rescued the behavioral abnormalities in MIA-affected offspring. Furthermore, sociability and repetitive behavioral phenotypes could be selectively modulated according to the efferent targets of S1DZ. Our work identifies a cortical region primarily, if not exclusively, centered on the S1DZ as the major node of a neural network that mediates behavioral abnormalities observed in offspring exposed to maternal inflammation.
In humans, viral infection during pregnancy has been correlated with increased frequency of neurodevelopmental disorders in offspring1–6. This phenomenon has been modeled in mice7–10. We previously reported that the offspring from pregnant dams injected with polyinosinic:polycytidylic acid (poly(I:C)), which mimics viral infection, on embryonic day 12.5 (E12.5) exhibit behavioral abnormalities including abnormal communication, increased repetitive behaviors, and deficits in sociability11. In parallel to the behavioral abnormalities, we also observed that MIA-affected offspring display patches of disorganized cortical cytoarchitecture during embryonic development as well as in adulthood. The cortical phenotype was manifested as a loss of the cortical layer-specific markers special AT-rich sequence-binding protein 2 (SATB2) and T-brain-1 (TBR1)11. Development of both MIA-associated behavioral phenotypes (MIA behaviors) and cortical patches were prevented by knocking out a key transcriptional regulator of Th17 cells, retinoic acid receptor-related orphan nuclear receptor gamma t (RORγt), in maternal T-cells, or by inhibiting the activity of their effector cytokine IL-17a in pregnant dams11. These observations suggested that the maternal Th17 cell/IL-17a pathway is crucial for inducing MIA behaviors and for generating cortical patches in the offspring. However, whether the cortical phenotype is the underlying cause of the behavioral abnormalities in MIA offspring remained undetermined.
Characterization of cortical patches
We first wished to determine the distribution of cortical patches in the brains of adult MIA offspring by matching the locations of cortical regions that lack expression of SATB2 or TBR1 to those in a reference mouse brain atlas (Fig. 1a)12. Cortical patches found in individual animals often retained similar mediolateral (ML) and dorsoventral (DV) coordinates through serial coronal sections, suggesting that many form a single continuous patch extending along the AP axis, rather than forming a series of independent patches (Extended Data Fig. 1a). Although cortical patches were detected at multiple locations throughout the cortex, they were prevalently observed in the primary somatosensory cortex (S1) at the anteroposterior (AP) level ~0.5 mm posterior to the Bregma (AP=−0.5 mm) (90 % of animals, N=10) (Fig. 1b and Extended Data Fig. 1), as well as in the secondary motor cortex (M2) and other cortical regions, including the temporal association area (TeA) (80% and 40% of animals, respectively, N=10) (Fig 1b and Extended Data Fig. 1). Cortical patches were also most predominantly present in S1 with respect to both their number and sizes (Extended Data Fig. 1d), and often present in S1 unilaterally (60% of animals, N=10). Furthermore, registration of cortical patches in individual MIA animals onto the same reference plane near ~AP −0.5mm revealed that the cortical patches most consistently centered on S1DZ, a region of the primary somatosensory cortex that is morphologically characterized by the absence of a discernible 4th cortical layer and implicated in muscle- and joint-related functions (56% of animals, N=50) (Fig. 1c, and Extended Data Fig. 2)13–15. Based on these results, we decided to carry out further analysis on S1 patches near ~AP−0.5 mm.
Figure 1. Cortical patches observed in offspring of dams following MIA.
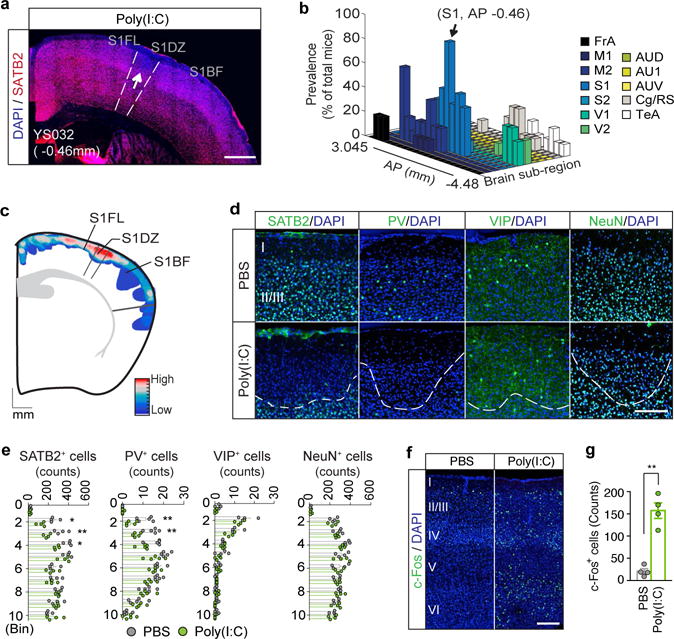
a, Representative S1 image of adult MIA offspring. Arrow indicates cortical patch. Scale bar, 500μm. b, Prevalence of cortical patches (n=10-mice/2-independent experiments) in MIA offspring. c, Superimposed image of cortical patches within AP 0.38–1.34mm (n=50-mice/12-independent experiments). The mouse brain in this figure has been reproduced with permission from Paxinos. Scale indicates frequencies of patches (high=red; low=blue). d, Representative images of S1. White dotted-lines indicate boundary of cortical patches. Scale bar, 100μm. e, Quantification of SATB2+/PV+/VIP+/NeuN+ cells in S1cortical patches (n=4/4-mice (PBS/Poly(I:C)), 3-independent experiments for SATB2/VIP/NeuN; n=5/5-mice (PBS/Poly(I:C)), 3-independent experiments for PV). f, Representative images of c-Fos expression in S1. Scale bar, 100μm. g, Quantification of c-Fos expression in S1 (n=4/4-mice (PBS/Poly(I:C)); 3-independent experiments). *p<0.05,**p<0.01 as calculated by two-way repeated measures ANOVA with Tukey (e) and two tailed unpaired t-test (g). Graphs indicate mean±s.e.m.
Deficits in interneuron function or dys-regulation of neural activity in the somatosensory pathway have been previously associated with both genetic and environmental mouse models of neurodevelopmental disorders16–18. On a similar note, we found that S1 cortical patches of MIA offspring display a specific loss of PV expression, which marks a class of interneurons derived from the medial ganglionic eminence19. This deficit in PV expression could reflect either the loss of PV protein expression or the loss of neurons marked by PV. We observed no significant differences in the expression of the neuron-specific marker NeuN20 or of the vasoactive intestinal polypeptide (VIP)19 which is expressed in interneurons derived from the caudal ganglionic eminence, between PBS control and MIA offspring (Fig. 1d, e, and Extended Data Fig. 3a,b). To test whether the decrease in the number of PV+ neurons results in a diminished inhibitory drive onto S1 pyramidal neurons, we used whole-cell patch clamp recordings to measure the miniature Inhibitory Post-Synaptic Currents (mIPSCs) in S1 pyramidal neurons of PBS or MIA offspring. We indeed observed a reduction in frequency, but not amplitude, of mIPSC (Extended Data Fig. 3c–h) paralleled by an increase in the number of S1 neurons that express c-Fos, a marker of neuronal activation (Fig. 1f, g and Extended Data Fig. 3i, j).
Cortical patches are predictive of MIA behaviors
In order to determine whether the development of MIA-associated behaviors and the appearance of cortical patches depend on the developmental timing at which MIA is induced, we injected poly(I:C) into pregnant dams at embryonic stages E12.5, E15.5, or E18.5, and assessed their offspring for MIA-associated behavioral phenotypes. We first examined the offspring’s ability to communicate by measuring the ultrasonic vocalization (USV) made by pups upon separation from their mothers at postnatal day 9 (P9). As previously reported11, pups from pregnant dams injected with poly(I:C) at E12.5 (MIA offspring) emitted more USV calls than pups from PBS-injected dams (PBS offspring). However, such an increase was not observed in the offspring from dams injected with poly(I:C) either at E15.5 or E18.5 (Extended Data Fig. 4d–g). We also examined repetitive behaviors using the marble-burying assay, natural inclination towards social targets with the sociability assay as well as anxiety-related behaviors by measuring the time spent by adult MIA offspring at the center of an open field (Extended Data Fig. 4a–c). For all behaviors, we observed deficits in the offspring when exposed to prenatal MIA at E12.5. Again, the offspring’s behaviors from mothers injected with poly(I:C) either at E15.5 or E18.5 were indistinguishable from those from PBS-injected mothers (Extended Data Fig. 4h–n), except for a reduction observed in the center time during the open field assay for offspring exposed to MIA at E15.5. Importantly, chamber preference during habituation and the total interaction time during the sociability assay and the total distance traveled during the sociability and open field assays were similar between the different treatment groups suggesting that differences in activity or arousal levels cannot explain the observed behavioral differences (Extended Data Fig. 4i, k, l, n). Our data strongly indicate that all behavioral abnormalities emerge from a discrete developmental stage, allowing us to examine whether the presence of cortical patches is predictive of MIA behavioral phenotypes. Indeed we observed cortical patches in the S1 in 79% of offspring from dams injected with poly(I:C), but not PBS, at E12.5. Yet, cortical patches were seen only in 13% or none of the offspring when poly(I:C) was administered at E15.5 or E18.5, respectively (Fig. 2a). Thus, maternal-inflammation induced at E15.5 and E18.5, unlike at E12.5, was ineffective in generating cortical patches and also failed to produce behavioral abnormalities in MIA offspring. Furthermore, the size of the S1 cortical patches correlated with the severity of behavioral phenotypes: the cortical patch sizes ranged between 0 (absence of the cortical patch) and 1 mm2 and were positively correlated with the marble burying index, while negatively correlated with both sociability and time spent in the center of an open field (Fig. 2b–d). The total distance traveled during the sociability assay was not affected by patch size (Fig. 2e). The size of cortical patches found outside of S1 also did not correlate with the severity of behavioral abnormalities (Extended Data Fig. 4o–q).
Figure 2. The presence and size of cortical patches are predictive of MIA-induced behaviors and their severity in offspring.
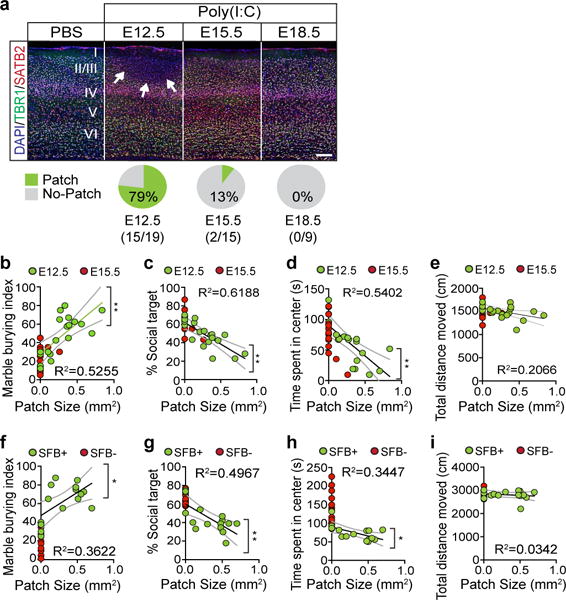
a, Top: Representative S1 images of adult offspring from PBS- (E12.5;n=12-mice/7-independent experiments) and poly(I:C)-injected dams (E12.5/E15.5/E18.5; n=19/15/9-mice, 7/7/5-independent experiments). Bottom: Percentage of offspring with cortical patches in S1. Arrows indicate cortical patch. Scale bar, 100μm. b–i, Cortical patch size plotted against behavioral severity on marble burying (b,f), sociability (c,g), and open field tests (d,h), and total distance moved during sociability (e,i) for offspring exposed to MIA at E12.5/E15.5 (b–e) (n=19/15-mice, 7-independent experiments) or offspring from SFB+ Taconic-dam/SFB− Jackson-dam (f-i) (n=16/14-mice, 2-independent experiments). Green solid lines represent regression line; gray dotted lines indicate 95% confidence intervals for E12.5 (b–e) or SFB+ (f–i) groups. *p<0.05,**p<0.01 as calculated by Linear regression (b–i).
The accompanying paper by Kim et al. demonstrates that a single species of bacteria – segmented filamentous bacteria (SFB) – present in C57BL/6 animals bred by Taconic Biosciences, but not in those from Jackson Laboratory, is required in mothers to induce behavioral abnormalities in MIA offspring (Kim et al., accompanying paper). All animals used in this study were also from mouse colonies carrying SFB. In accordance with our observation above, we found that the size of cortical patches in MIA offspring from SFB-present (SFB+) dams was highly correlated with the severity of the offspring’s behavioral phenotypes, but not with the total distance traveled during the behavioral assay (Fig. 2f–i). On the other hand, offspring from SFB-absent (SFB−), MIA-exposed mothers did not exhibit S1 cortical patches.
Lastly, we previously showed that recombinant IL-17a injected into the ventricles of the developing brain requires intact IL-17a receptor subunit A (IL-17Ra) expression in the fetus to induce MIA-associated phenotypes11. We also previously noted that IL-17Ra expression is upregulated in the cortical plate upon MIA. This induction is mostly restricted to ankyrin-3 (Ank3)+ and NeuN+ postmitotic neurons, but not paired box 6 (Pax6)+ neuronal progenitors (Extended Data Fig. 5a)20–22. In line with this observation, knocking-out IL-17Ra in offspring using a Cre driver line specific for the nervous system – Nestin-Cre23 – prevented the development of S1 cortical patches and the associated phenotypes; loss of SATB2 and PV expression or increase in the number of c-Fos+ neurons was not observed in these animals. As expected, brain-specific abrogation of IL-17Ra in offspring also rescued MIA-induced behavioral abnormalities (Extended Data Fig. 5b–j). Together, these data collectively show that the presence of cortical patches is highly predictive of MIA-induced behaviors. They further suggest that timing of inflammation, composition of maternal gut bacteria as well as IL-17Ra expression in the fetal brain dictate the severity of MIA-induced behavioral phenotypes in the offspring by contributing to the formation of S1 cortical patches.
Increasing neural activity in the S1DZ region drives MIA behaviors
Our characterization of cortical patches indicated that an increase in the overall neural activity within S1 could be a major factor driving abnormal behavioral phenotypes in MIA offspring (Fig. 1f, g and Extended Data Fig. 3c–j). Indeed, previous studies suggested that deficits in interneuron development and subsequent perturbations of excitation/inhibition (E/I) balance could be the underlying cause(s) of neurodevelopmental disorders24–33. We thus asked if increasing neural activity in S1 could recapitulate MIA-induced behaviors in WT adult animals. We virally expressed either Enhanced Yellow Fluorescent Protein (EYFP), channelrhodopsin (ChR2)34, or halorhodopsin (NpHR)35 using the neuron-specific promoter, human Synapsin 1 (hSyn1) (Fig. 3c and Extended Data Fig. 6a). Both the virus and the optical fibers were bilaterally targeted to a region centered on S1DZ (S1DZ region), where cortical patches were most consistently observed in MIA animals (Fig. 3a). Animals were subsequently subjected to the behavioral assays described above, while receiving optical stimulation at 3-minutes intervals (a 3 minute-‘On’ session followed by a 3 minute-‘Off’ session or vice versa) (Fig. 3b). Increasing neural activity with ChR2 in wild-type (WT) offspring resulted in enhanced marble burying behaviors, impaired sociability without any effects on total interaction time, and reduced time spent at the center of an open field (Fig. 3d–h and Extended Data Fig. 6). On the other hand, photostimulation of EYFP-expressing neurons in the control group failed to induce any MIA-associated behaviors. Furthermore, reducing neural activity in S1 using NpHR did not generate behavioral abnormalities, with the exception of a slight, yet significant, increase in marble burying behavior compared to the EYFP-expressing control group (Fig. 3e). This effect is likely due to non-specific inhibition of different types of neurons in the photostimulated region. Therefore, to specifically isolate the contribution of only excitatory glutamatergic neurons, we used a Cre-dependent strategy to express opsins under the control of the vesicular Glutamate Transporter 2 promoter (vGluT2) (Fig. 3i)36. Increasing activity of vGluT2+ neurons using ChR2 recapitulated all three MIA-associated behaviors, while photostimulation in NpHR- or EYFP-expressing animals failed to induce these behavioral abnormalities (Fig 3j–n and Extended Data Fig. 7a–f). We also selectively modulated neural activity in PV+ neurons by virally driving Cre-dependent opsin expression in PV-Cre animals (Fig. 3o)37. Inhibiting the activity of the PV+ neuronal population with NpHR mimicked the decrease in the number of PV+ neurons observed in the MIA-cortical patches and recapitulated all three MIA-associated behavioral phenotypes (Fig. 3p–t and Extended Data Fig. 7g–l). On the other hand, photostimulation of EYFP- or ChR2-expressing animals did not produce any observable deficits (Fig. 3q–t).
Figure 3. Increasing neural activity in the S1DZ region induces MIA behavioral phenotypes in WT mice.
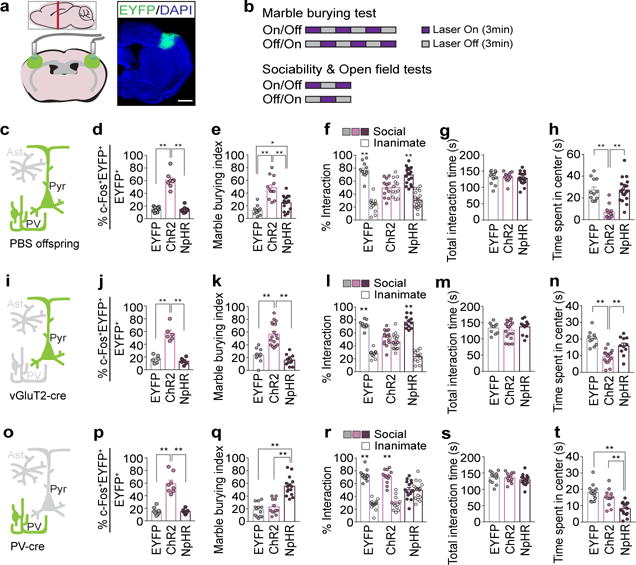
a, Schematics (left) and representative image (right) of EYFP-expressing virus injection site in the S1DZ-centered cortical region. The mouse brain in this figure has been reproduced with permission from Paxinos. Scale bar, 1mm. b, Optical stimulation protocol. Laser was given in a counterbalanced manner. c,i,o, Schematic of labeled cells (green) in PBS offspring (c), vGluT2-Cre (i), or PV-cre mice (o) (Pyr:Pyramidal neuron, PV:Parvalbumin-positive neuron, Ast:Astrocyte). d,j,p, Percentage of EYFP+ neurons co-expressing c-Fos upon photostimulation (n=8/8/8-mice, 4-independent experiments (PBS offspring;AAV2-hSyn-EYFP/ChR2/NpHR); n=6/6/6-mice, 3-independent experiments (vGluT2-Cre;AAV2-EF1a-DIO-EYFP/ChR2/NpHR); n=8/8/8-mice, 4-independent experiments (PV-cre;AAV2-EF1a-DIO-EYFP/ChR2/NpHR)). e-h,k-n,q-t, Marble burying index (18-min) (e,k,q), % interaction (f,l,r) and total interaction time (g,m,s) during 1st laser-on session of the sociability test, and time spent in center during 1st laser-on session of the open field test (h,n,t) (n=12/12/18-mice, 5-independent experiments (PBS offspring;AAV2-hSyn-EYFP/ChR2/NpHR); n=10/17/11-mice, 5-independent experiments (vGluT2-Cre;AAV2-EF1a-DIO-EYFP/ChR2/NpHR); n=13/12/15-mice, 6-independent experiments (PV-cre;AAV2-EF1a-DIO-EYFP/ChR2/NpHR)). *p<0.05,**p<0.01 as calculated by two-way ANOVA (f,l,r) and one-way ANOVA (d,e,g,h,j,k,m,n,p,q,s,t) with Tukey post-hoc tests. Graphs indicate mean±s.e.m.
We next examined whether the ability to drive these MIA behaviors is a general feature of S1 or is specific to the S1DZ region (~AP=−0.5), where we predominantly observed cortical patches. We targeted ChR2 and optical implants into four additional anterior and posterior regions of S1, while keeping the ML coordinates consistent (Extended Data Fig. 8a–c). Photostimulation of these off-target regions did not elicit MIA phenotypes in the marble burying or sociability assays (Extended Data Fig. 8d–f). The same manipulation carried out medially in the forelimb region (S1FL) or laterally in the barrel field of primary somatosensory cortex (S1BF) also failed to induce any behavioral abnormalities (Extended Data Fig. 8g–l). Lastly, since cortical patches are often observed only in one hemisphere (Extended Data Fig. 1), we asked if unilateral manipulation of neural activity in the S1DZ region is sufficient to produce MIA behavioral phenotypes. Targeting ChR2 and optical implants to either hemisphere unilaterally increased the number of c-Fos+ neurons both in ipsilateral as well as contralateral S1 and was capable of driving MIA behaviors similarly to the bilateral stimulation (Extended Data Fig. 9). Taken together, these results demonstrate that MIA-like behaviors can be recapitulated in WT animals either through the activation of excitatory neurons or the inhibition of PV+ inhibitory neurons and that this feature is primarily localized to the cortical region centered on the S1DZ.
Reducing neural activity in the S1DZ region rescues MIA behaviors
We next asked whether reduction of neural activity in the S1DZ region of MIA offspring is sufficient to correct the observed behavioral abnormalities. Photostimulation of NpHR-expressing animals decreased the number of c-Fos+ cortical neurons when compared to those in photostimulated EYFP-expressing MIA animals (Fig. 4a,b and Extended Data Fig. 10a). This inhibition of neural activity was sufficient to suppress enhanced marble burying, restore sociability, and increase the time spent in the center of the open field to levels observed in control PBS animals (Fig. 4c–f and Extended Data Fig. 10). Photostimulation of EYFP- or ChR2-expressing animals did not rescue any behavioral deficits (Fig. 4c–f). Thus, the foregoing data demonstrate that acute reduction in neural activity in the S1DZ region is sufficient to rescue behavioral abnormalities in MIA offspring prenatally exposed to maternal inflammation.
Figure 4. Reducing neural activity in the S1DZ region corrects behavioral abnormalities in MIA offspring.
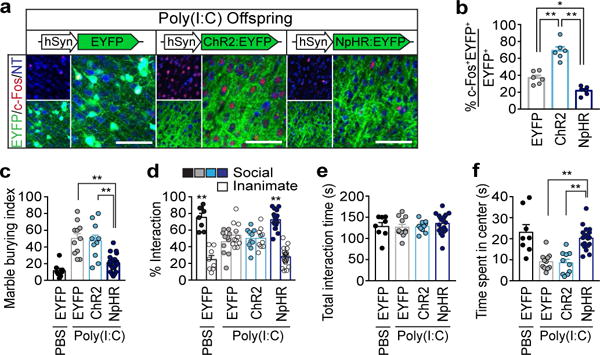
a, Representative images of c-Fos expression upon photostimulation of the S1DZ region in MIA offspring. Scale bar, 100μm. b, Percentage of EYFP/c-Fos co-expressing neurons upon stimulation (n=6/6/6-mice; 3-independent experiments (MIA;AAV2-hSyn-EYFP/ChR2/NpHR)). c–f, Performance on marble burying test (c), % interaction (d) and total interaction time (e) during the sociability test, and time spent in center during the open field assay (f) (n=8/11/10/20-mice; 5/5/5/7-independent experiments (PBS;AAV2-hSyn-EYFP/MIA;AAV2-hSyn-EYFP/ChR2/NpHR)). *p<0.05,**p<0.01 as calculated by two-way ANOVA (d) and one-way ANOVA (b,c,e,f) with Tukey post-hoc tests. Graphs indicate mean±s.e.m.
Distinct populations of S1DZ neurons selectively modulate MIA behaviors
To gain insight into the downstream neural circuits involved in eliciting MIA-associated behaviors, we next examined the efferent targets of the S1DZ. We injected an anterogradely-labeling adeno-associated virus (AAV) driving EYFP into the S1DZ and an AAV driving mCherry into either the S1FL or S1BF. These tracing studies revealed that the S1DZ exhibits largely distinct efferent targets compared to the S1FL and S1BF regions (Fig. 5a, b and Extended Data Fig. 11). The S1DZ selectively sends axons to a sub-region of M2, striatum as well as TeA. To test the role of these distinct downstream regions in eliciting MIA-behaviors, we injected retrogradely transported rabies virus (RV)38 expressing EYFP, Chronos (excitatory opsin)39 or ArchT (inhibitory opsin)40 into the TeA to retrogradely label S1DZ neurons in WT animals (Fig. 5c, d). Photostimulation of Chronos-positive, TeA-projecting neurons in the S1DZ generated sociability deficits without affecting total interaction time, but failed to induce increased marble burying phenotypes (Fig. 5e–g and Extended Data Fig. 12a–f). Photostimulation of EYFP- or ArchT-expressing neurons did not produce any behavioral deficits. Thus, in otherwise WT animals, increasing the neural activity of the neurons in the S1DZ that project to the TeA recapitulated MIA-associated sociability deficits, but not the repetitive marble burying phenotypes. Conversely, in MIA animals, decreasing the neural activity of this S1DZ neuronal population with ArchT restored normal sociability, but failed to suppress the enhanced marble burying phenotype (Fig. 5e–g and Extended Data Fig. 12a–f). We also manipulated the activity of the striatum-projecting S1DZ neurons and found that this population, when activated using Chronos, induced enhanced marble-burying phenotype in WT animals without modulating sociability. On the other hand, decreased neural activity in this population suppressed the enhanced marble burying behavior without correcting sociability deficits in MIA offspring (Fig. 5k–m and Extended Data Fig. 12g–l). The TeA- or striatum-projecting S1DZ populations equally modulated the amount of time spent in the center of an arena in the open field assay (Fig. 5h, n and Extended Data Fig. 12). These data suggest that the neurons in S1DZ region projecting to the TeA or striatum selectively modulate interactions with social targets and repetitive behaviors, respectively.
Figure 5. Distinct populations of S1DZ neurons selectively modulate marble burying and sociability phenotypes.
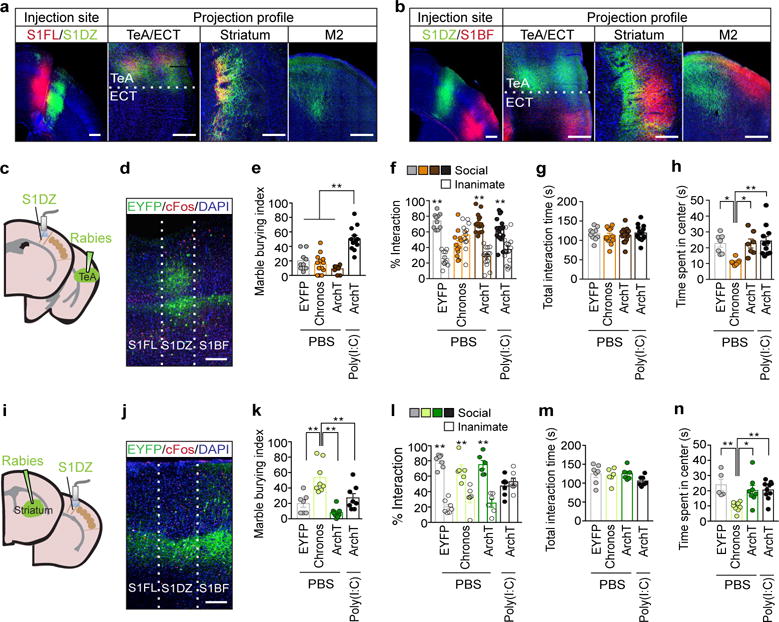
a–b, Anterograde-tracing using AAV2-hSyn-mCherry (S1FL/S1BF) and AAV2-hSyn-EYFP (S1DZ) (n=5-mice/4-independent experiments). c,i, Schematics of optic fiber implantation (S1DZ) and virus injection sites in TeA (c) or dorsolateral striatum (i). The mouse brain in this figure has been reproduced with permission from Paxinos. d,j, Representative image of EYFP/c-Fos/DAPI expression in S1DZ after photostimulation (3-independent experiments). Scale bar, 300μm. e-h,k-n, Performance on the marble burying test (e,k) (TeA:n=9/13/10/12-mice; 7-independent experiments, striatum: n=7/8/8/8-mice; 5-independent experiments (PBS;RV-EYFP/Chronos/ArchT, MIA;RV-ArchT)), % interaction (f,l) and total interaction time (g,m) during the sociability test (TeA:n=10/12/15/15-mice; 7-independent experiments, striatum:n=7/6/6/7-mice; 5-independent experiments (PBS;RV-EYFP/Chronos/ArchT, MIA;RV-ArchT)), and the open field test (h,n) (TeA:n=7/7/7/11-mice;7-independent experiments, striatum:n=5/9/8/10-mice;5-independent experiments (PBS;RV-EYFP/Chronos/ArchT, MIA;RV-ArchT)). *p<0.05,**p<0.01 as calculated by two-way ANOVA (f,l) and one-way ANOVA (e,g,h,k,m,n) with Tukey post-hoc tests. Graphs indicate mean±s.e.m.
Discussion
Identifying neural circuits and components that modulate behaviors aberrantly manifested in patients with neurodevelopmental disorders is critical for developing therapeutic approaches. One challenge to achieving this goal is the paucity of animal models in which discrete brain areas are known to mediate disorder-associated behavioral symptoms. Here we identified a restricted brain region centered on S1DZ as a component of the neural circuit that mediates MIA-induced behavioral abnormalities. S1DZ has been implicated in proprioceptive functions13–15. It will be crucial to elucidate the nature of the afferent information to the S1DZ region and how this information is differentially processed in the downstream targets of healthy and diseased brains. Our data indicate that IL-17Ra expression in the fetal brain is necessary to mediate the MIA effects. The cell type impacted by IL-17Ra activation upon MIA, and mechanisms by which the receptor activation induces cortical patches in S1 need to be identified in the future. Furthermore, it is interesting to note that the main efferent targets of the S1DZ, such as the TeA and M2, are also locations in which cortical patches are frequently found in MIA offspring (Fig. 1b and Extended Data Fig. 1b, d). This observation suggests that cortical patch formation in MIA offspring may be intricately linked to concerted neural activity among the connected brain regions. While similar cortical patches were observed in prefrontal and temporal cortical tissues of children with autism41, it will be informative to examine whether cortical patches are also found in S1 of human patients with neurodevelopmental disorders. Of note, we cannot rule out a possibility that general MIA-induced behavioral abnormalities are driven by heightened anxiety. It also should be noted that in some MIA animals, cortical patches were only observed outside of S1 (12 % of animals, n=50), suggesting that S1DZ region might be one of the nodes within a larger network that controls MIA-impacted behaviors. This MIA mouse model with discrete, functionally-relevant perturbations in the S1DZ region, might provide access to a network that modulates behaviors across different mouse models of neurodevelopmental disorders.
Materials and Methods
Animals
All experiments were performed in accordance with the Guide for the Care and Use of Laboratory Animals and were approved by the National Institutes of Health and the Committee and Animal Care at Massachusetts Institute of Technology. C57BL/6 mice were purchased from Taconic (USA), and Nestin-cre (003771), PV-cre (008069), and vGluT2-cre (016963) mice from Jackson laboratory (USA). IL-17Rafl/lfl mice were described previously42. All mice were crossed and maintained in-house with C57BL/6 mice from Taconic. Mice were analyzed with the following primers for the presence of SFB using qPCR: SFB736-F 5′-GACGCTGAGGCATGAGAGCAT-3′, SFB844-R: 5′-GACGGCACGGATTGTTATTCA-3′ for SFB; UniF340 5′-ACTCCTACGGGAGGCAGCAGT-3′, UniR514 5′-ATTACCGCGGCTGCTGGC-3′ for total commensal bacteria. IL-17Rafl/fl animals were crossed with Nestin-cre to remove IL-17Ra in the brain. The following primers were used to genotype progenies: IL-17Ra-flox-1-F 5′-GGCAGCCTTTGGGATCCCAAC-3′, IL-17Ra-flox-2-R 5′-CTACTCTTCTCACCAGCGCGC-3′ for WT 336bps/Floxed 377bps; IL-17Ra-flox-2-R, IL-17Ra-flox-3-F 5′-GTGCCCACAGAGTGTCTTCTGT-3′ for KO 478bps; and Cre-F 5′-GCGGTCTGGCAGTAAAAACTATC-3′, Cre-R 5′-GTGAAACAGCATTGCTGTCACTT-3′ for Nestin-cre 100bps. For gender discrimination of each embryo, PCR was carried out using sry (sex-determining region of the Y chromosome) gene specific primers: 5′-ACAAGTTGGCCCAGCAGAAT-3′, and 5′-GGGATATCAACAGGCTGCCA-3′.
Maternal Immune Activation
Mice were mated overnight and females were checked daily for the presence of seminal plugs, noted as embryonic day 0.5 (E0.5). On E12.5, pregnant female mice were weighed and injected with a single dose of poly(I:C) (20mg/kg i.p., Sigma Aldrich, USA), which was incubated at 70°C for 20 min and cooled down to 25°C for 1hr before injection. Each dam was returned to its cage and left undisturbed until the birth of its litter. All pups remained with the mother until weaning on postnatal day 21 (P21), at which time mice were group-housed at a maximum of 5 per cage with same-sex littermates. For checking the effect of poly(I:C) administration at different time points during pregnancy, we injected poly(I:C) into pregnant dams on E12.5, E15.5, or E18.5.
Stereotaxic injection
All surgeries were carried out using aseptic techniques and animals were pre-operatively injected with the following dosages of anesthetics and analgesics: ketamine (100mg/kg i.p.), xylazine (10mg/kg i.p.), and slow-release buprenorphine (1mg/kg s.c.). All stereotaxic reference points were set at Bregma for the AP axis, at the midline for the ML axis, and at the surface of the brain for the DV axis. For optogenetic experiments, animals received bilateral stereotaxic injections of one of the following viruses at rates of <0.1 ml/min: AAV2-hSyn-EYFP, AAV2-hSyn-ChR2:EYFP, AAV2-hSyn-NpHR3.0:EYFP, AAV2-EF1a-DIO-Cre:EYFP, AAV2-EF1a-DIO-ChR2:EYFP, or AAV2-EF1a-DIO-NpHR3.0:EYFP (UNC vector core, USA). These viruses were injected into one of the following coordinates: the cortical area near S1DZ (AP = −0.5 mm; ML = ±2.5~3.0 mm; DV = 0.8 mm), off-targets ±0.5 mm or ±1.0 mm along the AP axis (AP = 0.5 mm, ML = ±3.0 mm, DV = 0.8 mm; AP = 0.0 mm, ML = ±3.0 mm, DV = 0.8 mm; AP = −1.0 mm, ML = ±3.0 mm, DV = 0.8 mm; and AP = −1.5 mm, ML = ±3.0 mm, DV = 0.8 mm), S1FL (AP = −0.5 mm, ML = ±2.0 mm, DV = 0.8 mm), or S1BF (AP = −0.5 mm, ML = ±3.5 mm, DV = 0.8 mm). Subsequently, fiber optic implants (300 μm core size, Thorlabs, USA) were bilaterally placed 500 μm above the virus injection sites.
For stimulating the specific S1DZ/TeA and S1DZ/Striatum connections, rabies virus (RV-EYFP, RV-Chronos:EYFP or RV-ArchT:EYFP; Ian R. Wickersham at MIT) was bilaterally introduced into either the TeA (AP=−1.75 mm, ML= ±4.15 mm, DV=1.65 mm) or striatum (AP= −0.2mm, ML= ±2.7mm, DV= 2.5mm) and optic fiber implants were placed onto the S1DZ (AP = −0.5 mm, ML = ±2.5 mm, DV = 0.3 mm).
For anterograde tracing, AAV2-hSyn-EYFP was injected into the S1DZ and AAV2-hSyn-mCherry into either the S1FL or S1BF.
All brain section schematics for showing virus injection sites and optic fiber implantation sites were drawn using Adobe Illustrator to closely resemble the corresponding sections in the Paxinos brain atlas12.
Behavioral analysis
All behavioral training and testing were carried out in accordance with previously established behavioral schemes11 with modifications. Animals were tested during light cycle and were transferred to the behavior testing room with light control (80 lux) for 1hr before the start of experiments. Experimenters were blind to the treatment group.
Ultrasonic vocalizations
On P9, mouse pup ultrasonic vocalizations (USVs) were detected for 3 min using an Ultra-Sound Gate CM16/CMPA microphone (AviSoft, Germany) and SAS Prolab software (AviSoft, Germany) in a sound attenuation chamber under stable temperature (19–22°C). For further characterization of the USVs, the sonograms from the 1st minute of the recordings were classified into ten distinct categories in accordance to previously established methods43 and were analyzed for the total number of calls made and the average duration of the calls.
Three-chamber social approach assay
Male mice (8~12-weeks-old) were tested for sociability using a 3-chamber social approach paradigm. An empty object-containment cage (circular metallic cages, Stoelting Neuroscience) was each placed into the left and right chambers of a 3-chamber arena (50cm×35cm×30cm), which the experimental mice freely investigated for 10 min (exploration period / habituation). The following day, the mice underwent another 10 min exploration period (habituation). Immediately after, the mice were confined to the center chamber, while a social object (unfamiliar C57BL/6 male mouse) and an inanimate object (Rubber object of a similar size as the social object) were placed alternatingly into either the left or right object-containment cage. Barriers to the adjacent chambers were removed, and the mice were allowed to explore the 3-chamber arena for 10 min. Approach behavior was defined as interaction time (i.e. sniffing, approach) with targets in each chamber (within 2 cm). Sessions were video-recorded and object approach behavior and total distance moved were analyzed using EthoVision tracking system (Noldus, Netherlands). % Interaction was calculated as the percentage of time spent investigating the social target or the inanimate object out of the total investigation time for both objects.
Marble burying test
Mice were placed into testing arenas (arena size: 40cm×20cm×30cm, bedding depth: 3cm) each containing 20 glass marbles (laid out in four rows of five marbles equidistant from one another). At the end of the 15-min exploration period, mice were carefully removed from the testing cages and the number of marbles buried was recorded. The marble burying index was arbitrarily defined as the following: 1 for marbles covered >50% with bedding, 0.5 for marbles covered <50% with bedding, or 0 for anything less.
Open field test
Mice underwent a 15-min exploration period in the testing arena (arena size: 50cm×50cm×35cm). Sessions were video-recorded and analyzed for time spent in the center (center size: 25cm × 25cm) using EthoVision Noldus tracking system (Noldus, Netherlands).
Behavioral analysis with optical stimulation
After two weeks of recovery, animals were assessed using the behavioral schemes described above. During behavioral assays, animals were given 3 min of laser stimulation (On session, ChR2: 405nm, 6mW, 20Hz, 50% duty cycle; Chronos: 488nm, 6mW, 20Hz, 50% duty cycle; NpHR3.0 and ArchT: 595nm, 8mW, 20Hz, 50% duty cycle) followed by 3 min of no stimulation (Off session). Animals started with either an On or Off session in a counterbalanced manner. Photostimulation was controlled with a waveform generator (Keysight, 33220A, USA) and Ethovision XT (Noldus, Netherlands). Behavioral analysis was conducted as described earlier using EthoVision Noldus tracking system (Noldus, Netherlands).
For quantitative analysis of photostimulation-dependent activation of virus expressing neurons, mice were sacrificed 1 hr after the end of the behavioral testing. Brain slices were double-labeled for c-Fos (sc-7270, Santa Cruz, USA; ABE457, Millipore, USA) and EYFP (ab5450, Abcam, USA). The percentage of neurons expressing c-Fos (c-Fos+EYFP+/EYFP+) within a 500 μm × 500μm area, 300μm below the optical fiber placement was calculated. Behavioral results from mice without viral infection or with inaccurate targeting of virus or fiber implantations were excluded. Experimenter was blind to the treatment groups.
Slice Preparation for Whole-Cell Electrophysiology
Mice were anesthetized with pentobarbital (40mg/kg i.p.) and intracardially perfused with ice-cold dissection buffer (in mM: 87 NaCl, 2.5 KCl, 1.25 NaH2PO4, 26 NaHCO3, 75 sucrose, 10 dextrose, 1.3 ascorbic acid, 7 MgCl2 and 0.5 CaCl2) bubbled with 95% O2-5% CO2. Brains were rapidly removed and immersed in ice-cold dissection buffer. Somatosensory cortical sections were dissected and 300μm coronal slices were prepared using a Leica VT1200S vibratome (Leica, USA). Slices recovered for 20 min in a 35°C submersion chamber filled with oxygenated artificial cerebrospinal fluid (aCSF) (in mM: 124 NaCl, 3 KCl, 1.25 NaH2PO4, 26 NaHCO3, 1 MgCl2, 2 CaCl2, and 20 glucose) and then kept at room temperature for >40 min until use.
Voltage-Clamp Recordings
Miniature Inhibitory Postsynaptic Currents
To specifically isolate miniature inhibitory postsynaptic currents (mIPSCs), slices were placed in a submersion chamber maintained at 32°C, perfused at 2 ml/min with oxygenated aCSF (as described above) containing 1μM TTX, 100μM DL-APV, and 20μM DNQX and held at 0mV. Cells were visualized using an Olympus BX-51 equipped with infrared differential interference contrast (IR-DIC) optics. Pyramidal neurons from Layer II/III of PBS control offspring or corresponding upper portion of the cortex of MIA offspring were identified by intrinsic membrane properties present in S1 and morphological confirmation of spiny dendrites. Patch pipettes were pulled from thick-walled borosilicate glass (P-2000, Sutter Instruments Novato, USA). Open tip resistances were between 2.5–6MΩ and were back-filled with an internal containing the following (in mM): 100 CsCH3SO3, 15 CsCl, 2.5 MgCl2, 10 Hepes, 5 QX-314, 5 BAPTA, 4 Mg-ATP, 0.3 Mg-GTP, and 0.025 Alexa-568 with pH adjusted to 7.25 with 1M CsOH and osmolarity adjusted to ~295 mOsm by the addition of sucrose or water. Voltage-clamp recordings were performed in whole-cell configuration using patch-clamp amplifier (Multiclamp 700B, Molecular Devices or Amplifier BVC-700A, Dagan) and data were acquired and analyzed using pClamp 10 software (Molecular Devices) or a template matching algorithm in MatLab. Pipette seal resistances were >1GΩ and pipette capacitive transients were minimized before breakthrough. Changes in series and input resistance were monitored throughout the experiment by giving a test pulse every 30s and measuring the amplitude of the capacitive current. Slices were subsequently fixed in 4% PFA for post-hoc validation. Cells were discarded if series resistance rose above 20MΩ. The experimenter was blinded during the acquisition and analysis of the postsynaptic currents.
Immunohistochemistry
For cryosectioning, animals were intracardially perfused, and the brain was dissected out, fixed with 4% PFA in PBS overnight at 4°C, and cryoprotected in 30% sucrose solution. The left hemisphere was marked with a needle and the sections were coronally sliced at 40μm using a cryostat (Leica, USA). For vibratome sectioning, animals were intracardially perfused, and the brain was fixed with 4% PFA in PBS overnight at 4°C. The brains were coronally sliced at either 50 or 100μm with a Leica VT1000S vibratome (Leica, USA).
Slices were permeabilized with blocking solution containing 0.4% Triton X-100 and 2% goat serum in PBS for 1 h at room temperature (RT) and then incubated with anti-rabbit-TBR1 (ab31940, Abcam, USA), anti-mouse-SATB2 (ab51502, Abcam, USA), anti-rabbit-PV (PV27, Swant, Switzerland), anti-rabbit-VIP (20077, Immunostar, USA), anti-mouse-NeuN (MAB377X, Millipore, USA), or anti-rabbit-c-Fos (sc-7270, Santa Cruz, USA; ABE457, Millipore, USA) antibodies overnight at 4°C. The following day, slices were incubated with fluorescently conjugated secondary antibodies (Invitrogen, USA) for 1 hr at RT with Neurotrace (Invitrogen, USA), and mounted in Vectashield mounting medium containing 4′,6-Diamidino-2-Phenylindole, Dihydrochloride (DAPI; Vector laboratories, USA). Images of stained slices were acquired using a confocal microscope (LSM710; Carl Zeiss, Germany) with a 20X objective lens; all image settings were kept constant across the same batch of experimental groups.
For anterograde-tracing, brains were sliced into 100μm sections, and the prepared slices were labeled with anti-chicken-GFP (ab5450, Abcam, USA), anti-rabbit-DsRed (632496, Clontech, USA) and DAPI. Images were acquired with a confocal microscope and then aligned to the Paxinos brain atlas12.
Double In Situ Hybridization
E14.5 male embryos were obtained from dams treated with poly(I:C) at E12.5. The heads were frozen on dry ice and embedded in Tissue Tek O.C.T. (Sakura Finetek, Torrance, CA). The blocks were sectioned at 16μm thickness using a cryostat (Leica, USA). Fluorescent in situ hybridization was performed using an amplification technology according to the manufacturer’s protocol (ViewRNA ISH Tissue Assay kit, Thermo Fisher Scientific, USA). Briefly, the sections were fixed in 4% PFA at 4°C for 16–18 hr and dehydrated by sequentially soaking the slides in 50%, 70%, and 100% ethanol. il17ra (NM_008359, Cat#: VB1-10258), ank3 (NM_170728, Cat#: VB6-17256), and pax6 (NM_013627, Cat#: VB6-11573) probes were applied to the sections and incubated for 3 h at 40°C.
In situ Hybridization followed by Immunohistochemistry
The sectioned embryo brain slices at 16μm thickness were fixed in 4% PFA at RT for 10 min and were permeabilized in 70% ethanol at 4°C for 12–18hr. Sections were further permeabilized in RNase-free 8% SDS for 10min. Samples were rinsed to remove SDS, and fluorescent in situ hybridization for il17ra transcripts were performed according to the manufacturer’s protocol (ViewRNA ISH Tissue Assay kit, Thermo Fisher Scientific, USA). The samples were subsequently processed for immunohistochemistry with anti-NeuN antibody (MAB377X, Millipore, USA).
Colocalization Coefficients for anterograde-tracing results
Percentage of co-localized projection fibers (co-localization coefficient) from S1FL or S1BF with those from S1DZ was calculated using ImageJ software (Manders’ coefficient) (Extended Data Fig. 11). The co-localization coefficient was represented as S1DZ/S1FL or S1FL/S1DZ and S1DZ/S1BF or S1BF/S1DZ. S1DZ/S1FL or S1DZ/S1BF reflects the percentage of S1FL or S1BF projection fibers within the region of interest (ROI) that is co-localized with those from S1DZ. S1FL/S1DZ or S1BF/S1DZ reflects the percentage of S1DZ projection fibers co-localized with those from S1FL or S1BF. Coste’s algorithm was used to define the threshold for each image used in this experiment.
Analysis of cortical patches
Cortical patches were identified by the absence of SATB2 or TBR1 expression. Cortical regions that met the following criteria were not included as cortical patches: (1) when the area had weak, but not the absence of, SATB2 or TBR1 expression; (2) when the area displayed tissue damage. Spatial locations of the cortical patches were determined based on their distance from the midline of the brain and the layer structures of the cortex. These locations were matched to their corresponding regions in a mouse brain atlas (Paxinos brain atlas)12.
For cortical patch analysis of the whole brain (Ext. Fig. 1), cortical patches were drawn onto a schematic derived form the Paxinos brain atlas12 using Adobe Illustrator. For closer analysis of those located within AP0.38~ −1.34 (Ext. Fig. 2), the brain section schematic was drawn using Adobe Illustrator in reference to the anatomical structures of the coronal section at AP-0.46 in the Paxinos brain atlas12. The size of the cortical patches was calculated using Zen Software (Carl Zeiss, Germany) and scaled using Adobe Illustrator to reflect the actual size as accurately as possible.
Cell types within the cortical patches of the S1 were characterized by staining brain slices from PBS and MIA offspring for PV, VIP or NeuN in conjunction with SATB2 or TBR1. The cortical region of interest (width: 300μm), centered on a cortical patch in MIA offspring or the corresponding area in PBS offspring, was divided into 10 equal laminar blocks (bin) representing different depths of the cortex. Individual marker positive cells (SATB2, PV, VIP, or NeuN) were quantified manually. VIP staining was observed both in cells bodies as well as in processes; only the former was included in counts. Experimenter was blind to the treatment groups.
Conventional RT-PCR
Total RNA was isolated from S1 of adult brains using Quick-RNA mini-prep kits (Zymo, USA). cDNA was synthesized using 200μg total RNA using oligo dT (PROTOSCRIPT FIRST STRAND CDNA SYNTHESIS KIT, NEB). For conventional RT-PCR, 1μl of cDNA synthesized as described above was diluted in 10μl of KAPA Taq PCR kit (KAPA Biosystems). il17ra and gapdh mRNA expression were assessed using the following primers: Il17ra 5′-CCACTCTGTAGCACCCCAAT-3′ and 5′-CAGGCTCCGTAGTTCCTCAG-3′; gapdh 5′-CGACTTCAACAGCCTCCCACTCTTCC-3′ and 5′-TGGGTGGTCCAGGTTTCTTACTCCTT-3′.
Statistics and Reproducibility
Statistical analyses were performed using Prism software. The results from behavioral experiments and quantification of individual marker-positive cells were tested using One-way, Two-way, or Two-way repeated measures ANOVAs followed by Tukey post-hoc tests, or unpaired two-tailed t-test. The correlation between behavioral severity and cortical patch size was tested using Linear regression. The distribution of cortical patches was tested using Kruskal-Wallis test followed by Dunn post-hoc test. Sample sizes were chosen with adequate power based on the literature as well as our previous studies, in general without using statistical methods to predetermine sample size11. Animals were randomized into different groups with approximately comparable numbers of animals in each group whenever possible. No samples or data points were arbitrarily excluded from statistical analysis. Key experiments, including the location of cortical patches, anterograde tracing experiments, and behavioral experiments with optical modulation, were all independently repeated with similar observations. All data are represented as mean ± s.e.m.
Data availability
Source data containing raw data for the main and extended data figures are available in the online version of the paper (Supplementary source data tables). All other data are available from the corresponding authors upon reasonable request.
Extended Data
Extended Data Fig. 1. Distribution of cortical patches in the cortex of MIA offspring.
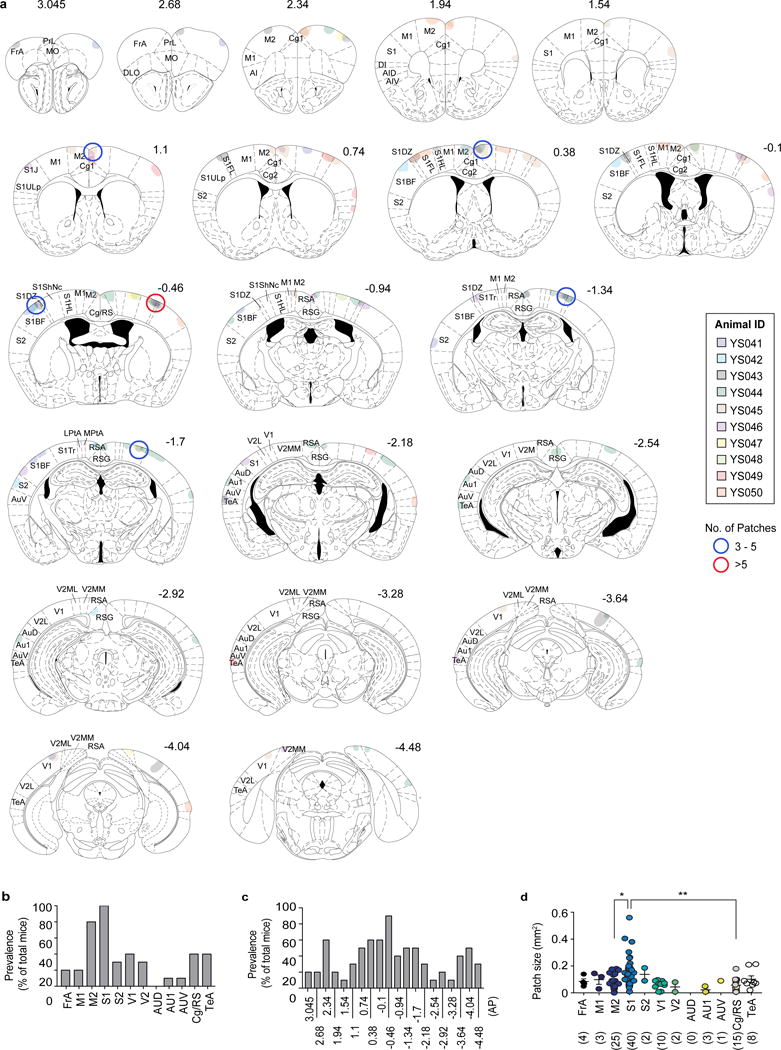
a, The locations of the cortical patches of 10 individual MIA animals were matched to their corresponding AP levels in the Paxinos brain atlas. Different colors represent the patches from different mice. The sub-regions, in which the cortical patches were observed in more than 3 or 5 animals, are circled in blue or red, respectively. The mouse brain in this figure has been reproduced with permission from Paxinos. b, Prevalence of cortical patches in different cortical sub-regions of the MIA offspring described in (a) (n=10-mice/2-independent experiments). c, Prevalence of cortical patches at different AP levels of the brain in the MIA offspring described in (a) (n=10-mice/2-independent experiments). Individual AP levels correspond to those in the schematic images of Extended Data Fig. 1. d, The size and frequencies of cortical patches found in different cortical sub-regions of the MIA offspring described in (a) (n=10-mice/2-independent experiments). PrL: Prelimbic, MO: Medial orbital, DLO: Dorsolateral orbital, DI: Dysgranular insular, FrA: Frontal association cortex, M1: Primary motor cortex, M2: Secondary motor cortex, S1: Primary somatosensory cortex, S2: Secondary somatosensory cortex, V1: Primary visual cortex, V2: Secondary visual cortex, AUD: Secondary auditory cortex, dorsal area, AU1: Primary auditory cortex, AUV: Secondary auditory cortex, ventral area, Cg/RS: Cingulate/Retrosplenial cortex, and TeA: Temporal association cortex. * p<0.05, ** p<0.01 as calculated by Kruskal-Wallis one-way ANOVA with Dunn post-hoc test (d). Graphs indicate mean ± s.e.m.
Extended Data Fig. 2. Distribution of cortical patches located within 0.38 ~ −1.34 AP in the brains of MIA offspring.
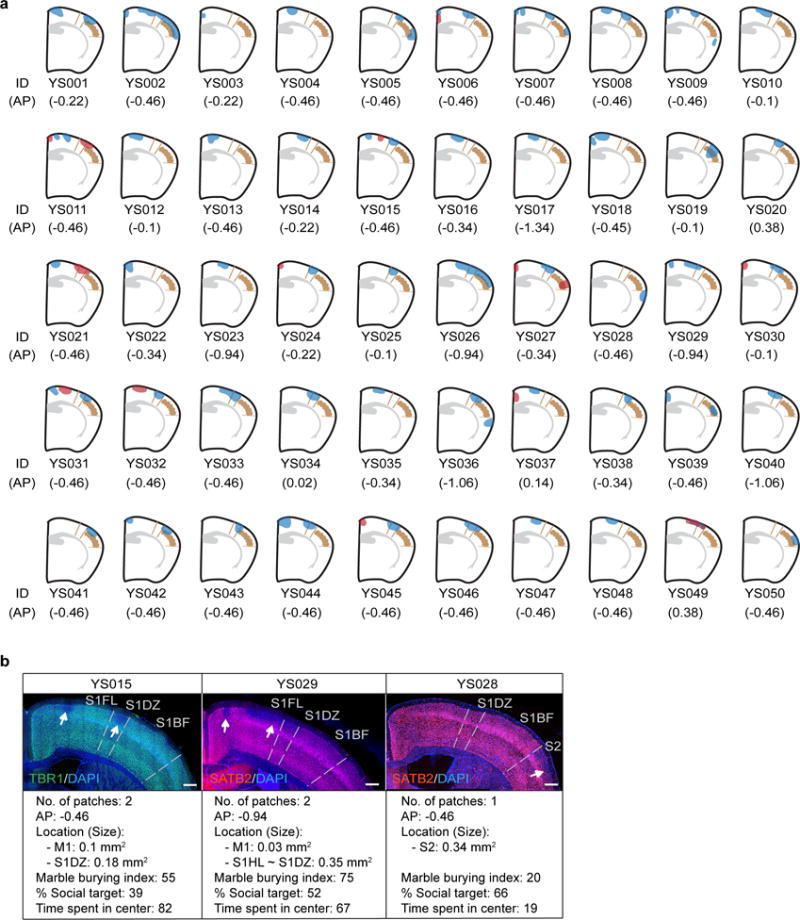
a, Schematics of the cortical patches located within 0.38~ −1.34 AP in the brains of MIA offspring plotted onto the atlas plane near ~ −0.5 AP. The size of the cortical patches in the schematic is scaled to reflect the actual size as accurately as possible. Blue indicates the cortical patches from one hemisphere and red from the other. The mouse brain in this figure has been reproduced with permission from Paxinos. b, Representative images of the cortical patches in the brains of MIA offspring (a) stained with TBR1 or SATB2 and counterstained with DAPI. The number, locations, and sizes of the cortical patches observed at a given AP level along with each animal’s behavioral performance on the marble burying (marble burying index), sociability (% Social target), and the time spent in the center (s) of an open field are indicated. White arrows indicate cortical patches. Scale bar represents 300μm.
Extended Data Fig. 3. MIA offspring display reduced inhibitory drive onto pyramidal neurons in S1 cortical patches.
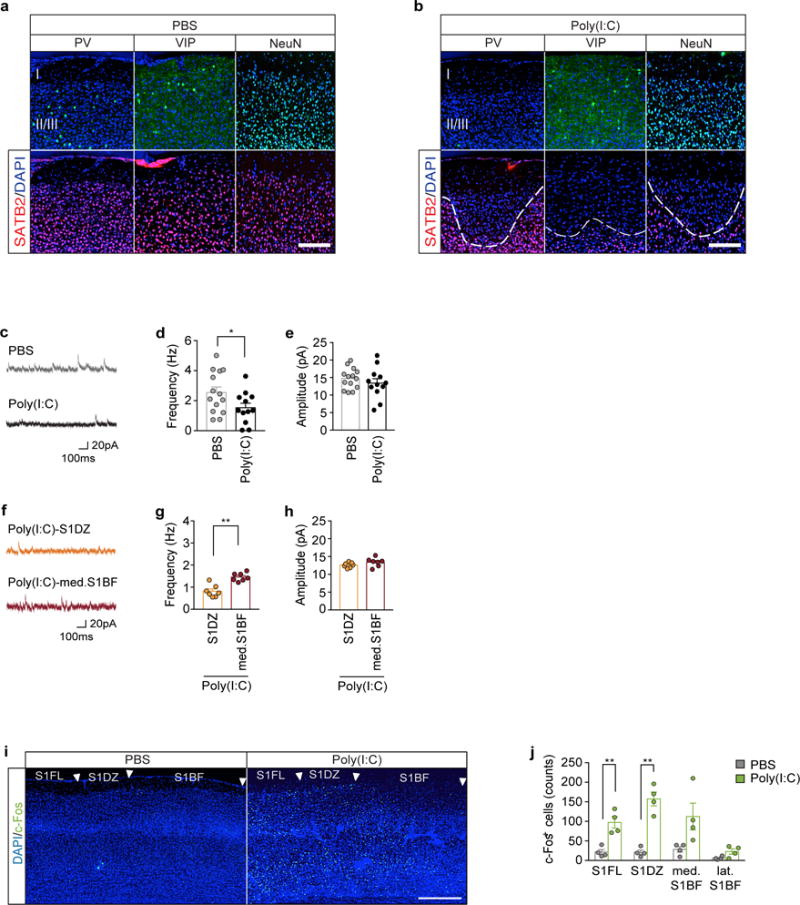
a, Images cropped in layer I, II, and III of S1 and stained for SATB2 (red) with PV, VIP, or NeuN (green) in offspring from PBS (a) or Poly(I:C) (b) injected dams. Brain slices are counterstained with DAPI (blue). White dotted lines indicate the boundary of cortical patches in MIA offspring. Scale bar represents 100μm. For images shown in Fig. 1d. c. Representative traces of mIPSCs from pyramidal neurons in S1DZ of PBS or MIA offspring. d–e, Average population data depicting the frequency (d) and amplitude (e) of pharmacologically isolated mIPSCs from S1DZ pyramidal neurons described in (c) (n=14-biological independent samples/6-mice/6-independent experiments and 12-biological independent samples/6-mice/6-independent experiments from PBS and MIA offspring, respectively). f, Representative traces of mIPSCs from pyramidal neuron in S1DZ or med. S1BF of MIA offspring. g–h, Average population data depicting the frequency (g) and amplitude (h) of pharmacologically isolated mIPSCs from S1 pyramidal neurons described in (f) (n=7-biological independent samples/3-mice/3-independent experiments and 7-biological independent samples/3-mice/3-independent experiments for S1DZ and med. S1BF from MIA offspring, respectively). i, Representative image of the S1, stained for DAPI (blue) and c-Fos (green) from adult offspring of PBS- or poly(I:C)-treated mother. Arrows indicate the boundaries of different subregions in the S1. Scale bar represents 300μm. S1FL: Primary somatosensory, forelimb, S1DZ: Primary somatosensory, dysgranular zone, S1BF: Primary somatosensory, barrel field. j, Quantification of c-Fos+ cells throughout the S1 (n=4 PBS and 4 Poly(I:C) mice/4-independent experiments). * p<0.05, **p<0.01 as calculated by two-tailed unpaired t-test (d,e,g,h,j). Graphs indicate mean ± s.e.m.
Extended Data Fig. 4. The development of MIA-associated behaviors depends on the time point at which MIA is induced.
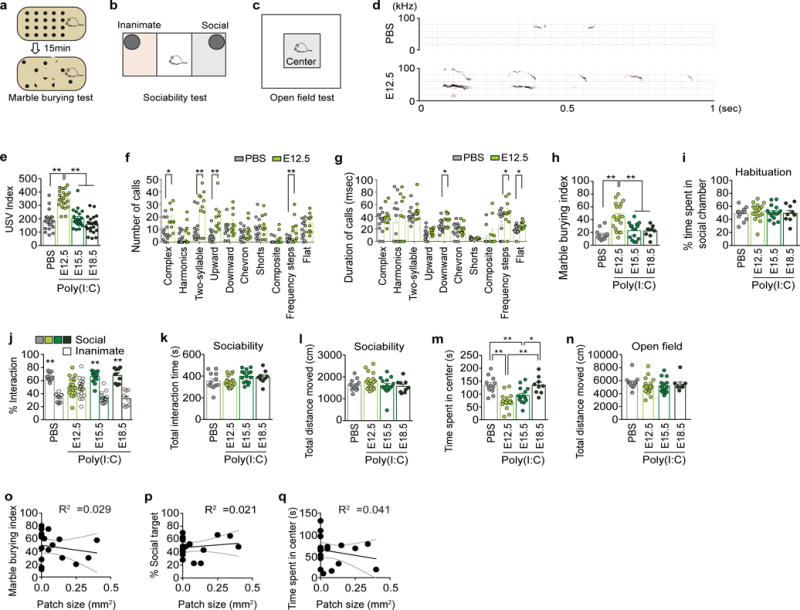
a–c, Schematics of the marble burying test (a), sociability test (b), and open field test (c). d. Representative spectrographs of the USVs for PBS and E12.5. e, The ultrasonic vocalization (USV) index represents the number of USVs made by the pups (n=20, 24, 21, and 22 mice for PBS, E12.5, E15.5, or E18.5 groups/5-independent experiments). f–g, The sonograms of USVs emitted by the pups are classified into ten distinct categories and analyzed for the number of calls made and the duration of the calls (msec) within the 1st minute of the recording (n=13 and 10 for pups from PBS- and Poly(I:C)-injected mothers, respectively, at E12.5/3-independent experiments). h–n, The marble burying index (the percentage of marbles buried during the 15-min marble burying test) (h), % time spent in social chamber during habituation period of the sociability test (i), % interaction during the sociability test (the percentage of time spent investigating the social or inanimate stimulus out of the total exploration time of both objects during the 10-min sociability test) (j), the total interaction time (the total exploration time of both objects during the 10-min sociability test) (k), the total distance moved during the sociability test (l), the time spent in the center of an open field (m), and the total distance moved during the open field test (n) of the adult offspring described in (e) (n= 12/19/15/9-mice, 7/7/7/5-independent experiments for PBS/E12.5/E15.5/E18.5 groups). o–q, The size of cortical patches found outside of S1 (within AP 0.38~−1.34mm) in offspring from dams injected with poly(I:C) at E12.5 is plotted against the severity of the featured MIA phenotypes on the marble burying test (o), sociability test as % social target (the percentage of time spent investigating the social stimulus out of the total exploration time of both objects) (p), and open field test (q). Black solid lines represent the regression line and gray dotted lines represent 95% confidence intervals (n=19-mice/7-independent experiments) for E12.5 group. * p<0.05, ** p<0.01 as calculated by two-tailed unpaired t-test (f,g), two-way ANOVA with Tukey post-hoc tests (j), one-way ANOVA with Tukey post-hoc tests (e,h,i,k,l,m,n), and Linear regression (o,p,q). Graphs indicate mean ± s.e.m.
Extended Data Fig. 5. IL-17Ra expression is required in the fetal brain to induce behavioral abnormalities upon MIA.
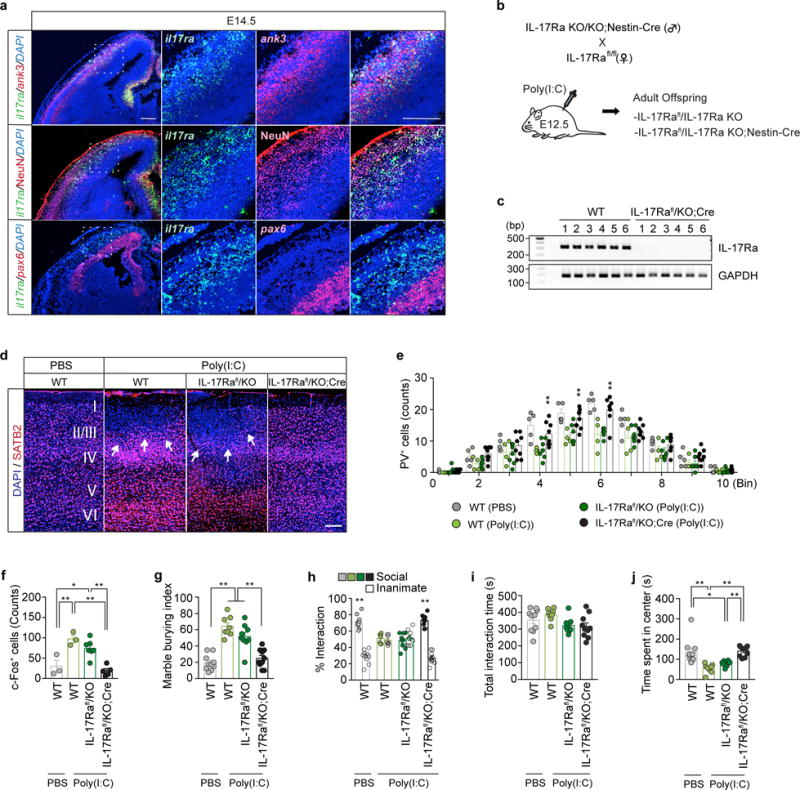
a, Representative images of the embryonic cortex at E14.5 stained for il17ra (green) and ank3, NeuN or pax6 (red) in offspring from poly(I:C)-injected dams. Brain slices were counterstained with DAPI (blue). Scale bar represents 200μm. (n=3-mice/2-independent experiments) b, Schematic showing the breeding scheme. Homozygous IL-17Ra KO animals carrying Nestin-Cre transgene were crossed to homozygous IL-17Ra conditional line (IL-17Rafl/fl). c, il17ra and gapdh mRNA expression levels in S1 of WT or IL-17Rafl/KO;Cre mice were measured using conventional RT-PCR. Image indicates mRNA expression levels found in individual animals (n=6-mice/2-independent experiments). d, Representative images of SATB2 (red) expression in S1 of offspring with indicated genotypes (WT, IL-17Rafl/KO, or IL-17Rafl/KO;Cre) from mothers injected with PBS or poly(I:C). Scale bar represents 100μm (n=5, 4, 7, and 8 mice from WT (PBS), WT (Poly(I:C)), IL-17Rafl/KO (Poly(I:C)), and IL-17Rafl/KO;Cre (Poly(I:C))/4-independent experiments). e, Quantification of PV positive cells in regions centered on S1 cortical patches around AP-0.46mm, divided into ten equal bins representing different depths of the cortex, of MIA offspring or in corresponding regions of PBS offspring with indicated genotypes (n=5, 4, 7, and 8 mice from WT (PBS), WT (Poly(I:C)), IL-17Rafl/KO (Poly(I:C)), and IL-17Rafl/KO;Cre (Poly(I:C))/4-independent experiments). f, Quantification of c-Fos+ cells in the S1 at around AP-0.46mm (n=3, 3, 7, and 5 mice, from WT (PBS), WT (Poly(I:C)), IL-17Rafl/KO (Poly(I:C)), and IL-17Rafl/KO;Cre (Poly(I:C))/4-independnt experiments). g–j, The marble burying index (g), the % interaction (h) and the total interaction time (i) during the sociability test, and the time spent in the center of an open field (j) of the adult offspring described in (b) (n= 10, 8, 9, and 10 mice for WT (PBS), WT (Poly(I:C)), IL-17Rafl/KO (Poly(I:C)), and IL-17Rafl/KO;Cre (Poly(I:C)) groups/5-independent experiments). * p<0.05, ** p<0.01 as calculated by two-way repeated measures ANOVA with Tukey post-hoc tests for statistical comparison between the WT (Poly(I:C)) and IL-17Rafl/KO;Cre (Poly(I:C)) (e), one-way ANOVA with Tukey post-hoc tests (f,g,i,j), and two-way ANOVA with Tukey post-hoc tests (h). Graphs indicate mean ± s.e.m.
Extended Data Fig. 6. Increasing neural activity in WT animals induces MIA behavioral phenotypes.
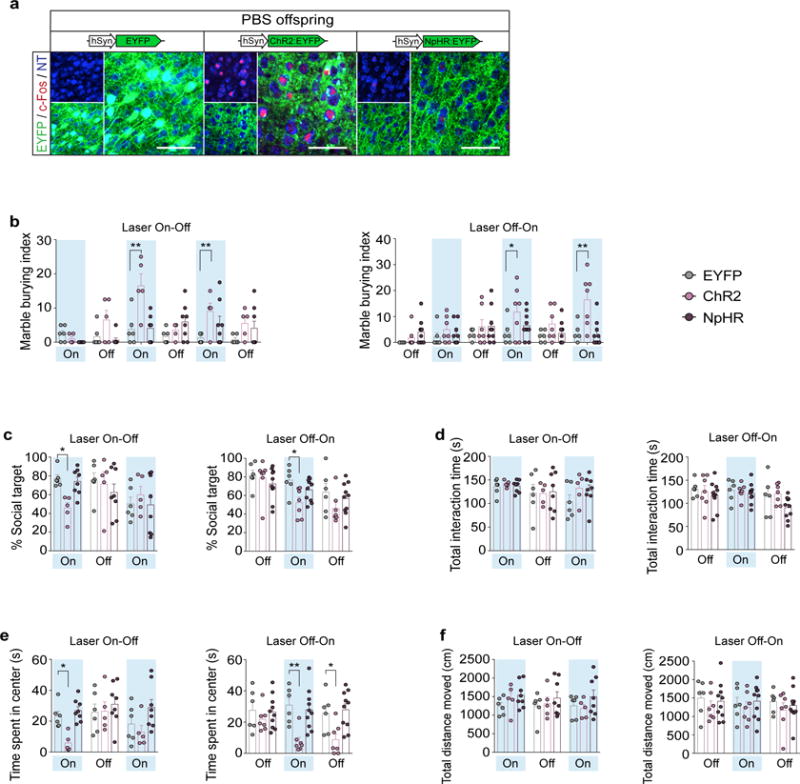
a, Representative images of c-Fos expression upon photostimulation of the S1DZ in WT offsprings from mothers injected with PBS at E12.5 (PBS offspring). In these animals, AAV2-EF1α-DIO-EYFP, ChR2-EYFP, or NpHR-EYFP viruses were targeted to the S1DZ. Coronal sections of the brains were stained for c-Fos (red) and EYFP (green), and counterstained with neurotrace (NT, blue). Scale bar represents 100um. b–f, The marble burying index (the percentage of marbles buried during the 18-min marble burying test) (b), the % social target (the percentage of time spent investigating the social stimulus out of the total exploration time of both objects) (c), the total interaction time during the sociability test (d), the time spent in the center of an open field (e), and the total distance moved during the open field test (f) are plotted as averages from each individual 3-min sessions. Light blue indicates the laser ‘On’ sessions (‘Laser On-Off’: n=6, 5, and 8 mice/4-independent experiments; ‘Laser Off-On’: n=6, 7, and 10 mice/4-independent experiments from the AAV2-hSyn-EYFP, ChR2-EYFP, or NpHR-EYFP injected PBS offspring). * p<0.05, ** p<0.01 as calculated by two-way repeated measures ANOVA with Tukey post-hoc tests. Graphs indicate mean ± s.e.m.
Extended Data Fig. 7. Increasing neural activity in vGluT2-positive neurons or decreasing neural activity in PV-positive neurons of WT animals creates MIA behavioral phenotypes.
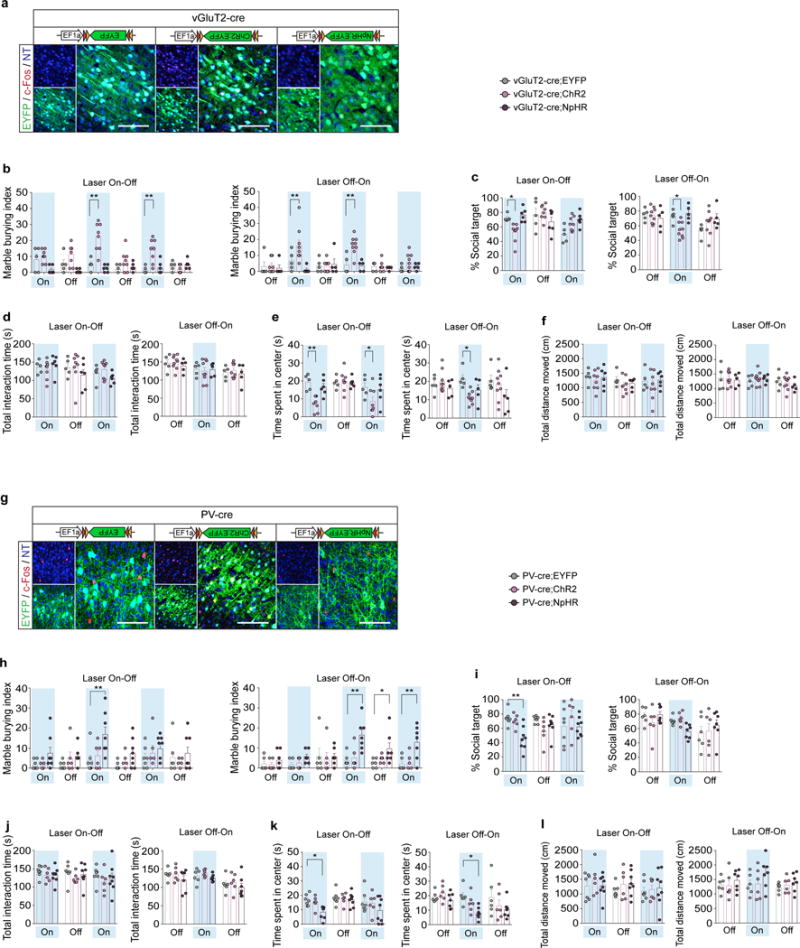
a,g, Representative images of c-Fos expression upon photostimulation of the S1DZ in vGluT2-Cre (a) or PV-Cre (g) animals injected with AAV2-EF1α-DIO-EYFP, ChR2-EYFP, or NpHR-EYFP viruses. Coronal sections of the brains were stained for c-Fos (red) and EYFP (green), and counterstained with neurotrace (NT, blue). Scale bar represents 100um. b–l, The marble burying index, the % social target, the total interaction time during the sociability test, the time spent in the center of an open field, and the total distance moved during the open field test with vGluT2-cre (b–f) and PV-cre (h–l) animals are plotted as averages from each individual 3-min sessions. Light blue indicates the laser ‘On’ sessions (‘Laser On-Off’: n=5, 8, and 6 mice, 4-independent experiments; ‘Laser Off-On’: n=5, 9, and 5 mice, 5-independent experiments for vGluT2-Cre animals injected with AAV2-EF1α-DIO-EYFP, ChR2-EYFP, or NpHR-EYFP; ‘Laser On-Off’: n=7, 6, and 8 mice, 6-independent experiments; ‘Laser Off-On’: n=6, 6, and 7 mice, 5-independent experiments for PV-Cre animals injected with AAV2-EF1α-DIO-EYFP, ChR2-EYFP, or NpHR-EYFP). * p<0.05, ** p<0.01 as calculated by two-way repeated measures ANOVA with Tukey post-hoc tests. Graphs indicate mean ± s.e.m.
Extended Data Fig. 8. The ability to create MIA behavioral phenotypes by increasing neural activity in WT animals is specific with respect to the AP level and the sub-region of the primary somatosensory cortex.
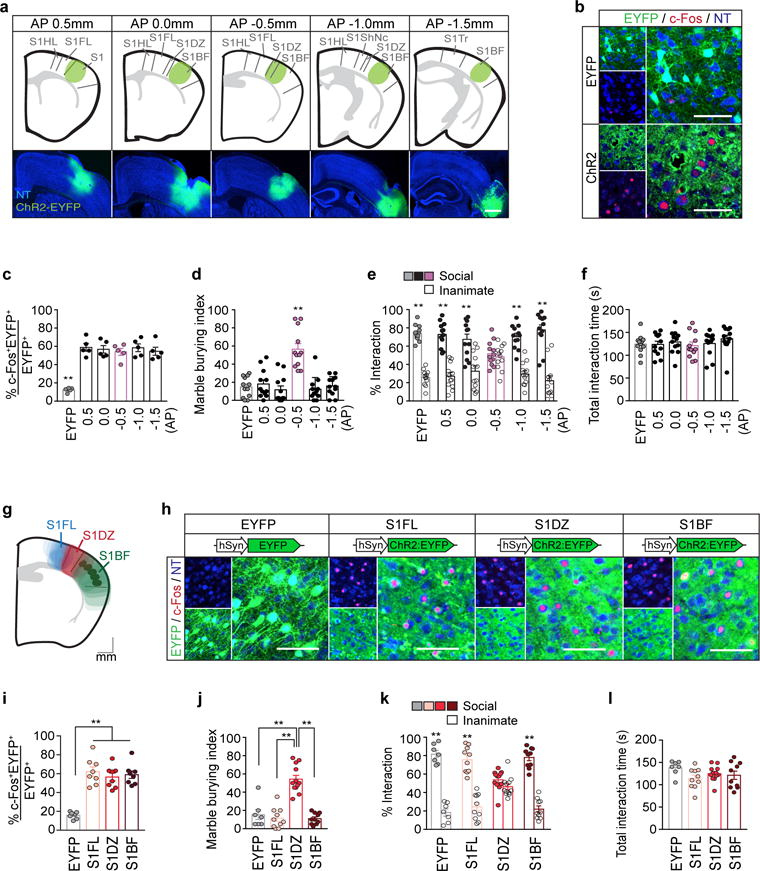
a, Schematics (top) and representative images (bottom) of the five sites in the S1 of WT animals injected with either AAV2-hSyn-EYFP or AAV2-hSyn-ChR2-EYFP virus (green) (AP= +0.5, +0.0, −0.5, −1.0, or −1.5mm). The mouse brain in this figure has been reproduced with permission from Paxinos. Scale bar represents 300μm. b, Representative images of c-Fos expression upon photostimulation of the injection sites in animals as prepared in (a). Coronal sections of the brains were stained for c-Fos (red) and EYFP (green), and counterstained with neurotrace (NT, blue). Scale bar represents 100μm. c, The percentage of EYFP+ neurons expressing c-Fos upon photostimulation of the injection site (n=5 for WT animals injected with AAV2-hSyn-EYFP at AP=−0.5mm and n=5, 5, 5, 5, and 5 for animals injected with AAV2-hSyn-ChR2-EYFP at AP=0.5, 0.0, −0.5, −1.0, or −1.5mm, 3-independent experiments, respectively). d–f, The marble burying index (d), the % interaction (during the 1st laser-on session) of the sociability test (e), and the total interaction time (during the 1st laser-on session) of the sociability test (f) for animals prepared as in (a) (n=12 for WT animals injected with AAV2-hSyn-EYFP at AP=−0.5mm and n=12, 12, 12, 12, and 12 for those injected with AAV2-hSyn-ChR2-EYFP at AP=0.5, 0.0, −0.5, −1.0, or −1.5mm, 6-independent experiments, respectively). g, A schematic showing the superimposed virus injection sites from individual WT animals, in which AAV2-hSyn-ChR2-EYFP was delivered into the S1FL (blue), S1DZ (red), or S1BF (green). The mouse brain in this figure has been reproduced with permission from Paxinos. h, Representative images of c-Fos expression upon photostimulation of the injection sites shown in (g). Coronal sections of the brains were stained for c-Fos (red) and EYFP (green), and counterstained with neurotrace (NT, blue). Scale bar represents 100μm. i, The percentage of EYFP+ neurons co-expressing c-Fos upon photostimulation of the injection site (n=7 mice for EYFP and 8 mice for S1FL, S1DZ, and S1BF; 3-independent experiments). j–l, The marble burying index (j), the % interaction (during the 1st laser-on session) of the sociability test (k), and the total interaction time (during the 1st laser-on session) of the sociability test (l) for animals prepared as in (g) (n=7 for WT animals injected with AAV2-hSyn-EYFP into S1DZ and n=10, 12, and 10 for WT animals injected with AAV2-hSyn-ChR2-EYFP into S1FL, S1DZ, or S1BF; 3-independent experiments). S1HL: Primary somatosensory, hindlimb, S1FL: Primary somatosensory, forelimb, S1: Primary somatosensory cortex, S1DZ: Primary somatosensory, dysgranular zone, S1BF: Primary somatosensory, barrel field, S1ShNc: Primary somatosensory, shoulder and neck, S1Tr: Primary somatosensory, trunk. * p<0.05, ** p<0.01 as calculated by two-way ANOVA with Tukey post-hoc tests (e,k) and one-way ANOVA with Tukey post-hoc tests (c,d,f,i,j,l). Graphs indicate mean ± s.e.m.
Extended Data Fig. 9. Unilateral increase in neural activity of the S1DZ region creates MIA behaviors in WT animals.
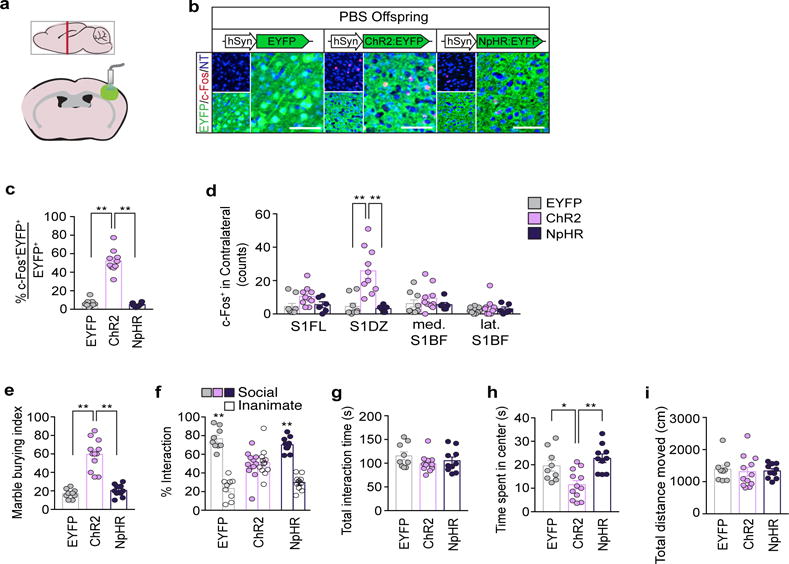
a, Schematic showing the unilateral virus injection and optic-fiber implantation in the S1DZ of WT animals injected with AAV2-hSyn-EFYP, ChR2-EYFP, or NpHR-EFYP. The mouse brain in this figure has been reproduced with permission from Paxinos. b, Representative images of c-Fos expression upon photostimulation of the injection sites shown in (a). Coronal sections of the brains were stained for c-Fos (red) and EYFP (green), and counterstained with DAPI (blue). Scale bar represents 100μm. c, The percentage of EYFP+ neurons co-expressing c-Fos upon photostimulation of the injection site (n=9, 10, and 6 mice for WT animals injected with AAV2-hSyn-EYFP, ChR2-EYFP, or NpHR-EYFP into S1DZ; 3-independent experiments). d, The number of c-Fos+ cells in the contralateral hemisphere of the injection site for the animals described in (c). e–h, The marble burying index (e), the % interaction (during the 1st laser-on session) of the sociability test (f), the total interaction time (during the 1st laser-on session) of the sociability test (g), the time spent in the center of an open field (during the 1st laser-on session) (h), and the total distance moved during the open field test (during the 1st laser-on session) (i) of animals prepared as in (a) (n=9, 12, and 10 for WT animals injected with AAV2-hSyn-EYFP, ChR2-EYFP, or NpHR-EYFP into S1DZ; 3-independent experiments). * p<0.05, ** p<0.01 as calculated by two-way ANOVA with Tukey post-hoc tests (f) and one-way ANOVA with Tukey post-hoc tests (c,d,e,g,h,i). Graphs indicate mean ± s.e.m.
Extended Data Fig. 10. Reducing neural activity in the cortical region centered on the S1DZ corrects the behavioral abnormalities of MIA offspring.
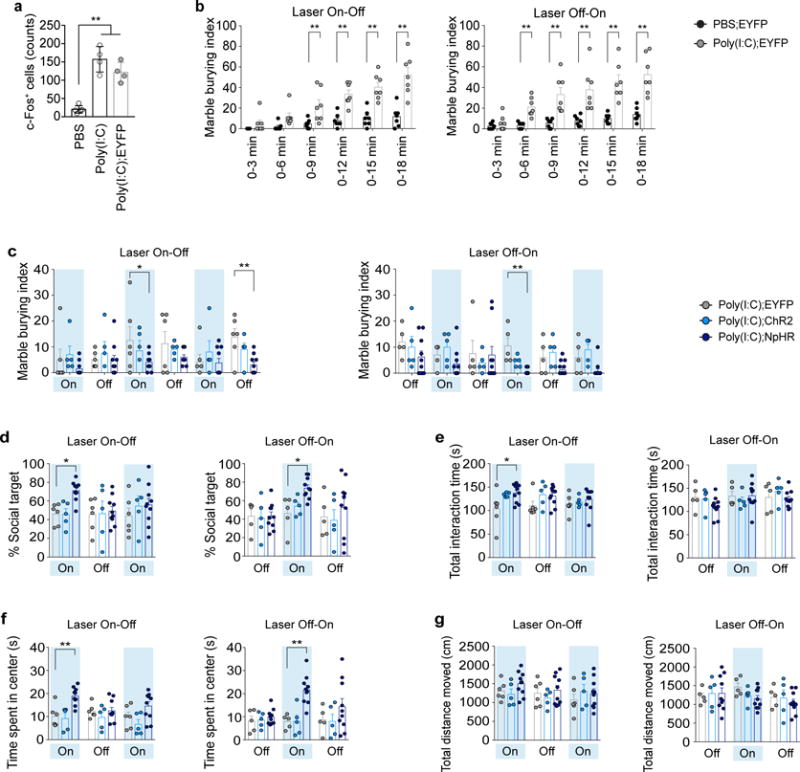
a, Quantification of c-Fos+ cells in the S1DZ of adult offspring from mothers injected with PBS or Poly(I:C), and of adult Poly(I:C) offspring, in which AAV2-hSyn-EYFP was injected into the S1DZ (n=5, 4, and 4 mice for PBS, Poly(I:C), and Poly(I:C);EYFP groups, respectively; 3-independent experiments). b, AAV2-hSyn-EYFP was targeted into the S1DZ of adult offspring from either PBS or Poly(I:C) treated mothers. The accumulation of marble burying index over their behavioral session is plotted based on the laser schemes (‘Laser On-Off’: n=7 and 7; ‘Laser Off-On’: n=7 and7 for AAV2-hSyn-EYFP injected PBS and Poly(I:C) offspring; 3-independent experiments, respectively). c–g, AAV2-hSyn-EYFP, ChR2-EYFP, or NpHR-EYFP viruses were targeted to the S1DZ of MIA offspring (poly(I:C)). The marble burying index (c), the % social target (d) and the total interaction time (e) of the sociability test, the time spent in the center of an open field (f), and the total distance moved during the open field test (g) are plotted as averages from each individual 3-min sessions. Light blue indicates the laser ‘On’ sessions (‘Laser On-Off’: n=6, 5, and 10; ‘Laser Off-On’: n=5, 5, and10 for AAV2-hSyn-EYFP, ChR2-EYFP, or NpHR-EYFP injected MIA offspring; 5-independent experiments). * p<0.05, ** p<0.01 as calculated by one-way ANOVA with Tukey post-hoc tests (a) and two-way repeated measures ANOVA with Tukey post-hoc tests (b,c,d,e,f,g). Graphs indicate mean ± s.e.m.
Extended Data Fig. 11. The S1FL, S1DZ, and S1BF exhibit distinct efferent targets.
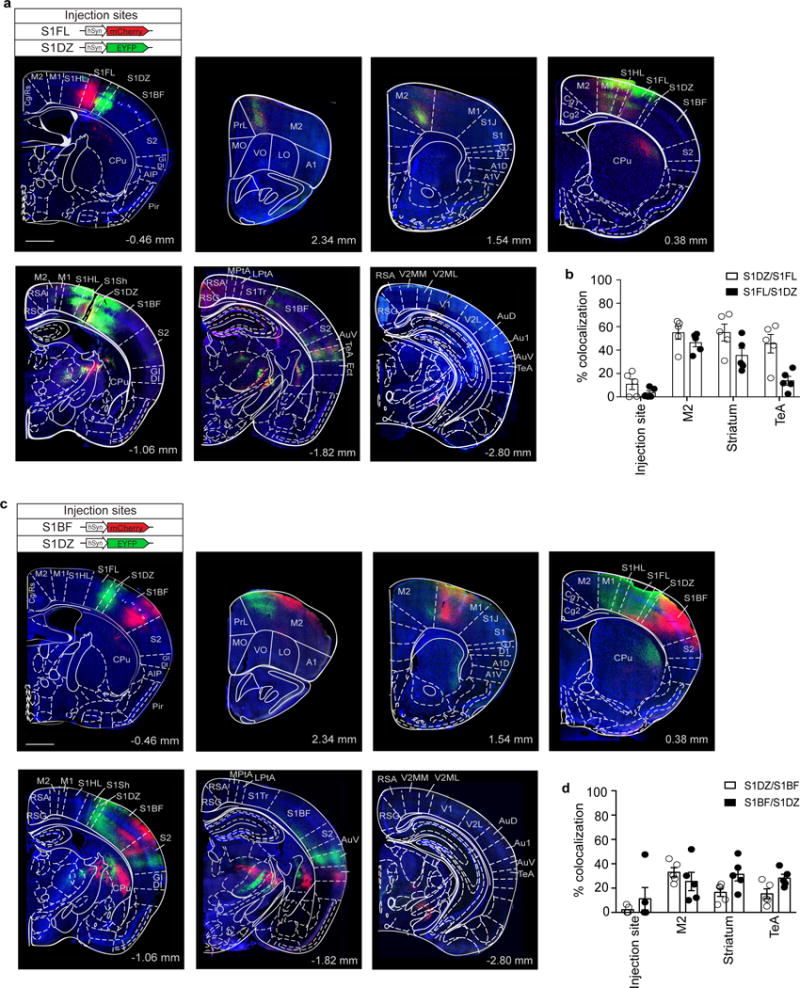
a,c, AAV2-hSyn-mCherry and AAV2-hSyn-EYFP were injected into the S1FL and S1DZ (a) or S1BF and S1DZ (c), respectively. The two cortical regions project to distinct sub-regions of the M2, the striatum, and the associative cortices. Representative images are aligned to their corresponding AP levels in the Paxinos brain atlas (n=5). Scale bar represents 1mm. b,d, Quantification of percentage of co-localized projection fibers, represented as % co-localization, from S1FL with those from S1DZ within the regions of interest (ROI; n= 5) (b) and from S1BF with those from S1DZ within the regions of interest (ROI;n=5) (d). S1DZ/S1FL (S1DZ/S1BF) reflects the percentage S1FL (S1BF) projection fibers within the ROI co-localized with those from S1DZ, while S1FL/S1DZ (S1BF/S1DZ) reflects vice versa. The mouse brain in this figure has been reproduced with permission from Paxinos. Graph indicates mean ± s.e.m.
Extended Data Fig. 12. Distinct populations of S1DZ neurons projecting to TeA or Striatum selectively modulate marble burying and sociability phenotypes.
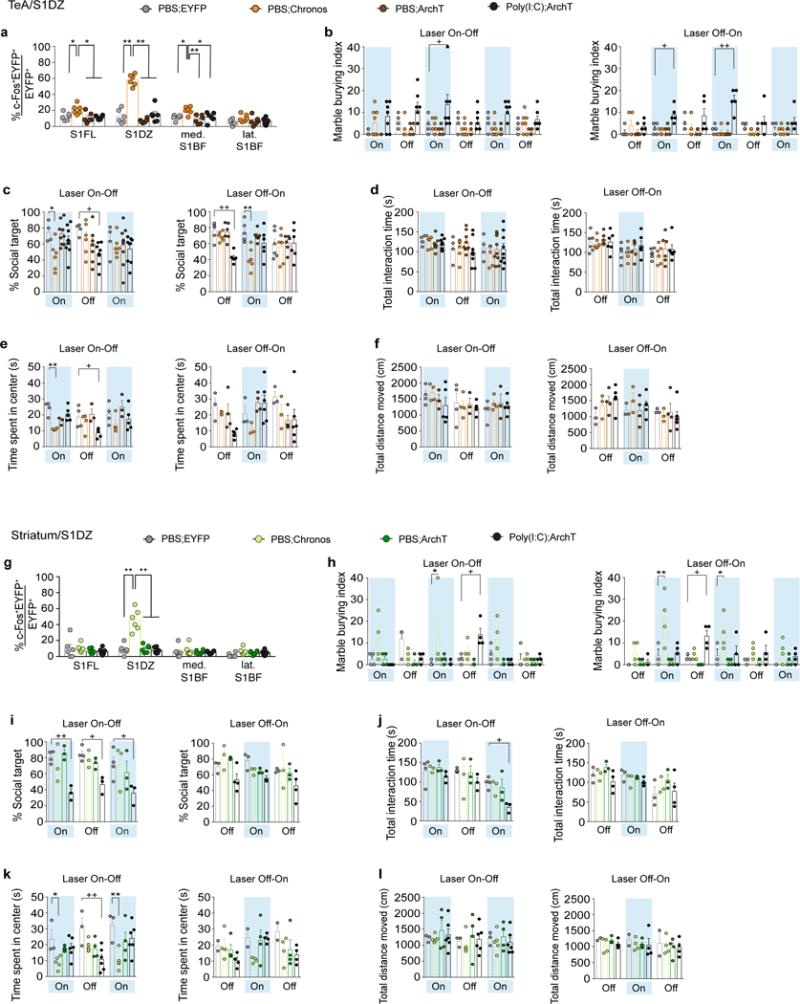
a, Percentage of EYFP/c-Fos co-expressing neurons upon stimulation of animals described in Fig. 5c (n=6/6/6/6-mice, 3-independent experiments (PBS;RV-EYFP/Chronos/ArchT, MIA;RV-ArchT)). b–f, Performance on the marble burying test (b) (‘Laser On-Off’: n=4/8/5/7-mice for PBS;EYFP/PBS;Chronos/PBS;ArchT/MIA;ArchT, 4/7/5/7-independent experiments and ‘Laser Off-On’: n=5/5/5/5-mice for PBS;EYFP/PBS;Chronos/PBS;ArchT/MIA;ArchT, 5/5/5/5-independent experiments), the % social target (c) and the total interaction time during the sociability test (d) (‘Laser On-Off’: n=4/6/9/9-mice for PBS;EYFP/PBS;Chronos/PBS;ArchT/MIA;ArchT, 4/5/7/7-independent experiments and ‘Laser Off-On’: n=6/6/6/6-mice for PBS;EYFP/PBS;Chronos/PBS;ArchT/MIA;ArchT, 5/5/5/5-independent experiments), and the time spent in center (e) and the total distance moved during the open field test (f) (‘Laser On-Off’: n=4/4/3/5-mice for PBS;EYFP/PBS;Chronos/PBS;ArchT/MIA;ArchT, 4/4/3/5-independent experiments and ‘Laser Off-On’: n=3/3/4/6-mice for PBS;EYFP/PBS;Chronos/PBS;ArchT/MIA;ArchT, 3/3/4/5-independent experiments). g, Percentage of EYFP/c-Fos co-expressing neurons upon stimulation of animals described in Fig. 5i (n=6/6/6/6-mice, 3-independent experiments (PBS;RV-EYFP/Chronos/ArchT, MIA;RV-ArchT)). h–l, Performance on the marble burying test (h) (‘Laser On-Off’: n=4/4/4/4-mice for PBS;EYFP/PBS;Chronos/PBS;ArchT/MIA;ArchT, 4-independent experiments and ‘Laser Off-On’: n=3/4/4/4-mice for PBS;EYFP/PBS;Chronos/PBS;ArchT/MIA;ArchT, 3-independent experiments), the % social target (i) and the total interaction time during the sociability test (j) (‘Laser On-Off’: n=4/3/3/3-mice for PBS;EYFP/PBS;Chronos/PBS;ArchT/MIA;ArchT, 3-independent experiments and ‘Laser Off-On’: n=3/3/3/4-mice for PBS;EYFP/PBS;Chronos/PBS;ArchT/MIA;ArchT, 3-independent experiments), and the time spent in center (k) and the total distance moved during the open field test (l) (‘Laser On-Off’: n=3/5/4/6-mice for PBS;EYFP/PBS;Chronos/PBS;ArchT/MIA;ArchT, 3/5/4/5-independent experiments and ‘Laser Off-On’: n=2/4/4/4-mice for PBS;EYFP/PBS;Chronos/PBS;ArchT/MIA;ArchT, 2/4/4/4-independent experiments).
Supplementary Material
Acknowledgments
We thank Jeong Tae Kwon, Michael D. Reed, Daniel Cho, and Shivani Bigler for assistance with experiments and thank Dr. Barbara Noro and Dr. Charles Jennings for critical reading of the manuscript. This work was supported by the Simons Foundation Autism Research Initiative (J.R.H. and D.R.L.), Simons Foundation to the Simons Center for the Social Brain at MIT (Y.S.Y., J.R.H. and G.B.C.), Robert Buxton (G.B.C.), Hock E. Tan and K. Lisa Yang Center for Autism Research (G.B.C), the DFG grants CRC/TRR 128 project A07 and WA1600/8-1 (A.W.), the Howard Hughes Medical Institute (D.R.L.), the National Research Foundation of Korea grants MEST-35B-2011-E00012 (S.K.) and NRF-2014R1A1A1006089 (H.K.), the Searle Scholars Program (J.R.H.), the Pew Scholar for Biomedical Sciences (J.R.H.), the Kenneth Rainin Foundation (J.R.H) and the National Institutes of Health grants R01DK106351 and R01DK110559 (J.R.H.).
Footnotes
Supplementary Information is available in the online version of the paper.
Author Contributions Y.S.Y., I.W., M.H., D.R.L., J.R.H., and G.B.C. designed the experiments and/or provided advice and technical expertise. Y.S.Y., A.P., J.B., M.L., L.P., N.S., J.K, S.K., and H.K. performed the experiments. Y.S.Y., J.R.H., and G.B.C. wrote the manuscript with inputs from the co-authors.
The authors declare no competing financial interests.
References
- 1.Atladóttir HO, et al. Maternal infection requiring hospitalization during pregnancy and autism spectrum disorders. J Autism Dev Disord. 2010;40:1423–1430. doi: 10.1007/s10803-010-1006-y. [DOI] [PubMed] [Google Scholar]
- 2.Patterson PH. Immune involvement in schizophrenia and autism:etiology, pathology and animal models. Behav Brain Res. 2009;7:313–321. doi: 10.1016/j.bbr.2008.12.016. [DOI] [PubMed] [Google Scholar]
- 3.Brown AS, et al. Elevated maternal C-reactive protein and autism in a national birth cohort. Mol Psychiatry. 2014;19:259–264. doi: 10.1038/mp.2012.197. [DOI] [PMC free article] [PubMed] [Google Scholar]
- 4.Atladóttir HO, et al. Association of family history of autoimmune diseases and autism spectrum disorders. Pediatrics. 2009;124:687–694. doi: 10.1542/peds.2008-2445. [DOI] [PubMed] [Google Scholar]
- 5.Ashwood P, Wills S, Van de Water J. The immune response in autism: a new frontier for autism research. J Lekoc Biol. 2006;80:1–15. doi: 10.1189/jlb.1205707. [DOI] [PubMed] [Google Scholar]
- 6.Lee BK, et al. Maternal hospitalization with infection during pregnancy and risk of autism spectrum disorders. Brain Behav Immun. 2015;44:199–105. doi: 10.1016/j.bbi.2014.09.001. [DOI] [PMC free article] [PubMed] [Google Scholar]
- 7.Smith SE, Li J, Garbett K, Mirnics K, Patterson PH. Maternal immune activation alters fetal brain development through interleukin-6. J Neurosci. 2007;27:10695–10702. doi: 10.1523/JNEUROSCI.2178-07.2007. [DOI] [PMC free article] [PubMed] [Google Scholar]
- 8.Meyer U, Feldon J. Neural basis of psychosis-related behaviour in the infection model of schizophrenia. Behav Brain Res. 2009;204:322–334. doi: 10.1016/j.bbr.2008.12.022. [DOI] [PubMed] [Google Scholar]
- 9.Shi L, Fatemi SH, Sidwell RW, Patterson PH. Maternal influenza infection causes marked behavioral and pharmacological changes in the offspring. J Neurosci. 2003;23:297–302. doi: 10.1523/JNEUROSCI.23-01-00297.2003. [DOI] [PMC free article] [PubMed] [Google Scholar]
- 10.Malkova NV, Yu CZ, Hsiao EY, Moore MJ, Patterson PH. Maternal immune activation yields offspring displaying mouse versions of the three core symptoms of autism. Brain Behav Immun. 2012;26:607–616. doi: 10.1016/j.bbi.2012.01.011. [DOI] [PMC free article] [PubMed] [Google Scholar]
- 11.Choi GB, et al. The maternal interleukin-17a pathway in mice promotes autism-like phenotypes in offspring. Science. 2016;351:933–939. doi: 10.1126/science.aad0314. [DOI] [PMC free article] [PubMed] [Google Scholar]
- 12.Paxinos G, Franklin K. The mouse brain in stereotaxic coordinates. 2004 [Google Scholar]
- 13.Lee T, Kim U. Descending projections from the dysgranular zone of rat primary somatosensory cortex processing deep somatic input. J Comp Neurol. 2012;520:1021–1046. doi: 10.1002/cne.22767. [DOI] [PubMed] [Google Scholar]
- 14.Welker W, Sanderson KJ, Shambes GM. Patterns of afferent projections to transitional zones in the somatic sensorimotor cerebral cortex of albino rats. Brain Res. 1984;292:261–267. doi: 10.1016/0006-8993(84)90762-5. [DOI] [PubMed] [Google Scholar]
- 15.Chapin JK, Lin CS. Mapping the body representation in the SI cortex of anesthetized and awake rats. J Comp Neurol. 1984;229:199–213. doi: 10.1002/cne.902290206. [DOI] [PubMed] [Google Scholar]
- 16.Gogolla N, et al. Common circuit defect of excitatory-inhibitory balance in mouse models of autism. J Neurodev Disord. 2009;1:172–181. doi: 10.1007/s11689-009-9023-x. [DOI] [PMC free article] [PubMed] [Google Scholar]
- 17.Orefice LL, et al. Peripheral Mechanosensory Neuron Dysfunction Underlies Tactile and Behavioral Deficits in Mouse Models of ASDs. Cell. 2016;166:299–313. doi: 10.1016/j.cell.2016.05.033. [DOI] [PMC free article] [PubMed] [Google Scholar]
- 18.Selby L, Z C, Sun QQ. Major defects in neocortical GABAergic inhibitory circuits in mice lacking the fragile X mental retardation protein. Neurosci Lett. 2007;412:227–232. doi: 10.1016/j.neulet.2006.11.062. [DOI] [PMC free article] [PubMed] [Google Scholar]
- 19.Kepecs A, Fishell G. Interneuron cell types are fit to function. Nature. 2014;605:318–326. doi: 10.1038/nature12983. [DOI] [PMC free article] [PubMed] [Google Scholar]
- 20.Mullen RJ, Buck CR, Smith AM. NeuN, a neuronal specific nuclear protein in vertebrates. Development. 1992;116:201–211. doi: 10.1242/dev.116.1.201. [DOI] [PubMed] [Google Scholar]
- 21.Haubst N, et al. Molecular dissection of Pax6 function: the specific roles of the paired domain and homeodomain in brain development. Development. 2004;131:6131–6140. doi: 10.1242/dev.01524. [DOI] [PubMed] [Google Scholar]
- 22.Paez-Gonzalez P, et al. Ank3-dependent SVZ niche assembly is required for the continued production of new neurons. Neuron. 2011;71:61–75. doi: 10.1016/j.neuron.2011.05.029. [DOI] [PMC free article] [PubMed] [Google Scholar]
- 23.Giusti SA, et al. Behavioral phenotyping of Nestin-Cre mice: implications for genetic mouse models of psychiatric disorders. J Psychiatr Res. 2014;55:87–95. doi: 10.1016/j.jpsychires.2014.04.002. [DOI] [PubMed] [Google Scholar]
- 24.Rubenstein JL, Merzenich MM. Model of autism: increased ratio of excitation/inhibition in key neural systems. Genes Brain Behav. 2003;2:255–267. doi: 10.1034/j.1601-183x.2003.00037.x. [DOI] [PMC free article] [PubMed] [Google Scholar]
- 25.Chao HT, et al. Dysfunction in GABA signalling mediates autism-like stereotypies and Rett syndrome phenotypes. Nature. 2010;468 doi: 10.1038/nature09582. [DOI] [PMC free article] [PubMed] [Google Scholar]
- 26.Han S, Tai C, Jones CJ, Scheuer T, Catterall WA. Enhancement of inhibitory neurotransmission by GABAA receptors having α2,3-subunits ameliorates behavioral deficits in a mouse model of autism. Neuron. 2014;81:1282–1289. doi: 10.1016/j.neuron.2014.01.016. [DOI] [PMC free article] [PubMed] [Google Scholar]
- 27.Peñagarikano O, et al. Absence of CNTNAP2 leads to epilepsy, neuronal migration abnormalities, and core autism-related deficits. Cell. 2011;147:235–246. doi: 10.1016/j.cell.2011.08.040. [DOI] [PMC free article] [PubMed] [Google Scholar]
- 28.Nelson SB, Vallakh V. Excitatory/Inhibitory Balance and Circuit Homeostasis in Autism Spectrum Disorders. Neuron. 2015;87:684–698. doi: 10.1016/j.neuron.2015.07.033. [DOI] [PMC free article] [PubMed] [Google Scholar]
- 29.Wöhr M, et al. Lack of parvalbumin in mice leads to behavioral deficits relevant to all human autism core symptoms and related neural morphofunctional abnormalities. Transl Psychiatry. 2015;10:e525. doi: 10.1038/tp.2015.19. [DOI] [PMC free article] [PubMed] [Google Scholar]
- 30.Canetta S, et al. Maternal immune activation leads to selective functional deficits in offspring parvalbumin interneurons. Mol Psychiatry. 2016;21:956–968. doi: 10.1038/mp.2015.222. [DOI] [PMC free article] [PubMed] [Google Scholar]
- 31.Blundell J, et al. Neuroligin-1 deletion results in impaired spatial memory and increased repetitive behavior. J Neurosci. 2010;30:2115–2129. doi: 10.1523/JNEUROSCI.4517-09.2010. [DOI] [PMC free article] [PubMed] [Google Scholar]
- 32.Tabuchi K, et al. A neuroligin-3 mutation implicated in autism increases inhibitory synaptic transmission in mice. Science. 2007;318:71–76. doi: 10.1126/science.1146221. [DOI] [PMC free article] [PubMed] [Google Scholar]
- 33.Etherton MR, Blaiss CA, Powell CM, Südhof TC. Mouse neurexin-1alpha deletion causes correlated electrophysiological and behavioral changes consistent with cognitive impairments. Proc Natl Acad Sci U S A. 2009;106:17998–18003. doi: 10.1073/pnas.0910297106. [DOI] [PMC free article] [PubMed] [Google Scholar]
- 34.Zhang F, Wang LP, Boyden ES, Deisseroth K. Chrannelrhodopsin-2 and optical control of excitable cells. Nat Methods. 2006;3:785–792. doi: 10.1038/nmeth936. [DOI] [PubMed] [Google Scholar]
- 35.Zhang F, et al. Multimodal fast optical interrogation of neural circuitry. Nature. 2007;446:633–639. doi: 10.1038/nature05744. [DOI] [PubMed] [Google Scholar]
- 36.Vong L, et al. Leptin action on GABAergic neurons prevents obesity and reduces inhibitory tone to POMC neurons. Neuron. 2011;71:142–154. doi: 10.1016/j.neuron.2011.05.028. [DOI] [PMC free article] [PubMed] [Google Scholar]
- 37.Hippenmeyer S, et al. A developmental switch in the response of DRG neurons to ETS transcription factor signaling. PLoS Biol. 2005;3:e159. doi: 10.1371/journal.pbio.0030159. [DOI] [PMC free article] [PubMed] [Google Scholar]
- 38.Wickersham IR, Finke S, Conzelmann K, Callaway EM. Retrograde neuronal tracing with a deletion-mutant rabies virus. Nat Methods. 2007;4:47–49. doi: 10.1038/NMETH999. [DOI] [PMC free article] [PubMed] [Google Scholar]
- 39.Klapoetke NC, et al. Independent optical excitation of distinct neural populations. Nat Methods. 2014;11:338–346. doi: 10.1038/nmeth.2836. [DOI] [PMC free article] [PubMed] [Google Scholar]
- 40.Chow BY, et al. High-performance genetically targetable optical neural silencing by light-driven proton pumps. Nature. 2010;463:98–102. doi: 10.1038/nature08652. [DOI] [PMC free article] [PubMed] [Google Scholar]
- 41.Stoner R, et al. Patches of disorganization in the neocortex of children with autism. N Engl J Med. 2014;27:1209–1219. doi: 10.1056/NEJMoa1307491. [DOI] [PMC free article] [PubMed] [Google Scholar]
- 42.El Malki K, et al. An alternative pathway of imiquimod-induced psoriasis-like skin inflammation in the absence of interleukin-17 receptor a signaling. J Invest Dermatol. 2013;133:441–451. doi: 10.1038/jid.2012.318. [DOI] [PubMed] [Google Scholar]
- 43.Scattoni ML, Gandhy SU, Ricceri L, Crawley JN. Unusual repertoire of vocalizations in the BTBR T+tf/J mouse model of autism. PLoS One. 2008;27:e3067. doi: 10.1371/journal.pone.0003067. [DOI] [PMC free article] [PubMed] [Google Scholar]
Associated Data
This section collects any data citations, data availability statements, or supplementary materials included in this article.
Supplementary Materials
Data Availability Statement
Source data containing raw data for the main and extended data figures are available in the online version of the paper (Supplementary source data tables). All other data are available from the corresponding authors upon reasonable request.


