

Abstract
Objective: This study examined the rates of print journal subscription price increases according to the type of available electronic access. The types of access included: electronic priced separately from the print, combination print with “free online” access, and aggregated, defined here as electronic access purchased as part of a collection. The percentages of print price increases were compared to each other and to that for titles available only in print. The authors were not aware of prior objective research in this area.
Methods: The authors analyzed the percentage print price increases of 300 journals over a five-year time period. The titles were grouped according to type of available electronic access. The median and mean percentage print price increases were calculated and plotted for all titles within each group.
Results: Using both the median and the mean to look at the percentage print price increases over five years, it was obvious that print prices for journals with electronic access exceeded journals that did not offer an electronic option. Electronic priced separately averaged 3% to 5% higher than print only titles using both measures. Combination print with “free online” access had higher increases from 1996 to 1999, but, in 2000, their percentage increases were about the same as print only titles. The rate of price increases for aggregated titles consistently went down over the past five years. Journals with no electronic option showed the lowest percentage rates of print price increase.
Conclusions: The authors' findings reveal that the increases of print prices for their sample of titles were higher if a type of electronic access was offered. According to the results of this study, aggregated collections currently represent the electronic option whose percentage price increase for print prices was lowest. However, the uneven fluctuations in rates of subscription prices revealed that the pricing of journals with electronic access is still evolving. More study is recommended to see if the trends observed in this study are sustained over a longer time period.
INTRODUCTION
Journal pricing has been the subject of much discussion in the library world for many years due to the continued increase in percentage of budgets devoted to subscriptions. With the advent of electronic access, speculation about pricing took on new dimensions [1]. There were hopes that publishing in electronic form would be less expensive and that journal prices would actually decrease after converting from print to online [2]. In the annual reports on periodical prices published in Library Journal [3–5], there have been little data to support these expectations.
John Cox, well-known publishing consultant, interviewed for the EBSCO Subscription Services newsletter At Your Service, flatly debunks the myth that online is cheaper to produce. He states that there are two important factors that are ignored when making that claim. They are that:
The costs of establishing and maintaining an online publishing operation are considerable: computer and telecommunications equipment that needs replacing every two or three years, and the cost of technical staff to run the system. The major part of the cost of publishing a journal lies in facilitating peer review, editing and typesetting, and subscription management. These costs are borne whether the journal is output in print or electronically. [6]
As the authors of this paper contemplated the fact that there is no escape from the relentless upward march of journal subscription prices, we began to speculate on how the various electronic access options affected cost. Are there increased costs for journals when they have an electronic option? What effect does method of electronic access have on the print journal subscription cost? What about those familiar announcements that our print subscriptions now come with a great new benefit that is absolutely free? Is the rate of increase higher for subscriptions offering “free online” access with the print? Does it matter, in terms of the rate of subscription price increases, how a health sciences library obtains the electronic version of a journal?
A review of the literature revealed no research directly addressing these issues. Because of this dearth of objective information, the authors designed a study intended to provide some answers to these questions. We hypothesized that all forms of electronic access carry an associated cost. Even though there was some circumstantial evidence indicating “free online” titles were increasing at the highest rate, careful analysis disproved that theory. However, in the process of looking at that issue, we discovered several other interesting trends.
BACKGROUND
Currently, there is no stable model for the pricing of electronic information products. Online database producers first grappled with pricing issues before electronic journals became feasible. Rowley [7] argued that the pricing strategy of electronic products plays a central role in determining the future characteristics of the information marketplace. She recognized that there was an inextricable link between price and product and that the central issue was “what the customer is prepared to pay for a specific product.” Her observation that much of the complexity and fluidity in pricing structures derived from the complexity and fluidity of the marketplace seemed apt for electronic journals as well as online databases. It also offered one explanation of the absence of definitive models in the electronic pricing arena. Because publishers had little experience with costs for electronic access, they set a price that the market supported.
Knight and Hillson [8] thoroughly described the current electronic pricing environment during a workshop at the thirteenth annual meeting of the North American Serials Interest Group (NASIG). Sixteen pricing models were identified, and six emerged as the most favored by librarians, vendors, and publishers attending the workshop. The six were: (1) print plus add-on surcharge for the electronic version, (2) electronic plus add-on surcharge for the print, (3) electronic free with the print subscription, (4) electronic available purchased through a group of journals, (5) pricing established by category and number of users, and (6) subscription plus transaction cost. Participants felt that these models were most budgetable, predictable, easiest to administer, flexible, and most fair for the institution.
We used three variations from the six models described by Knight and Hillson for our study. We found no consistent rationale for journal pricing in the electronic era, and, by looking at the types of electronic access, it was possible to examine whether the print prices of journals were affected. The types of access used for this study are explained in the methodology section.
METHODOLOGY
This project started at the University of Arizona with the initial intention of evaluating the print journal collection to assess how best to acquire electronic access to a substantial portion of the titles. With a limited budget, Chen, head of collection development, chose to look at the most-used journals in print format. The rationale behind this approach was twofold: to alleviate contention for the heavily used print copies of journals and to allow the library to provide broader electronic access for all the colleges and disciplines in the Arizona Health Sciences Center. Therefore, a print subscription had to meet two factors to be included in the evaluation: (1) the journal must have been used 100 times or more in 1999, and (2) the journal should have online access. Thus, 311 titles were selected using usage-tracking records of the library's online catalog system (SIRSI).
In the course of evaluating these journals, Chen found that the yearly percentage of price increases for some print subscriptions that had free online versions were greater, from the time the free online subscriptions started, as compared with the yearly percentage price increases for the same titles before the free offers of their online equivalent. Chen decided to investigate further her initial findings and asked Rieke and Wrynn, both friends and colleagues in the Medical Library Association Collection Development Section, to join her in this project.
Because our three libraries were representative of a range of academic health sciences libraries carrying the same mix of titles, we refined the original list of titles to 300. The selected titles met the criterion of being heavily used in our libraries. The decision was also made to include some “print only” titles, so that they could serve as a control for the titles offering electronic access. Coincidentally, we noticed that among the 300 titles selected were many from the Brandon/Hill lists. This coincidence substantiated that the titles we selected were “core” titles and that our study would be of value to a wider audience in the health sciences library community. Of the 300 titles, 113 titles (more than 30%) were included in the Brandon/Hill list of titles in medicine (93 titles) [9], nursing (14 titles) [10], and allied health (6 titles) [11] fields.
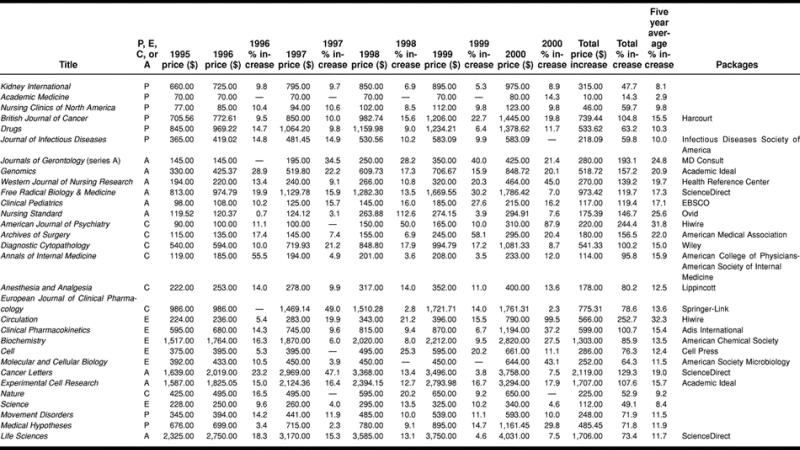
The authors chose as the unit of analysis the list print price (Table 1). The print subscription prices were used as the standard, because the wide variations and constantly changing nature of electronic pricing structures prohibited us from making meaningful comparisons using electronic prices. To achieve a constant data source, we used the print prices provided by EBSCO Subscription Services. Two of the three libraries used that vendor, and the print price information was readily available from the Historical Prices Analysis Reports [12] provided annually by EBSCO.
Table 1 Sample list of titles showing yearly increases and types of access
The study included journal prices from January 1995 to January 2000. In 1994 to 1995, a few major science, technical, and medical (STM) publishers publicly announced the development and implementation of full-text electronic journal delivery [13, 14], thus, the chosen time frame was considered the most logical to anchor the study. It was beyond the scope of this study to determine exactly when publishers began making plans to offer electronic access. By studying print prices over a five-year span, we felt we would include at least one of the years of electronic implementation for the titles offering that option.
Types of electronic access
Based upon our experiences and the descriptions in the literature [15], we placed each of the 300 titles into one of four types of access. Titles were assigned a type according to the electronic access available at the libraries studied. However, some titles offered more than one type of electronic access. For example, the title might be available in an aggregator group, but it might also be available as “free online” with print subscription. However, for the purposes of this study, the authors placed a title in the category of access that was available in the participating libraries at the time the study was conducted in the spring of 2000.
The graph in Figure 1 shows the distribution of titles in each category. The types that we identified are print only, electronic priced separately, combination, and aggregated. They are represented by the letters P, E, C, and A in our table and figures. The terminology used throughout the literature about electronic journals is often confusing and overlapping. To help distinguish the types that we are discussing, we have italicized the terms that name them throughout the remainder of the paper.
Print only (P). These were titles that are only available in print format. Fifty-nine titles of the 300 (20%) fell into this category.
Electronic priced separately (E). These were journals with electronic versions that were available with surcharge or were priced separately. Thirty-six titles of the 300 (about 12%) were in the E category. Examples in this group were titles published by Cell Press and the American Society of Microbiology.
Combination price (C). These were the electronic versions of print journals that were offered “free online” with print subscriptions. Examples were those usually available as a combined or “bundled” unit, such as titles offered by SpringerLink and Mosby. There were ninety-one titles of the 300 total (30%) in this category.
Aggregated pricing (A). Titles that were available for purchase as a collection through publishers, such as Elsevier's ScienceDirect (SciD), Academic Ideal (Ideal), or through a third party provider, such as MD Consult (MDC), Health Reference Center (HRC), and Ovid were considered aggregated. This group was the largest of the four designated categories, with 114 titles of the 300 total (38%). The packages column of Table 1 gives these and other examples.
Figure 1.
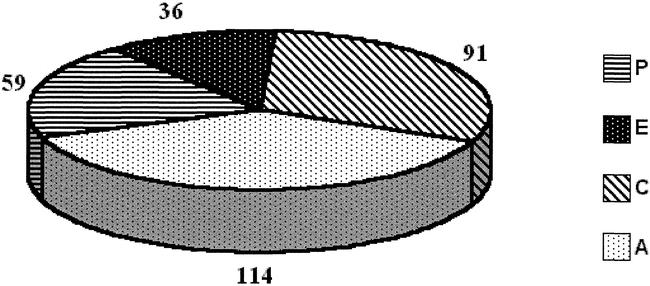
Number of titles by type of electronic access (N = 300 titles). P = print only; E = electronic priced separately; C = combination price; A = aggregated pricing.
Data analysis
Data were entered into Microsoft's Excel program for analysis and comparison. The type of access (P, E, C, or A) was entered into the spreadsheet along with each title's annual print price. Also, the successive yearly percentage price increase was calculated. Table 1 shows a sample of the types of information entered for each title. When applicable, the names of aggregator package or publisher group were also included.
For the study, the rate of print price increases for each of the categories were compared according to both median and mean increases. The mean increase is the simplest way to look at the data and gives a good general idea of the trend of increases. The mean is calculated by summing all the percentage increases and then dividing by the total number of titles in the type being examined. It is often referred to as the balance point and is sensitive to all scores in a distribution. However, because of this, it can be drawn in the direction of extremes [16]. Some very high or very low price increases can result in an average percentage price increase that does not reflect the real distribution of the percentages. For example, a title costing $40.00 one year and increasing to $80.00 would show a 100% increase, even though the actual dollar amount does not seem significant.
In order to avoid the limitations of the mean, we also calculated the median. It is also a measure of central tendency but is not as sensitive to extremes. In cases where the mean will be pulled because of very high or very low increases, the median is more representative of the central tendency of the distribution. It was the rate of print price increase in our distribution that was exactly at the middle point with an equal number of titles both above and below it on the list. The advantage of using the median is that it is insensitive to extreme prices, and therefore it is often a more realistic reflection of the distribution of prices. However, one potential flaw in the median is that an examination of the rates of increase for the title immediately above or immediately below could be significantly different from the figure found at the median [17].
Because both the mean and the median methods have advantages and disadvantages, we hoped that a comparison of the two rates would show similar trends. If so, this cross-examination would help to justify our results as offering a reasonably accurate view of trends with a more minimal chance of the results being skewed by extremes.
RESULTS
Median price increases
Median price increases were compiled by separately examining the titles in each of the four designated categories. Each category was sorted by rate of its print price increase per year, and then the title exactly in the middle of each group was selected for each of the five years included in the study. For example, in the electronic priced separately category for 1996, the median title had a 12+ percentage increase, whereas, in 2000, the median title increased 9.3%. For the print, combination, and aggregated categories, titles that fell one or two places above or below the median had a percentage of increase no more than 0.3% from the median itself. For electronic priced separately, the smallest category in the study, a difference in rate of print price increase as large as 3.5% was found in the titles just above and just below the median. This finding indicated that for the electronic priced separately group, the price increases varied much more dramatically than those in the other categories and indicated that the median number was not as reliable as for the other categories.
The rate of increase for titles in the print only category went down somewhat over the five-year period and, for most years, showed the lowest overall rates of increase. For example, in 1996, the median increase for print only titles was 9.9%, just below the combination titles (10%) and significantly below the median increase for electronic priced separately (12.2%) and aggregated titles (11.7%). By the year 2000, aggregated (8.2%), combination (8.4%), and print only (8.4%) were fairly close, while electronic priced separately showed the highest rate of increase (9.3%).
For titles in the electronic priced separately group, we thought print price increases would be lower with the assumption that separate pricing covers the cost of the electronic access. However, this was not the case. Since 1997, they have stayed above the rate of increase for print only titles, and their rates of increase were approximately the same.
Combination titles, where electronic access was “free” with a print subscription, showed their highest rates of increase for the three-year period 1997 to 1999. These increases were during a period when many publishers began to offer “free online” access with print subscriptions. For the year 2000, though, the rate of increase came down, suggesting that this type of pricing may be stabilizing somewhat.
The rate of increase of print prices for aggregated collections showed a consistent downward trend throughout all five years, and this result was found not only in the median analysis but also was evident when calculating the mean. The trend showed a very high percentage increase (+10%) in the first two years, with the rate then dropping down the last three years. For 2000, all the median rates of price increases except for the electronic priced separately, which is higher at 9.3%, have nearly converged (Figure 2).
Figure 2.
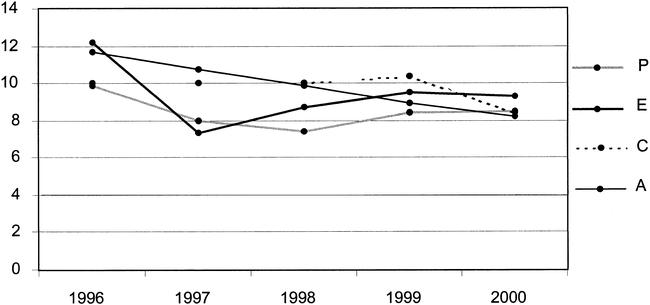
Percentage median price increase
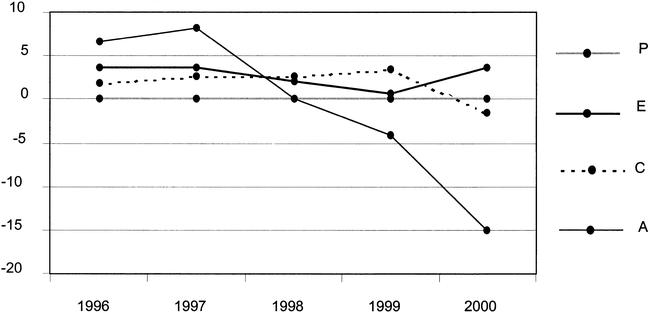
Mean price increases
Calculating the mean price percentage increases was the other measure utilized to analyze price trends. The mean increases were calculated by adding the rate of price increases in each category and then dividing the sum by the number of titles. An examination of the data to find average rates of increase showed similarities to the median chart, but there were some differences (Figure 3). Print only titles on the average stayed near the 10% increase level. Compared to other categories, this was, however, not always the lowest rate of increase.
Figure 3.
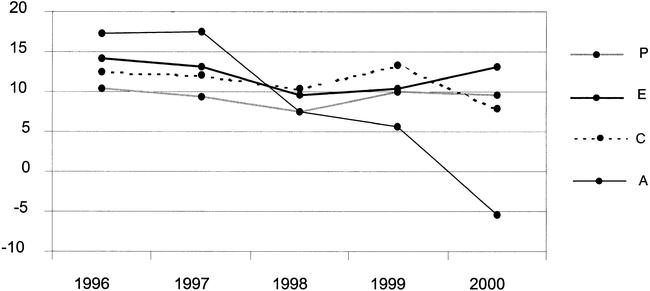
Percentage mean price increase 1995 to 2000
Except for 1999, electronic priced separately stayed consistently 3% to 5% higher than print only titles, and rose again in the year 2000, to about 4% above print only. This was very similar to the pattern of the median rate of price increases for electronic priced separately. Rates of increase for combination print with electronic titles also stayed higher than the print only titles, with the largest difference in 1999. For 2000, just as with the median, the mean rate of increase for combination titles went down.
Aggregated titles, which steadily declined in rate of median increase, actually showed an even more dramatic rate of decline in mean rate of price increases. This category went below the zero mean rate of increase and actually dropped in price. It needs to be reemphasized at this point that the study examined only list print prices. Actual prices paid for print titles by libraries that purchased a large electronic collection might have had additional discounts or surcharges, but such potential discounts and extra charges were not included in this study.
Limitations of the study
The authors realize that there are several limitations to the study that could influence the results. Primary among them are:
Currency fluctuation: dramatic changes in exchange rate would affect the relative rates of increase among our categories, if journals were published in a country where this occurred in any given year monitored in the study.
Increase in page count or number of issues published: an increase in the amount of content produced by a title could affect its print pricing.
Electronic access launched in different years: the five years studied were those in which electronic journal access moved from an experimental stage to becoming another seriously relied-upon product. Within any given year, however, rates of increase could have varied as new publishers introduced electronic access.
Time of development for launching electronic access: these data would be impossible to gather without complete information from all publishers involved. There is no way to tell how long development lasted before publishers began to charge for it, as well. For example, one major service provided libraries with free access to their complete catalog while they were still perfecting it, and then pricing was established later. Other services began charging as soon as their access was available.
Because our sample covered titles published by a number of different publishers, it was not practical to examine each one on a case-by-case basis and adjust for the limitations described. Instead, we tried to minimize the effects of these limitations by using the print rate of increase as a control. To emphasize this increase, the authors set the print price increase to zero, so that the variance from the rate of print increase better indicated how the type of electronic access affected prices. Figure 4 illustrates this adjustment, showing the mean rates of increase compared to a print price increase as zero. The adjusted results graphically show the rates of percentage increase occurring in the other categories.
Figure 4.
Adjustment graph (print increase = 0)
Comparing the data in Figure 4 to the median and mean figures revealed the same trends regardless of display. The rate of print price increase for aggregated collections consistently went down, while the combination titles' rate of increase climbed steadily higher until 2000. The rate of print price increase for electronic priced separately titles was similar to combination until the year 2000, when it showed an upward trend.
CONCLUSIONS
This study revealed several interesting trends, but it did not provide clear answers for the questions that we posed when we began our study. The effects of electronic journal pricing are definitely still evolving, and, even though our results show some trends, at this point the patterns are not totally consistent or predictable. A follow-up study is indicated.
Our question of whether or not there were increased costs for journals when they offered electronic access was answered with a resounding yes. When we looked at the data using both the median and the mean, titles offering print only generally maintained the lowest rate of print price increase. Librarians need to accept the fact that in the current market electronic access is an added value that carries an associated cost.
Electronic priced separately certainly has not guaranteed the most competitive pricing for print counterparts. In fact, the print prices for these titles rose consistently more than the others. This rise suggests that their print subscriptions are subsidizing electronic access, even though libraries may not be purchasing electronic versions.
“Free online” was really not free, according to our data. Print price increases in the combination category were consistently high in the four years from 1996 to 1999, with the peak in 1999. These increases were especially disturbing as the advertising surrounding these titles painted a picture of getting something additional for no extra charge. One possible reason for the drop of the percentage price increase in 2000 was the movement of some of the “free online” titles into one of the other categories. This option was one of the most popular to begin with but has steadily been abandoned.
Does it matter, in terms of the rate of subscription price increases, how a health sciences library obtains the electronic version of a journal? The option of choosing electronic access through an aggregated collection was the answer that was supported by all three ways that we examined our data. The data suggested that the print prices for titles in aggregated collections were not increasing at the same rate as prices for titles from the other groups. From 1995 to 2000, if a title was included in an aggregated collection, it helped control the increase for its print subscription. In fact, some large packages promoted keeping rates of price increase steady as a reason to subscribe to their collections and featured electronic versions as their main offering, with the print being added on for a discount off the list price.
Aggregated collections have come under attack as a way for publishers to force libraries not to cancel titles. Frazier in the Librarians' Dilemma points out the pitfalls of the “Big Deal,” as he calls the “online aggregation of journals that publishers offer as a one-price, one size fits all package” [18]. His arguments have merit, but, as he states and as our data substantiate, print price increases are mitigated when titles are offered as a package. Librarians still hold the ultimate trump card of canceling titles and giving up electronic access to the aggregated collection. However, once users grow accustomed to the advantages of electronic access to many previously unavailable titles, convincing them to give it up would be difficult. The attraction for users at larger libraries is renewed access to titles previously canceled without the usual delays of interlibrary loan or document delivery. For users at smaller libraries, aggregated collections provide access to a collection that is comparable to one at a much bigger institution. Many of these advantages result from consortial agreements among several different types of libraries. In these cases, the users feel they are the winners.
Another argument poised against aggregated collections is the instability of the title mix and the time coverage of articles that are under contract. Even companies who create aggregated collections, such as EBSCO [19], caution librarians to be wary of depending solely on electronic content through these packages.
Clearly, there are many things to consider when making collection decisions regarding the purchase of electronic access to journal information. There are many preservation concerns, but not every library needs to keep a print copy of each journal for posterity. True, there are times when users are not able to find one particular item not included in the aggregated collection. Would it be possible to measure those occurences against the number of times that users are satisfied, because they do find the articles that they need?
Because these aggregated collections are still relatively new, there needs to be an earnest effort to look at and resolve some of these issues. Assessing the cost-benefit ratio of this type of access is important. This will be very difficult because of the various configurations of the packages and their constantly changing nature. However, until the attempt is made, it is spurious to proclaim the negatives of aggregated collections without balancing the positive aspects. Whether these aggregated collections are worth their cost is the topic for another study.
We concur with Tenopir and King, who predict that most journals are likely to continue publishing in both electronic and print formats over the next five to ten years. So the interrelationship in terms of pricing structures will continue to be of concern to libraries for the foreseeable future [20]. Our research also confirms the assertions in the literature that pricing of electronic access is an art and not a science. As Cox states,
New pricing structures are not produced by the application of scientific principles based on known behavior. They are conceived by someone, and then tested in the marketplace. Customers ultimately decide what is sustainable. The business of online scholarly information is as new to publishers as it is to librarians. There are many unsolved issues. [21]
On the basis of our current data, it appears that aggregated collections offer the electronic access that is currently stabilizing print subscription prices. The dangers of relying on aggregated collections must be balanced, as stated earlier. If libraries offer their users electronic access, they must realize and accept the risks involved. On a case-by-case basis, librarians need to decide which combination of print and electronic they can afford and which will serve their users most effectively. They should be aware that collection building in the world of electronic access will not follow the old rules as new paradigms emerge.
Acknowledgments
The authors gratefully acknowledge the technical assistance of Noella Mukoka, student assistant in the Collection Development Department at the Arizona Health Sciences Library, University of Arizona, and the editorial advice of P. Zoë Stavri, Ph.D., School of Information Resources and Library Science, University of Arizona.
Footnotes
* Based on a presentation at the One-hundred and First Annual Meeting of the Medical Library Association, Vancouver, British Columbia; May 7, 2000. Named by the Research Section as the best research paper at the meeting.† Formerly, head of collection development, Arizona Health Sciences Library, The University of Arizona, Tucson, Arizona 85724-5079.
REFERENCES
- Robnett B.. Online journal pricing. Serials Libr. 1998;33(2):55–69. [Google Scholar]
- Pikowsky RA. Electronic journals as a potential solution to escalating serials costs. Serials Libr. 1997 32(3–4): 31–56. [Google Scholar]
- Ketcham-Van Orsdel L, Born K. E-journals come of age. Libr J. 1998 Apr 15; 123(7):40–5. [Google Scholar]
- Ketcham-Van Orsdel L, Born K. Serials publishing in flux. Libr J. 1999 Apr 15; 124(7):48–53. [Google Scholar]
- Ketcham-Van Orsdel L, Born K. Pushing toward more affordable access. Libr J. 2000 Apr 15; 125(7):47–52. [Google Scholar]
- Cox J. Pricing online journals—art or science? At Your Service. 2000 Jan–Mar; (51):3–4. [Google Scholar]
- Rowley J. Price and the marketing environment for electronic information. J Libr Inf Sci. 1997 Jun; 29(2):95–101. [Google Scholar]
- Knight NH, Hillson SB. Electronic pubs pricing in the Web era. Information Today. 1998 Sep; 15(8):39–40. [Google Scholar]
- Hill DR. Brandon/Hill selected list of books and journals for the small medical library. Bull Med Libr Assoc. 1999 Apr; 87(2):145–69. [PMC free article] [PubMed] [Google Scholar]
- Hill DR, Stickell HN. Brandon/Hill selected list of print nursing books and journals. Nurs Outlook. 2000 Jan/Feb; 48(1):10–22. [DOI] [PubMed] [Google Scholar]
- Hill DR. Brandon/Hill selected list of print books and journals in allied health. Bull Med Libr Assoc. 2000 Jul; 88(3):218–33. [PMC free article] [PubMed] [Google Scholar]
- EBSCO Historical price analysis reports. . Birmingham, AL: EBSCO Subscription Services, 1995–2000. [Google Scholar]
- Machovec G. Electronic journal market overview—1997. [Web document]. Denver, CO: Colorado Alliance of Research Libraries, 1997. <http://www.coalliance.org/reports/ejournal.htm>. [Google Scholar]
- Tagler J.. Recent steps toward full-text electronic delivery at Elsevier Science. Serials Libr. 1996;28(1/2):171–9. [Google Scholar]
- Knight NH, Hillson SB. Electronic pubs pricing in the Web era. Information Today. 1998 Sep; 15(8):39–40. [Google Scholar]
- Gravetter FJ, Wallnau LB. Statistics for the behavioral sciences: a first course for students of psychology and education. St. Paul, MN: West Publishing Company, 1992: 71. [Google Scholar]
- Gravetter FJ, Wallnau LB. Statistics for the behavioral sciences: a first course for students of psychology and education. St. Paul, MN: West Publishing Company, 1992: 79 –83. [Google Scholar]
- Frazier K. The librarians' dilemma. D-Lib Magazine. 2001 7(3):1–8.(Available from http://www.dlib.org/dlib/march01/frazier/03frazier.html). [Google Scholar]
- Brooks S. Message from EBSCO—attn: academic librarians. [5 paragraphs]. Email sent to ebsco_web@epnet.com, Birmingham, AL: 2001 Mar 19. [Google Scholar]
- Tenopir C, King DW. Towards electronic journals: realities for scientists, librarians, and publishers. Washington, DC: SLA Publishing, 2000: 39. [Google Scholar]
- Cox J. Pricing online journals—art or science? At Your Service. 2000 Jan–Mar; (51):4. [Google Scholar]