

Abstract
Astrocytes are highly complex glial cells with numerous fine cellular processes which infiltrate the neuropil to interact with synapses. The mechanisms controlling the establishment of astrocytes’ remarkable morphology and how impairing astrocytic infiltration of the neuropil alters synaptic connectivity are largely unknown. Here we find that cortical astrocyte morphogenesis depends on direct contact with neuronal processes and occurs in tune with the growth and activity of synaptic circuits. Neuroligin (NL) family cell adhesion proteins, NL1, NL2, and NL3, which are expressed by cortical astrocytes, control astrocyte morphogenesis through interactions with neuronal neurexins. Furthermore, in the absence of astrocytic NL2, cortical excitatory synapse formation and function is diminished, whereas inhibitory synaptic function is enhanced. Our findings highlight a novel mechanism of action for NLs and link astrocyte morphogenesis to synaptogenesis. Because NL mutations are implicated in various neurological disorders, these findings also offer an astrocyte-based mechanism of neural pathology.
Astrocytes actively participate in synapse development and function by secreting instructive cues to neurons1. Through their perisynaptic processes, astrocytes maintain ion homeostasis, clear neurotransmitters2 and partake in neuromodulatory signaling to control circuit activity and behavior3. These complex functions of astrocytes are reflected in their elaborate structure4,5, which is driven by numerous fine processes that closely interact with synapses. Importantly, loss of astrocyte complexity is a common pathological feature observed in neurological disorders6.
Despite the vital roles astrocytes play in brain development and physiology, how their complex morphology is established is largely unknown. Furthermore, we do not know if disruptions in astrocyte morphogenesis lead to synaptic dysfunction. We investigated these questions in the developing mouse V1 visual cortex during postnatal days 1-21 (P1-P21), when astrocyte morphogenesis occurs concomitantly with synaptic development7,8. Using Aldh1L1-EGFP BAC-transgenic mice, in which all astrocytes express EGFP9, we found that astrocytic coverage of V1 neuropil profoundly increased from P7 to P21 (Fig. 1a-c), coinciding with high rates of synaptogenesis10. This increase correlated with the appearance of fine astrocytic processes (Extended Data Fig. 1a), and only became significant between P7-P14, coinciding with eye opening, suggesting that vision drives this growth (Fig. 1b). Indeed, dark rearing mice profoundly stunted astrocyte coverage of V1 but did not diminish coverage in the auditory cortex (Extended Data Fig. 1b-d)
Figure 1. Astrocyte morphogenesis occurs in tune with sensory activity.
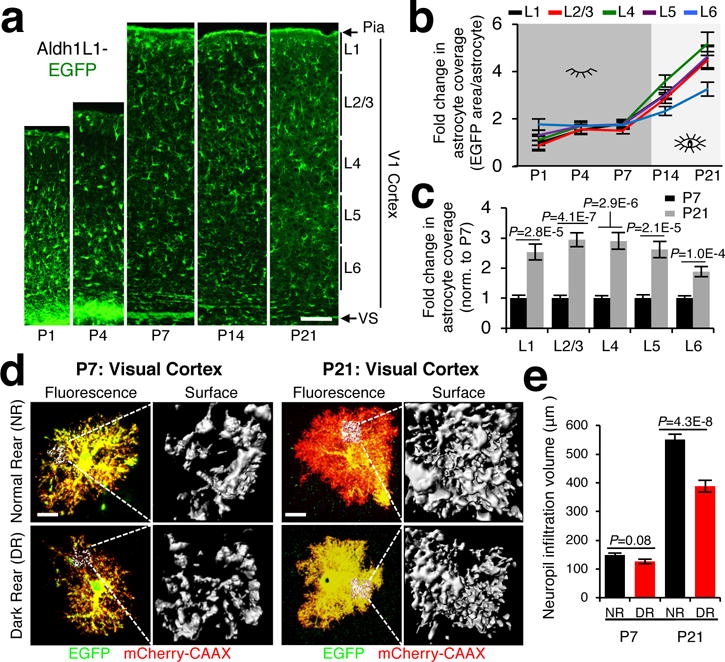
a, V1 cortex images (layers L1-L6) from Aldh1L1-EGFP mice at postnatal days P1-P21. b, Fold change in astrocyte coverage of the neuropil at each cortical layer from P1-21 (normalized to P1 L1). c, Fold change in astrocyte coverage of the neuropil from P7 and P21 (normalized to P7). b-c, n=10 ROI/layer, >3 images/mouse, 3 mice/time point. d, Representative images and neuropil infiltration volumes (NIV) of V1 L4 PALE astrocytes from normal (NR) and dark reared (DR) mice at P7 and P21. Astrocytes were electroporated with EGFP (green) and membrane-tagged mCherry (mCherry-CAAX, red) plasmids. e, Average NIV of P7 and P21 astrocytes from NR and DR mice. n = 3 NIV/cell, 18-20 cells/condition, 4 mice/condition. One-tailed t-test (c), one-way ANOVA (e). Data are means ± s.e.m. Scale bars, 100 μm (a), 10 μm (d).
Next, we investigated astrocyte growth at single cell level using Postnatal Astrocyte Labeling by Electroporation (PALE), which sparsely transfects and labels cortical astrocytes (Extended Data Fig. 1e-h). The volume of fluorescently-labeled astrocyte processes infiltrating the neuropil (neuropil infiltration volume (NIV)), dramatically increased between P7-P21 (Extended Data Fig. 1i-k). Dark rearing stunted NIV at P21, but not at P7 (Fig. 1d-e). V1 astrocytes also increased their territory size ~1.6-fold from P7 to P21 (Extended Data Fig. 1n-o). Intriguingly, astrocyte territories were significantly reduced by dark rearing at both ages (Extended Data Fig. 1p-q), suggesting that light-induced changes in V1, which occur even prior to eye opening11, play critical roles astrocyte territory growth. Altogether, our findings reveal that astrocyte morphogenesis occurs in tune with the growth and activity of the underlying synaptic circuits of the cortex.
To investigate the mechanisms linking astrocyte morphogenesis to neuronal circuit development, we established a primary rat cortical neuron-astrocyte co-culture system, which takes advantage of the observation that astrocyte complexity is greatly enhanced by co-culture with neurons compared to culturing them alone or on Cos7 cells (Extended Data Fig. 2a-e, h). Neuron-conditioned media was not sufficient to induce astrocyte elaboration (Extended Data Fig. 2e, h). Furthermore, inhibiting astrocyte glutamate sensing by blocking metabotropic glutamate receptor 5 (mGluR5) only slightly impaired astrocyte elaboration; whereas, blocking synaptic network activity by TTX did not diminish neuron-induced astrocyte elaboration (Extended Data Fig. 2f, i). These findings indicate that contact-mediated mechanisms, rather than secreted factors or synaptic activity, are the primary drivers for astrocyte morphogenesis in vitro. To test this, we methanol fixed neurons to preserve their structure, while eliminating dynamic feedback to astrocytes. Astrocytes fully elaborated by co-culture with methanol-fixed neurons, whereas, methanol-fixed Cos7 cells did not induce elaboration (Extended Data Fig. 2g, j-l). Extraction of neuronal structures by urea, while preserving the deposited extracellular matrix, severely stunted astrocyte elaboration (Extended Data Fig. 2g, j, m). Super-resolution imaging of astrocyte processes and synapses showed that astrocyte elaboration occurs near synapses, and astrocytes closely interact with synaptic structures in vitro (Extended Data Fig. 2n). Altogether, these results show that astrocyte morphogenesis is triggered by direct contact with neurons in vitro.
Astrocytes require NLs for complexity
Next, we mined gene expression databases12-14 to identify astrocytic cell adhesion molecules (CAMs) known to interact with neuronal and synaptic proteins. Intriguingly, astrocytes express three members of the NL family, NL1, NL2, and NL3, at levels comparable to, or higher than, neurons (Extended Data Fig. 3a-f). We confirmed that rodent astrocytes express NLs by fluorescent in situ hybridization in vivo and by RT-PCR and Western blotting in vitro (Extended Data Fig. 3g-j).
NLs have been overwhelmingly studied in the context of neurons15-17 with few exceptions18-20. Simultaneous knockdown of all astrocytic NLs with short hairpin RNAs (shRNA) (Extended Data Fig. 4a-c) completely blocked neuron-induced astrocyte elaboration in vitro (Fig. 2a-b). Silencing each individual astrocytic NL partially, but significantly diminished astrocyte arborization, indicating non-overlapping roles for each NL in astrocyte morphogenesis in vitro (Fig. 2a-e, Extended Data Fig. 4d). Co-transfection of shNLs with the corresponding RNA interference-resistant NL-cDNAs (Extended Data Fig. 4b-c and21) rescued astrocyte elaboration (Fig. 2a, c-e). NL-knockdown also inhibited astrocyte elaboration induced by co-culture with methanol-fixed neurons (Extended Data Fig. 4e-f). In contrast, knockdown of EphrinA3, a CAM with known roles in astrocyte-neuron interactions22, did not alter astrocyte morphogenesis (Extended Data Fig. 4g-h). Collectively, these results show that astrocytic NLs 1, 2, and 3 are required for the establishment of neuronal contact-induced astrocyte morphogenesis in vitro.
Figure 2. Astrocytic NLs control astrocyte morphogenesis through neuronal Nrxs.

a, Astrocytes (green) were transfected with shRNAs against rat NL1 (shrtNL1), mouse/rat NL2 (shNL2), and/or rat NL3 (shrtNL3) ± HA-tagged, shRNA-resistant NL plasmids (red) and co-cultured with neurons (not visible). b-e, Quantification of astrocyte complexity for conditions in (a). f, Image of an astrocyte transfected with shrtNL1 (green) and HA-tagged NL1-SWAP (red) in co-culture with neurons (not visible). g, Quantification of astrocyte complexity for (f). h, Images of shCtrl-transfected astrocytes (red) in co-culture with shNrx1/2 or shScr lentivirus-transduced neurons (green). i, Quantification of astrocyte complexity for (h). b-e, i Data represented are from individual experiments with 3 biological replicates. Similar results were obtained in 3 independent experiments. n>20-25 cells/condition/experiment. j, Nanofibers were coated with Fc-tagged proteins to model a neuronal scaffold. Images of EGFP-transfected astrocytes (green) cultured on Fc-protein-coated nanofibers (red). k, Quantification of astrocyte complexity for (j). Data represent 1 experiment with 4 biological replicates. n>25 cells/condition. ANCOVA (b-e, g, i, k). Data are means ± s.e.m. Scale bar, 10 μm.
In neurons, NLs function by forming trans-synaptic adhesions with Neurexins (Nrxs)16. Swapping the extracellular cholinesterase (ChoE)-like domain of NL1 with the homologous cholinesterase sequence creates a chimera, NL1-SWAP, that is expressed and trafficked correctly, but cannot interact with presynaptic Nrxs23 (Extended Data Fig. 4i). Co-transfection of NL1-SWAP with shNL1 failed to rescue astrocyte morphogenesis (Fig 2f-g), even though shNL1 did not diminish NL1-SWAP expression, and NL1-SWAP alone in astrocytes did not impair astrocyte morphogenesis (Extended Data Fig. 4b, j-k). These results show that contacts mediated by the ChoE-like domain of NL1 are required for astrocyte morphogenesis and suggest that astrocytic NL-neuronal Nrx interactions regulate astrocyte development.
To test if neuronal Nrxs are required for astrocytic morphogenesis, we silenced Nrx expression in cultured rat neurons using a lentivirus encoding shRNAs against mouse Nrxs 1, 2, and 3 (both α- and β)24. In rat neurons, this lentivirus silenced Nrx1 and 2, but not Nrx3 due to mismatches between rat and mouse sequences (Extended Data Fig 5a-d). Silencing Nrx1/2 in neurons significantly diminished neuronal contact-induced astrocyte morphogenesis (Fig. 2h-i). Concurrently silencing NL1 in astrocytes did not further reduce astrocyte complexity (Extended Data Fig. 5e-g), indicating that Nrx1/2 are the primary neuronal interaction partners for astrocytic NL1. Additionally, these findings suggest that interactions between other astrocytic NL and neuronal Nrx pairs are also important for astrocyte morphogenesis in vitro.
Neuronal Nrx elimination may affect astrocyte morphology independent of the loss of Nrx-NL contacts. To overcome this caveat, we used methanol-fixed neurons to induce astrocyte morphogenesis and blocked Nrx/NL interactions by applying soluble Fc-tagged Nrx-β ectodomains (Extended Data Fig. 5h-j). Co-application of Nrx1/2/3β-Fc significantly diminished astrocyte complexity compared to Fc-only protein (Extended Data Fig. 5k-m). Application of Nrx1β-Fc or Nrx2β-Fc reduced astrocyte elaboration, but Nrx3β-Fc did not (Extended Data Fig. 5n). Meanwhile, silencing astrocytic NL1 did not further diminish astrocyte elaboration (Extended Data Fig. 5o). Next, we tested if trans-interactions with Nrxs are sufficient for astrocyte morphogenesis by coating 3D-nanofibers with Nrxβ-ectodomains to generate an artificial scaffold mimicking a web of neurites (Fig. 2j). Remarkably, all Nrxβ-coated nanofibers strongly induced astrocyte complexity compared to Fc-only (Fig. 2j-k). Together, these results show that interactions with neuronal Nrxs are required and sufficient for contact-induced astrocyte morphogenesis in vitro.
NLs control astrocyte morphology in vivo
To determine if NLs control astrocyte morphogenesis in vivo, we introduced EGFP-expressing shRNA plasmids targeting mouse NL1, NL2 or NL3 into V1 astrocytes by PALE. As a control, we used a scrambled NL1 shRNA sequence (shCtrl, Extended Data Fig. 6a-d). As expected, shCtrl-transfected astrocytes developed main branches by P7 and elaborated finer processes into the neuropil by P21 (Fig. 3a). NL1 knockdown dramatically stunted astrocytic NIV at P7, but this was corrected by P21. Conversely, NL3 knockdown did not alter astrocyte morphogenesis at P7, but severely arrested astrocyte growth by P21. Silencing NL2 restricted NIV at both time points (Fig. 3a-f, Extended Data Fig. 6e). These results show that NLs are required for astrocyte morphogenesis in vivo and suggest unique temporal roles for NLs in astrocyte development.
Figure 3. NLs control the morphological development of astrocytes in vivo.
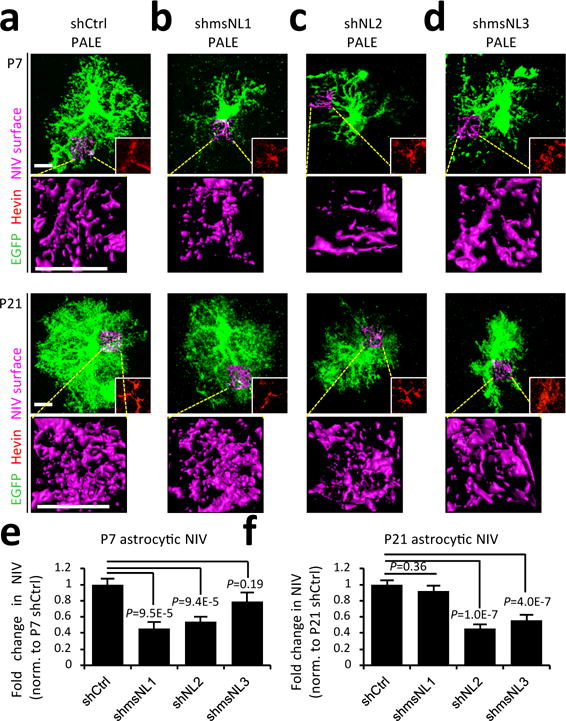
a-d, Representative images of shRNA-transfected L4-5 astrocytes (labelled with EGFP) and NIV reconstructions (magenta) at P7 (top) and P21 (bottom). Astrocytes were electroporated with shRNAs against mouse NL1 (b, shmsNL1), NL2 (c), NL3 (d, shmsNL3) or a scrambled control (shCtrl). All EGFP+ cells imaged were hevin positive, confirming their astrocyte identity (red inlay, corresponding to the somatic region). e-f, Fold change in average NIV for P7 (e) and P21 (f) astrocytes (normalized to shCtrl). 3 NIV/cell, 10-20 cells/condition, ≥3 mice/condition. One-way ANOVA (e-f). Data are means ± s.e.m. Scale bars, 10 μm.
To determine how increasing NL expression alters astrocytic morphogenesis, we overexpressed NL1, NL2, NL3 or NL1-SWAP (control) in astrocytes by PALE. Astrocyte territories were dramatically enlarged by NL1 or NL2 overexpression compared to NL1-SWAP. NIV of NL1-overexpressing astrocytes did not change, whereas NIV slightly decreased for NL2-overexpressing astrocytes (Extended Data Fig. 6f-h). We were unable to find NL3-overexpressing astrocytes at P21, indicating that NL3-overexpression starting at P1 is not compatible with astrocyte survival and/or maturation. Altogether, these findings show that NL expression in astrocytes controls neuropil infiltration and territory size of these cells.
Astrocytic NL2 controls synaptogenesis
Because NL2 knockdown drastically impaired astrocyte morphogenesis at P7 and P21, we next investigated the specific in vivo functions of NL2 in astrocytes using the NL2-floxed mice25. To address the cell-autonomous effects of NL2 on astrocyte development, we sparsely deleted NL2 by introducing Cre via PALE in NL2(+/+) or NL2(f/+) or NL2(f/f) mice (NL2 PALE “WT” “HET” or “KO”, respectively). These mice also carried a single allele of the RTM (Ai14) transgene26 to label Cre positive (Cre+) cells with td-Tomato expression. NL2 expression in td-Tomato/Cre+ astrocytes was greatly diminished and using these mice and PALE, we confirmed the specificity and effectiveness of our shNL2 construct (Extended Data Fig. 7a-f). Similar to our results with shNL2 PALE experiments, deletion of NL2 in V1 L4 astrocytes decreased NIV. Loss of a single allele of NL2 (i.e. NL2 PALE “HET”) was sufficient to cause a partial, but significant decrease in astrocyte infiltration (Fig. 4a-b). Furthermore, loss of both NL2 alleles caused a significant reduction in territory size (Fig. 4c-d). Taken together, our results demonstrate an important function for NL2 in proper astrocyte morphogenesis in vivo.
Figure 4. Astrocytic NL2 controls astrocyte morphogenesis and excitatory synapse numbers.
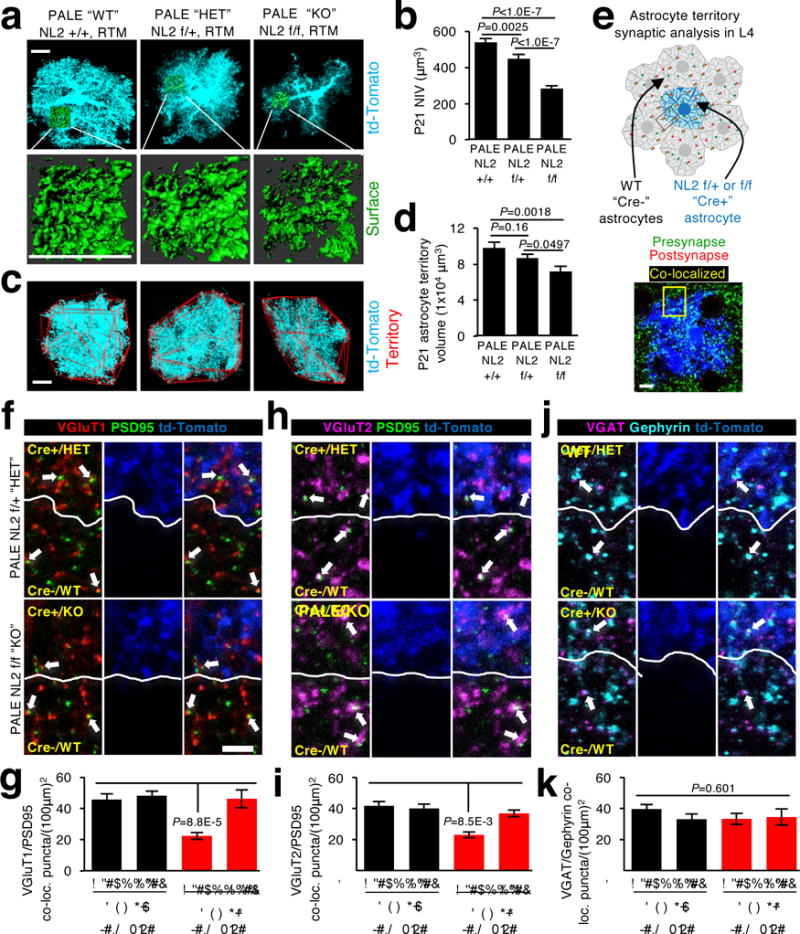
a, Images of V1 L4 astrocytes (cyan) and NIVs (green) from the P21 NL2 +/+, NL2 f/+, and NL2 f/f mice labelled by td-Tomato from the Cre-dependent RTM transgene. b, Average NIV of td-Tomato/Cre+ PALE astrocytes. 3 NIV/cell, 16-20 cells/condition, 4 mice/condition. c, Images of V1 L4 td-Tomato/Cre+ P21 PALE astrocytes (cyan) and their territories (red outlines). d, Average territory volumes of td-Tomato/Cre+ PALE astrocytes. 16-20 cells/condition, 4 mice/condition. e, Schematic of local synapse density analysis. Synapse numbers were quantified within regions of interest inside the territories of V1 L4 P21 td-Tomato/Cre+ astrocytes (blue) and neighboring Cre- astrocytes (not visible). f, h, j, Images of intracortical excitatory synapses (f, VGluT1 (red) and PSD95 (green)), thalamocortical excitatory synapses (h, VGluT2 (magenta) and PSD95 (green)), and inhibitory synapses (j, VGAT (magenta) and Gephyrin (cyan)). Dotted lines show astrocyte territory boundaries and arrows mark co-localized synaptic puncta. g, i, k, Quantification of average intracortical (g), thalamocortical (i), and inhibitory (k) synaptic co-localized puncta within td-Tomato/Cre+ PALE and Cre- astrocyte territories of NL2 f/+ and NL2 f/f mice. 1 ROI/territory (Cre+ and Cre-)/image, 5 images/cell, 3 cells/mouse, 4 mice/genotype. One-way ANOVA (b, d, g, i, k). Data are means ± s.e.m. Scale bars, 10 μm (a, c, e), 2 μm (f, h, j).
Because astrocytes are critical controllers of excitatory and inhibitory synaptogenesis27, we next determined if astrocytic NL2 is required for proper synaptogenesis. We quantified the synapse density within the territories of NL2 PALE “HET” and “KO” L4 astrocytes in comparison to the density of synapses within the surrounding neuropil infiltrated by “WT” astrocytes (Fig. 4e). Synapses were labelled by the co-localization of pre- and postsynaptic markers (i.e. VGluT1/PSD95 (intracortical/excitatory), VGluT2/PSD95 (thalamocortical/excitatory) and VGAT/gephyrin (inhibitory). Co-localization of these markers reflects true synapses, since rotating the presynaptic channel 90° with respect to the postsynaptic channel eliminated most co-localization (Extended Data Fig. 8).
The density of excitatory synapses within the territory of NL2 PALE “KO” astrocytes were halved compared to the neighboring WT astrocytes; whereas losing a single allele of NL2 did not affect excitatory synapse density within its domain (Fig. 4f-i). GABAergic synapse density was not altered within the domains of NL2 PALE “HET” or “KO” astrocytes (Fig 4j-k). These results are quite surprising and distinct from the known neuronal roles of NL2 as regulators of inhibitory synapse formation28,29. We found that astrocytic NL2 is essential to locally regulate synapse development in a cell non-autonomous manner by controlling formation and/or maintenance of excitatory synapses within the territory of a given astrocyte.
Astrocytic NL2 controls synapse function
To determine how astrocytic NL2 affects the function of cortical synapses, we conditionally deleted NL2 (NL2 cKO) in a large population of astrocytes by combining the NL2 floxed allele containing the RTM transgene with the GLAST-CreERT2 mice30. Cre-recombination was activated by administering tamoxifen at P10 and P11 and monitored by td-tomato expression (Extended data Fig. 9a-b). NL2 (but neither NL1 nor NL3) mRNA was significantly reduced in td-Tomato/Cre+ astrocytes isolated from NL2 cKO cortices by fluorescence-activated cell sorting (FACS) compared to littermate NL2 conditional HETs. However, low levels of NL2 mRNA expression were detected likely due to incomplete recombination of both floxed alleles in some Cre+ astrocytes (Extended Data Fig. 9a-e). Importantly, GFAP was not different between NL2 cHET and cKO astrocytes (Extended Data Fig. 9e), indicating that NL2 cKO cells retained their astrocyte identity and did not undergo pathological reactivation characterized by enhanced GFAP expression6,31. Genotyping the sorted cells using allele-specific primers verified the recombination of the NL2 locus (Extended Data Fig. 9f-i). In V1 visual cortex 58.7±4.0% of the NL2 cHET or 53.9±4.4% of NL2 cKO astrocytes were td-Tomato/Cre+ and essentially all also expressed GFAP, indicating that Cre expression is restricted to astrocytes. Deletion of NL2 did not alter the number or distribution of astrocytes or neurons and the td-Tomato signal was absent from neurons within V1 cortex (Extended Data Fig. 10a-e).
We next performed whole-cell patch clamp recordings of miniature excitatory and inhibitory postsynaptic currents (mEPSCs and mIPSCs, respectively) in V1 L5 pyramidal neurons from P21 NL2 cHET and cKO mice (Extended Data Fig. 10f). L5 neurons possess large dendritic trees that project to all cortical layers and receive extensive excitatory and inhibitory synaptic inputs32. The frequency and amplitude of mEPSCs were significantly reduced in NL2 cKO neurons compared to cHETs (Fig. 5a-e). These observations are in accordance with our finding that loss of astrocytic NL2 locally decreases excitatory synapse numbers by 50%. Similarly, deleting NL2 in ~55% of the cortical astrocytes reduces the frequency of excitatory synaptic events by ~25%. Altogether our data show that astrocytic NL2 is required for the proper formation and function of excitatory synapses in the cortex.
Figure 5. Loss of NL2 in a large population of astrocytes alters excitatory and inhibitory synapse function.
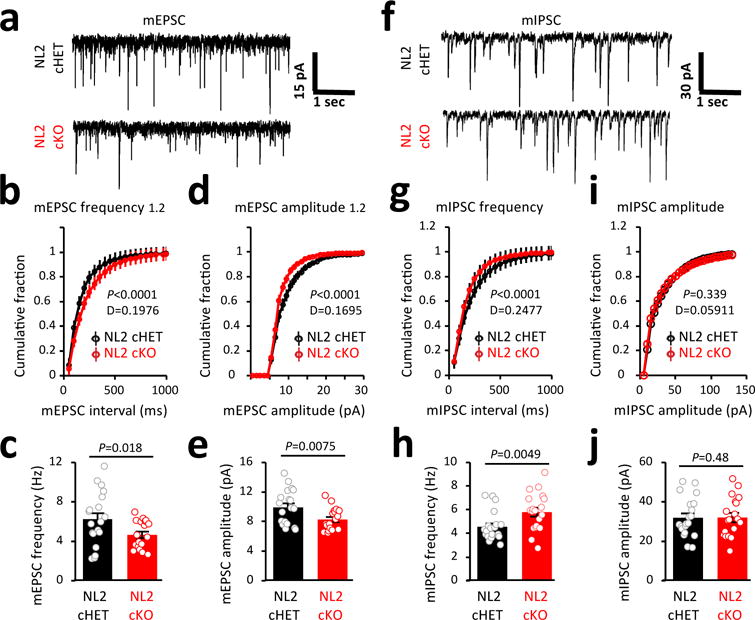
a, mEPSC traces from L5 pyramidal neurons in acute V1 slices of P21 NL2 cHET (black) and NL2 cKO (red) mice. b, d, Representative cumulative distributions of mEPSC frequency (b) and amplitude (d) from NL2 cHET and NL2 cKO pyramidal neurons. c, e, Average neuron mEPSC frequency (c) and amplitude (e) from NL2 cHET and NL2 cKO mice. a-e, 18-19 neurons/genotype. f, mIPSC traces from L5 pyramidal neurons in acute V1 slices of P21 NL2 cHET and NL2 cKO mice. g, i, Representative cumulative distributions of mIPSC frequency (g) and amplitude (i) from NL2 cHET and NL2 cKO L5 neurons. h, j, Average mIPSC frequency (h) and amplitude (j) from neurons of NL2 cHET and NL2 cKO mice. f-j, 19-20 neurons/genotype. Two sample Kolmogorov–Smirnov test (b, d, g, i), one-sided t-test (c, e, h, j). Data are means ± s.e.m.
Additionally, we detected an increase in the frequency of mIPSCs from the NL2 cKOs compared to cHETs while the amplitudes of mIPSCs were indistinguishable (Fig. 5f-j). The elevated frequency of mIPSCs in NL2 cKOs might be mediated by an increase in the number of inhibitory synapses. If so, loss of astrocytic NL2 more broadly should enhance inhibitory synaptogenesis. Alternatively, the increase in the frequency of mIPSCs might be due to changes in presynaptic release properties of inhibitory synapses. Taken together, these findings reveal a critical and previously unknown role for astrocytic NL2 as an essential governor of excitatory and inhibitory synaptic function in the cortex.
Here, we reveal several unknown cell biological aspects of astrocyte-neuron interactions that control the development of cortical astrocytes and demonstrate a critical function for astrocytic NLs in synaptogenesis. Bidirectional signaling via the astrocytic NL and neuronal Nrx adhesions might directly regulate synapse formation and function. Alternatively, astrocytic NLs might control synaptic connectivity by altering the expression and/or directed release of synaptogenic factors, such as thrombospondins, SPARCL1/Hevin and Glypicans33-35, from astrocytes. Future studies exploring the link between NL-mediated astrocyte-neuron adhesions and the regulation of astrocyte-induced synaptogenesis are necessary to test these possibilities.
Our findings also challenge the assumption that NLs are only functional within neurons of the brain. This is particularly important because gene mutations in NLs, including NL2, are associated with a number of neurological disorders such as autism and schizophrenia36,37. NL dysfunction in disease is postulated to alter the fine balance between inhibition and excitation in the brain38. Here we demonstrate that astrocytic NL2 controls the balance of excitatory and inhibitory synaptic connectivity, indicating that synaptic pathologies associated with NL mutations could originate from astrocytic dysfunction. Intriguingly, a recent study found that glial progenitor cells from schizophrenic patients express significantly lower levels of NL1, NL2, and NL3 compared to controls. When these human glial progenitors were injected into mice, they caused neuronal dysfunction, perturbed animal behavior and yielded abnormal astrocytic morphologies39. In conclusion, our findings reveal how imperative it is to understand the full extent of NL functions in all cell types of the brain to completely comprehend the pathophysiology of these disorders.
Extended Data
Extended Data Figure 1. Astrocyte morphology is developmentally regulated in V1 cortex and occurs in tune with sensory activity.
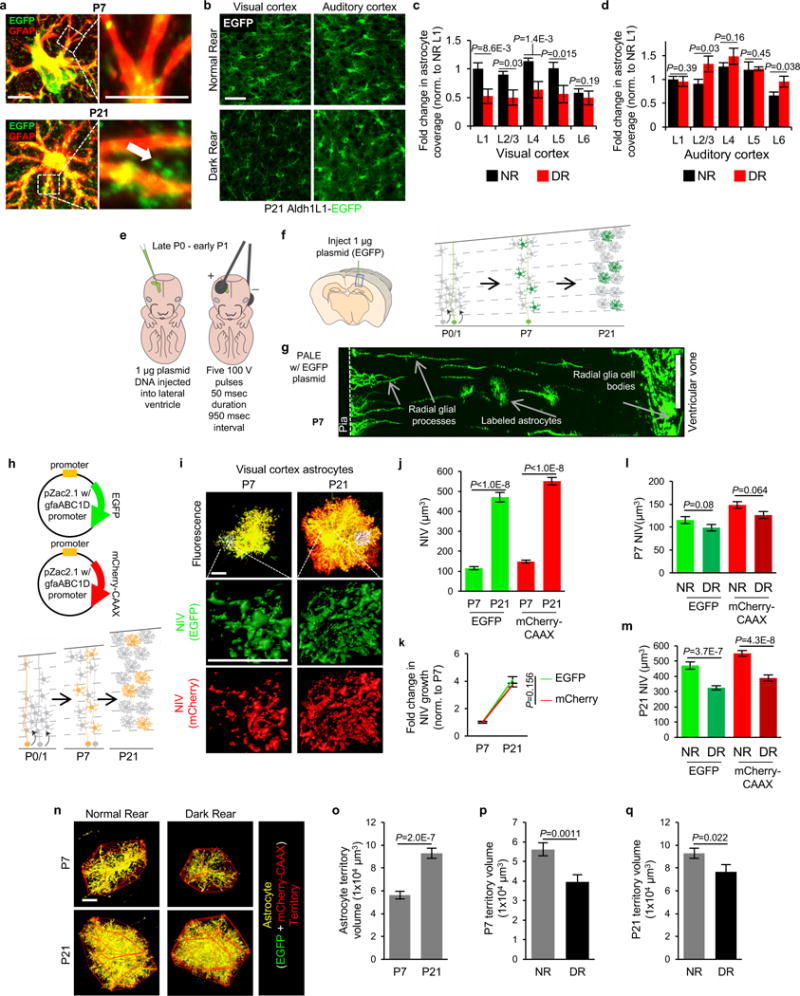
a-d, Dark rearing stunts astrocyte morphogenesis in V1 visual cortex. a, High magnification images of V1 L1 astrocytes from Aldh1L1-EGFP mice labeled with EGFP and GFAP at P7 and P21. Finer EGFP-labeled processes, which emerge by P21, do not stain with GFAP (arrow). b, Representative single optical section confocal images of V1visual cortex (left) and A1 auditory cortex (right) L4 astrocytes from normal rear (NR, top) and dark reared (DR, bottom) Aldh1L1-EGFP mice at P21. c, Fold change in astrocyte coverage of the neuropil in NR and DR mice at each layer of V1 cortex normalized to NR L1. n = 10 ROI/layer, 3 images/mouse, 4 mice/condition. d, Fold change in astrocyte coverage of the neuropil in NR and DR mice at each layer of A1 cortex normalized to NR L1. n = 10 ROI/layer, 3 images/mouse, 4 mice/condition. e-g, Postnatal Astrocyte Labeling by Electroporation (PALE) effectively transfects L4-5 astrocytes with plasmid DNA. e, Schematic of PALE in newborn mice. Late P0 or early P1 mouse pups are sedated by hypothermia and injected with 1 μg plasmid DNA into the lateral ventricle of one hemisphere with a pulled glass pipette. The plasmid solutions are mixed with a small volume of Fast Green dye for visualizing injections. Plasmids used in this study for PALE encoded for EGFP, membrane-targeted mCherry (mCherry-CAAX), shRNAs also encoding EGFP, HA-tagged NL-related constructs, or Cre recombinase. Five pulses of 100V are applied to the mouse head, using tweezer-trodes with the positive terminal situated above one hemisphere of V1 cortex. f, Diagram of PALE injection site and cartoon of V1 cortical development following PALE. Electroporation of plasmids at P0-P1 transfects the radial glial stem cells (light green), which give rise to astrocytes and other glia. At P7, labeled radial glial remnants persist and sparsely labeled developing astrocytes (dark green) are present predominantly in the lower cortical layers, L4-5. Two weeks later, radial glial remnants disappear and labeled mature astrocytes (dark green) are present. g, Representative tile scan image of V1 cortex at P7 following PALE with shCtrl plasmid. Radial glial cell bodies are visible near the ventricular surface. The labeled radial glia extend basal processes dorsally where they branch to form multiple endfeet associated with the pia (dotted line). Labeled astrocytes are dispersed throughout L4-5 of V1 cortex. These labeled astrocytes are imaged by high magnification confocal microscopy for more detailed volumetric analysis. h-q, Dark rearing stunts astrocyte morphogenesis at the single cell level in V1. h, Schematic of PALE to test soluble and membrane-targeted fluorophores in astrocyte neuropil infiltration measurements. pZac2.1_gfaABC1D plasmid vectors expressing EGFP or membrane-targeted mCherry (mCherry-CAAX) reporters under the control of the minimal human GFAP promoter are co-electroporated into P0 WT CD1 mice. Mice are housed in normal (NR) or dark rear (DR) conditions, then sacrificed at P7 or P21. i, Representative high magnification confocal images and neuropil infiltration volume (NIV) reconstructions of PALE V1 cortex L4-5 astrocytes at P7 (left) and P21 (right). EGFP+ (green) and mCherry-CAAX+ (red) astrocytes (co-localized equals yellow) were uploaded to Imaris and their NIV for each fluorophore were 3D reconstructed (middle and bottom). j, Average NIV of V1 L4-5 PALE astrocytes at P7 and P21 for both EGFP and mCherry-CAAX fluorophores. 3 NIV/cell, 18-20 cells/condition, 4 mice/condition. k, Fold change in NIV growth curves from P7 to P21 astrocytes of EGFP and mCherry-CAAX fluorophores, normalized to P7 for each fluorophore. 3 NIV/cell, 18-20 cells/condition, 4 mice/condition. As expected membrane bound fluorescent protein mCherry-CAAX slightly but significantly increased the visualization of astrocyte infiltration into the neuropil (mCherry-CAAX:EGFP; P7 = 1.28±0.07 fold, p-value = 0.001; P21 = 1.17±0.04 fold, p-value = 0.005). l, Average NIV of P7 astrocytes from NR and DR mice using EGFP and mCherry-CAAX fluorophores. 3 NIV/cell, 18-20 cells/condition, 4 mice/condition. m, Average NIV of P21 astrocytes from NR and DR mice using EGFP and mCherry-CAAX fluorophores. 3 NIV/cell, 18-20 cells/condition, 4 mice/condition. n, Representative high magnification confocal images and territory reconstructions of V1 P7 and P21 PALE astrocytes from NR and DR mice. The EGFP and mCherry-CAAX fluorophores (pseudo-colored yellow) were utilized to reconstruct the astrocyte territory (red, see methods and materials for further details). o, Average astrocyte territory volumes of V1 L4-5 PALE astrocytes at P7 and P21. 18-20 cells/condition, 4 mice/condition. p, Average territory volumes of V1 P7 PALE astrocytes from NR and DR mice. 18-20 cells/condition, 4 mice/condition. q, Average territory volumes of V1 P21 PALE astrocytes from NR and DR mice. 18-20 cells/condition, 4 mice/condition. One-sided t-test (c, d, o, p, q), one-way ANOVA (j, l, m), ANCOVA (k). Data are means ± s.e.m. Scale bars, 10 μm (a, i, n), 50 μm (b), 100 μm (g).
Extended Data Figure 2. Direct neuronal contact controls astrocyte morphogenesis in vitro.
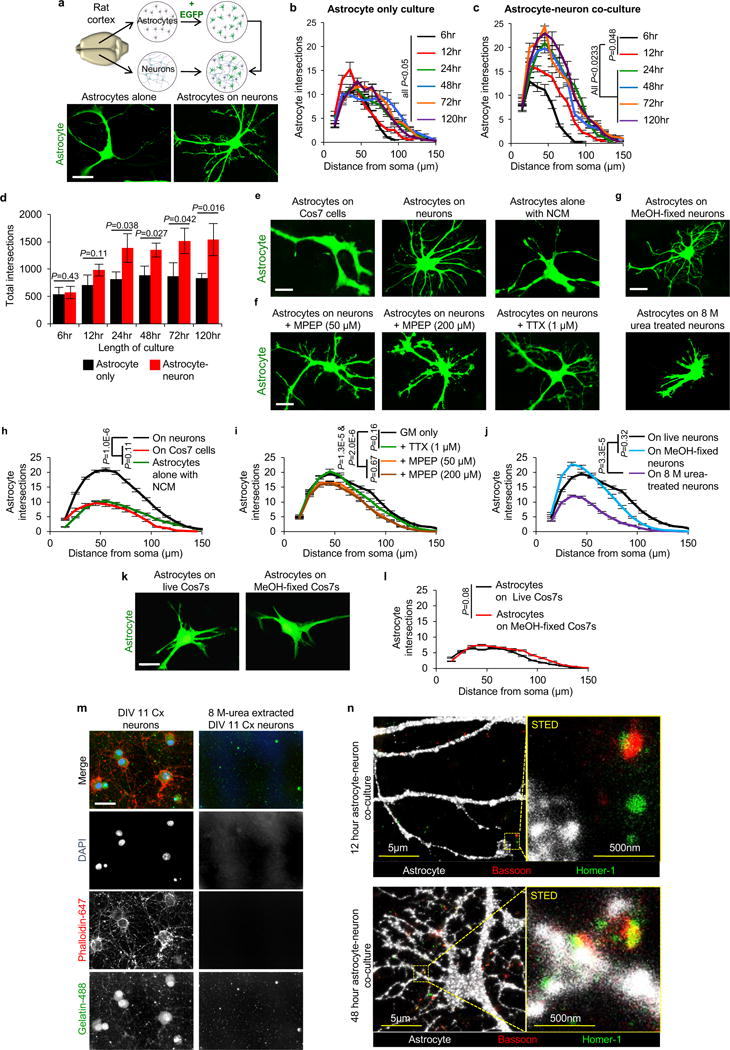
a-d, Neurons induce astrocyte morphogenesis. a, (Top) Diagram of rat co-culture strategy used to test the cellular and molecular mechanisms of astrocyte-neuron interactions. Astrocytes and neurons are independently isolated from rat cortices (see methods and materials for further details). Astrocytes are transfected at DIV9 with plasmid constructs (encoding EGFP, for example) and then trypsinized and plated onto cortical neurons at DIV11. Astrocytes and neurons are co-cultured for 48 hours, unless otherwise indicated. (Bottom) Representative images of astrocytes alone or cultured with neurons (not shown). b, Sholl quantification of EGFP-transfected astrocyte morphology in astrocyte only cultures at the indicated time points. The length of culture only includes the time of culture on PDL and laminin coated coverslips (DIV11+), and not the isolation, purification, or transfection stages (DIV0-11, see methods and materials). c, Sholl quantification of EGFP-transfected astrocyte morphology in co-culture with cortical neurons at the indicated time points. The length of culture only includes the time of co-culture with DIV11 rat cortical neurons and not the astrocyte isolation, purification, or transfection stages (DIV0-11, see methods and materials). d, Quantification of total intersections obtained from Sholl analysis (b-c) of EGFP-transfected astrocytes grown alone (black) or on cortical neurons (red). b-d, Data represent 1 experiment with 3 biological replicates. Similar results were obtained in 2 independent experiments. n>15 cells/condition/experiment. e-n, Direct contact of astrocytes with neurons/synapses regulates astrocyte morphogenesis in vitro. e, Representative images of EGFP-labeled astrocytes co-cultured with Cos7 cells, cortical neurons, or alone with neuron-conditioned media (NCM). f, Representative images of EGFP-labeled astrocytes co-cultured with neurons in the presence of 50 μM or 200 μM MPEP or 1 μM TTX. g, Representative images of EGFP-labeled astrocytes plated on DIV11 methanol (MeOH)-fixed neurons or after neuronal processes were extracted with 8 M urea treatment. h-j, Sholl quantification of astrocyte complexity under different culture conditions from e-g. Data represent 1 experiment with 3 biological replicates. Similar results were obtained in at least 2 independent experiments. n>25 cells/condition/experiment. k, Representative images of EGFP-transfected astrocytes grown on live or MeOH-fixed Cos7 cells. l, Sholl quantification of EGFP-labeled astrocyte complexity from k. Data represent 1 experiment with 3 biological replicates. Similar results were obtained in 2 independent experiments. n>20 cells/condition/experiment. m, Representative images of DIV11 cortical (Cx) neurons, processed normally or after neuronal processes are extracted with 8M urea treatment, stained for the following: DAPI (DNA, blue), Phalloidin-conjugated-647 (filamentous actin/neuronal cell bodies and processes, red), Gelatin-conjugated-Oregon Green-488 (ECM proteins, green). n, Representative Stimulated Emission Depletion (STED) super resolution micrographs of 12-hour and 48-hour astrocyte-neuron co-cultures immunostained for pre- and postsynaptic markers Bassoon (red) and Homer-1 (green), respectively. Membrane targeted EGFP-transfected astrocytes (pseudo-colored white) extend lamellipodia-like structures toward synapses at the 12-hour co-culture time point. By 48-hours co-cultured, astrocyte processes come in very close proximity to synaptic puncta demarcated by the co-localization of Bassoon and Homer-1. ANCOVA (b, c, h, i, j, l), one-tailed t-test (d). Data are means ± s.e.m. Scale bars, 10 μm (a, e, f, g, k, m), 5 μm and 500nm (n).
Extended Data Figure 3. Neuroligins are expressed in astrocytes.
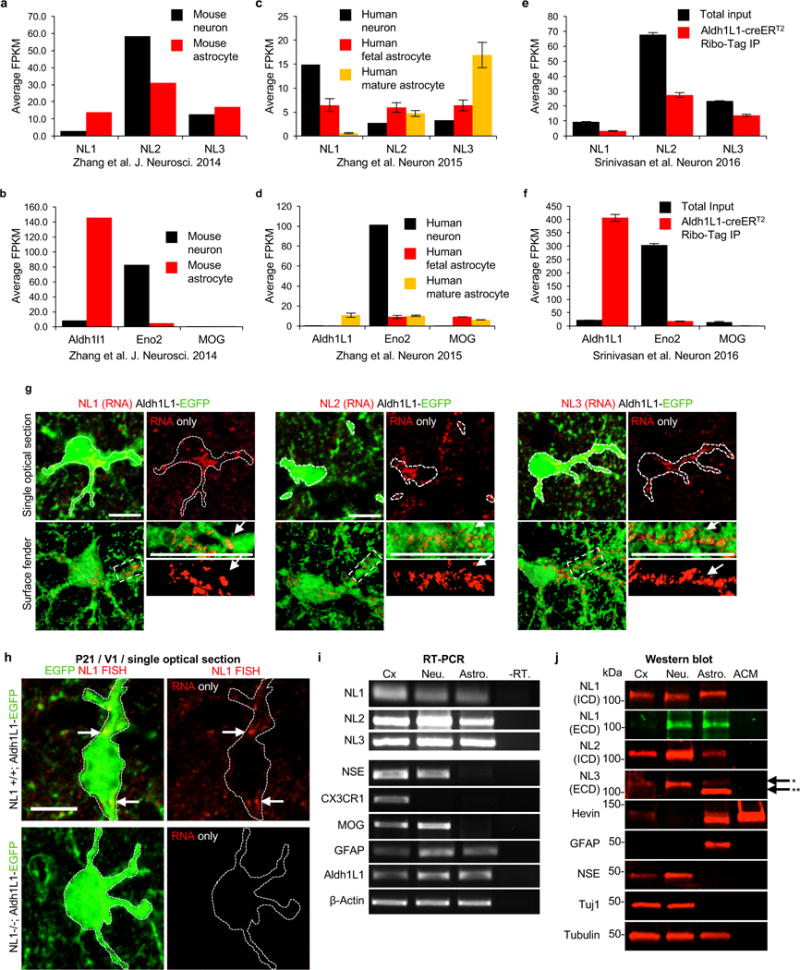
a, Average fragments per kilobase of transcript per million reads (FPKM) of NL mRNAs from RNA-sequencing of P7 mouse neurons (black) and astrocytes (red, all data from13). b, Average FPKM values of cell-type specific transcripts from P7 neurons and astrocytes (Aldh1L1 = astrocyte, Eno2 = neuron, MOG = oligodendrocyte all data from13). c, Average FPKM values of NL mRNAs from 25yr-old human neurons (black), 18-18.5gw (gestational week) fetal astrocytes (red), and 8-63yr-old human mature astrocytes (yellow, all data from14. d, Average FPKM values of cell-type specific transcripts from specimens listed in c (all data from14). e, Average FPKM values of NL mRNAs that are engaged with translating ribosomes from P80 mouse astrocytes (red) and total input (black) using the Aldh1L1-creERT2/Ribo-tag mice (all data from12). f, Average FPKM values of cell-type specific transcripts from specimens listed in e (all data from12). g, Single optical section confocal images (top) and 3D surface renderings (bottom) of fluorescent in-situ hybridization (FISH) experiments of V1 L1 astrocytes (green) from P21 Aldh1L1-EGFP mice. NL1 (left, red), NL2 (middle, red), and NL3 (right, red) mRNAs are detected inside astrocyte somas and large branches (green, outlined). h, Representative images of RNA FISH experiments on NL1+/+ (WT) and NL1-/- (KO) mice also containing the Aldh1L1-EGFP transgene labeling all astrocytes (green). NL1-specific RNA-FISH probes (red) were used to detect NL1 in both genetic backgrounds. Note: significant fluorescence detection inside (dotted line, arrows) and outside NL1 WT astrocytes (top), but no detection of NL1 RNA-FISH signal in NL1 KO tissue sections (bottom). i, RT-PCR amplicons generated using transcript-specific exon-skipping primers. Lanes: P7 rat cortex (Cx), DIV11 rat cortical neuron cultures (Neu.), DIV11 rat cortical astrocyte cultures (Astro.), and DIV11 rat cortical astrocyte cultures without the reverse transcriptase enzyme to control for gDNA contamination (-RT). Specific primers sets were utilized to detect the following transcripts: NL1, NL2, NL3, neuron specific enolase (NSE, neuron control), CX3C chemokine receptor 1 R1 (CX3CR1, microglia control), myelin oligodendrocyte glycoprotein (MOG, oligodendrocyte control), glial fibrillary acid protein (GFAP, astrocyte control), aldehyde dehydrogenase 1 family member 1 (Aldh1L1, astrocyte control), and β-actin (loading control). Astrocyte cultures do not contain detectible neuron, microglial or oligodendrocyte contamination. Cortical neuron cultures contain around 10% glial (astrocyte and oligodendrocyte) contamination. j, Western blot images. Lanes: P7 rat cortex (Cx), DIV11 rat cortical neuron cultures (Neu.), DIV11 rat cortical astrocyte cultures (Astro.), and rat cortical astrocyte-conditioned media (ACM). Specific and validated antibodies were used to detect the following proteins: NL1 intracellular domain (NL1 ICD), NL1 extracellular domain (NL1 ECD), NL2 ICD, NL3 ECD, Hevin (astrocyte-specific secreted protein control), GFAP (intracellular astrocyte specific control), NSE (neuron control), Tuj1 (a.k.a β3-Tubulin neuron control), Tubulin (intracellular protein loading control). Note the presence of two bands for NL3 in the astrocyte sample. Asterisks (*) denotes the expected full length protein. Astrocytes express a lower molecular weight NL3 (**) to a greater extent, but this lower molecular weight product is not present in the ACM, indicating that it is not a secreted NL3 species. For gel source data, see Supplementary Figure 1. Data are means ± s.e.m. Scale bars, 10 μm.
Extended Data Figure 4. NL CAMs control neuron-induced astrocyte morphogenesis.
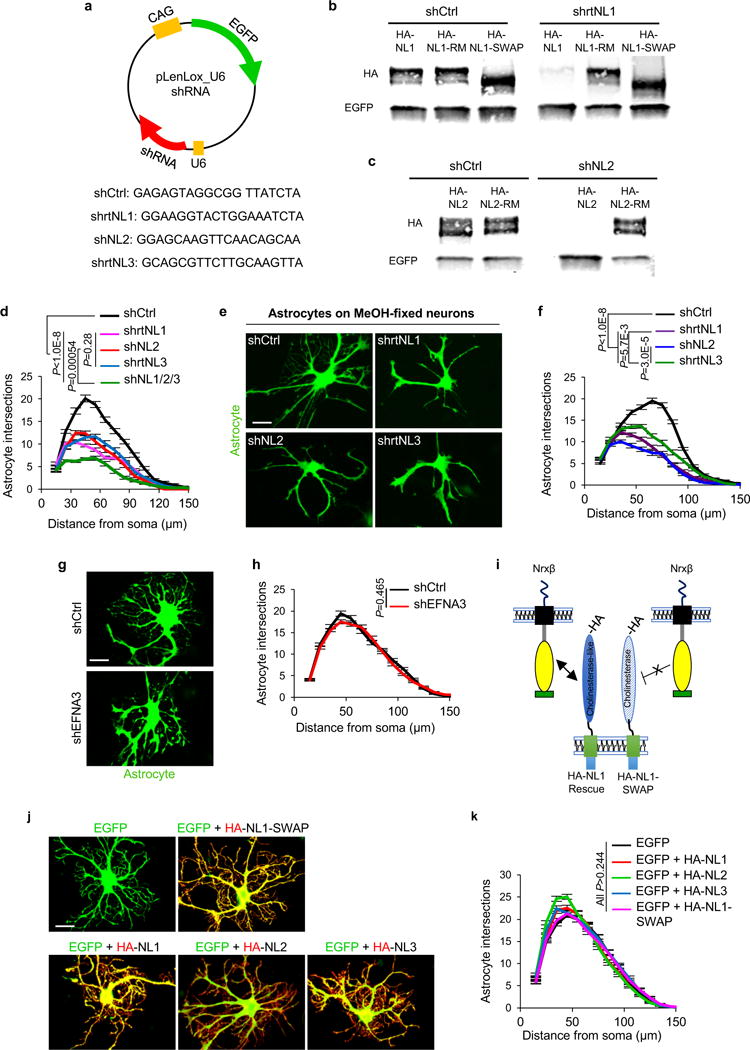
a-c, Specificity of shRNAs against NL sequences. a, Schematic representation of EGFP-expressing shRNA plasmids used to silence rat NLs in vitro. Sequences of shRNAs used on rat astrocytes against NL1, NL2, and NL3, as well as a scrambled shNL1 sequence used as a control (shCtrl). Rat-specific shRNAs against NL1, NL2, and NL3 were previously verified for efficiency and specificity by42,43 shNL2 sequence matches both rat and mouse NL2 sequences and effectively silences NL2 expression in cells from both species (see Extended Data Fig. 6c-d). b, Western blot analyses of cell lysates from HEK293 cells transfected with shCtrl or shrtNL1 with various HA-tagged NL1 constructs. Full length NL1 (HA-NL1) is effectively silenced by the shrtNL1, whereas NL1 shRNA-resistant mutant (HA-NL1-RM) and NL1-SWAP are not silenced by shrtNL1. Note: NL1-SWAP runs smaller than full-length NL1 (previously published in23). c, Western blot analyses of cell lysates from HEK293 cells transfected with shCtrl or shNL2 with HA-tagged NL2 or HA-tagged NL2-RM. Full length NL2 (HA-NL2) is effectively silenced by the shNL2, whereas NL2-RM is not. b, c, Antibodies against HA were used to detect the expression of NLs and the lysates were blotted for using an EGFP-specific antibody to verify transfection with shRNA plasmids. d-k, NLs play significant roles in controlling neuron-induced astrocyte morphogenesis. d, Sholl quantification of astrocyte complexity of NL1, NL2, NL3, or NL1/2/3 silenced astrocytes cultured on cortical neurons (not visible, compare with Fig. 2a-e). Data represent 1 experiment with 3 biological replicates. Similar results were obtained in 3 independent experiments. n>25cells/condition/experiment. e, Representative images of shNL-transfected astrocytes (green) cultured with MeOH-fixed neurons (not visible). f, Sholl quantification of astrocyte complexity of NL-silenced astrocytes cultured on MeOH-fixed neurons. Data represent 1 experiment with 3 biological replicates. Similar results were obtained in 2 independent experiments. n>20 cells/condition/experiment. g, Representative images of transfected astrocytes (green) with shCtrl or an shRNA against EphrinA3 (EFNA3) in co-culture with neurons (not visible). EFNA3 is a CAM expressed in astrocytes that regulates astrocyte-synapse interactions in the hippocampus22. h, Sholl quantification of astrocyte complexity in shCtrl and shEFNA3-transfected astrocytes in co-culture with neurons. Data represent 1 experiment with 3 biological replicates. Similar results were obtained in 2 independent experiments. n>20cells/condition/experiment. i, Cartoon representation of NL1 domain structure. NLs are type-I transmembrane proteins with a large N-terminal extracellular domain (ECD). NL1-ECD contains a cholinesterase (ChoE)-like domain that interacts with Nrxβs transcellularly. In a previous study, a chimera of NL1 (NL1-SWAP) was created in which the ChoE-like domain is swapped for the ChoE sequence. This chimera is efficiently trafficked to the cell surface, but fails to interact transcellularly with Nrx-βs23. j, Representative images of astrocytes over-expressing EGFP (green) and HA-tagged NLs (red) in co-culture with neurons (not visible). NL over-expressing astrocytes do not show any reductions in neuron-induced astrocyte morphogenesis. k, Sholl quantification of astrocyte complexity when over-expressing HA tagged-NLs. Data represent 1 experiment with 3 biological replicates. Similar results were obtained in 2 independent experiments. n>20 cells/condition/experiment. ANCOVA (d, f, h, k). For gel source data, see Supplementary Figure 1. Data are means ± s.e.m. Scale bars, 10 μm.
Extended Data Figure 5. Astrocytic NL1 interacts with neuronal Nrxs to promote astrocyte morphogenesis in vitro.
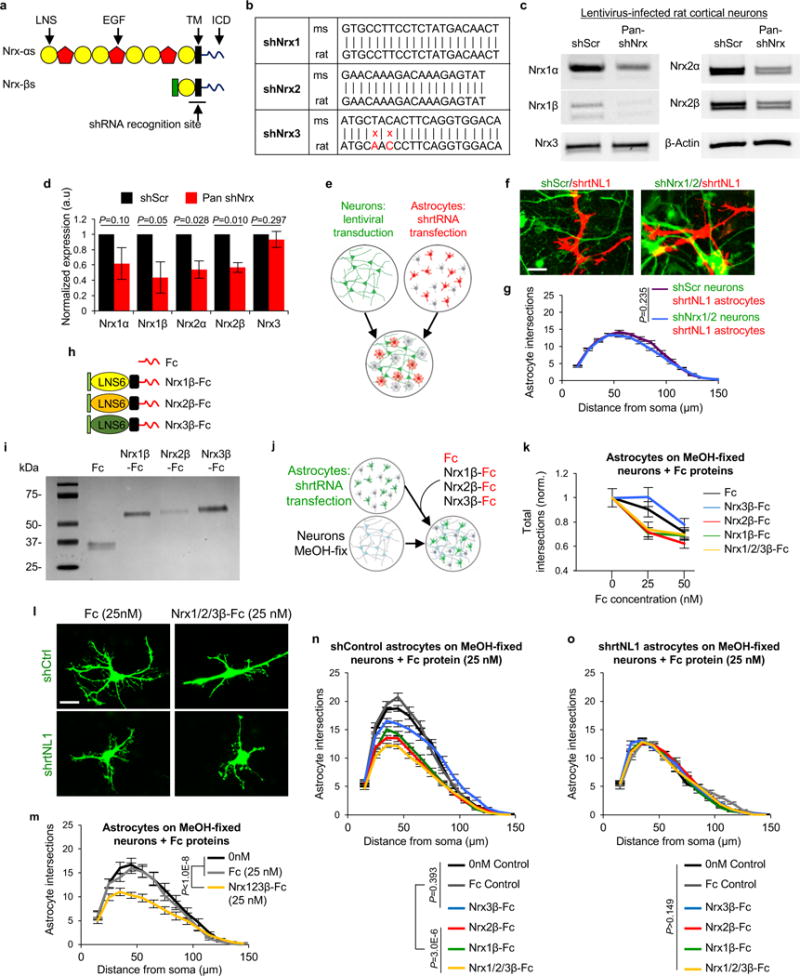
a-d, Lentiviral knockdown of rat Nrx1 and Nrx2. a, Domain structures of Nrxα and Nrxβs. Nrxα and Nrxβs are expressed by alternative promoters and share the same LNS6 (i.e. laminin-α, neurexin and sex hormone-binding globulin 6), transmembrane and intracellular domains. Nrxαs contain five additional LNS domains and three EGF domains in their extracellular region. Gokce et al. generated a lentiviral construct with tandem shRNAs with recognition sequences localized to the LNS6 and TM domains of mouse Nrxs, such that both α and β Nrxs are silenced24. b, shRNA sequences that silence mouse Nrxα and βs from24 compared to the corresponding rat sequences. Based on sequence homology, we predicted that this lentiviral construct would silence rat Nrx1α/β and Nrx2α/β, but not Nrx3α/β due to base-pair mismatches (red). c, RT-PCR amplicons from cortical neurons transduced with a scrambled control lentivirus (shScr) or pan-shNrx lentivirus. Specific primers against Nrx1α, Nrx1β, Nrx2α, Nrx2β, and Nrx3 were used to detect the presence and levels of Nrx transcripts. β-Actin was used as a control. As predicted, pan-shNrx from24 effectively diminished rat Nrx1 and Nrx2 expression but not Nrx3. d, Quantification of Nrx cDNA levels from shScr or pan-shNrx-transduced cortical neurons. c-d, Results are from 2 independent experiments. e-o, Neuronal Nrxs are required to promote astrocyte morphogenesis. e, Diagram of astrocyte-neuron co-culture strategy used to test the requirement of neuronal Nrxs in regulating astrocyte complexity. Neurons are transduced on DIV2 with a lentivirus expressing EGFP and tandem shRNAs that silence rat Nrxs 1 and 2 (green). Astrocytes are transfected with shRNA plasmids, which also encode mCherry, on DIV9 and then plated with neurons on DIV11 for 48 hours. f, Representative images of shrtNL1 mCherry-transfected astrocytes (red) in co-culture with shNrx1/2 or shScr lentivirus-transduced neurons (green). g, Sholl quantification of astrocyte complexity in shrtNL1-transfected astrocytes in co-culture with shScr or shNrx1/2-transduced neurons. Data represent 1 experiment with 3 biological replicates. Similar results were obtained in 2 independent experiments. n>25 cells/condition/experiment. h, Schematic of soluble Fc-tagged Nrxβ ectodomains. Recombinant Fc-only and Nrx1β-Fc proteins were previously described42. For this study, we generated recombinant constructs to express and purify Nrx2β-Fc and Nrx3β-Fc proteins (see materials and methods for more details). i, Coomassie staining shows the molecular weight and purity of the recombinant Fc-tagged proteins. Note that Nrx2β-Fc stains weakly with coomasie dye most likely due to fewer positively charged amino acids compared to Nrx1β-Fc and Nrx3β-Fc. j, Schematic of in vitro experiments testing the requirement of Nrx-NL interactions in control of astrocyte complexity. shRNA EGFP-transfected astrocytes are plated onto MeOH-fixed neurons in the presence or absence of soluble Fc-tagged Nrxβ-ectodomain proteins or control Fc protein. k, Quantification of astrocyte complexity grown on MeOH-fixed neurons with or without Fc-tagged proteins added at various concentration. Total Sholl intersections are plotted as a function of increasing Fc-tagged protein concentration (normalized to 0 nM). In this assay, Fc protein concentrations above 25 nM stunted astrocyte morphogenesis non-specifically; thus, all experiments were conducted at 25 nM concentration. Data represent 1 experiment with 3 biological replicates. Similar results were obtained in 2 independent experiments. n>25 cells/condition/experiment. l, Representative images of shCtrl or shrtNL1-transfected astrocytes (green) cultured with MeOH-fixed neurons (not visible) in the presence of 25 nM Fc (control) or 25 nM Nrx1β-, 2β- and 3β-Fc proteins (8.3 nM concentration each, total of 25nM). m, Sholl quantification of astrocytes cultured on MeOH-fixed neurons with or without recombinant Fc proteins (25 nM total concentration). Data represent 1 experiment with 3 biological replicates. Similar results were obtained in 2 independent experiments. n>25cells/condition/experiment. n, Sholl quantification of shCtrl-transfected astrocytes cultured on MeOH-fixed neurons supplemented with recombinant Fc proteins (25 nM total concentration). Data represent 1 experiment with 3 biological replicates. Similar results were obtained in 2 independent experiments. n>25cells/condition/experiment. o, Sholl quantification of shrtNL1-transfected astrocytes cultured on MeOH-fixed neurons supplemented with recombinant Fc proteins (25 nM total concentration). Data represent 1 experiment with 3 biological replicates. Similar results were obtained in 2 independent experiments. n>25cells/condition/experiment. one-tailed t-test (d), ANCOVA (g, k, m, n, o). For gel source data, see Supplementary Figure 1. Data are means ± s.e.m. Scale bars, 10 μm.
Extended Data Figure 6. Astrocytic NLs controls astrocyte morphogenesis in vivo.
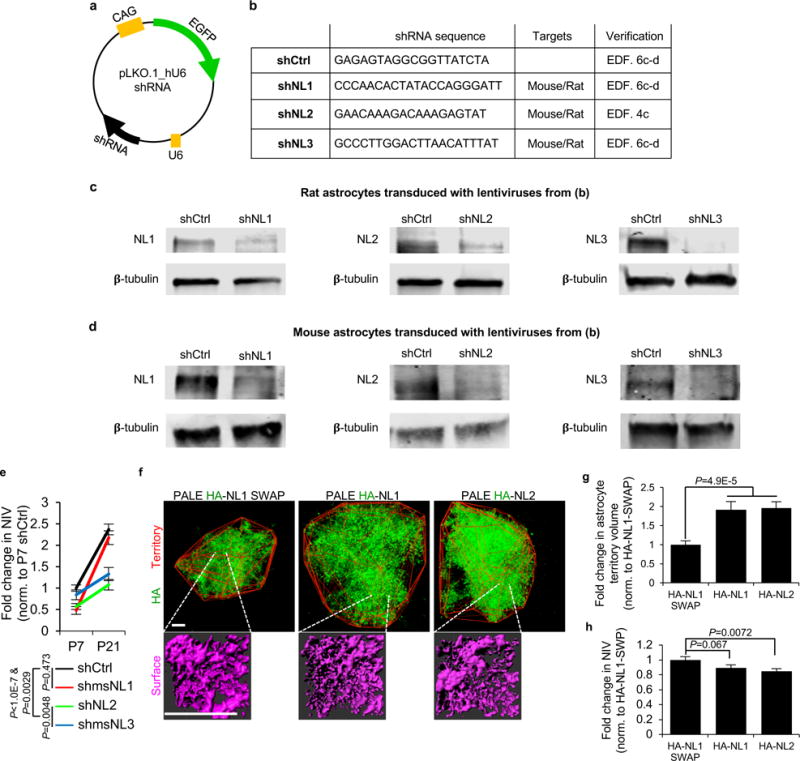
a-d, Verification of shRNAs used in vivo. a, Schematic of pLKO.1_hU6 plasmid vector housing the shRNA sequence and EGFP-reporter. shRNA constructs targeting both mouse and rat NL1 and NL3 transcripts were obtained from Dharmacon. shNL2 used was in42,43 which effectively silences both mouse and rat NL2. In this plasmid backbone, the shRNA expression is driven from the human U6 minimal promoter. The commercially available plasmids do not encode for a fluorescent protein reporter; therefore, we cloned EGFP under the control of a CAG promoter (see methods and materials for details). b, shRNA sequences used to silence mouse NLs for PALE. Due to perfect match with the rat sequences, the same shRNAs also target rat NLs. shNL1 and shNL3 targeting vectors were verified here. shNL2 was verified in this study (see Extended Data Fig. 4c) and by42,43. c-d, Western blot analysis of lysates from cultured rat (c) or mouse (d) astrocytes transduced with lentiviruses expressing shCtrl or shNLs. The shNLs effectively silenced the expression of endogenous NL1 (left), NL2 (middle) and NL3 (right) both in rat and mouse astrocytes. β-tubulin levels are shown as a loading control. Blots represent 1 experiment. Similar results were obtained from 3 separate experiments. e-h, Astrocytic NLs control astrocyte morphogenesis in vivo. e, Data from Fig. 3e and Fig. 3f normalized to P7 shCtrl astrocyte NIV values and replotted to determine how NL silencing affects the growth trajectory of astrocyte NIV. shNL2 and shNL3-transfected astrocytes failed to expand their neuropil infiltration from P7 to P21, whereas shCtrl and shNL1-transfected astrocytes displayed a robust (~2.5 fold) growth. 3 NIV/cell, 10-20 cells/condition, at least 3 mice/condition. f, (Top) Representative images of P21 NL-over expressing PALE astrocytes from L4-5 V1 cortex. The territories of the NL over-expressing PALE astrocytes were determined in Imaris Bitplane software with a Matlab Xtension. This method identifies the terminal fluorescent points of each astrocyte and connects these points to generate the territory of each cell (red outline). (Bottom) Representative NIV (magenta) for NL over-expressing PALE astrocytes. g, Fold change in average territory volume of NL1 or NL2 over-expressing PALE astrocytes normalized to HA-NL1-SWAP. In the brains from three cohorts of 7 PALE NL3 over-expressing mice, we were unable to find NL3-overexpressing astrocytes at P21, indicating that NL3-overexpression starting at P1 is not compatible with astrocyte survival and/or maturation. h, Fold change in average NIV of NL over-expressing PALE astrocytes normalized to HA-NL1-SWAP. Astrocytes might already occupy the available neuropil space; thus, NL over-expression primarily forces astrocyte to expand. Alternatively, each NL might direct astrocyte processes to certain neuronal elements; thus, NL over-expression drives the astrocyte towards such structures, expanding their domains. g-h, 3 NIV/cell (h only), 14-20 cells/condition, 4 mice/condition. ANCOVA (e), one-way ANOVA (g, h). For gel source data, see Supplementary Figure 1. Data are means ± s.e.m. Scale bars, 10 μm.
Extended Data Figure 7. NL2 protein is expressed in astrocytes and is required for neuropil infiltration in vivo.
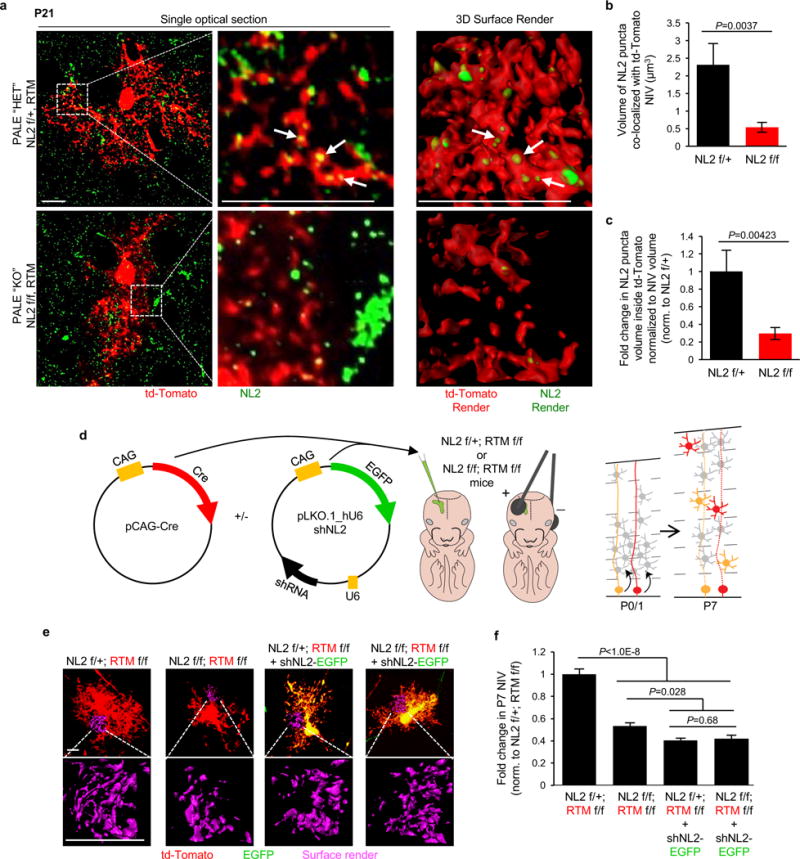
a-c, NL2 protein staining in NL2 PALE HET and KO astrocytes. a, Representative high magnification Airyscan confocal images of P21 td-Tomato/Cre+ PALE astrocytes from NL2 HET f/+ (top) and NL2 KO f/f (bottom) mice immunostained using an antibody against the intracellular domain of NL2. (Left) Single optical section of the td-Tomato/Cre+ astrocytes depicting NL2 staining (green) and td-Tomato/Cre+ astrocyte (red). (Middle) Zoomed-in single optical section blow up of boxed region from left. (Right) Representative Imaris 3D reconstructed surface renderings of the co-localized NL2 (green) and td-Tomato/Cre+ (red) signals in NL2 HET f/+ and NL2 KO f/f astrocytes (NL2 signal outside of the td-Tomato/Cre+ cell is not surface rendered). b, Quantification of average NL2 puncta volume inside td-Tomato/Cre+ NIV of PALE NL2 HET f/+ and NL2 KO f/f astrocytes. c, Fold change of NL2 puncta volume per td-Tomato/Cre+ volume, normalized to NL2 HET f/+. b-c, 2 NIV/image, 3 cells/mouse, 3 mice/genotype. d-f, shNL2 has no off-target effects in astrocytes in vivo. d, Approach to test the specificity of shNL2 in vivo. pCAG-Cre plasmid was injected with or without the shNL2 plasmid into P1 NL2 f/+ or NL2 f/f pups that also contained two copies of the RTM reporter. Animals were sacrificed at P7 for astrocyte morphological analysis. e, Representative images of P7 td-Tomato/Cre+ astrocytes (red) or co-expressing shNL2 (green and red, appears as yellow) from PALE NL2 HET f/+ and NL2 KO f/f mice. Representative NIV are shown below each astrocyte (magenta). f, Fold change in average NIV of P7 td-Tomato/Cre+ PALE NL2 HET f/+ and NL2 KO f/f astrocytes with or without shNL2, normalized to td-Tomato/Cre+ PALE NL2 f/+. 3 NIV/cell, 16 cells/conditions, at least 2 mice/genotype. one-tailed t-test (b-c), one-way ANOVA (f). Data are means ± s.e.m. Scale bars, 10 μm.
Extended Data Figure 8. Controls determining the specificity of synaptic immunohistochemistry.
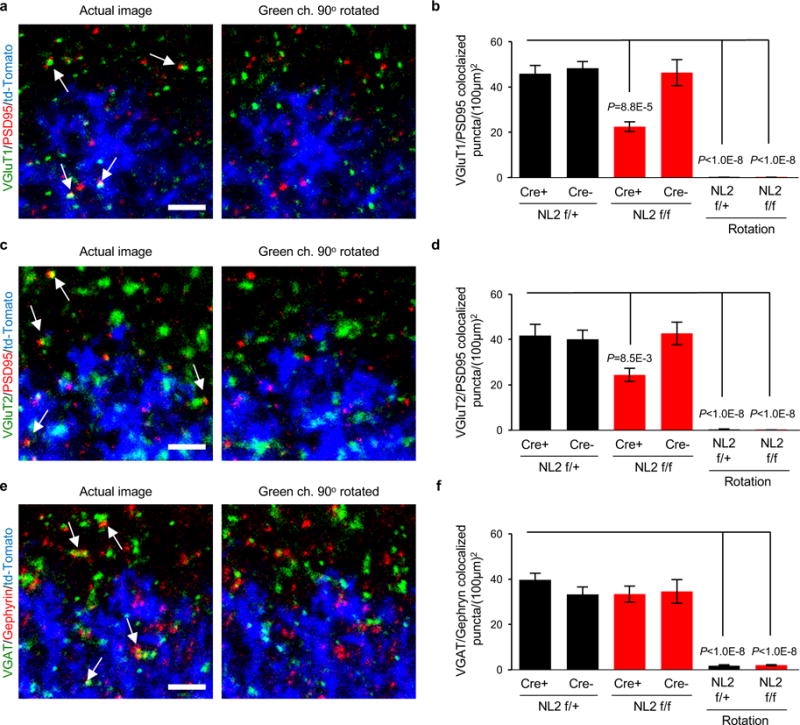
a-f, To test if synaptic immunostaining reflects true protein localization or random signal, a rotation analysis was performed as previously described in42. In this test, the presynaptic channel was rotated 90° respective of the other two channels and re-merged to create a rotated image. Synapse density quantifications were re-run using the rotated image compared to the standard image. a, c, e, Representative images of standard and rotated images stained for excitatory VGluT1 (red)/PSD95 (green) (a), excitatory VGluT2 (red)/PSD95 (green) (c), and inhibitory VGAT (red)/Gephyrin (green) (e) synaptic staining. Images depict the territory boundary of td-Tomato/Cre+ (blue) astrocytes and td-Tomato/Cre- WT (unlabeled) astrocytes. b, d, f, Quantification of co-localized synaptic puncta density of standard and rotated images from excitatory VGluT1/PSD95, excitatory VGluT2 (red)/PSD95 (green) (c), and inhibitory VGAT (red)/Gephyrin (green) (e) synaptic staining. Standard images (left 4 bars) compared to the rotated images (right 2 bars). One-way ANOVA (b, d, f). Data are means ± s.e.m. Scale bar, 2 μm.
Extended Data Figure 9. Generation and verification of NL2 conditional knockout mice.

a-b, Generating astrocyte-specific conditional NL2 knockout mice using the tamoxifen-inducible GLAST-CreERT2 transgenic mouse line. a, (Top) NL2 (f/+) conditional heterozygous (NL2 cHET) and (f/f) conditional knockout (NL2 cKO) mice each contain a single copy of the GLAST-CreERT2 transgene (tg/0) and the RTM reporter (f/+). (Bottom) Experimental timeline of tamoxifen-induced recombination of Cre-dependent loci (NL2 flox and RTM) in combination with the GLAST-CreERT2 transgene. Cre recombination was activated by administering 0.6mg tamoxifen twice at P10 and P11 via intraperitoneal injections to achieve widespread deletion of NL2 in astrocytes. b, Representative sagittal tile-scan confocal images of the forebrains of P21 NL2 cHET and NL2 cKO mice. td-Tomato/Cre+ cells (red) are visible in all regions of the forebrain. A higher magnification image of the V1 cortex is shown in the dotted box. >50% of cortical astrocytes in V1 are td-Tomato/Cre+ (see Extended Data Fig. 10 for quantifications and details). Anterior, posterior, dorsal, ventral (A, P, D, V, respectively). c-d, Work flow for isolating td-Tomato/Cre+ cells by fluorescence activated cell sorting (FACS) c, Experimental flow chart demonstrating the isolation and analysis of td-Tomato/Cre+ cells from the cortices of NL2 cHET and NL2 cKO animals via FACS. Cortices were microdissected, papain digested, and a single cell suspension was generated. The cell suspension was passed through a BD FACS sorter to sequester and capture td-Tomato/Cre+ cells. RNA was isolated from the td-Tomato+ cells, reverse transcribed to cDNA, then quantified by qPCR. In separate experiments, genomic DNA (gDNA) was isolated from td-Tomato/Cre+ FACS samples to verify Cre-mediated recombination by PCR. d, Representative contour plots of NL2 cHET and cKO FACS analysis. Total single cell suspension input was sorted and gaited for td-Tomato fluorescence intensity (x-axis). The high td-Tomato+ cluster (red, boxed) was sorted into fresh tubes for RNA or gDNA extraction. e-i, Verification of the loss of NL2 in NL2 cKO astrocytes. e, qPCR quantification of gene transcript levels of GFAP, NL1, NL2 and NL3 in td-Tomato/Cre+ cells from NL2 cHET (black) and cKO (red) mice isolated by FACS. Expression is shown as a fold change normalized to NL2 cHET values. 3-4 mice/genotype. f, Schematic for genotyping the WT “non-recombined” alleles of NL2. The NL2 WT and floxed alleles have seven exons (labeled 1-7, yellow boxes). The NL2 floxed allele contains two LoxP sites (green triangles) that flank exons 3-5. To PCR verify the non-Cre-mediated recombination of the NL2 locus, a reverse primer that base pairs with a region inside exon 3 is combined with a common forward primer that pairs with the DNA inside intron 2. The expected band sizes produced by the NL2 WT and floxed allele are 413bp and ~500bp, respectively. g, Representative non-recombined PCR gel with the following samples: water (control), tail samples from NL2 +/+, NL2 f/+, and NL2 f/f mice, and td-Tomato/Cre+ FACS samples from NL2 cHET and NL2 cKO brains. The WT and floxed alleles are depicted (arrows). h, Schematic for genotyping the knockout recombined alleles of NL2. To PCR verify the Cre-mediated recombination of the NL2 locus, a reverse primer that base pairs with a region downstream of the second LoxP site inside intron 5 is combined with the common forward primer. The Cre-mediated recombined NL2 locus will produce a ~250bp band. The non-recombined alleles (WT and non-recombined floxed alleles) will not produce a band small enough for detection. i, Representative Cre-mediated recombined PCR gel with the following samples: water (control), tail samples from NL2 +/+, NL2 f/+, and NL2 f/f mice, and td-Tomato+ FACS samples from NL2 cHET and NL2 cKO brains. For gel source data, see Supplementary Figure 1. One-tailed t-test (e). Data are means ± s.e.m. Scale bar, 1 mm.
Extended Data Figure 10. Conditional deletion of NL2 in astrocytes does not alter cell number or distribution.
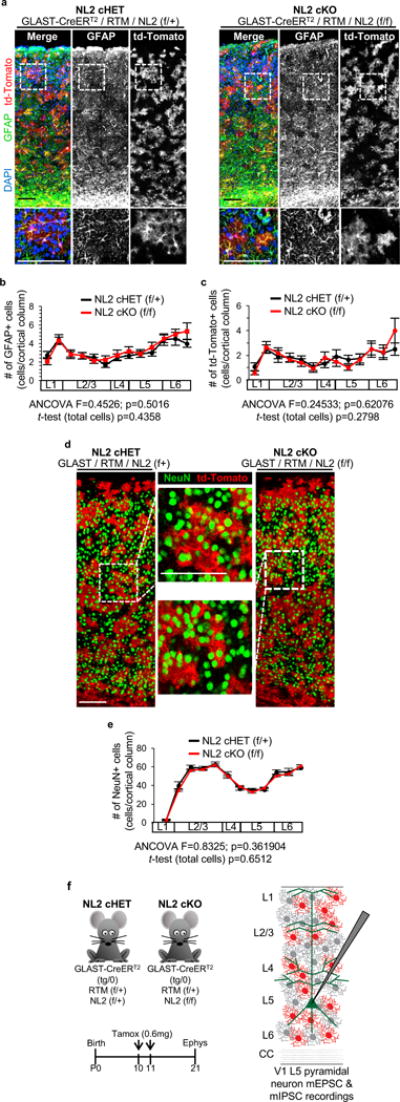
a-c, The number of astrocytes and td-Tomato/Cre+ cells are similar between NL2 cHET and cKO mice. a, Representative tile scan images of V1 cortex from NL2 cHET and NL2 cKO mice stained for GFAP (astrocyte marker, green), td-Tomato/Cre+ cells (red), and DAPI (blue). High magnification of selected regions is shown below each image (dotted box). >99% of td-Tomato/Cre+ cells stain positive for GFAP. b, Quantification of the number and distribution of V1 cortex GFAP+ astrocytes in NL2 cHET and cKO mice. The number of GFAP+ cells is plotted as a function of cortical layer (L1-6) in which they reside. The percent of GFAP/td-Tomato double positive cells in NL2 cHET and cKO mice is not significantly different (NL2 cHET = 58.7±4.0%; NL2 cKO = 53.9±4.4%, P=0.31483). 3-4 images/mouse, 3 mice/genotype. c, Quantification of the number and distribution of td-Tomato/Cre+ cells from NL2 cHET and cKO mice in V1 cortex. The number of td-Tomato/Cre+ cells is plotted as a function of cortical layer. 3-4 V1 images/mouse, 3 mice/genotype. d, Representative tile scan images of V1 cortex from NL2 cHET and cKO mice stained for NeuN (neuronal marker, green) and td-Tomato/Cre+ cells (red). High magnification of selected regions is shown in dotted boxes. The percentage of NeuN/td-Tomato double positive cells was extremely low, confirming that Cre recombination is specific to astrocytes in V1 cortex (number of NeuN/td-Tomato double positive cells/genotype was: NL2 cHET = 36 double positive cells out of 13,903 NeuN+ cells counted (0.26%); NL2 cKO = 36 double positive cells out of 13,504 NeuN+ cells counted (0.25%). e, Quantification of the number and distribution of NeuN+ neurons from NL2 cHET and cKO mice. The number of NeuN+ cells is plotted as function of cortical layer in which they reside. 3-4 images/mouse, 3 mice/genotype. f, (Top, left) NL2 cHET and cKO mice used to test excitatory and inhibitory synaptic function. (Bottom, left) Experimental timeline of tamoxifen-induced recombination of Cre-dependent loci (NL2 flox and RTM) in combination with the GLAST-CreERT2 transgene. Cre was activated by administering 0.6mg tamoxifen at P10 and P11 via intraperitoneal injections to achieve widespread deletion of NL2 in astrocytes. (Right) Schematic representation of electrophysiological recording experiments performed on L5 V1 pyramidal neurons from NL2 cHET and cKO mice. L5 pyramidal neurons receive excitatory and inhibitory synaptic connections from all cortical layers which contain td-Tomato/Cre+ (red) and td-Tomato/Cre- (gray) astrocyte. Miniature excitatory and inhibitory postsynaptic currents (mEPSC and mIPSC, respectively) were recorded from L5 pyramidal neurons using acute slices of P21 NL2 cHET and cKO mice containing the V1 cortex. ANCOVA (b, c, e). Data are means ± s.e.m. Scale bars, 100 μm.
Supplementary Material
Acknowledgments
This work was supported by grants from the National Institutes of Health (RO1 DA031833 C.E., RO1 DE022743 R.R.J, F31 NS092419, J.A.S.) and Holland Trice Brain Research Award to (C.E.). K.T.B. was supported by Foerster-Bernstein Family and the Hartwell Foundation. We thank the NHLBI light microscopy core for STED imaging. We thank Drs. N. Allen, M. Bagnat, D. Silver and S. Soderling, for critical reading of the manuscript.
Footnotes
Data Availability
The data that support the findings of this study are included in the manuscript. Figures that include source data are figures 1-5 and extended data figures 1-10.
Supplementary Information is linked to the online version of the paper at www.nature.com/nature.
Author Contributions:
J.A.S. and C.E. designed the experiments and wrote the paper. All authors reviewed and edited the manuscript. J.A.S. performed experiments and analyzed data. J.A.S. and J.R. performed immunohistochemistry and cell/synapse count analysis. R-R.J. designed and D.L. and Y.K. performed and analyzed the electrophysiology experiments. J.A.S. and K.T.B. performed western blot analysis. J.A.S., E.E., and T.E. performed in vitro experiments and analysis.
Competing Financial Interests:
The authors declare no competing financial interests.
References
- 1.Clarke LE, Barres BA. Emerging roles of astrocytes in neural circuit development. Nat Rev Neurosci. 2013;14:311–321. doi: 10.1038/nrn3484. [DOI] [PMC free article] [PubMed] [Google Scholar]
- 2.Khakh BS, Sofroniew MV. Diversity of astrocyte functions and phenotypes in neural circuits. Nat Neurosci. 2015;18:942–952. doi: 10.1038/nn.4043. [DOI] [PMC free article] [PubMed] [Google Scholar]
- 3.Ma Z, Stork T, Bergles DE, Freeman MR. Neuromodulators signal through astrocytes to alter neural circuit activity and behaviour. Nature. 2016;539:428–432. doi: 10.1038/nature20145. [DOI] [PMC free article] [PubMed] [Google Scholar]
- 4.Oberheim NA, et al. Uniquely hominid features of adult human astrocytes. J Neurosci. 2009;29:3276–3287. doi: 10.1523/JNEUROSCI.4707-08.2009. [DOI] [PMC free article] [PubMed] [Google Scholar]
- 5.Freeman MR. Specification and morphogenesis of astrocytes. Science. 2010;330:774–778. doi: 10.1126/science.1190928. [DOI] [PMC free article] [PubMed] [Google Scholar]
- 6.Burda JE, Sofroniew MV. Reactive gliosis and the multicellular response to CNS damage and disease. Neuron. 2014;81:229–248. doi: 10.1016/j.neuron.2013.12.034. [DOI] [PMC free article] [PubMed] [Google Scholar]
- 7.Stichel CC, Muller CM, Zilles K. Distribution of glial fibrillary acidic protein and vimentin immunoreactivity during rat visual cortex development. J Neurocytol. 1991;20:97–108. doi: 10.1007/BF01279614. [DOI] [PubMed] [Google Scholar]
- 8.Morel L, Higashimori H, Tolman M, Yang Y. VGluT1+ neuronal glutamatergic signaling regulates postnatal developmental maturation of cortical protoplasmic astroglia. J Neurosci. 2014;34:10950–10962. doi: 10.1523/JNEUROSCI.1167-14.2014. [DOI] [PMC free article] [PubMed] [Google Scholar]
- 9.Cahoy JD, et al. A transcriptome database for astrocytes, neurons, and oligodendrocytes: a new resource for understanding brain development and function. J Neurosci. 2008;28:264–278. doi: 10.1523/JNEUROSCI.4178-07.2008. [DOI] [PMC free article] [PubMed] [Google Scholar]
- 10.Li M, et al. Synaptogenesis in the developing mouse visual cortex. Brain Res Bull. 2010;81:107–113. doi: 10.1016/j.brainresbull.2009.08.028. [DOI] [PubMed] [Google Scholar]
- 11.Akerman CJ, Smyth D, Thompson ID. Visual experience before eye-opening and the development of the retinogeniculate pathway. Neuron. 2002;36:869–879. doi: 10.1016/s0896-6273(02)01010-3. [DOI] [PubMed] [Google Scholar]
- 12.Srinivasan R, et al. New Transgenic Mouse Lines for Selectively Targeting Astrocytes and Studying Calcium Signals in Astrocyte Processes In Situ and In Vivo. Neuron. 2016;92:1181–1195. doi: 10.1016/j.neuron.2016.11.030. [DOI] [PMC free article] [PubMed] [Google Scholar]
- 13.Zhang Y, et al. An RNA-sequencing transcriptome and splicing database of glia, neurons, and vascular cells of the cerebral cortex. J Neurosci. 2014;34:11929–11947. doi: 10.1523/JNEUROSCI.1860-14.2014. [DOI] [PMC free article] [PubMed] [Google Scholar]
- 14.Zhang Y, et al. Purification and Characterization of Progenitor and Mature Human Astrocytes Reveals Transcriptional and Functional Differences with Mouse. Neuron. 2016;89:37–53. doi: 10.1016/j.neuron.2015.11.013. [DOI] [PMC free article] [PubMed] [Google Scholar]
- 15.Bemben MA, Shipman SL, Nicoll RA, Roche KW. The cellular and molecular landscape of neuroligins. Trends Neurosci. 2015;38:496–505. doi: 10.1016/j.tins.2015.06.004. [DOI] [PMC free article] [PubMed] [Google Scholar]
- 16.Baudouin S, Scheiffele P. SnapShot: Neuroligin-neurexin complexes. Cell. 2010;141:908, 908 e901. doi: 10.1016/j.cell.2010.05.024. [DOI] [PubMed] [Google Scholar]
- 17.Craig AM, Kang Y. Neurexin-neuroligin signaling in synapse development. Curr Opin Neurobiol. 2007;17:43–52. doi: 10.1016/j.conb.2007.01.011. [DOI] [PMC free article] [PubMed] [Google Scholar]
- 18.Venkatesh HS, et al. Neuronal Activity Promotes Glioma Growth through Neuroligin-3 Secretion. Cell. 2015;161:803–816. doi: 10.1016/j.cell.2015.04.012. [DOI] [PMC free article] [PubMed] [Google Scholar]
- 19.Samarelli AV, et al. Neuroligin 1 induces blood vessel maturation by cooperating with the alpha6 integrin. J Biol Chem. 2014;289:19466–19476. doi: 10.1074/jbc.M113.530972. [DOI] [PMC free article] [PubMed] [Google Scholar]
- 20.Proctor DT, et al. Axo-glial communication through neurexin-neuroligin signaling regulates myelination and oligodendrocyte differentiation. Glia. 2015 doi: 10.1002/glia.22875. [DOI] [PubMed] [Google Scholar]
- 21.Graf ER, Zhang X, Jin SX, Linhoff MW, Craig AM. Neurexins induce differentiation of GABA and glutamate postsynaptic specializations via neuroligins. Cell. 2004;119:1013–1026. doi: 10.1016/j.cell.2004.11.035. [DOI] [PMC free article] [PubMed] [Google Scholar]
- 22.Murai KK, Nguyen LN, Irie F, Yamaguchi Y, Pasquale EB. Control of hippocampal dendritic spine morphology through ephrin-A3/EphA4 signaling. Nat Neurosci. 2003;6:153–160. doi: 10.1038/nn994. [DOI] [PubMed] [Google Scholar]
- 23.Dean C, et al. Neurexin mediates the assembly of presynaptic terminals. Nat Neurosci. 2003;6:708–716. doi: 10.1038/nn1074. [DOI] [PMC free article] [PubMed] [Google Scholar]
- 24.Gokce O, Sudhof TC. Membrane-tethered monomeric neurexin LNS-domain triggers synapse formation. J Neurosci. 2013;33:14617–14628. doi: 10.1523/JNEUROSCI.1232-13.2013. [DOI] [PMC free article] [PubMed] [Google Scholar]
- 25.Liang J, et al. Conditional neuroligin-2 knockout in adult medial prefrontal cortex links chronic changes in synaptic inhibition to cognitive impairments. Mol Psychiatry. 2015;20:850–859. doi: 10.1038/mp.2015.31. [DOI] [PubMed] [Google Scholar]
- 26.Madisen L, et al. A robust and high-throughput Cre reporting and characterization system for the whole mouse brain. Nat Neurosci. 2010;13:133–140. doi: 10.1038/nn.2467. [DOI] [PMC free article] [PubMed] [Google Scholar]
- 27.Baldwin KT, Eroglu C. Molecular mechanisms of astrocyte-induced synaptogenesis. Curr Opin Neurobiol. 2017;45:113–120. doi: 10.1016/j.conb.2017.05.006. [DOI] [PMC free article] [PubMed] [Google Scholar]
- 28.Poulopoulos A, et al. Neuroligin 2 drives postsynaptic assembly at perisomatic inhibitory synapses through gephyrin and collybistin. Neuron. 2009;63:628–642. doi: 10.1016/j.neuron.2009.08.023. [DOI] [PubMed] [Google Scholar]
- 29.Varoqueaux F, et al. Neuroligins determine synapse maturation and function. Neuron. 2006;51:741–754. doi: 10.1016/j.neuron.2006.09.003. [DOI] [PubMed] [Google Scholar]
- 30.Wang Y, et al. Norrin/Frizzled4 signaling in retinal vascular development and blood brain barrier plasticity. Cell. 2012;151:1332–1344. doi: 10.1016/j.cell.2012.10.042. [DOI] [PMC free article] [PubMed] [Google Scholar]
- 31.Liddelow SA, et al. Neurotoxic reactive astrocytes are induced by activated microglia. Nature. 2017;541:481–487. doi: 10.1038/nature21029. [DOI] [PMC free article] [PubMed] [Google Scholar]
- 32.Harris KD, Shepherd GM. The neocortical circuit: themes and variations. Nat Neurosci. 2015;18:170–181. doi: 10.1038/nn.3917. [DOI] [PMC free article] [PubMed] [Google Scholar]
- 33.Allen NJ, et al. Astrocyte glypicans 4 and 6 promote formation of excitatory synapses via GluA1 AMPA receptors. Nature. 2012;486:410–414. doi: 10.1038/nature11059. [DOI] [PMC free article] [PubMed] [Google Scholar]
- 34.Christopherson KS, et al. Thrombospondins are astrocyte-secreted proteins that promote CNS synaptogenesis. Cell. 2005;120:421–433. doi: 10.1016/j.cell.2004.12.020. [DOI] [PubMed] [Google Scholar]
- 35.Kucukdereli H, et al. Control of excitatory CNS synaptogenesis by astrocyte-secreted proteins Hevin and SPARC. Proc Natl Acad Sci U S A. 2011;108:E440–449. doi: 10.1073/pnas.1104977108. [DOI] [PMC free article] [PubMed] [Google Scholar]
- 36.Singh SK, Eroglu C. Neuroligins provide molecular links between syndromic and nonsyndromic autism. Sci Signal. 2013;6:re4. doi: 10.1126/scisignal.2004102. [DOI] [PMC free article] [PubMed] [Google Scholar]
- 37.Sun C, et al. Identification and functional characterization of rare mutations of the neuroligin-2 gene (NLGN2) associated with schizophrenia. Hum Mol Genet. 2011;20:3042–3051. doi: 10.1093/hmg/ddr208. [DOI] [PMC free article] [PubMed] [Google Scholar]
- 38.Gao R, Penzes P. Common mechanisms of excitatory and inhibitory imbalance in schizophrenia and autism spectrum disorders. Curr Mol Med. 2015;15:146–167. doi: 10.2174/1566524015666150303003028. [DOI] [PMC free article] [PubMed] [Google Scholar]
- 39.Windrem MS, et al. Human iPSC Glial Mouse Chimeras Reveal Glial Contributions to Schizophrenia. Cell Stem Cell. 2017;21:195–208 e196. doi: 10.1016/j.stem.2017.06.012. [DOI] [PMC free article] [PubMed] [Google Scholar]
Associated Data
This section collects any data citations, data availability statements, or supplementary materials included in this article.