Abstract
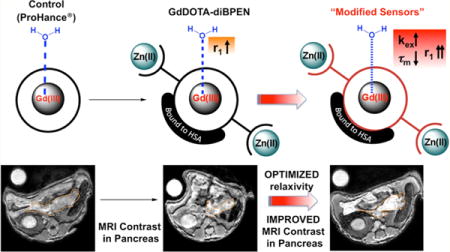
Given the known water exchange rate limitations of a previously reported Zn(II)-sensitive MRI contrast agent, GdDOTA-diBPEN, new structural targets were rationally designed to increase the rate of water exchange to improve MRI detection sensitivity. These new sensors exhibit fine-tuned water exchange properties and, depending on the individual structure, demonstrate significantly improved longitudinal relaxivities (r1). Two sensors in particular demonstrate optimized parameters and, therefore, show exceptionally high longitudinal relaxivities of about 50 mM−1 s−1 upon binding to Zn(II) and human serum albumin (HSA). This value demonstrates a 3-fold increase in r1 compared to that displayed by the original sensor, GdDOTA-diBPEN. In addition, this study provides important insights into the interplay between structural modifications, water exchange rate, and kinetic stability properties of the sensors. The new high relaxivity agents were used to successfully image Zn(II) release from the mouse pancreas in vivo during glucose stimulated insulin secretion.
Graphical abstract
1. INTRODUCTION
As the second most abundant transition metal in mammalian tissue, divalent zinc (Zn(II)) plays a critical role in many cellular processes including structural, catalytic, and signal transduction processes.1 The total concentration of Zn(II) in blood is 12–16 μM, mostly in chelated, protein-bound forms.2 Zn(II) concentrations are particularly high in the pancreas,3 prostate,4 and brain,5 all tissues that require Zn(II) for signal transduction. Pancreatic beta cells store insulin with two equivalents of Zn(II) in granules and release Zn(II) with insulin in response to an increase in plasma glucose. Upon release of insulin, the local concentration of Zn(II) in the vicinity of the beta cells rises transiently to ∼450 μM6 and may signal other cells in the same islet.7 Zn(II) is tightly regulated by multiple different transporters and imbalances in Zn(II) content in these various tissues is associated with diabetes, Alzheimer’s disease, and prostate cancer.8 For more than two decades, extensive efforts have been devoted to the development of optical sensors for detection of free Zn(II) ions.9,10 Optical Zn(II) sensors offer an appropriate detection sensitivity but show limited applicability for monitoring Zn(II) levels in vivo.11 Thus, optical-based Zn(II) sensors have been largely restricted to cell-based imaging. Magnetic resonance imaging (MRI) is an attractive modality for imaging physiology in vivo because tissue penetration is not a limiting factor. Unfortunately, MRI is inherently much less sensitive than optical imaging, which is why MR reporter molecules cannot be detected directly but rather must be detected indirectly through the abundant water protons. The first Zn(II) responsive MRI contrast agent reported in 200112 was designed to detect a change in water access to the inner-sphere of a Gd(III) ion upon Zn(II) binding. Since then, several other designs based on changes in q in response to Zn(II) have been reported,13–16 but none show particularly large changes in r1 relaxivity in response to Zn(II). Even so, a Mn(II) porphyrin derivative did show signal enhancement in brain regions known to contain the highest Zn(II) levels, but this required direct injection of the agent.14 This observation demonstrated the feasibility of detecting Zn(II) in tissues by T1-weighted imaging. In 2009, a new type of Zn(II) sensor design based on a change in molecular rotation, τR, was reported.17 Upon binding of two Zn(II) ions to the high affinity N,N-bis(2-pyridyl-methyl)ethylenediamine (BPEN) sites on GdDOTA-diBPEN 1 (cf. Figure 1), the resulting ternary GdL-(Zn)2 complex binds to site 2 of subdomain IIIa in human serum albumin (HSA). This results in slowing of molecular rotation and a change in r1 from 5.0 mM−1 s−1 to 17.5 mM−1 s−1 at 0.47T. Although the increase in r1 is not nearly this large at 9.4T, where subsequent mouse imaging experiments were performed, even a 2-fold change in r1 was sufficient to detect Zn(II) ions coreleased with insulin from pancreatic β-cells.18 The approach taken in that imaging study was to administer a dose of GdDOTA-diBPEN 1 such that its extracellular concentration is near the detection limit of MRI (i.e., 0.025 mmol/kg) and then assign any increase in image intensity in the pancreas after a bolus of glucose, to an increase in local Zn(II) released from β-cells. Although the method proved useful for detecting the expansion of pancreatic tissue in mice fed a high fat diet over 12 weeks, it would be highly desirable to modify the structure of GdDOTA-diBPEN 1 to amplify the sensitivity of the agent for detecting Zn(II) release from secretory tissues.
Figure 1.
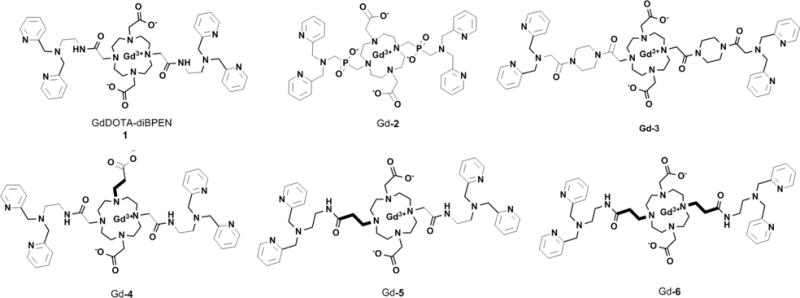
Chemical structures of GdDOTA-diBPEN 1 and the modified Zn(II) sensors Gd-2-6 reported in this work.
It is well known that the water exchange rate (kex) in bis-amide derivatives like GdDOTA-diBPEN 1 (cf. Figure 1) is typically 20–50 fold slower than that considered optimal for achieving a maximal increase in r1 when the agent binds to a macromolecule.19 This suggested to us that the r1 relaxivity of GdDOTA-diBPEN 1-(Zn(II))2 when bound to albumin is likely limited by slow kex. Based on other known τM (τM = kex−1) values of modified derivatives of GdDOTA, a series of new complexes were designed with a goal of increasing the rate of water exchange from the inner coordination sphere of the Gd(III) ion while preserving the Zn(II) binding sites and, hopefully, albumin-binding characteristics of GdDOTA-diBPEN 1. In compound Gd-2, two phosphinate groups were introduced as oxygen donors to introduce greater steric hindrance around the Gd(III)-water binding site.20 This should in principle increase the rate of water exchange. The two piperazine units in compound Gd-3 were introduced to increase the population of the twisted square antiprism (TSAP) isomer, a coordination isomer known to display much faster water exchange.21,22 In compounds Gd-4, Gd-5, and Gd-6, an extra methylene carbon was included in either an acetate (Gd-4) or acetamide (Gd-5 and Gd-6) side-chain, a modification also known to increase steric hindrance around the Gd(III)-water coordination site.23 The impact of expanding the chelate ring size on τM can be rather dramatic. For example, a structural analogue of GdDOTA bearing an extra methylene carbon on one acetate arm exhibits a 15-fold faster water exchange rate compared to GdDOTA.23,24 Given this prior information, compounds Gd-4, Gd-5, and Gd-6 were predicted to display considerably faster water exchange rates.
2. RESULTS AND DISCUSSION
2.1. Synthesis of Sensors
GdDOTA-diBPEN 1 was prepared as reported previously.17 The macrocyclic Gd complexes, Gd-2 to Gd-6, in Figure 1 were prepared using synthetic procedures fully described in Supporting Information. Each Gd(III) complex was purified and characterized using standard methods (preparative HPLC, 1H NMR, 13C NMR, and LC-MS). Those details can also be found in the Supporting Information (SI) section.
2.2. 17O NMR Measurements
To evaluate the principal physical parameters that govern r1 relaxivity, 25 mM samples of each Gd(III) complex were prepared in 5%-enriched 17O water for 17O T1 and T2 measurements over the temperature range 277–333 K. Figure S2 in SI summarizes the temperature dependence of the reduced 17O chemical shifts (Δωr), transverse (1/T2r) and longitudinal (1/T1r) relaxation rates for all six complexes. τR and kex were determined by fitting the longitudinal (T1r) and transverse (T2r) data simultaneously to paramagnetic relaxation theory.25,26 The 17O transverse relaxation rates for GdDOTA-diBPEN 1 increase with temperature above 333 K, indicating that water exchange lies in the slow-to-intermediate exchange regime where 1/T2r provides a direct measure of kex. The τM = 1/kex value obtained for GdDOTA-diBPEN 1 at 298 K (1362 ns) is consistent with previous observations that replacement of carboxylate by an amide typically decreases the rate of water exchange by 3–4 fold. The τM values found for Gd-4 and Gd-5 (190 ± 7 and 130 ± 2 ns, respectively) were ∼7-fold and ∼11-fold shorter than the τM found for GdDOTA-diBPEN 1, and even modestly shorter than the τM of GdDOTA (243 ns).26 This nicely demonstrates that introducing one extra carbon spacer into either the acetate or amide coordinating side-chain had the anticipated impact of increasing the rate of water exchange. Clearly, introducing an extra methylene carbon in the acetamide side-chain had a larger impact on water exchange than expansion of the acetate side-chain. This effect was further amplified in Gd-6, where extending both amide side-chains by one carbon decreased τM by another ∼35-fold to 3.7 ± 0.1 ns.
The τM values summarized in Table 1 show that all of the new Zn(II) sensors display faster water exchange than GdDOTA-diBPEN 1. The largest change was observed for the phosphinate derivative (Gd-2) and the bis-amide complex with extra methylene carbons on both appended amide side-chain ligating groups (Gd-6). According to paramagnetic relaxation theory, complexes with τM values in this range (<5 ns) are too short to achieve an optimal r1 when bound to a protein. The τM value measured for Gd-3 (8.7 ± 0.1 ns) was closest to the value considered optimal for achieving maximal r1 relaxivity.19 This finding suggests that insertion of the bulky cyclohexane groups likely increased the population of TSAP isomer. To verify that this is indeed the origin of this increase in τM, a sample of Eu-3 was prepared for high resolution 1H NMR. The spectrum (cf. Figure S4.1 in SI) verified that the fraction of TSAP isomer in this complex was ∼80%, much larger than the TSAP fractions in Eu-2 (∼66%), Eu-4 (∼5%), or Eu-5 (<5%), or EuDOTA-diBPEN 1 (∼40%) (cf. Figures S4.2–S4.4 in SI).17 Finally, sensors Gd-4 and Gd-5 with one extra methylene carbon inserted into one ligating side-chain displayed water exchange rates about 10-fold faster than GdDOTA-diBPEN 1. This series illustrates that one can use a variety of different coordination chemistry principles to modify water exchange rates in Gd(III) complexes. The τRO298 values for these complexes calculated from the 17O T1 data were all in the range 0.3–0.4 ns, indicating that these complexes rotate more slowly than GdDOTA, as one would expect on the basis of molecular weight.27,28 The inner-sphere q value of each complex was estimated from the 17O chemical shift of the fully bound water molecule (δμ).29 All q values obtained were close to 1, except for sensor Gd-2, where q was found to be equal to 0.4 (Table 1). This likely reflects the presence of multiple coordination isomers in solution, perhaps one with q = 0 (60%) and one with q = 1 (40%). Complexes with q = 0 have been observed previously in a variety of phosphonate and phosphinate complexes.30 To confirm the q values measured from 17O NMR, q was also evaluated by luminescence lifetime measurements on the corresponding Eu(III) complexes. Those measurements gave values of 0.4 and 0.9 ± 0.2 for Eu-2 and Eu-6, respectively, indicating the q values obtained by 17O NMR on the Gd complexes are in good agreement with those measured by luminescence lifetime methods.
Table 1.
Fitted Physical Parameters, HSA Binding Constants, and r1 Relaxivities, in mM−1 s−1, Measured at 0.47T at 310 K
| GdDOTA-diBPEN 1 | Gd-2 | Gd-3 | Gd-4 | Gd-5 | Gd-6 | |
|---|---|---|---|---|---|---|
| q | 1.0 ± 0.2 | 0.4 ± 0.2 | 1.0 ± 0.2 | 1.0 ± 0.2 | 1.0 ± 0.2 | 0.9 ± 0.2 |
| τRO298 (ns) | 0.4 ± 0.1 | 0.3 ± 0.1 | 0.4 ± 0.1 | 0.3 ± 0.1 | 0.3 ± 0.1 | 0.3 ± 0.1 |
| kex298 (106 s−1)/kex310 (106 s−1) | 0.72 ± 0.1/1.1 ± 0.1 | 220 ± 2/350 ± 3 | 110 ± 2/250 ± 1 | 5.3 ± 0.2/6.3 ± 0.2 | 7.8 ± 0.1/9.2 ± 0.1 | 270 ± 3/490 ± 4 |
| 298τM (ns)/310τM (ns) | 1400 ± 100/910 ± 60 | 4.5 ± 0.1/2.8 ± 0.1 | 8.7 ± 0.1/4.0 ± 0.1 | 190 ± 7/160 ± 5 | 130 ± 2/110 ± 1 | 3.7 ± 0.1/2.0 ± 0.1 |
| r1 (mM−1 s−1) | 5.0 ± 0.1 | 3.7 ± 0.1 | 7.6 ± 0.3 | 6.4 ± 0.2 | 6.2 ± 0.2 | 4.1 ± 0.1 |
| r1,sensor+2Zn(II) (mM−1 s−1) | 6.6 ± 0.1 | 4.9 ± 0.2 | 6.5 ± 0.1 | 7.0 ± 0.2 | 7.0 ± 0.3 | 3.5 ± 0.1 |
| r1,sensor+2Zn(II)+albumin (mM−1 s−1 | 17.4 ± 0.5 | 20.8 ± 0.5 | 27.9 ± 0.8 | 47.6 ± 1.2 | 50.1 ± 1.2 | 15.6 ± 0.6 |
| KD with HSA (μM)a | 42b | 383 ± 60 | 227 ± 52 | 48 ± 15 | 42 ± 15 | 130 ± 25 |
| r1c (mM−1 s−1)a | 23.8 ± 2 | 29.7 ± 1 | 48.4 ± 10 | 54.8 ± 7 | 14.2 ± 1 |
Obtained by fitting proton relaxation enhancement data to 1.
From ref 17.
2.3. Relaxivity Measurements
The r1 relaxivity of each new sensor in the absence and presence of Zn(II) and HSA were compared with the corresponding values for GdDOTA-diBPEN 1 in Table 1. In the absence of Zn(II) and HSA, the r1 values of complexes roughly parallel the molecular weights of the complexes in solution, with the possible exception of Gd-6. Given the fact that q for Gd-6, as measured by two different methods, seems to be near 1 and the complex was pure by all analytical measurements, the origin of the unusually low r1 relaxivity of this complex remains unknown. Like GdDOTA-diBPEN 1, the r1 relaxivities of the new sensors did not change significantly upon addition of two equivalents of Zn(II) (as ZnCl2) but did increase dramatically upon addition of both Zn(II) and a physiological amount of HSA (600 μM). This indicates that the five new Zn(II) sensors reported here retain their ability to bind to HSA in the presence of Zn(II) ions and binding significantly slows molecular rotation and increases r1. Relaxivity theory predicts that the r1 of each Gd(III) sensor-Zn(II)-HSA adduct will depend upon the water exchange rates with the complexes bound to HSA.19 Unfortunately, we were unable to use 17O NMR techniques to measure τM for the HSA-bound sensors because of limitations in concentration imposed by the protein. Despite this limitation, it is useful to compare the experimental r1 values measured in the presence of HSA with the τM values measured in the absence of Zn(II) and protein (Figure 2). If the rate of water exchange is unaltered upon binding of these agents to HSA, then the r1 values measured in aqueous solution in the absence of HSA should reasonably fit the theoretical plots shown in Figure 2. Three of the six complexes (GdDOTA-diBPEN 1, Gd-4, and Gd-5) agree reasonably well with theory, whereas three other complexes (Gd-2, Gd-3, and Gd-6) do not. To validate the positioning of the data point for each complex on this curve, additional r1 measurements were performed in the presence of Zn(II) and HSA at 323 K (Table S2 in SI). As expected, the r1 relaxivities of GdDOTA-diBPEN 1, Gd-4 and Gd-5 were higher at 323 K, whereas the r1 relaxivities of Gd-2, Gd-3, and Gd-6 were lower. Given the fact that the rate of water exchange should increase with temperature, this validates the positioning of the GdDOTA-diBPEN 1, Gd-4, and Gd-5 data on the “slow side” of the peak maximum of Figure 2 and Gd-2, Gd-3, and Gd-6 on the “fast side” of this peak maximum. The observation that the data for GdDOTA-diBPEN 1, Gd-4, and Gd-5 fall at least near this theoretical curve suggests but does not prove that kex in these three complexes is not altered upon binding to HSA, whereas kex may differ when Gd-2, Gd-3, or Gd-6 bind to the protein. It is also known that the r1 relaxivity of Gd(III) complexes such as these are magnetic field dependent and the data in Table S3 in SI show that the r1 relaxivities of GdDOTA-diBPEN, Gd-4, and Gd-5 all decrease significantly between 0.5 and 9.4T. The change in r1 relaxivity is not large for the complexes in aqueous solution but is quite dramatic for the Gd-4 and Gd-5 when bound to HSA. These data suggest that there should be a sensitivity advantage in detecting Zn(II) release from the pancreas at lower magnetic fields (1.5T or lower), but this advantage could be partially offset by the inherent lower 1H sensitivity at the lower magnetic field.
Figure 2.
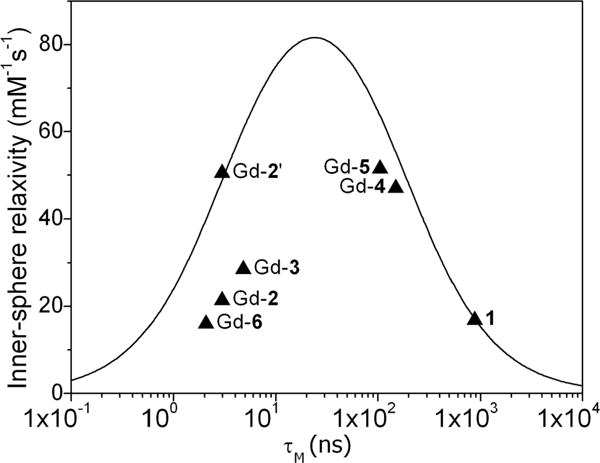
Plot of r1 for each Zn(II) sensor when bound to HSA versus τM measured for each unbound complexes in aqueous buffer at 310 K. The solid line shows the relationship predicted by paramagnetic relaxation theory at 0.47T for a molecule with τR = 10 ns. The data point labeled Gd-2′ is the relaxivity value for Gd-2 (q = 0.4) after normalization to q = 1. Other parameters used in calculating the theoretical curve include rGd–O = 3.1 Å, q = 1 and T1e = 5 ns.
2.4. Albumin-Binding Measurements
It is well known that HSA can bind many different types of substrates via site 1 or 2 of subdomain IIA or IIIA. Both are characterized by hydrophobic pockets, surrounded by a positively charged external surface.26 Studies indicate that, in the case of amphiphilic molecules, like MS-325 and MP-2269, the hydrophobic side-chains in these molecules bind in these hydrophobic pockets on the protein, whereas the Gd(III) chelate has minimal interactions with the protein surface.31–34 Nevertheless, it has been found that the rate of water exchange between a Gd(III) complex can be reduced quite substantially upon binding of the agent to HSA.31 Interestingly, it has also been shown that the rate of water exchange in various Ln(III) derivatives of MS-325 is quite sensitive to relatively minor structural differences between albumin from different mammalian sources35 and when various Mn(II) complexes bind to albumin.36
| (1) |
For the Zn(II) sensors presented here, HSA binding takes place mostly by the electrostatic interaction between the Zn(II)-DPA subunits and the tyrosine residue Y411 in the pocket site 2.37 The binding affinity of each Zn(II) sensor to HSA was estimated by proton relaxation enhancement (PRE) titrations, a relaxometric technique commonly used to determine the dissociation constants (KD = 1/KA) for binding of Gd(III) complexes to HSA.17 This experiment consists of measuring the proton relaxation rates R1obs at increasing concentrations of the protein at a fixed concentration of complex (Figure 3). Data such as these were fitted to eq 1, where r1f and r1c are the proton relaxivities of the free and the bound state, cHSA and c1 are the concentrations of HSA and complex, respectively, and n is the number of binding sites on the protein. Assuming that the complexes only bind to HSA-binding site 2 of subdomain IIIA (n = 1), a fit of the data to eq 1 revealed relatively strong binding for 1, Gd-4, and Gd-5 with HSA (KD ∼ 42–48 μM), in good agreement with literature values,17 whereas Gd-2, Gd-3, and Gd-6 exhibit lower affinities with HSA (383 ± 60 μM, 227 ± 52 μM, 130 ± 25 μM, respectively). This suggests that the length and flexibility of the side-chains between the Gd(III) and the Zn(II)-DPA units have a substantial influence on the binding interactions on HSA. Interestingly, 1, Gd-4, and Gd-5, the three complexes with the highest affinity for HSA, fall onto the theoretical r1 curve of Figure 2, whereas Gd-2, Gd-3, and Gd-6, those with the lowest affinity for HSA, do not. The abnormally low r1 of Gd-2 can be partly explained by this complex having a q value less than 1 (Table 1 and Figure 2, mark Gd-2′), whereas Gd-3 and Gd-6 must fall off this relationship for other reasons. It is also interesting to observe that these same three complexes have a weaker binding affinity for HSA. Given the fact that Gd-3 favors the TSAP form in solution, it is reasonable to assume that this complex may favor a different coordination isomer when bound to the protein and thereby may have quite a different water exchange rate. Similarly, the side-chain groups on Gd-6 are highly flexible, so this complex may also adopt a different structure when bound to HSA. An alternative explanation is that protein donor atoms displace the inner-sphere water molecule in Gd-6 to give a q = 0 complex when bound to HSA. This mechanism was suggested for some other GdDO2A derivatives when bound to HSA to explain their unexpectedly low bound r1 values.38
Figure 3.
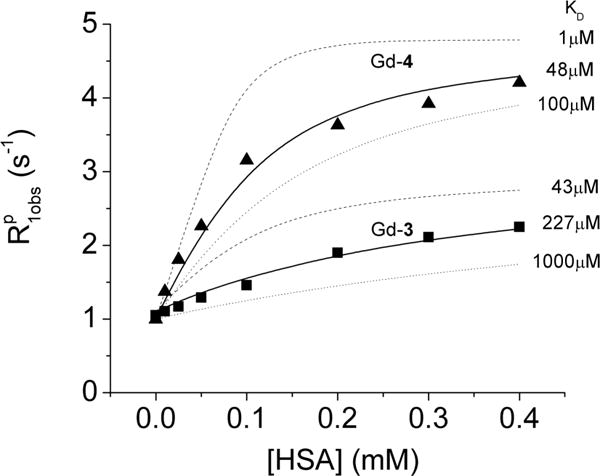
Proton relaxation enhancement of Gd-3-(Zn(II))2 and Gd-4-(Zn(II))2 as a function of increasing concentration of HSA at 0.47T and 310 K in 100 mM Tris buffer at pH 7.5. The solid line is the best fit of the data to eq 1, whereas the dashed and dotted lines are simulated curves for a fixed fully bound r1 relaxivity (29.7 mM−1 s−1 for Gd-3 and 48.4 mM−1 s−1 for Gd-4) with different dissociation constants (KD). The simulated curves illustrate the sensitivity of the PRE method to variations in KD.
With the exception of Gd-6, the other four new complexes displayed higher r1 values when bound to HSA than GdDOTA-diBPEN 1, consistent with faster water exchange. Gd-4 and Gd-5 in particular exhibit remarkably high relaxivities of 47.6 ± 1.2 and 50.1 ± 1.2 mM−1 s−1, respectively, when bound to Zn(II) and HSA (Table 1). These values, about 3-fold higher than the corresponding r1 value of GdDOTA-diBPEN 1-Zn(II)-HSA, suggest that detection of Zn(II) released from the pancreas in response to glucose stimulation should be about 3-fold more sensitive when using these newer agents at 0.47T. This difference, however, would not be nearly as large at 9.4T.
2.5. In Vivo Imaging of Glucose-Stimulated Insulin and Zn(II) Release from the Mouse Pancreas
We previously reported that GdDOTA-diBPEN 1 detects release of Zn(II) ions from pancreatic β-cells in response to an increase in blood glucose by MRI.18 Given the fact that two of the new Zn(II) sensors, Gd-4 and Gd-5, display about a 3-fold improvement in r1 relaxivity upon binding to Zn(II) and HSA in vitro in comparison to GdDOTA-diBPEN 1, additional in vivo imaging experiments were performed in mice to evaluate whether this enhanced in vitro relaxivity translates to improved signal enhancement of the pancreas in vivo. In separate experiments, three different agents were infused into C57Bl/6 mice using an identical infusion protocol to compare their effectiveness. Figure 4 summarizes the imaging protocol (top panel) and shows typical T1-weighted MR images of mice in axial view at 10–15 min after stimulation of Zn(II) release by glucose. Initially, each agent was infused at 5 μL/min for ∼30 min while continuously monitoring the image intensity of the kidneys. Once constant enhancement of the kidneys was observed, 50 μL of 20% w/v D-glucose was injected into the intraperitoneal (IP) space while continuously monitoring the pancreas by sequential T1-weighted MRI. Maximal enhancement was observed at 10–15 min after glucose injection correlating with our previous reports of zinc/insulin corelease after stimulation.18 Figure 4 summarizes the percent signal enhancement of selected ROIs of the pancreas 11 min after glucose stimulation. Although significantly higher signal enhancement of the pancreas was detected during infusion of GdDOTA-diBPEN 1 (as reported previously) and Gd-5 when compared to Gd-HPDO3A, the percent signal enhancement differences between GdDOTA-diBPEN and Gd-5 did not reach statistical significance (p < 0.125). There may be several reasons why the higher in vitro r1 of Gd-5 did not translate to greater tissue enhancement in vivo including: (1) given the fact that the pancreas is not a solid organ but rather a thin tissue, there are likely significant variations in selection of identical ROI’s in every mouse and (2) the r1 difference between GdDOTA-diBPEN 1 versus Gd-5 when bound to Zn(II) and HSA is only 1.3-fold greater at 9.4T compared the much larger difference observed at 0.47T. The fact that we do detect a trend toward higher signal enhancement using Gd-5 compared to GdDOTA-diBPEN 1 (Figure 4) is encouraging because it suggests that the new higher relaxivity agents, Gd-4 and Gd-5, will show significantly improved signal enhancement upon Zn(II) release from the pancreas at clinical imaging fields.
Figure 4.
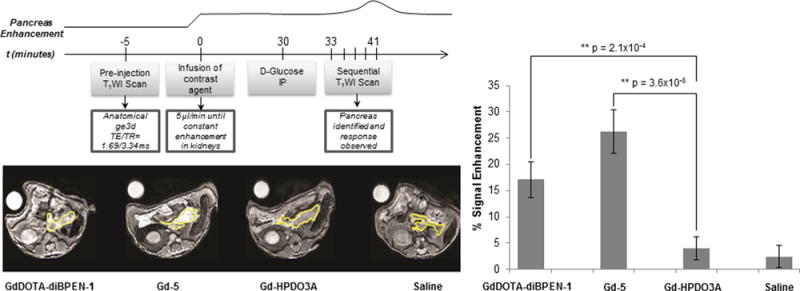
Comparison of normalized signal enhancement in pancreatic tissues of mice after infusion of two different Zn(II) sensors followed by a bolus of glucose to stimulate insulin secretion. The images were collected at 11 min post glucose injection. The top panel shows the time-dependent infusion protocol. Gd-HPDO3A (ProHance) and saline were used as controls. The portion of the pancreas that could be identified in these slices is outlined in yellow. The bar graph shows the percent signal enhancement of normalized pancreatic tissue calculated from ROIs of images before and after glucose stimulation (n = 5).
2.6. Kinetic Inertness
Thermodynamic stability and kinetic inertness are two critical parameters for the successful translation of new agents into clinical medicine. The new agents presented here based on the DO2A scaffold typically exhibit stability constants in the range of log KML = 20 or higher.39 Therefore, thermodynamic stability should not be a limiting factor. Kinetic inertness, arguably the more important factor in determining the viability of these complexes for clinical translation, was assessed by use of a published transmetalation method.40 Here, the Gd(III) complexes were incubated with four equivalents of Zn(II) in phosphate buffer (pH = 7), two equivalents of Zn(II) are expected to coordinate with the DPA subunits present in each sensor and the remaining two equivalents of Zn(II) are intended to gradually replace the Gd(III) from its macrocyclic binding site if the complex is kinetically labile on the time-scale of a few days. Any Gd(III) released by the macrocyclic ligands will in turn precipitate from solution as insoluble gadolinium phosphate, and as a consequence, the T1 of the water protons will increase. The kinetic inertness of each new compound was compared with that of the FDA-approved contrast agent Magnevist (GdDTPA, cf. Figure 5). As anticipated, all six of the macrocyclic complexes were kinetically more inert than the noncyclic Gd(III) chelate Magnevist. In particular, Gd-2 was the most inert complex in this series, with essentially no transmetalation occurring over 7 days. Gd-3 and GdDOTA-diBPEN 1 exhibited similar kinetic inertness with their relaxation rates dropping only slightly in the beginning of the experiment. Gd-4 and Gd-5 were somewhat more labile but were still noticeably more inert than Magnevist. Gd-6 was the most labile complex among this series. The combined data show that the coordinating phosphinate groups in Gd-2 can dramatically stabilize the complex, whereas an extra methylene spacer in the carboxylate ligand results in reduced kinetic stability.
Figure 5.
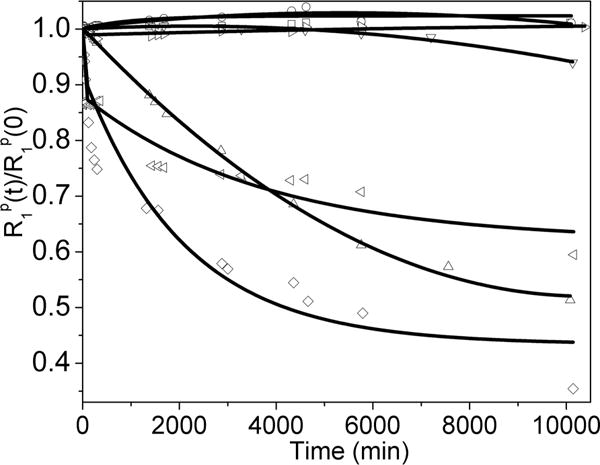
Normalized T1 relaxivity rates for GdDOTA-diBPEN 1: 1 = ▷, Gd-2 = □, Gd-3 = ○, Gd-4 = △, Gd-5 = ▽, Gd-6 = ◁, and GdDTPA = ◇ as a function of time. Each complex was initially 1.5 mM in 30 mM sodium phosphate buffer (pH = 7) in the presence of 6 mM of Zn(II). The samples were maintained at 310 K. The symbols correspond to experimental data points, whereas the solid lines represent a biexponential fit of the experimental data.
3. CONCLUSIONS
A series of Zn(II)-sensitive MRI sensors was designed to fine-tune the rate of water exchange from the inner-sphere of Gd(III) in order to maximize the r1 of the complexes bound to Zn(II) and HSA. Two complexes in particular, Gd-4 and Gd-5, displayed r1 relaxivity values close to 50 mM−1s−1 at 0.47 T. This illustrates that optimizing the water exchange rates can be a successful molecular design strategy to construct more sensitive MRI contrast agents for Zn(II) detection. The 3-fold increase in r1 measured for two of the new agents in vitro at 0.47T did not result in significantly improved signal enhancement of the mouse pancreas in vivo at 9.4 T. Nevertheless, we anticipate that the higher r1 relaxivity of these new agents will be much more evident when imaging larger animals at clinical imaging fields.
It should be noted that MR-responsive agents such as those described herein offer the possibility of detecting only qualitative changes in the amount of Zn(II) released from secretory tissues, not quantitative total Zn(II) concentrations in tissue. Nonetheless, MRI-based Zn(II) sensors such as these can provide added insights into physiological events occurring in vivo that are simply not available with other molecular imaging modalities. Given the fact that binding affinity of HSA for Zn(II) is ∼30 nM41 and the affinity of these BPEN-based Gd(III) complexes for Zn(II) is also around 33 nM,2 one should consider the relative concentrations of the agent (∼50 μM) and HSA (∼0.6 mM) in the extracellular space around β-cells to gain some insight into the various Zn(II) species that can potentially be formed upon release of Zn(II) ions from β-cells. The concentration differences between the Gd(III) sensor and HSA suggests that most of the Zn(II) released from β-cells should bind directly with HSA and not the Gd(III) sensor, assuming of course that the Zn(II) binding sites on HSA are not already occupied. The fact that HSA is considered to be a Zn(II) buffer and involved in delivery of Zn(II) to cells42 and the fact that we observe image enhancement of the pancreas in response to glucose indicates that the Zn(II) binding sites on HSA must be largely occupied with Zn(II) before more ions are released from β-cells. This then allows the excess Zn(II) ions released from cells to bind to the Gd(III) sensor and subsequently enhance the MRI signal.
It is also important to point out that 4 of 5 of the new Gd(III) complexes reported here, like GdDOTA-diBPEN 1, have an overall net charge of 1+ in the absence of Zn(II), yet seem to be well tolerated when infused into mice at the concentrations used here. Given the fact that positively charged Gd(III) complexes are generally considered toxic, our observations suggest that either the charge on these complexes is masked by associated counteranions in vivo or perhaps chemical toxicity will be revealed when these agents are infused at concentrations higher than those used here.
Supplementary Material
Acknowledgments
Financial support from the National Institutes of Health (P41-EB015908, R01-DK095416, and in part by the Harold C. Simmons Cancer Center through an NCI Cancer Center Support Grant, 1P30-CA142543), the American Diabetes Association (7-12-MN-76 and 7-12-IN-42), and the Robert A. Welch Foundation (AT-584) is gratefully acknowledged.
ABBREVIATIONS
- q
hydration number
- τR
rotational correlation time
- τM
water residence lifetime
- kex
water exchange rate
- r1
T1 relaxivity
- rGd−O
gadolinium−water distance
- T1e
electronic relaxation time
- TSAP
twisted square antiprism
- DPA
di(2-picolyl)-amine
- HSA
human serum albumin
- KD
dissociation constant
- KA
association constant
- BPEN
N,N-bis(2-pyridyl-methyl)-ethylenediamine
- DTPA
2-[bis[2-[bis(carboxymethyl)amino]-ethyl]amino]acetic acid
Footnotes
Supporting Information
The Supporting Information is available free of charge on the ACS Publications website at DOI: 10.1021/jacs.5b09158.
General methods, supplementary schemes, synthetic protocols, and analytical data for the new compounds. (PDF)
Notes
The authors declare no competing financial interest.
References
- 1.Maret W. Adv Nutr. 2013;4:82–91. doi: 10.3945/an.112.003038. [DOI] [PMC free article] [PubMed] [Google Scholar]
- 2.De Leon-Rodriguez L, Lubag AJM, Jr, Sherry AD. Inorg Chim Acta. 2012;393:12–23. doi: 10.1016/j.ica.2012.06.026. [DOI] [PMC free article] [PubMed] [Google Scholar]
- 3.Chimienti F. Nutr Res Rev. 2013;26:1–11. doi: 10.1017/S0954422412000212. [DOI] [PubMed] [Google Scholar]
- 4.Kolenko V, Teper E, Kutikov A, Uzzo R. Nat Rev Urol. 2013;10:219–226. doi: 10.1038/nrurol.2013.43. [DOI] [PMC free article] [PubMed] [Google Scholar]
- 5.Bush AI. Trends Neurosci. 2003;26:207–214. doi: 10.1016/S0166-2236(03)00067-5. [DOI] [PubMed] [Google Scholar]
- 6.Kim BJ, Kim YH, Kim S, Kim JW, Koh JY, Oh SH, Lee MK, Kim KW, Lee MS. Diabetes. 2000;49:367–372. doi: 10.2337/diabetes.49.3.367. [DOI] [PubMed] [Google Scholar]
- 7.Li D, Chen S, Bellomo EA, Tarasov AI, Kaut C, Rutter GA, Li W. Proc Natl Acad Sci USA. 2011;108:21063–21068. doi: 10.1073/pnas.1109773109. [DOI] [PMC free article] [PubMed] [Google Scholar]
- 8.Myers SA, Nield A, Myers M. J Nutr Metab. 2012;2012:173712–173725. doi: 10.1155/2012/173712. [DOI] [PMC free article] [PubMed] [Google Scholar]
- 9.Frederickson CJ, Kasarskis EJ, Ringo D, Frederickson RE. J Neurosci Methods. 1987;20:91–103. doi: 10.1016/0165-0270(87)90042-2. [DOI] [PubMed] [Google Scholar]
- 10.Xu Z, Yoon J, Spring DR. Chem Soc Rev. 2010;39:1996–2006. doi: 10.1039/b916287a. [DOI] [PubMed] [Google Scholar]
- 11.Weissleder R, Pittet MJ. Nature. 2008;452:580–589. doi: 10.1038/nature06917. [DOI] [PMC free article] [PubMed] [Google Scholar]
- 12.Hanaoka K, Kikuchi K, Urano Y, Nagano T. J Chem Soc Perkin Trans. 2001;2:1840–1843. [Google Scholar]
- 13.Hanaoka K, Kikuchi K, Urano Y, Narazaki M, Yokawa T, Sakamoto S, Yamaguchi K, Nagano T. Chem Biol. 2002;9:1027–1032. doi: 10.1016/s1074-5521(02)00216-8. [DOI] [PubMed] [Google Scholar]
- 14.Zhang X, Lovejoy KS, Jasanoff A, Lippard SJ. Proc Natl Acad Sci USA. 2007;104:10780–10785. doi: 10.1073/pnas.0702393104. [DOI] [PMC free article] [PubMed] [Google Scholar]
- 15.Major JL, Parigi G, Luchinat C, Meade TJ. Proc Natl Acad Sci USA. 2007;104:13881–13886. doi: 10.1073/pnas.0706247104. [DOI] [PMC free article] [PubMed] [Google Scholar]
- 16.Bonnet CS, Caillé F, Pallier A, Morfin J-F, Petoud S, Suzenet F, Tóth É. Chem – Eur J. 2014;20:10959–10969. doi: 10.1002/chem.201403043. [DOI] [PubMed] [Google Scholar]
- 17.Esqueda AC, López JA, Andreu-de-Riquer G, Alvarado-Monzón JC, Ratnakar J, Lubag AJM, Sherry AD, De León-´Rodríguez LM. J Am Chem Soc. 2009;131:11387–11391. doi: 10.1021/ja901875v. [DOI] [PMC free article] [PubMed] [Google Scholar]
- 18.Lubag AJM, De Leon-Rodriguez LM, Burgess SC, Sherry AD. Proc Natl Acad Sci USA. 2011;108:18400–18405. doi: 10.1073/pnas.1109649108. [DOI] [PMC free article] [PubMed] [Google Scholar]
- 19.Sherry AD, Wu Y. Curr Opin Chem Biol. 2013;17:167–174. doi: 10.1016/j.cbpa.2012.12.012. [DOI] [PMC free article] [PubMed] [Google Scholar]
- 20.Kotek J, Lebdusková P, Hermann P, Vander Elst L, Muller RN, Geraldes CFGC, Maschmeyer T, Lukes I, Peters JA. Chem – Eur J. 2003;9:5899–5915. doi: 10.1002/chem.200305155. [DOI] [PubMed] [Google Scholar]
- 21.Zhang S, Kovacs Z, Burgess S, Aime S, Terreno E, Sherry AD. Chem – Eur J. 2001;7:288–296. doi: 10.1002/1521-3765(20010105)7:1<288::aid-chem288>3.0.co;2-6. [DOI] [PubMed] [Google Scholar]
- 22.Siriwardena-Mahanama BN, Allen MJ. Molecules. 2013;18:9352–9381. doi: 10.3390/molecules18089352. [DOI] [PMC free article] [PubMed] [Google Scholar]
- 23.Jaszberenyi Z, Sour A, Toth E, Benmelouka M, Merbach AE. Dalton Trans. 2005:2713–2719. doi: 10.1039/b506702b. [DOI] [PubMed] [Google Scholar]
- 24.Congreve A, Parker D, Gianolio E, Botta M. Dalton Trans. 2004:1441–1445. doi: 10.1039/b402230k. [DOI] [PubMed] [Google Scholar]
- 25.Powell DH, Dhubhghaill OMN, Pubanz D, Helm L, Lebedev YS, Schlaepfer W, Merbach AE. J Am Chem Soc. 1996;118:9333–9346. [Google Scholar]
- 26.Merbach AE, Helm L, Toth E. The Chemistry of Contrast Agents in Medical Magnetic Resonance Imaging. 2nd. John Wiley & Sons, Ltd; West Sussex, U.K: 2013. [Google Scholar]
- 27.Champmartin D, Rubini P. Inorg Chem. 1996;35:179–183. doi: 10.1021/ic950635c. [DOI] [PubMed] [Google Scholar]
- 28.Martins AF, Morfin J-F, Geraldes CFGC, Tóth É. JBIC J Biol Inorg Chem. 2014;19:281–295. doi: 10.1007/s00775-013-1055-8. [DOI] [PubMed] [Google Scholar]
- 29.Djanashvili K, Peters JA. Contrast Media Mol Imaging. 2007;2:67–71. doi: 10.1002/cmmi.132. [DOI] [PubMed] [Google Scholar]
- 30.Botta M. Eur J Inorg Chem. 2000;2000:399–407. [Google Scholar]
- 31.Caravan P, Cloutier NJ, Greenfield MT, McDermid SA, Dunham SU, Bulte JWM, Amedio JC, Jr, Looby RJ, Supkowski RM, Horrocks WD, Jr, McMurry TJ, Lauffer RB. J Am Chem Soc. 2002;124:3152–3162. doi: 10.1021/ja017168k. [DOI] [PubMed] [Google Scholar]
- 32.Tóth É, Connac F, Helm L, Adzamli K, Merbach AE. JBIC J Biol Inorg Chem. 1998;3:606–613. [Google Scholar]
- 33.Adzamli K, Elst LV, Laurent S, Muller RN. MAGMA. 2001;12:92–95. doi: 10.1007/BF02668088. [DOI] [PubMed] [Google Scholar]
- 34.Henrotte V, Laurent S, Gabelica V, Elst LV, Depauw E, Muller RN. Rapid Commun Mass Spectrom. 2004;18:1919–1924. doi: 10.1002/rcm.1571. [DOI] [PubMed] [Google Scholar]
- 35.Zech SG, Eldredge HB, Lowe MP, Caravan P. Inorg Chem. 2007;46:3576–3584. doi: 10.1021/ic070011u. [DOI] [PubMed] [Google Scholar]
- 36.Gale EM, Zhu J, Caravan P. J Am Chem Soc. 2013;135:18600–18608. doi: 10.1021/ja4094132. [DOI] [PMC free article] [PubMed] [Google Scholar]
- 37.Montgomery CP, New EJ, Parker D, Peacock RD. Chem Commun. 2008:4261–4263. doi: 10.1039/b810978h. [DOI] [PubMed] [Google Scholar]
- 38.Polasek M, Caravan P. Inorg Chem. 2013;52:4084–4096. doi: 10.1021/ic400227k. [DOI] [PMC free article] [PubMed] [Google Scholar]
- 39.Brücher E, Tircsó G, Baranyai Z, Kovács Z, Sherry AD. In: The Chemistry of Contrast Agents in Medical Magnetic Resonance Imaging. Merbach A, Helm L, Tóth É, editors. John Wiley & Sons, Ltd; West Sussex, U.K.: 2013. pp. 157–208. [Google Scholar]
- 40.Laurent S, Vander Elst L, Henoumont C, Muller RN. Contrast Media Mol Imaging. 2010;5:305–308. doi: 10.1002/cmmi.388. [DOI] [PubMed] [Google Scholar]
- 41.Masuoka J, Hegenauer J, Dyke BRV, Saltman P. J Biol Chem. 1993;268:21533–21537. [PubMed] [Google Scholar]
- 42.Cousins RJ. Clin Physiol Biochem. 1986;4:20–30. [PubMed] [Google Scholar]
Associated Data
This section collects any data citations, data availability statements, or supplementary materials included in this article.


