

Abstract
Since at least the last common ancestor of all life on earth, genetic information has been stored in a four-letter alphabet that is propagated and retrieved by the formation of two base pairs. The central goal of synthetic biology is to create new life forms and functions1, and the most general route to this goal is the creation of semi-synthetic organisms (SSOs) whose DNA harbors two additional letters that form a third, unnatural base pair (UBP). Previously, our efforts to generate such SSOs culminated in the creation of a strain of Escherichia coli that by virtue of a nucleoside triphosphate transporter from Phaeodactylum tricornutum (PtNTT2), imports the requisite unnatural triphosphates from the media and then uses them to replicate a plasmid containing the UBP dNaM-dTPT3 (Fig. 1a)2. While the SSO stores increased information, retrieval of the information requires in vivo transcription of the UBP into mRNA and tRNA, aminoacylation of the tRNA with a non-canonical amino acid (ncAA), and finally, efficient participation of the UBP in decoding at the ribosome. Here, we report the in vivo transcription of DNA containing dNaM and dTPT3 into mRNAs with two different unnatural codons and tRNAs with cognate unnatural anticodons, and their efficient decoding at the ribosome to direct the site-specific incorporation of natural or ncAAs into superfolder green fluorescent protein (sfGFP). The results demonstrate that interactions other than hydrogen bonding can contribute to every step of information storage and retrieval. The resulting SSO both encodes and retrieves increased information and should serve as a platform for the creation of new life forms and functions.
Green fluorescent protein and variants such as sfGFP3 have served as model systems for the study of ncAA incorporation via genetic code expansion4, including at position Y151, which has been shown to tolerate a variety of natural and ncAAs (Extended data Fig. 1)5. To explore the decoding of unnatural codons, we first focused on the incorporation of Ser at position 151 of sfGFP, as E. coli serine aminoacyl-tRNA synthetase (SerRS) does not rely on anticodon recognition for tRNA aminoacylation6, thus eliminating the potential complications of inefficient charging. SSO strain YZ32 carrying a plasmid expressing TetR was transformed with a plasmid encoding sfGFP and an E. coli tRNASer gene (serT), with the native sfGFP codon 151 (TAC) replaced by the unnatural codon AXC (sfGFP(AXC)151; X = NaM), and the anticodon of serT replaced by the unnatural anticodon GYT (tRNASer(GYT); Y = TPT3) (Fig. 1b). Transformants were grown in media supplemented with dNaMTP and dTPT3TP, then supplemented further with NaMTP and TPT3TP, as well as isopropyl-β-D-thiogalactoside (IPTG) to induce expression of T7 RNA polymerase (T7 RNAP) and tRNASer(GYT). After a brief period of tRNA induction, anhydrotetracycline (aTc) was added to induce expression of sfGFP(AXC)151, and the production of sfGFP was monitored by fluorescence.
Figure 1. UBP and decoding with tRNASer.

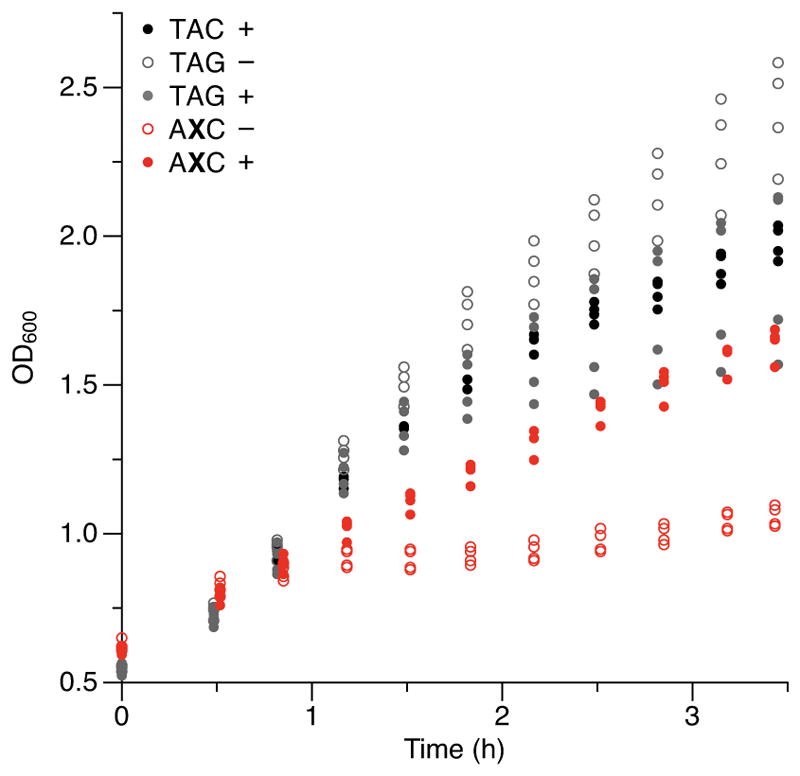
a, Chemical structure of the dNaM-dTPT3 UBP and a natural dA-dT base pair. b, Schematic illustration of the gene cassette used to express sfGFP(AXC)151 and tRNASer(GYT). PT7 and TT7 denote the T7 RNAP promoter and terminator, respectively. In controls where sfGFP is expressed in the absence of serT, the sequence following the sfGFP T7 terminator is absent. c, d, Fluorescence (c) and growth (d) of cells expressing sfGFP and tRNASer with the indicated position 151-codon and anticodon, respectively. Minus sign denotes the absence of serT in the expression cassette. t = 0 corresponds to the addition of IPTG to induce expression of T7 RNAP and tRNASer (if present); aTc was added at t = 0.5 h to induce expression of sfGFP. Individual data points shown from n = 4 cultures, each propagated from an individual colony (biological replicates). e, Western blot of lysates (normalized by OD600) from cells collected at the last time point shown in c and d, probed with an α-GFP antibody (N-terminal epitope). For blot source data, see Supplemental Figure 1. f, Relative abundance of amino acids at position 151 of sfGFP purified from cells expressing sfGFP(AGT)151 or sfGFP(AXC)151 and tRNASer(GYT), as determined by LC-MS/MS and precursor ion intensity based quantitation; amino acids detected at <0.1% (on average, for both codons) are not shown. Data shown as mean with individual values, n = 4 purified sfGFP samples, each from a culture propagated from an individual colony and collected at the last time point shown in c and d.
Following induction, cells transformed with a control plasmid encoding sfGFP(AXC)151 but lacking tRNASer(GYT) showed dramatically reduced fluorescence compared to cells transformed with a plasmid encoding sfGFP with a natural Ser codon at position 151 (sfGFP(AGT)151; Fig. 1c). Moreover, cell growth began to plateau upon induction of sfGFP(AXC)151 (Fig. 1d), likely due to the stalling and sequestering of ribosomes7; and lysates of these cells subjected to western blotting with an anti-GFP antibody revealed a significant reduction in sfGFP expression and the presence of sfGFP truncated at the position of the unnatural codon (Fig. 1e). In contrast, cells transformed with the plasmid encoding both sfGFP(AXC)151 and tRNASer(GYT) exhibited fluorescence that was nearly equal to that of control cells expressing sfGFP(AGT)151 (Fig. 1c), cell growth did not plateau upon induction of sfGFP(AXC)151 (Fig. 1d), and western blots of lysates from these cells revealed only full-length sfGFP protein (Fig. 1e). Furthermore, we assessed the ability of all four natural near-cognate tRNAs (tRNASer(GNT); N=G, C, A, or T), expressed in an identical fashion, to decode the AXC codon. In each case, low fluorescence was observed and the growth defect remained (Extended data Fig. 2a,b). These data indicate that PtNTT2 is able to import both the deoxy- and ribotriphosphates of both unnatural nucleotides, that T7 RNA polymerase is able to transcribe mRNA and tRNA containing the unnatural nucleotides in vivo, and that the ribosome only efficiently decodes the unnatural codon with an unnatural anticodon.
To assess the fidelity of decoding, we analyzed protein purified from cells expressing both sfGFP(AXC)151 and tRNASer(GYT) via LC-MS/MS and relative quantitation via ion intensities, which revealed a 98.5±0.7% (95% CI, n = 4) incorporation of Ser at position 151, with Ile/Leu being the predominant contaminant (Fig. 1f, Extended data Table 1). Given that the retention of the UBP in the sfGFP(AXC)151 gene was 98±2% (95% CI, n = 4) (Extended data Table 2) and that X→T is typically the major mutation during replication2 (which for AXC would result in the Ile codon ATC), we attribute the majority of the protein not containing Ser at position 151 to loss of the UBP during replication and conclude that the fidelity of translation with the unnatural codon is high.
To demonstrate the encoding of ncAAs with UBPs, we constructed plasmids analogous to those used above, but with the tRNASer gene replaced with the Methanosarcina mazei tRNAPyl(GYT) gene. tRNAPyl can be selectively charged by the Methanosarcina barkeri pyrrolysine aminoacyl tRNA synthetase (PylRS) with the ncAA N6-[(2-propynyloxy)carbonyl]-L-lysine (PrK)8,9. In addition to the codon AXC, we also analyzed the codon GXC and the corresponding tRNAPyl(GYC). The SSO, carrying a separate plasmid encoding an IPTG-inducible PylRS (expressed from a Ptac promoter), was transformed with the required plasmids and grown with or without added PrK. In control experiments with cells expressing either sfGFP(AXC)151 or sfGFP(GXC)151 in the absence of either PylRS, the cognate unnatural tRNAPyl, or PrK, we observed only low cellular fluorescence (Fig. 2a), truncation of sfGFP (Extended data Fig. 3a), and a plateau in cell growth (Extended data Fig. 3b). In contrast, for either unnatural mRNA with its cognate unnatural tRNA, when PylRS was present and PrK was added, we observed high fluorescence (64% and 69% of sfGFP(TAC)151 for AXC and GXC, respectively) (Fig. 2a,b), robust production of full-length sfGFP (Extended data Fig. 3a), and normal growth (Extended data Fig. 3b).
Figure 2. Incorporation of PrK using PylRS/tRNAPyl.

a, Fluorescence of cells expressing sfGFP with the indicated position 151-codon, in the presence (+) or absence (−) of a tRNAPyl with a cognate anticodon, PylRS, or 20 mM PrK in the media, determined at the last time point in b. Asterisk denotes the absence of tRNAPyl in cells expressing sfGFP(TAC)151; n.d., not determined. Data shown as mean with individual values, n = 4 cultures, each propagated from an individual colony (biological replicates). b, Fluorescence timecourse of a subset of conditions in a (presence (+) or absence (−) of PrK in the media). t = 0 corresponds to the addition of IPTG to induce expression of PylRS, T7 RNAP, and tRNAPyl; aTc was added at t = 1 h to induce expression of sfGFP. Individual data points shown from n = 4 cultures, each propagated from an individual colony (biological replicates). c, Western blots and fluorescence scans of sfGFP purified from cells expressing sfGFP and tRNAPyl (if present) with the indicated position-151 codon and anticodon, respectively, with or without conjugation of TAMRA or addition of PrK to the media. sfGFP was purified from cultures collected at the last time point shown in b. For blot source data, see Supplemental Figure 1. d, Relative abundance of amino acids at position 151 of sfGFP purified from cells expressing sfGFP(TAC)151 or sfGFP and tRNAPyl with the indicated position-151 codon and a cognate anticodon, respectively, as determined by LC-MS/MS and precursor ion intensity based quantitation; amino acids detected at <0.1% (on average, for all codons) are not shown. Data shown as mean with individual values, n = 4 purified sfGFP samples, each from a culture propagated from an individual colony, grown in the presence of PrK, and collected at the last time point shown in b.
To verify the incorporation of PrK, sfGFP was affinity purified from cell lysates using a tandem C-terminal Strep-tag II10 and subjected to copper-catalyzed click chemistry11 to attach a carboxytetramethylrhodamine (TAMRA) dye (TAMRA-PEG4-N3), which was found to shift the electrophoretic mobility of sfGFP during SDS-PAGE, thus allowing us to assess the fidelity of PrK incorporation by western blotting (Fig. 2c). We observed a strong TAMRA signal and a shift of virtually all of the sfGFP when the protein was purified from cells that expressed sfGFP(AXC)151 and tRNAPyl(GYT) or sfGFP(GXC)151 and tRNAPyl(GYC), and that had been cultured in media supplemented with PrK (Fig. 2c). In contrast, little to no TAMRA signal nor shifted sfGFP was observed when NaMTP, TPT3TP, or both were absent (Extended data Fig. 4a). Finally, no TAMRA signal nor shifted sfGFP was observed in protein purified from cells expressing sfGFP(TAC)151 with either unnatural tRNA (Fig. 2c). This data demonstrates that PrK is specifically incorporated into sfGFP via decoding of the unnatural codons by tRNAs with an unnatural anticodon.
With optimal PrK concentrations (Extended data Fig. 5)12, we purified 54±4 and 55±6 μg of sfGFP per mL of culture (s.d., n = 4, ~40% of the sfGFP(TAC)151 control (Extended data Table 3)) for the AXC and GXC codons, respectively. Moreover, based on mass spectrometry analysis, the purity of sfGFP with PrK was 96.2±0.3% (95% CI, n = 4) for the AXC codon and 97.5±0.7% (95% CI, n = 4) for the GXC codon (Fig. 2d). As with the Ser incorporation experiments, the major natural amino acid contamination again corresponded to an X→T mutation (ATC, Ile; GTC, Val); however, we also observed an increase in the incorporation of amino acids that appear to result from mischarging (Lys) or from mis-decoding by near-cognate natural tRNAs containing a pyrimidine at the second position (Extended data Fig. 2; Fig. 2d), which is likely due to inefficient charging of the heterologous tRNA or its reduced ability to compete with endogenous tRNAs13. Nonetheless, although the yield of sfGFP protein purified was slightly lower than that obtained with amber suppression (87±6 μg/mL of culture, s.d., n = 4 (Extended data Table 3)) due to a moderate reduction in growth with addition of the unnatural ribotriphosphates (Extended data Fig. 4b,c), decoding of both unnatural codons resulted in higher fluorescence than observed with amber suppression when normalized to cell density (Fig. 2a,b), and less truncated protein (Extended data Fig. 3a), implying that decoding with the unnatural codons is more efficient than amber suppression.
To explore the encoding of other ncAAs with UBPs, we examined the encoding of p-azido-phenylalanine (pAzF) with the AXC codon and an evolved Methanococcus jannaschii TyrRS/tRNATyr pair (pAzFRS/tRNApAzF)14. With induction of the synthetase (expressed from an IPTG-inducible PlacUV5 promoter) and the addition of pAzF to the growth media, we observed robust fluorescence equivalent to that of cells expressing natural sfGFP(TAC)151 and normal growth with sfGFP(AXC)151 and tRNApAzF(GYT) (Fig. 3a, Extended data Fig. 6). Full-length sfGFP was purified (86±6 μg/mL of culture, s.d., n = 4; 68% of the sfGFP(TAC)151 control, Extended data Table 3) and subjected to copper-free click chemistry using a dibenzocyclooctyl (DBCO) group to attach TAMRA (TAMRA-PEG4-DBCO)15. We observed robust TAMRA conjugation to sfGFP isolated from cells expressing sfGFP(AXC)151 and tRNApAzF(GYT) and cultured in the presence of pAzF (Fig. 3b). Although we were unable to accurately assess the fidelity of pAzF incorporation due to decomposition of the azido moiety16,17, ~93% of the sfGFP protein observed in the western blot was shifted, which compares favorably to the ~95% shifted sfGFP produced via amber suppression (Fig. 3b).
Figure 3. Incorporation of pAzF using pAzFRS/tRNApAzF.
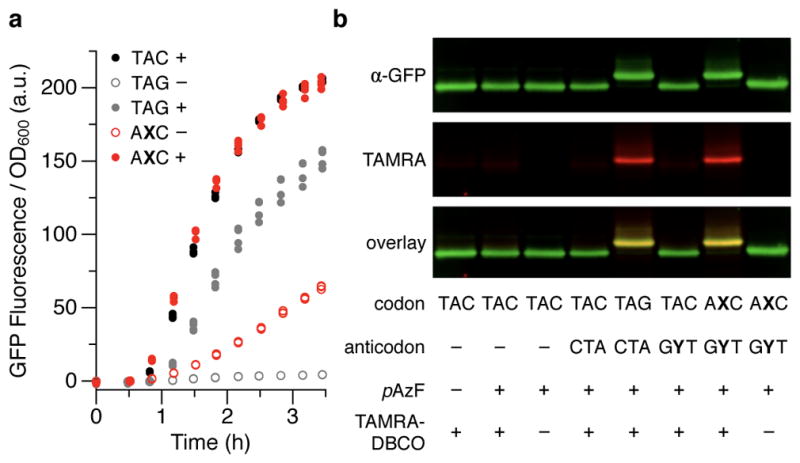
a, Fluorescence of cells expressing sfGFP(TAC)151 or sfGFP and tRNApAzF with the indicated position-151 codon and a cognate anticodon, respectively, in the presence (+) or absence (−) of 5 mM pAzF in the media. t = 0 corresponds to the addition of IPTG to induce expression of pAzFRS, T7 RNAP, and tRNApAzF; aTc was added at t = 0.5 h to induce expression of sfGFP. Individual data points shown from n = 4 cultures, each propagated from an individual colony (biological replicates). The fluorescence observed with sfGFP(AXC)151 in the absence of pAzF is attributed to charging of tRNApAzF(GYT) with a natural amino acid16. b, Western blot and fluorescence scan of sfGFP purified from cells expressing sfGFP and tRNApAzF (if present) with the indicated position-151 codon and anticodon, respectively, with or without conjugation of TAMRA or addition of pAzF to the media. sfGFP was purified from cultures collected at the last time point shown in a. For blot source data, see Supplemental Figure 1.
Since at least the last common ancestor of all life on earth, proteins have been produced within cells via the decoding of codons written solely with the four-nucleotide genetic alphabet. We have now demonstrated the decoding of two new codons, written with an expanded genetic alphabet, and shown that they can be used to direct the site-specific incorporation of ncAAs into proteins. Remarkably, this reveals that for every step of information storage and retrieval, hydrogen bonds, so obviously central to the natural base pairs, may at least in part be replaced with complementary packing and hydrophobic forces. Despite their novel mechanism of decoding, the unnatural codons can be decoded as efficiently as their fully natural counterparts. While we have examined the decoding of only two unnatural codons, the UBP is unlikely to be limited to these, especially when combined with a recently reported Cas9 editing system that increases the range of sequences in which the UBP may be retained2, which would enable the exploration of more codons and further improve the fidelity of ncAA incorporation. Thus, the reported SSO is likely to be just the first of a new form of semi-synthetic life that is able to access a broad range of forms and functions not available to natural organisms.
METHODS
Materials
A complete list of plasmids and the sequences of oligonucleotides used in this work can be found in Supplementary Tables 1–2. gBlock® gene fragments and natural oligonucleotides (with standard purification and desalting) were purchased from IDT (San Diego, California, USA). Sequencing was performed by Genewiz (San Diego, California, USA). Plasmids were isolated using commercial miniprep kits (QIAprep, Qiagen or ZR Plasmid Miniprep Classic, Zymo Research). pEVOL-pAzF14 was kindly provided by Peter Schultz (The Scripps Research Institute, USA).
Nucleosides of dNaM, dTPT3, NaM, TPT3, d5SICS and dMMO2bio were synthesized (WuXi AppTec, Shanghai, China) and triphosphorylated (TriLink BioTechnologies LLC, San Diego, USA and MyChem LLC, San Diego, USA) commercially. All unnatural oligonucleotides were synthesized by Biosearch Technologies (Petaluma, California, USA) with purification by reverse phase cartridge.
Growth conditions
Unless otherwise stated, liquid bacterial cultures were grown in 300 μL of 2×YT (casein peptone 16 g/L, yeast extract 10 g/L, NaCl 5 g/L) supplemented with potassium phosphate (50 mM, pH 7), referred to hereafter as “media”, and incubated at 37 °C in 48-well flat-bottomed plates (CELLSTAR, Greiner Bio-One) with shaking at 200 rpm. Solid growth media was prepared with 2% agar. Antibiotics were used, as appropriate, at the following concentrations: ampicillin, 100 μg/mL; zeocin, 50 μg/mL; chloramphenicol, 5 μg/mL. All selective agents were purchased commercially. Stock solutions of N6-[(2-propynyloxy)carbonyl]-L-lysine HCl (PrK; SC-36420, Synchem) and p-azido-L-phenylalanine HCl (pAzF; 06162, Chem-Impex International) were dissolved in ddH2O (1 M PrK) or 0.2 M NaOH (250 mM pAzF), respectively. Cell growth was measured using a Perkin Elmer Envision 2103 Multilabel Reader with a 590/20 nm filter. sfGFP fluorescence was measured using a Perkin Elmer Envision 2103 Multilabel Reader with a 485/14 nm filter for excitation and 535/25 nm filter for emission. The fluorescence of the media used in each experiment was measured and subtracted from the fluorescence measurements of each cell culture.
Construction of synthetase expression plasmids
pGEX-MbPylRS TetR was constructed by gene synthesis of a fragment corresponding to the sequence of the Methanosarcina barkeri pyrrolysine aminoacyl tRNA synthetase (PylRS) and Gibson Assembly (Gibson Assembly Master Mix, New England Biolabs (NEB)) with a pGEX-4T-1 plasmid (Genscript), which removed the glutathione S-transferase gene and multiple cloning site from pGEX-4T-1 and placed PylRS under the control of Ptac-lacO. The resulting plasmid was then further modified by PCR and restriction digest cloning to remove the catabolite activator protein (CAP) binding site-Plac-lacZα region and to introduce a fragment containing tetR expressed from a Pbla promoter (derived from pTETBHR218) to yield pGEX-MbPylRS TetR. pGEX-MjpAzFRS TetR was cloned by introducing a T1 transcriptional terminator after lacI via PCR of pGEX-MbPylRS TetR with phosphorylated primers (T4 PNK, NEB) with overhangs containing the T1 terminator sequence and blunt-ended ligation, replacement of Ptac with PlacUV5 by the same cloning strategy, and then PCR linearization of the resulting plasmid to exclude PylRS and introduce BglII and SalI restriction sites, which were then ligated with the BglII/SalI fragment containing pAzFRS from pEVOL-pAzF. pGEX-empty TetR, a plasmid used in Ser decoding experiments (to provide TetR) and used as a control plasmid in PrK incorporation experiments, was cloned by PCR linearization of pGEX-MbPylRS TetR to exclude the PylRS sequence followed by blunt-ended ligation.
Construction of sfGFP and tRNA expression plasmids
sfGFP and tRNA expression plasmids are based on the design of pAIO2X2. The M. jannaschii tRNApAzF and M. mazei tRNAPyl genes, as well as a small portion of the flanking 5 ′ leader and 3′ trailer sequences from proK, are derived from pULTRA8; the E. coli serT gene is derived from the native coding sequence. All sfGFP and tRNA expression plasmids were modified to replace the lacO controlling sfGFP expression with tetO, using phosphorylated primers with overhangs containing the tetO sequence and blunt-ended ligation.
To create the Golden Gate destination plasmids p[sfGFP(gg)151 tRNASer(gg)], p[sfGFP(gg)151 tRNAPyl(gg)], and p[sfGFP(gg)151 tRNApAzF(gg)], which are used to introduce natural or unnatural position-151 sfGFP codons and tRNA anticodons, the lambda T0 terminator of pAIO2X was removed via PCR and ligation, followed by a 3-way Gibson Assembly of the resulting plasmid to simultaneously introduce a tRNA gene (with a Golden Gate destination site) under the control of a T7 promoter and append a tandem C-terminal Strep-tag II10 on sfGFP (also containing a Golden Gate destination site).
Expression plasmids p[sfGFP(TAG)151 tRNAPyl(CTA)], p[sfGFP(TAG)151 tRNApAzF(CTA)], and p[sfGFP(TAC)151 tRNApAzF(CTA)] were cloned by Golden Gate assembly (using natural inserts; see section Golden Gate assembly of UBP-containing plasmids). p[sfGFP(gg)151], p[sfGFP(TAC)151], and p[sfGFP(TAG)151] were cloned by PCR linearization and ligation of a corresponding sfGFP and tRNA expression plasmid to remove the tRNA expression cassette. Due to the presence of a BsaI restriction site near the serT anticodon when the anticodon is the amber suppressor CTA, p[sfGFP(TAG)151 tRNASer(CTA)] was cloned by PCR linearization and ligation of p[sfGFP(TAG)151] using primer overhangs to introduce the tRNASer(CTA) expression cassette.
p[sfGFP(TAC)151 tRNAPyl(gg)] and p[sfGFP(TAC)151 tRNApAzF(gg)] were cloned by a partial Golden Gate assembly (without the KpnI/T5 exonuclease digest described in Zhang2) between the corresponding Golden Gate destination plasmid and a natural sfGFP insert (made using primer GFP151(TAC)), transformation into BL21(DE3), and selection on plates also containing 100 μM IPTG (to induce expression of sfGFP and thus verify the correct cloning of the sfGFP insert). Plasmids containing natural codon mutations at position 151 (i.e. p[sfGFP(AGT)151], p[sfGFP(ANC)151], and p[sfGFP(GNC)151]) were cloned by PCR amplification of p[sfGFP(TAC)151] with primers containing these mutations and blunt-ended ligation. Similarly, plasmids containing natural anticodon mutations in serT (i.e. p[sfGFP(gg)151 tRNASer(GNT)]) were cloned by mutation of the CTA anticodon in p[sfGFP(TAG)151 tRNASer(CTA)], followed by restriction digest cloning to replace sfGFP(TAG)151 with sfGFP(gg)151.
Golden Gate assembly of UBP-containing plasmids
Plasmids containing UBPs in sfGFP (and if present, the gene encoding tRNASer, tRNAPyl, or tRNApAzF) were generated by PCR amplification of template oligonucleotides containing dNaM and Golden Gate assembly19, as previously described2; see Supplementary Table 2 for a full list of primers and templates and Supplementary Table 1 for their corresponding Golden Gate destination plasmids (annotations of plasmid sequences are provided in Supplementary Notes).
In vivo translation experiments
Chemically competent YZ3 cells were prepared using MgCl2 and CaCl2, as previously described20, but without the addition of glycerol, and transformed with synthetase expression plasmids (pGEX-MbPylRS TetR or pGEX-MjpAzFRS TetR) or an empty plasmid that expresses tetR (pGEX tetR; for the Ser incorporation experiments). Following transformation, single colonies were isolated and used to inoculate cultures that were then grown and then stored in glycerol (25% v/v) at −80 °C.
Electrocompetent YZ3 cells carrying synthetase expression plasmids or pGEX-empty tetR were prepared as previously described2. Freshly prepared electrocompetent YZ3 cells (50 μL) were electroporated with ~0.4 ng of Golden Gate assembled plasmids containing UBP(s) and then immediately diluted with 950 μL of pre-warmed media supplemented with chloramphenicol. A 5-μL aliquot of this dilution was then immediately diluted 5–fold with the same pre-warmed media, but additionally supplemented with dNaMTP (150 μM) and dTPT3TP (10 μM). Samples were incubated for 1 h at 37 °C without shaking and then various dilutions of the sample were plated on solid media (2 mL in a 35 (D) × 10 (H) mm cell culture dish for each plate) supplemented with chloramphenicol, ampicillin, zeocin, dNaMTP (150 μM) and dTPT3TP (10 μM).
Following overnight growth (~12 h, 37 °C), individual colonies were used to inoculate liquid media of the same composition as the solid media. Cells were then monitored for growth, collected at an OD600 ≈ 1 and rapidly chilled to 4 °C (to pause growth, as individual cultures took varying amounts of time to reach an OD600 ≈ 1). Once all cultures were collected, cells were diluted to an OD600 ≈ 0.1–0.2 in 300 μL of media and monitored for growth; any remaining culture not used in the dilution was pelleted and stored at −80 °C for subsequent plasmid isolation to determine UBP retention (vide infra). When cultures reached an OD600 ≈ 0.4–0.6, they were supplemented with NaMTP (250 μM) and TPT3TP (30 μM) (unless otherwise indicated e.g. Extended data Fig. 4) and the appropriate ncAA (or ddH2O for cultures without PrK or 0.2 M NaOH for cultures without pAzF) at the concentrations indicated in the respective figure captions. Cultures were then grown for 20 min before adding 1 mM IPTG to induce T7 RNA polymerase and transcription of tRNASer, tRNAPyl, or tRNApAzF, and PylRS or pAzFRS, if present, and subsequently monitored for growth and fluorescence. Following a period of T7 RNA polymerase and tRNA induction (0.5 h for Ser incorporation and pAzFRS experiments, 1 h for PylRS experiments), sfGFP was induced with 100 ng/mL of anhydrotetracycline. After induction, cell cultures were rapidly cooled by shaking in a shallow ice water bath and collected at the time points indicated (see respective figures). Cultures were aliquoted (50 μL for plasmid isolation to determine UBP retention, 50 μL for crude cell lysates, and 150 μL (Ser incorporation samples), 150 or 230 μL (PrK incorporation samples from cells expressing fully natural or unnatural codon-containing sfGFP, respectively), or 100 μL (pAzF incorporation samples) for affinity purification of sfGFP), pelleted and stored at −80 °C before performing the analyses in the following sections. Due to the higher volume of culture (230 μL) used in the purification of some sfGFP samples in the PrK incorporation experiments, the crude cell lysates (for western blotting) of the corresponding samples were isolated from a separate experimental replicate.
Transformations with natural sfGFP plasmids were performed using freshly prepared chemically competent YZ3 cells carrying synthetase expression plasmids or pGEX-empty TetR (vide supra) and 1–10 ng of natural sfGFP plasmid minipreps, with plating on solid media. Following transformation, individual colonies were inoculated, cultured, and processed as described above, with the exception that strains transformed with natural sfGFP plasmids in PrK (e.g. Fig. 2) and pAzF (e.g. Fig. 3) incorporation experiments were generally cultured without unnatural triphosphates (unless otherwise indicated, e.g. Extended data Fig. 4b). YZ3 cells transformed with natural sfGFP plasmids in Ser incorporation experiments (Fig. 1) were grown with the unnatural triphosphates (at the concentrations indicated above) in liquid media only.
Statistics and Reproducibility
Data presented in figures are representative data sets collected by single experimental replicates (unless otherwise indicated below) in which the colonies for each experimental condition were isolated from one transformation and plating, and were grown and processed in parallel; performing multiple transformations and platings and propagating several colonies from each transformation was cost prohibitive due to the amount of unnatural triphosphates required for culturing on solid media. Additional experimental replicates performed by direct inoculation of transformations into liquid media without plating, but under otherwise identical conditions, produced virtually identical results, as determined by fluorescence and growth (but without western blot or MS analysis, unless otherwise indicated).
Experimental replicates were performed as follows: Ser incorporation experiments (Fig. 1) and decoding experiments with near-cognate natural tRNASer (Extended data Fig. 2) were run in parallel from the same transformation and were performed once with plating and once without. PrK incorporation experiments (Fig. 2, Extended data Fig. 3, Extended data Fig. 4c) and PrK titration experiments (Extended data Fig. 5) were run in parallel from the same transformation (with the exception that the cell lysates analyzed in the fourth, seventh, eighth and eleventh lanes of Extended data Fig. 3a and the purified sfGFP samples analyzed in the eighth and eleventh lanes of Fig. 2c were produced in a separate experiment) and were performed once with plating and once without. pAzF incorporation experiments (Fig. 3 and Extended data Fig. 6) were performed once with plating and twice without. The unnatural ribotriphosphate control experiments (Extended data Fig. 4a) were performed as separate experimental replicates from the main PrK incorporation experiments, were performed once with plating and once without, and were analyzed by fluorescence, growth and western blot for both of these replicates. The experiments that correspond to Extended data Figs. 1 and 4b were performed once.
Western blots were performed on one cell lysate sample or one purified sfGFP sample from one experimental replicate. Technical replicates were performed as follows: Fig. 1e (1 replicate), Fig. 2c (3 replicates), Fig. 3b (2 replicates), Extended data Fig. 3a (1 replicate), Extended data Fig. 4a (1 replicate), Extended data Fig. 5a (2 replicates).
In addition to the experimental replicates described above, experiments were also performed without plating and with minor technical variations (e.g. growth in 96-well plates instead of 48-well plates, different induction schemes, etc.) and produced results consistent with the conclusions presented herein (assessed by fluorescence, growth, and western blot).
Cultures propagated from colonies transformed with different plasmids are necessarily separate transformations, whereas cultures grown under different media conditions (e.g. the presence or absence of an added amino acid or unnatural triphosphate) are derived from the same starter culture, i.e. after the initial propagation of each colony to an OD600 ≈ 1 (vide supra), the dilution to OD600 ≈ 0.1–0.2 in 300 μL was scaled according to the number of conditions to be tested, and the dilutions were performed as one batch and aliquoted.
Affinity purification of sfGFP
Cell pellets collected at the end of in vivo translation experiments were lysed by resuspension in 100 μL of BugBuster® (EMD Millipore) and incubation with shaking for 15 min at room temperature. Cell lysates were then diluted in Buffer W (50 mM HEPES pH 8, 150 mM NaCl, 1 mM EDTA) to a final volume equal to 500 μL less the volume of beads, vide infra, and mixed with magnetic Strep-Tactin beads (5% (v/v) suspension of MagStrep “type3” XT beads, IBA Lifesciences), equilibrated in Buffer W. 100 μL of beads were used in the purification of all samples for which a yield is reported (Extended data Table 3); all other samples were purified with 20 μL of beads. Samples were then incubated for 30 min at 4 °C with constant gentle inversion. Beads were then pulled down with a magnetic rack, washed with Buffer W (2×500 μL), and eluted with 25 μL of buffer BXT (100 mM Tris-HCl pH 8, 150 mM NaCl, 1 mM EDTA, 50 mM D-biotin; for PrK incorporation experiments, buffer BXT was made with 50 mM HEPES pH 8 instead of Tris, due to the incompatibility of Tris with copper-catalyzed click conjugation) for 10 min at room temperature with occasional vortexing. Purified proteins were quantified using a Qubit™ Protein Assay Kit (Thermo Fisher).
Sample preparation for LC-MS
Purified sfGFP proteins were dialyzed (2,000 MWCO Slide-A-Lyze MINI dialysis cassettes, Thermo Fisher) with 2×20 min incubations in 2 L of 25 mM Tris-HCl pH 7.5 at room temperature, then quantified using a Qubit™ Protein Assay Kit. An aliquot corresponding to 3–3.5 μg protein was digested with a two-step protocol with Lysyl Endopeptidase (LysC; Wako Chemicals) and sequencing grade modified porcine trypsin (Promega) according to Pirman21 with the following minor modifications: protein was dissolved in 15 μL of solubilization buffer; heat denaturation was performed for 6 min at 95 °C; and the LysC digest was 2 h. Desalting of peptides was performed according to Rappsilber22 with StageTips prepared in-house from 2 Empore disks C18 (3M Empore; Sigma-Aldrich) with a diameter of 1.60 mm. The resulting desalted peptides were lyophilized and then reconstituted in 12 μL of 2:3:7 by volume of 70% formic acid, 1-propanol, and 0.5% acetic acid. The concentration of the peptide stock solutions was estimated to be between 100–125 ng/μL (assuming 50% recovery from the digestion and clean-up step). Peptide stock solutions were further diluted to a final peptide concentration of 2.85 ng/μL immediately prior to LC-MS analysis. MS samples were prepared in HPLC glass sample vials with a solution of 100 ng/μL sodium deoxycholate prepared in 0.1% TFA, 8% formic acid, and 5% DMSO as the diluent.
Liquid Chromatography
Liquid chromatography was performed on an UltiMate 3500RS nanocapillary UHPLC (Thermo Scientific, Waltham, MA) equipped with a ProFlow flow module, a 10-port switching valve, a loading pump, and an autosampler operated at 7 °C. The trapping and analytical column were connected using a vented split setup23 with a micro tee (IDEX, Lake Forest, IL) connected to the 10-port valve. The trapping column and analytical capillary column were prepared in house using 360 μm OD and 150 μm ID fused silica capillaries (Molex, Lisle, IL) with a 2–3 mm long Kasil frit prepared according to the instructions provided with the Frit Kit (Next Advance, Averill Park, NY). The trapping and capillary column were slurry packed on a PC77 Pressure Injection Cell (Next Advance, Averill Park, NY) to a length of 30 mm and 200 mm respectively using ReproSil-Pur 120 C18-AQ, 3 μm for the trapping column, and ReproSil-Pur 120 C18-AQ, 1.9 μm (Dr. Maisch GmbH, Ammerbuch, Germany) for the analytical column respectively. Methanol was used as the packing solvent. All separations were performed at room temperature and the injection volume was 1 μL (2.85 ng peptides). Peptides were loaded onto the trap column at a flow rate of 5 μL/min with 2% ACN, 0.05% TFA as the solvent. Gradient elution of peptides was performed at a flow rate of 1 μL/min with the capillary pump. Eluent A consisted of 0.1% formic acid in water and eluent B was 0.1% formic acid in 80% acetonitrile respectively. The following 90 min linear gradient program was used: (min/%B) 0.0/2.0, 4.0/2.0, 5.0/8.0, 30.0/18.0, 45.0/24.0, 75.0/50.0, 78.0/60.0, 80.0/95.0, 83.0/95.0, 85.0/2.0, 90.0/2.0. A control injection consisting of 40 fmol of a tryptic digest of BSA was performed between samples for quality control purposes. Care was taken to eliminate carryover between sample injections. Sample injections were followed by 4 injections with 2 μL MS solvent followed by a solvent blank, which was used to assess carryover prior to the injection of the next sample. This procedure effectively eliminated carryover between samples originating from different experimental conditions.
Mass Spectrometry
Nanocapillary LC-MS/MS was performed on an Impact II QqTOF mass spectrometer (Bruker, Billerica, MA) according to Beck24 with the following modifications. The instrument was equipped with a captive spray ion source fitted with a 20-μm ID spray tip and the nanoBooster dopant system for increased sensitivity. The ion source was operated with a spray voltage of 1000 V at 150 °C with nitrogen (4 L/min) as the drying gas. The nanoBooster was operated at 0.2 bar with a solvent mixture of 3:1 by volume of acetonitrile and methanol. Calibration of the mass spectrometer was performed daily using a sodium-TFA solution prepared according to Moini25. Spectra were collected at a resolving power of 60,000 using a data dependent acquisition method with a cycle time of 1.1 s. Each scan event consisted of a single precursor ion scan (scan range 150 Da to 2200 Da, 5 Hz) followed by 20 scheduled tandem MS scans performed at 20 Hz. Collision-activated dissociation (CID) was performed with a precursor isolation window of 2 Da and using nitrogen as the collision gas. The collision energy was dynamically adjusted between 23 and 65 eV depending on ion mass and charge state of the selected precursor as defined in the acquisition software (Bruker Compass 1.9 Otof Control Version 4.0, Build 60.11, Top20 Auto MS MS method). Dynamic exclusion parameters were as follows: the strict active exclusion option was activated, the preferred precursor ion charge range was 2–6, singly charged precursors were excluded, and acquired precursor ions were excluded for 0.4 min unless the precursor ion intensity exceeded 3.0× the intensity of the precursor observed in the previous MS1 scan. All data were collected in profile mode.
Bioinformatics
Database searching
Database searching and identification of peptides containing natural and ncAAs was performed according to a previously described workflow26. Database searches were performed with MaxQuant27 v. 1.5.8.0 using the default search parameters with the following minor changes. The databases consisted of a custom database of twenty sfGFP variants representing all natural amino acids at position 151, and an E. coli reference proteome database with 4306 protein entries (UniProt, Strain MG1655 retrieved 08/16/2016). The minimum peptide length was 5; fixed modifications were Carbamidomethyl (C); variable modifications were Deamidation (N/Q), Oxidation (M), and PrK, which represents the unnatural amino acid (N6-[(2-propynyloxy)carbonyl]-L-lysine) and is defined as a custom modification (+C8H8O, +96.0575 Da) to Asn. Peptide spectral matches and protein identifications were reported with a false discovery rate of 1% each. Proteins and peptides matching the contaminant database were removed by filtering in Microsoft Excel. A summary of all identified reporter peptides and three sfGFP reference peptides is presented in Extended data Table 4.
Reporter peptide quantitation in Skyline
LC-MS data are reported in Extended data Table 4. Quantitation of LC-MS chromatographic peak intensities was performed by extracting MS1 precursor ion chromatograms with Skyline Software (v. 3.6.0.10167)28. All reporter peptides identified during database searching were imported into Skyline along with three reference sfGFP peptides that were used for normalization of reporter peptide intensities. All peptides used for quantitation are listed in Extended data Table 4. Extracted precursor ion chromatograms were generated for the most abundant charge state for each peptide. Chromatographic peak integration was manually verified to ensure consistent peak integration across all samples. Further data processing was performed in Microsoft Excel. Reporter peptide intensities were normalized by dividing the reporter peptide peak areas for each sample by the sum of all three reference peptide peak areas from the same sample, which enabled direct comparison of reporter peptide intensities across samples. The normalized reporter peptide intensities corresponding to each amino acid detected at position 151 of sfGFP were summed and divided by the total normalized peak area for all observed reporter peptides within each sample to obtain the extracted precursor ion intensities presented in the main text, Fig. 1f, Fig. 2d, and Extended data Table 1. Finally, these relative percentages were summed for each amino acid across replicates and used to calculate a 95% confidence interval to assess the statistical significance of the results.
Click conjugation of TAMRA
For copper-catalyzed click conjugation of TAMRA, 200 ng of purified sfGFP protein (3–5 μL, depending on the concentration of the eluted protein following purification) was incubated with 2 mM tris(3-hydroxypropyltriazolylmethyl)amine (THPTA) (Sigma-Aldrich), 1 mM CuSO4, 15 mM sodium ascorbate (Sigma-Aldrich) and 0.5 mM TAMRA-Azide (Click Chemistry Tools, Scottsdale, AZ; product #AZ109) for 1 h at room temperature in darkness. For copper-free click conjugation of TAMRA, 200 ng of purified sfGFP protein (3–5 μL, depending on the concentration of the eluted protein following purification) was incubated with 0.1 mM TAMRA-DBCO (Click Chemistry Tools; product #A131) overnight at room temperature in darkness. Following click conjugation, all steps were performed with care to minimize the exposure of the samples, gels, and blots to ambient light to minimize photobleaching of TAMRA.
Western blotting of TAMRA-conjugated sfGFP
200 ng of purified and conjugated sfGFP protein was mixed 2:1 (v:v) with loading buffer (250 mM Tris-HCl, 30% (v/v) glycerol, 2% (w/v) SDS), heated for 5 min at 95 °C and subjected to SDS-PAGE (stacking gel: 5% (w/v) acrylamide:bis-acrylamide 29:1 (Fisher), 0.125 M Tris-HCl and 0.1% SDS, pH 6.8 (ProtoGel Stacking Buffer, National Diagnostics); resolving gel: 15% (w/v) acrylamide:bis-Acrylamide 29:1 (Fisher), 0.375 M Tris-HCl and 0.1% SDS, pH 8.8 (ProtoGel Resolving Buffer, National Diagnostics; 1.5 mm Mini-PROTEAN® Short Plates (Bio-Rad)) with a protein ladder (Color Prestained Protein Standard, Broad Range, New England Biolabs (NEB)). Gels were run at 50 V for 15 min and then at 120 V for ~5 h in SDS-PAGE buffer (25 mM Tris base, 200 mM glycine, 0.1% (w/v) SDS).
Following SDS-PAGE, samples were transferred to low-fluorescence PVDF (0.2 μm, BioRad) by wet transfer (20% (v/v) MeOH, 50 mM Tris base, 400 mM glycine, .0373% (w/v) SDS; 90 V, 1 h, 4 °C). Membranes were blocked overnight at 4 °C in 5% (w/v) nonfat milk in PBS-T (PBS pH 7.4, 0.01% (v/v) Tween-20), probed with a rabbit α-GFP antibody (product #G1544, lot 046M4871V, Sigma-Aldrich; 1:2,000 in PBS-T) for 1 h at room temperature, washed with PBS-T (1×5 min), probed with a goat α-rabbit-Alexa Fluor 647-conjugated antibody (product #A32733, lot #SD250298, Thermo Fisher; 1:20,000 in PBS-T) for 45 min at room temperature, washed with PBS-T (3×5 min), and subsequently imaged using a flatbed laser scanner (Typhoon 9410 with Typhoon Scanner Control v5 (Build 410 5.0.0409.0700), GE Healthcare Life Sciences); 50 μm resolution; 532 nm laser excitation and 580/30 nm emission filter with 400 V PMT for TAMRA; 633 nm laser excitation and 670/30 nm emission filter with 500 V PMT for Alexa Fluor 647). Images were pseudo-colored and quantified using Image Studio Lite (v. 5.2.5, LI-COR Biosciences). Overlays of the TAMRA and Alexa Fluor 647 scans were produced using Paint.NET (v. 3.5.10). Western blots in every multi-blot panel (i.e. Fig. 2c, Extended data Figs. 3a, 4a, 5a) were performed, imaged, and processed in parallel under identical conditions.
Western blotting of cell lysates
Cell pellets collected at the end of in vivo translation experiments were resuspended with ddH2O to a calculated OD600 ≈ 2 (based on the OD600 of cultures at the time of collection). 5 μL of cells was then mixed with 4 μL of loading buffer (250 mM Tris-HCl, 30% (v/v) glycerol, 2% (w/v) SDS, 6.25% (v/v) βME) and 1 μL of loading dye (Product #B7024S, NEB), heated for 5 min at 95 °C and subjected to SDS-PAGE under identical conditions as above, with the exception that gels were run at 50 V for 15 min and then at 120 V for ~2 h.
Following SDS-PAGE, samples were transferred to PVDF (0.45 μm Immobilon, EMD Millipore) and western blotting was performed as above, with the exception that the membrane was probed with a goat α-rabbit-HRP (Bio-Rad product #170-6515, lot #64106148) secondary antibody (instead of the goat α-rabbit-Alexa Fluor 647 antibody) for 1 h at room temperature, washed with PBS-T (3×5 min), incubated with chemiluminescent substrate (Pierce™ ECL Western Blotting Substrate, Thermo Fisher) for 5 min, and imaged with a ChemiDoc-It® Imager (UVP) and UVP VisionWorks® LS (v 8.6.15114.8618) software. Multiple exposures were taken and images used in the manuscript were processed in UVP VisionWorks®, using the noise removal setting (Starfield Subtraction), and then further processed (color inverted) in Image Studio Lite (v. 5.2.5, LI-COR Biosciences).
Biotin shift assay
The retention of the UBP(s) in isolated plasmids was determined as previously described2 using d5SICSTP and dMMO2bioTP, and the primers indicated in Supplementary Table 2. Images were quantified using Image Studio Lite (v. 5.2.5, LI-COR Biosciences). UBP retention was normalized by dividing the percent raw shift of each plasmid sample by the percent raw shift of the dNaM-containing oligonucleotide template used in the assembly of the input plasmid, except for UBP retentions in the gene encoding tRNApAzF, which are reported as raw shifts. This was due to an inability to correctly amplify the sequence containing the tRNApAzF anticodon (under the conditions used for the PCR in the biotin shift assay) with primers that are compatible with both the control oligonucleotide and plasmids. Thus, primers that anneal outside of the tRNApAzF sequence (which are incompatible with the control oligonucleotide) were used in the PCR for the biotin shift assay. No such difficulty was encountered under the conditions used to generate the dNaM-dTPT3 insert used in plasmid assembly and thus, the problem appears to be specific to the PCR conditions used in the biotin shift assay.
Data availability
The data that support the findings of this study are available from the corresponding author upon reasonable request. Plasmid sequences have been deposited in the GenBank database under the accession numbers MF996900–MF996913.
Extended Data
Extended data Figure 1. Fluorescence of cells expressing sfGFP with various codons at position 151.
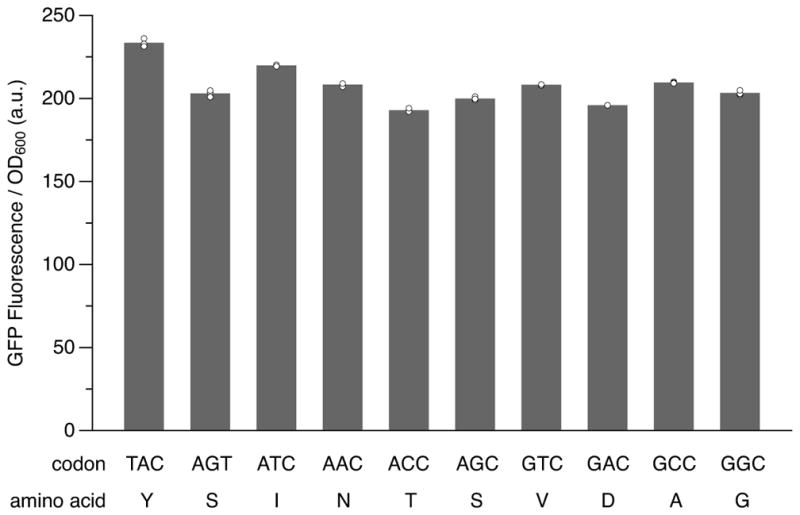
Strain YZ3 cells carrying a plasmid expressing TetR and an sfGFP plasmid with the indicated position-151 codon were grown to an OD600 ~0.5 and induced with IPTG and aTc. Fluorescence measurements were taken after 3 h of induction. Data shown as mean with individual values, n = 3 cultures originating from the same colony and grown in parallel (technical replicates).
Extended data Figure 2. Decoding of the AXC codon with natural near-cognate anticodons.

a, b, Fluorescence (a) and growth (b) of cells expressing sfGFP(AXC)151 with or without tRNASer with the indicated anticodon. Cells were induced as described in Fig. 1c,d and fluorescence measurements correspond to the last time point shown in Fig. 1c. Values for the GYT anticodon and in the absence of tRNASer (−tRNA) correspond to the same values in Fig. 1c,d. Individual data points (with means in a) shown from n = 4 cultures, each propagated from an individual colony (biological replicates).
Extended data Figure 3. Western blots and growth of cells decoding AXC and GXC codons with tRNAPyl.

a, Western blot of lysates (normalized by OD600) from cells expressing sfGFP with the indicated position 151-codon, in the presence (+) or absence (−) of a tRNAPyl with a cognate anticodon, PylRS, or 20 mM PrK in the media. Blots were probed with an α-GFP antibody (N-terminal epitope). Cells were induced and collected at an equivalent time point as described in Fig. 2b. For blot source data, see Supplemental Figure 1. b, Growth of cultures analyzed in Fig. 2a. The fold change in OD600 between induction of sfGFP (t = 1 h) and the final time point is greatest when all components necessary for aminoacylating tRNAPyl are present. Variations in the absolute value of OD600 are due to small variations in cell density at the start of T7 RNAP (and if present tRNAPyl) induction (t = 0). Individual data points shown from n = 4 cultures, each propagated from an individual colony (biological replicates).
Extended data Figure 4. Decoding of AXC and GXC codons with tRNAPyl and cell growth as a function of added unnatural ribotriphosphates.

a, Fluorescence (upper panel) and western blots of purified sfGFP (lower panel) from cells expressing sfGFP and tRNAPyl with the position 151-codon/anticodon indicated, in the presence (+) or absence (−) of each unnatural ribotriphosphate in the media, and with or without 20 mM PrK. Cells were induced as described in Fig. 2b and fluorescence measurements were taken at the end of induction (~3.5 h), prior to collecting the cells and purifying the sfGFP protein for click conjugation of TAMRA and western blotting. Western blots were probed with an α-GFP antibody and imaged to detect both sfGFP and the conjugated TAMRA; all lanes correspond to sfGFP purified from cells grown with added PrK. Data shown as mean with individual values, n = 3 cultures, each propagated from an individual colony (biological replicates); n.d., not determined. For blot source data, see Supplemental Figure 1. b, Fluorescence and growth of cells expressing sfGFP(TAC)151 in the presence (+) or absence (−) of both unnatural deoxyribotriphosphates and each unnatural ribotriphosphate. t = 0 corresponds to the addition of IPTG to induce expression of T7 RNAP; aTc was added at t = 1 h to induce expression of sfGFP. Individual data points shown from n = 3 cultures, each propagated from an individual colony (biological replicates). At the concentrations used (see Methods), dNaMTP and dTPT3TP do not inhibit cell growth, whereas both unnatural ribotriphosphates, particularly TPT3TP, show some inhibition of growth. c, Cell growth corresponding to the cultures with added PrK (20 mM) whose fluorescence is shown in Fig. 2b. Cells expressing sfGFP with natural codons were grown without any unnatural triphosphates, whereas cells expressing sfGFP with unnatural codons were grown with both unnatural deoxy- and ribotriphosphates. Individual data points shown from n = 4 cultures, each propagated from an individual colony (biological replicates).
Extended data Figure 5. Decoding of AXC and GXC codons with tRNAPyl as a function of PrK concentration in the media.

a, Western blots of sfGFP purified from cells expressing sfGFP and tRNAPyl with the indicated position-151 codon/anticodon, with conjugation of TAMRA and the addition of PrK to the media at the indicated concentrations. sfGFP was induced and purified from cells collected as described in Fig. 2b. Western blots were probed with an α-GFP antibody and imaged to detect both sfGFP and the conjugated TAMRA. For blot source data, see Supplemental Figure 1. b, Fluorescence of cells (measured at the last time point shown in c) expressing sfGFP and tRNAPyl with the indicated position-151 codon and anticodon, respectively, as a function of PrK concentration in the media. Fluorescence values for the 0 and 20 mM PrK conditions are the same as the (−) and (+) PrK conditions, respectively, shown in Fig. 2b. Individual data points shown from n = 4 cultures, each propagated from an individual colony (biological replicates). c, Timecourse analysis of fluorescence and cell growth in b. For clarity, only one representative culture (of four) is shown for each codon/anticodon pair and PrK concentration. We attribute the low level of sfGFP produced in the absence of PrK to decoding by endogenous tRNAs and loss of UBP retention in sfGFP (Extended data Table 2). However, the relative amount of sfGFP that contains PrK (a) and absolute amount of sfGFP expressed (b,c) increased in a dose-dependent manner with increasing PrK in the media, ultimately resulting in nearly full incorporation of PrK, suggesting that endogenous read-through of the AXC and GXC codons can be efficiently suppressed with sufficient concentrations of charged PrK-tRNAPyl(GYT) or PrK-tRNAPyl(GYC).
Extended data Figure 6. Cell growth of the cultures whose fluorescence is shown in Fig. 3a.
Individual data points shown from n = 4 cultures, each propagated from an individual colony (biological replicates).
Extended data Table 1.
Relative abundance of amino acids at position 151 in sfGFP for experiments described in Figs. 1f and 2d.sfGFP purified from cells expressing sfGFP with or without tRNAs with the indicated position-151 codon and anticodon, respectively, were analyzed by LC-MS/MS. The extracted precursor ion intensities for the reporter peptides LEYNFNSHNVX151ITADK (X = PrK or any identified natural amino acid except K or R) and LEYNFNSHNVX151 (if X = K or R) are expressed as a percentage of the sum of ion intensities for all observable reporter peptides. The table of values corresponds to the mean relative abundances and 95% CIs of all amino acids detected at position 151 of sfGFP, n = 4 purified sfGFP samples, each from a culture propagated from an individual colony. Values <0.1% (on average, for the codons indicated in the respective main text figures) are excluded from the data presented in Figs. 1f and 2d.
| Sample | Relative precursor ion intensities (%) | |||||||||
|---|---|---|---|---|---|---|---|---|---|---|
| S | Y | PrK | I/L | N | V | K | G | C | M | |
| sfGFP(AGT)151 | 99.80 | 0.03 | 0.06 | 0.00 | 0.04 | 0.03 | 0.00 | 0.02 | 0.02 | 0.00 |
| sfGFP(AXC)151/tRNASer(GYT) | 98.47 | 0.04 | 0.04 | 1.23 | 0.14 | 0.02 | 0.00 | 0.05 | 0.01 | 0.00 |
|
| ||||||||||
| sfGFP(TAC)151 | 0.11 | 99.71 | 0.06 | 0.00 | 0.05 | 0.02 | 0.00 | 0.02 | 0.02 | 0.01 |
| sfGFP(TAG)151/tRNAPyl(CTA) | 0.06 | 0.04 | 99.53 | 0.00 | 0.04 | 0.01 | 0.29 | 0.01 | 0.01 | 0.00 |
| sfGFP(AXC)151/tRNAPyl(GYT) | 0.25 | 0.03 | 96.16 | 2.06 | 1.06 | 0.02 | 0.37 | 0.03 | 0.01 | 0.00 |
| sfGFP(GXC)151/tRNAPyl(GYC) | 0.06 | 0.04 | 97.50 | 0.00 | 0.01 | 1.26 | 0.74 | 0.37 | 0.01 | 0.00 |
| Sample | 95% CI (%) | |||||||||
|---|---|---|---|---|---|---|---|---|---|---|
| S | Y | PrK | I/L | N | V | K | G | C | M | |
| sfGFP(AGT)151 | 0.31 | 0.04 | 0.09 | 0.00 | 0.06 | 0.05 | 0.01 | 0.03 | 0.03 | 0.00 |
| sfGFP(AXC)151/tRNASer(GYT) | 0.73 | 0.04 | 0.03 | 0.64 | 0.04 | 0.01 | 0.00 | 0.04 | 0.01 | 0.00 |
|
| ||||||||||
| sfGFP(TAC)151 | 0.06 | 0.11 | 0.05 | 0.00 | 0.03 | 0.02 | 0.00 | 0.01 | 0.02 | 0.00 |
| sfGFP(TAG)151/tRNAPyl(CTA) | 0.03 | 0.02 | 0.11 | 0.00 | 0.02 | 0.02 | 0.03 | 0.01 | 0.01 | 0.00 |
| sfGFP(AXC)151/tRNAPyl(GYT) | 0.13 | 0.02 | 0.25 | 0.06 | 0.03 | 0.01 | 0.06 | 0.01 | 0.02 | 0.01 |
| sfGFP(GXC)151/tRNAPyl(GYC) | 0.05 | 0.04 | 0.70 | 0.00 | 0.01 | 0.24 | 0.28 | 0.22 | 0.01 | 0.00 |
Extended data Table 2.
UBP retention. Retention of the UBP(s) in plasmids with the indicated position-151 codons of sfGFP and anticodons of the indicated tRNAs were determined for a time point prior to sfGFP induction and at the end of induction, as described in Methods. The reported values are the mean UBP retention over the course of the induction (calculated from the retentions at these two time points) ± 95% CI, n = 4 cultures, each propagated from an individual colony, except for values in rows shaded gray, for which n = 3. n/a, not applicable (because the relevant sequence is natural or absent). All plasmids were isolated from cultures grown in the presence of 20 mM PrK or 5 mM pAzF (except for Ser incorporation experiments). SerRS indicates charging with the endogenous E. coli synthetase. Minus sign denotes the absence of PylRS in cells with tRNAPyl or the absence of an ectopically expressed tRNA. Retentions in rows shaded green correspond to cultures from which sfGFP was also purified and analyzed by LC-MS/MS and/or western blot of TAMRA-conjugated sfGFP (see Figs. 1f (Ser), 2d (PrK), and 3b (pAzF)); rows shaded gray correspond to the cultures analyzed in Extended data Fig. 4. Despite the fact that all four unnatural triphosphates enter the cell through the same transporter and thus competitively inhibit one another’s import, no differences in UBP retention were observed with the presence (+) or absence (−) of NaMTP and/or TPT3TP in the media. These data, and the requirement of both unnatural ribotriphosphates for high levels of sfGFP expression with high-fidelity PrK incorporation (Extended data Fig. 4), collectively demonstrate that the expression level of the PtNTT2 transporter in strain YZ32 imports the requisite levels of unnatural triphosphates necessary to sustain UBP replication and transcription.
| aaRS | tRNA | NaMTP | TPT3TP | Codon | UBP retention in sfGFP (%) | Anti-codon | UBP retention in tRNA gene (%) |
|---|---|---|---|---|---|---|---|
| SerRS | – | + | + | AXC | 98±0 | – | n/a |
| SerRS | Ser | + | + | AXC | 98±2 | GYT | 89±2 |
| SerRS | Ser | + | + | AXC | 94±8 | GAT | n/a |
| SerRS | Ser | + | + | AXC | 94±2 | GGT | n/a |
| SerRS | Ser | + | + | AXC | 95±0 | GCT | n/a |
| SerRS | Ser | + | + | AXC | 95±1 | GTT | n/a |
|
| |||||||
| – | Pyl | + | + | AXC | 97±1 | GYT | 89±2 |
| PylRS | – | + | + | AXC | 97±1 | – | n/a |
| PylRS | Pyl | + | + | TAC | n/a | GYT | 92±3 |
| PylRS | Pyl | + | + | AXC | 96±1 | GYT | 90±2 |
| PylRS | Pyl | + | + | AXC | 98±0 | GYT | 95±2 |
| PylRS | Pyl | + | − | AXC | 98±1 | GYT | 96±1 |
| PylRS | Pyl | − | + | AXC | 98±1 | GYT | 95±1 |
| PylRS | Pyl | − | − | AXC | 97±1 | GYT | 94±4 |
|
| |||||||
| – | Pyl | + | + | GXC | 98±1 | GYC | 96±3 |
| PylRS | – | + | + | GXC | 97±3 | – | n/a |
| PylRS | Pyl | + | + | TAC | n/a | GYC | 96±1 |
| PylRS | Pyl | + | + | GXC | 97±1 | GYC | 95±0 |
| PylRS | Pyl | + | + | GXC | 96±3 | GYC | 97±1 |
| PylRS | Pyl | + | − | GXC | 96±2 | GYC | 97±1 |
| PylRS | Pyl | − | + | GXC | 97±2 | GYC | 97±0 |
| PylRS | Pyl | − | − | GXC | 96±1 | GYC | 97±1 |
|
| |||||||
| pAzFRS | pAzF | + | + | AXC | 98±0 | GYT | 90±1 |
| pAzFRS | pAzF | + | + | TAC | n/a | GYT | 91±1 |
Extended data Table 3.
Yields of sfGFP protein expressed in Ser, Prk and pAzF incorporation experiments. Yields were calculated from the total amount of protein purified and the volume of culture used for purification (see Methods). Data are mean ± s.d. (n = 4 sfGFP samples, each purified from a culture propagated from an individual colony) and were determined from the same cultures analyzed in Figs. 1f (for SerRS) and 2d (for PylRS), as well as the cultures corresponding to the (+) pAzF samples in Fig. 3a (for pAzFRS). Yields of purified sfGFP are comparable to the mean total fluorescence (not normalized to OD600) of the cultures from which they were purified. Fluorescence values correspond to the time point at which cells were collected for sfGFP purification; see Figs. 1c (Ser), 2b (PrK), and 3a (pAzF).
| Sample | aaRS | Yield (μg/mL) | Relative to control (%) | Total fluor (a.u.) | Relative to control (%) |
|---|---|---|---|---|---|
| sfGFP(AGT)151 | SerRS (endogenous) | 100±8 | 100 | 269 | 100 |
| sfGFP(AXC)151/tRNASer(GYT) | 97±9 | 96 | 259 | 96 | |
|
| |||||
| sfGFP(TAC)151 | PylRS | 135±17 | 100 | 400 | 100 |
| sfGFP(TAG)151/tRNAPyl(CTA) | 87±6 | 65 | 242 | 60 | |
| sfGFP(AXC)151/tRNAPyl(GYT) | 54±4 | 40 | 153 | 38 | |
| sfGFP(GXC)151/tRNAPyl(GYC) | 55±6 | 41 | 166 | 41 | |
|
| |||||
| sfGFP(TAC)151 | pAzFRS | 127±15 | 100 | 405 | 100 |
| sfGFP(TAG)151/tRNApAzF(CTA) | 75±9 | 59 | 287 | 71 | |
| sfGFP(AXC)151/tRNApAzF(GYT) | 86±6 | 68 | 333 | 82 | |
Extended data Table 4.
Mass spectrometry of sfGFP for identification and quantitation of ncAA incorporation.Summary of all reference and reporter peptides identified by database searching (upper table) and peptides used for precursor ion-based quantification (lower table). The highest scoring peptide for each identified peptide species is reported. PrK and natural amino acids at position 151 of sfGFP are denoted in red. Modifications are abbreviated as follows: (ox), oxidation of Met; N(pr), PrK; (de), deamidation of Asn.
| Modified sequence | Modifications | Precursor m/z |
Precursor charge |
Retention time (min) |
Mass error (ppm) |
PEP | Score |
|---|---|---|---|---|---|---|---|
| FEGDTLVNR* | Unmodified | 525.7644 | 2 | 28.86 | 0.18 | 0.00E+00 | 186.090 |
| SAMPEGYVQER* | Unmodified | 633.7928 | 2 | 31.73 | −0.56 | 2.49E−03 | 18.312 |
| SAM(ox)PEGYVQER* | Oxidation (M) | 641.7903 | 2 | 20.61 | −0.24 | 3.25E−07 | 60.102 |
|
|
Unmodified | 626.9709 | 3 | 39.28 | −0.40 | 3.58E−09 | 36.193 |
|
|
Unmodified | 962.9465 | 2 | 42.92 | 1.46 | 1.22E−77 | 90.434 |
|
|
Unmodified | 682.8333 | 2 | 27.99 | −0.46 | 1.01E−05 | 44.309 |
|
|
Unmodified | 607.9637 | 3 | 38.81 | 0.11 | 7.45E−03 | 16.306 |
|
|
PrK | 987.9814 | 2 | 45.99 | −0.01 | 0.00E+00 | 266.850 |
|
|
Deamidation (N), PrK | 659.3181 | 3 | 49.20 | 0.15 | 0.00E+00 | 128.900 |
|
|
Deamidation (N), PrK | 988.4734 | 2 | 49.13 | −0.11 | 0.00E+00 | 121.660 |
|
|
Deamidation (N), PrK | 659.3181 | 3 | 49.42 | 0.31 | 0.00E+00 | 95.662 |
|
|
Deamidation (N) | 926.9392 | 2 | 40.77 | NaN | 8.53E−280 | 60.628 |
|
|
Deamidation (N) | 926.9392 | 2 | 41.25 | −0.09 | 0.00E+00 | 127.710 |
|
|
Deamidation (N) | 618.2952 | 3 | 41.32 | 0.62 | 8.93E−96 | 68.919 |
|
|
Unmodified | 926.4472 | 2 | 39.64 | −0.26 | 0.00E+00 | 222.550 |
|
|
Unmodified | 621.9794 | 3 | 41.79 | −0.27 | 7.95E−40 | 62.377 |
|
|
Unmodified | 632.6367 | 3 | 40.29 | 2.97 | 2.03E−02 | 10.057 |
|
|
Deamidation (N) | 964.9549 | 2 | 46.10 | 0.52 | 2.44E−38 | 62.140 |
|
|
Deamidation (N) | 643.6390 | 3 | 46.39 | 0.37 | 0.00E+00 | 91.457 |
|
|
Deamidation (N) | 964.9549 | 2 | 46.39 | −0.34 | 2.00E−39 | 56.951 |
|
|
Unmodified | 964.4629 | 2 | 43.24 | −0.30 | 0.00E+00 | 309.980 |
|
|
Unmodified | 626.6513 | 3 | 44.33 | −0.24 | 7.78E−161 | 75.463 |
| Modified sequence | Modifications | Precursor m/z |
Precursor charge |
Retention time (min) |
|---|---|---|---|---|
| SAMPEGYVQER* | Unmodified | 633.7928 | 2 | 27.36 |
| SAM(ox)PEGYVQER* | Oxidation (M) | 641.7903 | 2 | 20.63 |
| FEGDTLVNR* | Unmodified | 525.7644 | 2 | 28.66 |
|
|
Unmodified | 617.9672 | 3 | 39.50 |
|
|
Deamidation (N) | 618.2952 | 3 | 40.25 |
|
|
Unmodified | 455.5580 | 3 | 27.94 |
|
|
Unmodified | 626.9709 | 3 | 39.20 |
|
|
PrK | 658.9900 | 3 | 45.71 |
|
|
Deamidation (N), PrK | 659.3181 | 3 | 49.19 |
|
|
Unmodified | 642.3001 | 3 | 45.47 |
|
|
Unmodified | 607.9637 | 3 | 38.81 |
|
|
Unmodified | 626.6513 | 3 | 44.38 |
|
|
Unmodified | 632.6367 | 3 | 40.33 |
|
|
Unmodified | 643.3110 | 3 | 43.03 |
|
|
Deamidation (N) | 643.6390 | 3 | 44.27 |
|
|
Deamidation (N) | 643.6390 | 3 | 45.75 |
|
|
Unmodified | 621.9794 | 3 | 41.85 |
|
|
Deamidation (N), PrK | 659.3181 | 3 | 47.50 |
Asterisk denotes sfGFP reference peptides used for normalization between samples; all other peptides are reporter peptides.
Dagger (†) denotes a reporter peptide that is truncated due to enzymatic cleavage by LysC and trypsin. The isobaric amino acids Ile and Leu are indistinguishable in our experiments.
Supplementary Material
Acknowledgments
We thank P.G. Schultz for providing the pEVOL-pAzF plasmid. This work was supported by the National Institute of Health (GM118178 to F.E.R.). A.W.F. was supported by a National Science Foundation Graduate Research Fellowship (Grant No. NSF/DGE-1346837).
Footnotes
Supplementary Information is available in the online version of the paper.
Author Contributions Y.Z., J.L.P., and F.E.R. designed experiments. Y.Z. and J.L.P. designed plasmids. Y.Z., E.C.F., and J.L.P. performed and interpreted translation experiments. H.R.A. conducted and interpreted MS experiments. C.E.C. developed methods. A.W.F. and K.S.J. provided technical assistance. C.R.T. and F.E.R. provided project leadership. F.E.R. provided overall project supervision. Y.Z. and F.E.R. wrote the manuscript, with input from the other authors.
The authors declare the following competing financial interests: A provisional patent application has been filed by Synthorx and The Scripps Research Institute (application #62/531,325; inventors J.L.P, C.E.C., H.R.A, Y.Z., E.C.F., A.W.F., V.T. Dien, and F.E.R.) covering the use of UBPs in tRNAs and mRNAs to produce proteins containing ncAAs. J.L.P, C.E.C., H.R.A., K.S.J., and F.E.R. have a financial interest (shares) in Synthorx, Inc., a company that has commercial interests in the UBP.
References
- 1.Leduc S. The Mechanisms of Life. Rebman Company; 1911. [Google Scholar]
- 2.Zhang Y, et al. A semisynthetic organism engineered for the stable expansion of the genetic alphabet. Proc Natl Acad Sci USA. 2017;114:1317–1322. doi: 10.1073/pnas.1616443114. [DOI] [PMC free article] [PubMed] [Google Scholar]
- 3.Pedelacq JD, Cabantous S, Tran T, Terwilliger TC, Waldo GS. Engineering and characterization of a superfolder green fluorescent protein. Nat Biotechnol. 2006;24:79–88. doi: 10.1038/nbt1172. [DOI] [PubMed] [Google Scholar]
- 4.Mukai T, Lajoie MJ, Englert M, Soll D. Rewriting the genetic code. Annu Rev Microbiol. 2017;71 doi: 10.1146/annurev-micro-090816-093247. [DOI] [PMC free article] [PubMed] [Google Scholar]
- 5.Liu CC, Schultz PG. Adding new chemistries to the genetic code. Annu Rev Biochem. 2010;79:413–444. doi: 10.1146/annurev.biochem.052308.105824. [DOI] [PubMed] [Google Scholar]
- 6.Shimizu M, Asahara H, Tamura K, Hasegawa T, Himeno H. The role of anticodon bases and the discriminator nucleotide in the recognition of some E. coli tRNAs by their aminoacyl-tRNA synthetases. J Mol Evol. 1992;35:436–443. doi: 10.1007/BF00171822. [DOI] [PubMed] [Google Scholar]
- 7.Gorochowski TE, Avcilar-Kucukgoze I, Bovenberg RA, Roubos JA, Ignatova Z. A minimal model of ribosome allocation dynamics captures trade-offs in expression between endogenous and synthetic genes. ACS Synth Biol. 2016;5:710–720. doi: 10.1021/acssynbio.6b00040. [DOI] [PubMed] [Google Scholar]
- 8.Chatterjee A, Sun SB, Furman JL, Xiao H, Schultz PG. A versatile platform for single- and multiple-unnatural amino acid mutagenesis in Escherichia coli. Biochemistry. 2013;52:1828–1837. doi: 10.1021/bi4000244. [DOI] [PMC free article] [PubMed] [Google Scholar]
- 9.Nguyen DP, et al. Genetic encoding and labeling of aliphatic azides and alkynes in recombinant proteins via a pyrrolysyl-tRNA Synthetase/tRNA(CUA) pair and click chemistry. J Am Chem Soc. 2009;131:8720–8721. doi: 10.1021/ja900553w. [DOI] [PubMed] [Google Scholar]
- 10.Voss S, Skerra A. Mutagenesis of a flexible loop in streptavidin leads to higher affinity for the Strep-tag II peptide and improved performance in recombinant protein purification. Protein Eng. 1997;10:975–982. doi: 10.1093/protein/10.8.975. [DOI] [PubMed] [Google Scholar]
- 11.Hong V, Presolski SI, Ma C, Finn MG. Analysis and optimization of copper-catalyzed azide-alkyne cycloaddition for bioconjugation. Angew Chem Int Ed. 2009;48:9879–9883. doi: 10.1002/anie.200905087. [DOI] [PMC free article] [PubMed] [Google Scholar]
- 12.Wandrey G, et al. Probing unnatural amino acid integration into enhanced green fluorescent protein by genetic code expansion with a high-throughput screening platform. J Biol Engineer. 2016;10:11. doi: 10.1186/s13036-016-0031-6. [DOI] [PMC free article] [PubMed] [Google Scholar]
- 13.O’Donoghue P, Ling J, Wang YS, Soll D. Upgrading protein synthesis for synthetic biology. Nat Chem Biol. 2013;9:594–598. doi: 10.1038/nchembio.1339. [DOI] [PMC free article] [PubMed] [Google Scholar]
- 14.Chin JW, et al. Addition of p-azido-L-phenylalanine to the genetic code of Escherichia coli. J Am Chem Soc. 2002;124:9026–9027. doi: 10.1021/ja027007w. [DOI] [PubMed] [Google Scholar]
- 15.Jewett JC, Sletten EM, Bertozzi CR. Rapid Cu-free click chemistry with readily synthesized biarylazacyclooctynones. J Am Chem Soc. 2010;132:3688–3690. doi: 10.1021/ja100014q. [DOI] [PMC free article] [PubMed] [Google Scholar]
- 16.Young TS, Ahmad I, Yin JA, Schultz PG. An enhanced system for unnatural amino acid mutagenesis in E. coli. J Mol Biol. 2010;395:361–374. doi: 10.1016/j.jmb.2009.10.030. [DOI] [PubMed] [Google Scholar]
- 17.Wang K, et al. Optimized orthogonal translation of unnatural amino acids enables spontaneous protein double-labelling and FRET. Nat Chem. 2014;6:393–403. doi: 10.1038/nchem.1919. [DOI] [PMC free article] [PubMed] [Google Scholar]
- 18.Smith PA, Romesberg FE. Mechanism of action of the arylomycin antibiotics and effects of signal peptidase I inhibition. Antimicrob Agents Chemother. 2012;56:5054–5060. doi: 10.1128/AAC.00785-12. [DOI] [PMC free article] [PubMed] [Google Scholar]
- 19.Engler C, Kandzia R, Marillonnet S. A one pot, one step, precision cloning method with high throughput capability. PLoS One. 2008;3:e3647. doi: 10.1371/journal.pone.0003647. [DOI] [PMC free article] [PubMed] [Google Scholar]
- 20.Chan WT, Verma CS, Lane DP, Gan SK. A comparison and optimization of methods and factors affecting the transformation of Escherichia coli. Biosci Rep. 2013;33:e00086. doi: 10.1042/BSR20130098. [DOI] [PMC free article] [PubMed] [Google Scholar]
- 21.Pirman NL, et al. A flexible codon in genomically recoded Escherichia coli permits programmable protein phosphorylation. Nat Commun. 2015;6:8130. doi: 10.1038/ncomms9130. [DOI] [PMC free article] [PubMed] [Google Scholar]
- 22.Rappsilber J, Mann M, Ishihama Y. Protocol for micro-purification, enrichment, pre-fractionation and storage of peptides for proteomics using StageTips. Nat Protoc. 2007;2:1896–1906. doi: 10.1038/nprot.2007.261. [DOI] [PubMed] [Google Scholar]
- 23.Link AJ, Jennings JL, Washburn MP. Analysis of protein composition using multidimensional chromatography and mass spectrometry. Curr Prot Protein Sci. 2001;78:23.21.21–23.21.25. doi: 10.1002/0471140864.ps2301s34. [DOI] [PubMed] [Google Scholar]
- 24.Beck S, et al. The Impact II, a very high-resolution quadrupole time-of-flight instrument (QTOF) for deep shotgun proteomics. Mol Cell Proteomics. 2015;14:2014–2029. doi: 10.1074/mcp.M114.047407. [DOI] [PMC free article] [PubMed] [Google Scholar]
- 25.Moini M, Jones BL, Rogers RM, Jiang L. Sodium trifluoroacetate as a tune/calibration compound for positive- and negative-ion electrospray ionization mass spectrometry in the mass range of 100–4000 Da. J Am Soc Mass Spectrom. 1998;9:977–980. [Google Scholar]
- 26.Aerni HR, Shifman MA, Rogulina S, O’Donoghue P, Rinehart J. Revealing the amino acid composition of proteins within an expanded genetic code. Nucleic Acids Res. 2015;43:e8. doi: 10.1093/nar/gku1087. [DOI] [PMC free article] [PubMed] [Google Scholar]
- 27.Cox J, Mann M. MaxQuant enables high peptide identification rates, individualized p.p.b.-range mass accuracies and proteome-wide protein quantification. Nat Biotechnol. 2008;26:1367–1372. doi: 10.1038/nbt.1511. [DOI] [PubMed] [Google Scholar]
- 28.MacLean B, et al. Skyline: an open source document editor for creating and analyzing targeted proteomics experiments. Bioinformatics. 2010;26:966–968. doi: 10.1093/bioinformatics/btq054. [DOI] [PMC free article] [PubMed] [Google Scholar]
Associated Data
This section collects any data citations, data availability statements, or supplementary materials included in this article.
Supplementary Materials
Data Availability Statement
The data that support the findings of this study are available from the corresponding author upon reasonable request. Plasmid sequences have been deposited in the GenBank database under the accession numbers MF996900–MF996913.