Abstract
Previous modeling of the median lethal dose (oral rat LD50) has indicated that local class-based models yield better correlations than global models. We evaluated the hypothesis that dividing the dataset by pesticidal mechanisms would improve prediction accuracy. A linear discriminant analysis (LDA) based-approach was utilized to assign indicators such as the pesticide target species, mode of action, or target species - mode of action combination. LDA models were able to predict these indicators with about 87% accuracy. Toxicity is predicted utilizing the QSAR model fit to chemicals with that indicator. Toxicity was also predicted using a global hierarchical clustering (HC) approach which divides data set into clusters based on molecular similarity. At a comparable prediction coverage (~94%), the global HC method yielded slightly prediction accuracy (R2 = 0.50) than the LDA method (R2~0.47). A single model fit to the entire training set yielded the poorest results (R2 = 0.38), indicating there is an advantage to clustering the dataset to predict acute toxicity. Finally, this study shows that dividing the training set into subsets (i.e., clusters) improves prediction accuracy but it may not matter which method (expert based or purely machine learning) is used to divide the dataset into subsets.
Keywords: QSAR, mode of action, rodent toxicity, chemical descriptors, pesticides
1. Introduction
Computational chemistry approaches have been increasingly used to predict toxicity and mode of action (MOA) in both human health and ecological risk assessment [1, 2]. The rodent oral acute toxicity endpoint has received considerable attention because of the large, structurally diverse dataset of more than 13,000 chemicals [3]. Attributes of these data include differences in median lethal doses that may directly reflect differences in intrinsic chemical potency among chemical structures and biological mechanisms because gavage dosing is less confounded with dietary intake and bioavailability. QSAR development for this endpoint has continued in part because the large number of animals required for acute lethality[4]. For example, rodent acute oral toxicity testing is still required for pesticide registration in the United States, although waiving in vivo test requirements is possible [5].
Earlier QSAR modeling of rodent oral acute toxicity was generally restricted to either smaller datasets of structurally similar chemicals, or had limited representation of pesticidal compounds [6, 7]. Recent global QSAR modeling of a large structurally and toxicologically diverse LD50 dataset that included a range of pesticides had limited prediction accuracy that declined with an increase in chemical space of the applicability domain. For example, Zhu et al. [8] used a combinatorial QSAR approach to develop a global model using a dataset of 7385 chemicals. A consensus model achieved a prediction accuracy (R2) of 0.42 for a prediction coverage (fraction of chemicals which can be predicted) of 74%. If the applicability domain was reduced to 19% of the prediction set, R2 increased to 0.71 for the consensus model. Sazonovas et al. [7] reported R2 values of 0.30 to 0.56 in global QSARs of rat and mice oral acute toxicity data that excluded chemicals outside of the applicability domain. Narrowing the applicability domain (reliability index) increased R2 values to 0.81. Gonella Diaza et al.[9] used the rat LD50 dataset of Zhu et al.[8] to test the performance of five global QSAR modeling tools. R2 values for the external validation set ranged from 0.22 to 0.60, with R2 values reduced to 0.09 to 0.37 for compounds outside the applicability domains of the five models. Overall, these studies suggest that accuracy can be improved by limiting the range of chemical structures or the diversity of biological mechanisms encompassed within a model dataset [7].
A global consensus model was shown to achieve an R2 value of 0.626 at a coverage of 98.4% if the LD50 dataset used by Zhu et al. [8] is divided randomly into a training set (80% of the overall set) and a prediction set (the remaining 20%) [10]. The poorer prediction statistics reported in Zhu et al. [8] may have been due to the fact the dataset was divided evenly into the training and prediction sets. Lagunin et al. [11] achieved similar results (R2 = 0.639, coverage = 95%) for this dataset using a global consensus model. The results of Martin et al. [10] and Lagunin et al. [11] indicate that global models can achieve reasonable prediction statistics provided multiple models are used to make the predictions.
The objective of this study was to determine if prediction accuracy can be improved using training sets of toxicologically similar chemicals. This was explored by focusing on pesticidal groups designed against specific target pests. The pesticide toxicity dataset was organized by target pest species including fungi, plants, insects, and rodents. In addition, chemicals were further categorized by their mode of action (e.g., anticoagulation, biosynthesis inhibition, growth regulation, and neurotoxicity). Two dimensional theoretical chemical descriptors were computed for each compound using the computational chemistry tool T.E.S.T. (Toxicity Estimation Software Tool)[12]. Oral rat acute toxicity was modeled using both local and global modeling approaches [1]. In the local approach, linear discriminant analysis (LDA) models were first developed to assign chemicals to different classes such as pesticide target species, mode of action, or specific target species – mode of action combination. Multilinear regression models are then developed for each class. The toxicity was predicted by utilizing the LDA models to assign the class and then the corresponding toxicity model was used to predict the toxicity. The global models were based on the hierarchical clustering method (in which the training set is divided into multiple models based on molecular similarity in terms of two dimensional molecular descriptors) and the single model method (where a single multilinear regression model is fit to the entire training set). Models were evaluated on prediction accuracy (in terms of the R2 coefficient of determination and mean absolute error) and prediction coverage for an external prediction set (which was randomly selected from the overall data set).
2. Material and methods
2.1. Data Set Development
Data set development was based on the pesticide target species classification of Russom [13] and the Zhu et al. [8] dataset of 7385 experimentally determined oral rat acute toxicity compiled from the National Library of Medicine ChemIDplus database [3]. The experimental values are in terms of mg chemical/kg rat body weight. Prior to modeling, the values were converted to log molar units (-log10(LD50 mol/kg)).
The U.S. EPA Pesticide Acute MOA Database [13] includes classifications of acute mode of action in the target pest species for 2683 pesticidal compounds. Target species are classified according the taxonomic group of the pest (fungi, plant, nematode, insect/acari, mollusc, rodent, other vertebrates), and the biochemical mode of pesticide action within the pest [13]. The pesticide MOA dataset was reduced to 1831 chemicals after removing mixtures, metals, inorganic compounds, polymers, salts and chemicals containing elements other than C, H, O, N, F, Cl, Br, I, S, P, Si, or As. They were removed because of the inability to compute molecular descriptors for these compounds. Some chemicals possess target species designations (since manufacturers report they kill a certain species) and not modes of action because it is unknown how they do it (the MOA).
The workflow for developing the training and prediction sets is given in Figure 1. The training and prediction sets for the quantitive prediction of oral rat LD50 were generated as follows: (1) if a chemical in the pesticide MOA dataset does have not an LD50 value or the MOA is unknown it is omitted; (2) if a chemical possesses a particular target species – mode of action combination that is not present in at least ten chemicals it is omitted; (3) for the remaining chemicals, chemicals are randomly placed in the training set (80% chemicals) and prediction set (20%). The LD50 training and prediction sets contained 566 and 137 chemicals, respectively.
Figure 1.
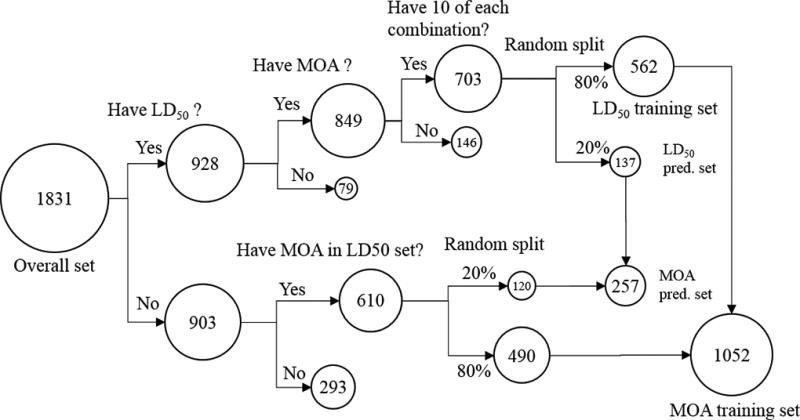
Workflow for developing the training and prediction sets
The training and prediction sets for the LDA models were generated as follows: (1) if a chemical possesses target species -mode of action combination not present in the LD50 training set it is omitted; (2) if a chemical is present in the LD50 training set, it is placed in the LDA training set; (3) if a chemical is present in the LD50 prediction set, it is placed in the LDA prediction set; (4) remaining chemicals are randomly placed in the training set (80%) and the prediction set (20%). The LDA training and prediction sets contained 1052 and 257 chemicals, respectively. The training and prediction sets for the LDA and LD50 models are given in the supplemental information.
The median value and toxicity ranges for the different target species – MOA combinations are given in Table 1. Not surprisingly, the chemicals that are targeted towards fungi and plants were slightly less toxic towards rodents than chemicals targeted towards insects and rodents. In addition, chemicals targeted towards fungi and plants span similar ranges. Overall, the toxicity values span about five orders of magnitude.
Table 1.
Chemical counts and rodent toxicity dataset by target species.
| Target Species Group |
Mode of Action | Chemical count |
Median LD50 | Std. Dev.* | |
|---|---|---|---|---|---|
| (mg/kg) | -log10(mol/kg) | -log10(mol/kg) | |||
| Fungi | Biosynthesis inhibition | 85 | 1600 | 2.26 | 0.63 |
| Reactivity | 27 | 1470 | 2.19 | 0.53 | |
| Respiration modulation | 14 | 478 | 2.68 | 0.99 | |
|
| |||||
| Plants | Biosynthesis inhibition | 88 | 1758 | 2.22 | 0.44 |
| Growth regulation | 76 | 912 | 2.45 | 0.49 | |
| Photosynthesis modulation | 76 | 1473 | 2.18 | 0.48 | |
|
| |||||
| Insect | neurotoxicity | 303 | 91 | 3.53 | 0.91 |
| Respiration modulation | 20 | 414 | 3.00 | 0.66 | |
|
| |||||
| Rodent | Anticoagulation | 14 | 1.85 | 5.27 | 1.37 |
|
| |||||
| Overall | N/A | 703 | 595 | 2.68 | 0.97 |
Std. Dev. = standard deviation
2.2. Molecular descriptors
For each chemical, a total 797 descriptors were generated from the MDL mol file using T.E.S.T. [12]. The descriptor classes included E-state values and E-state counts, constitutional descriptors, topological descriptors, walk and path counts, connectivity, information content, two-dimensional autocorrelation, Burden eigenvalue, molecular properties, Kappa, hydrogen bond acceptor/donor counts, molecular distance edge, and molecular fragment counts.[14, 15]
2.3. QSAR Development
2.3.1. Linear discriminant analysis (local) method
A two-step process was used to predict acute oral toxicity (see Figure 2a). In the first step, “one against the rest” linear discriminant analysis (LDA) models were used to predict a qualitative indicator or class. For predicting new chemicals, the maximum score from all the LDA models, is used to assign the indicator. The qualitative indicators include the pesticide target species, the target species – mode of action combination, or the mode of action. In the second step, a multiple linear regression (MLR) model corresponding to the qualitative indicator was used to predict the toxicity value.
Figure 2.
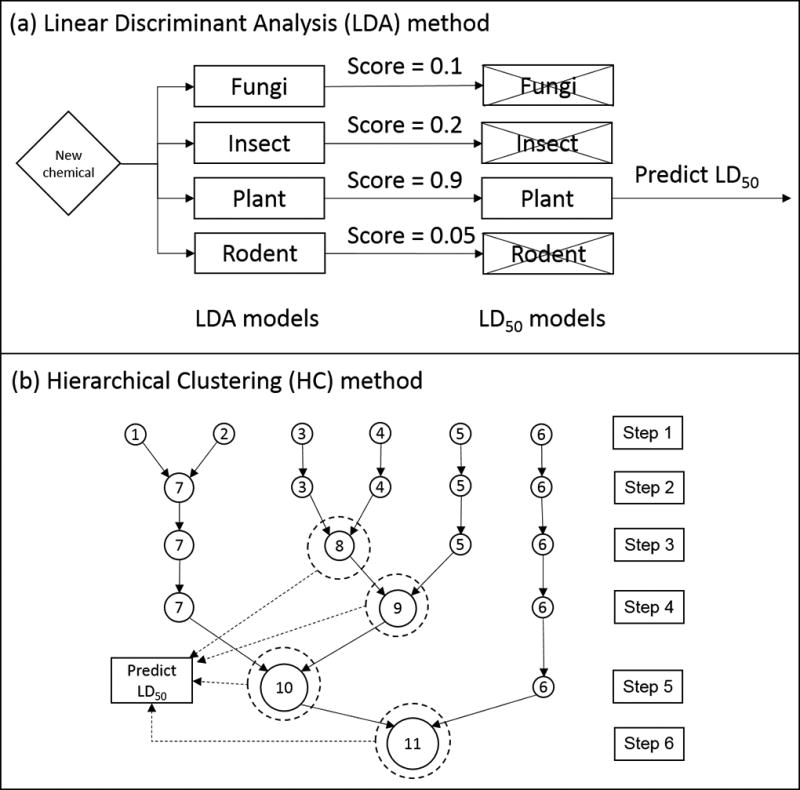
Example prediction of toxicity using the LDA and HC methods.
An LDA model is essentially a multilinear regression model [16]:
| (1) |
where ai is the fitted constant for the ith molecular descriptor xi, and a0 is the model intercept. Chemicals with a given indicator are assigned a score of 1. Chemicals that do not have the given indicator are assigned a score of 0. Descriptors are selected (and regression constants fitted) so the model can match the experimental values for the training set. Typically, if the predicted score for a given model is greater than or equal to 0.5, then that indicator is positive. If the score is less than 0.5, then that MOA or target species is not indicated. To build the LDA models, a genetic algorithm technique [15, 17, 18] was used to select the optimal descriptor set.
Acute toxicity values were predicted using a multilinear regression model for toxicity:
| (2) |
bi is the fitted constant for parameter i, xi is the ith molecular descriptor, and b0 is the model intercept. The descriptors were selected using a genetic algorithm approach as outlined in a previous publication [15]. The minimum ratio of chemicals to descriptors was set at 5:1 for QSAR modeling. A separate multilinear regression model was developed for each subset (e.g. for each of the fungi, insect, plant, and rodent subsets if the target species is the indicator). The toxicity is predicted by utilizing the multilinear regression model corresponding to the assigned indicator.
2.3.2. Hierarchical clustering (global) method
The hierarchical clustering (HC) method [15] utilizes a machine learning based approach (Ward’s Minimum Variance Clustering Method [19]) to divide the training set into subsets (known as clusters). The clustering is performed based on similarity (in terms of molecular descriptors) rather than by qualitative indicators such as mode of action. Conceptually, hierarchical clustering can be considered a local modeling approach where the local domains are derived from molecular similarity (i.e., machine learning) rather than from qualitative indicators (i.e., expert based) as in the LDA method, above.
After the clustering is complete, the genetic algorithm approach [15] is utilized for descriptor selection to develop a QSAR model for each cluster. The predicted value for a given test chemical is calculated using the equally weighted average of the model predictions from the closest cluster from each step in the hierarchical clustering (see Figure 2b). Hierarchical clustering models were fit to the training set used for the pesticide LD50 training set (566 chemicals) and using all of the chemicals that were not present in the prediction set for the LDA method (7276 chemicals). This was done to determine whether the purely machine-based hierarchical clustering method could obtain comparable results when the training set is not limited to pesticides.
2.3.3. Single model (global) method
In the single model method, a single multilinear regression (SM) model (see equation 2) is fit to the entire training set (rather using subsets of the training set as in the case of the LDA and hierarchical clustering method).
2.3.4. Applicability domain
Before any QSAR model can be used to make a prediction for a test chemical, it must be determined whether the test chemical falls within the domain of applicability (or AD) for the model. The first constraint, the model ellipsoid constraint, checks if the test chemical is within the multidimensional ellipsoid defined by the ranges of descriptor values for the chemicals in the training set (for the descriptors appearing in the model). The model ellipsoid constraint is satisfied if the leverage of the test compound (h00) is less than the maximum leverage value for all the compounds used in the model [20]. The second constraint, the Rmax constraint, checks if the distance from the test chemical to the centroid of the training set is less than the maximum distance for any chemical in the training set to the its centroid. These two constraints were applied to the prediction of indicators using the LDA models and the prediction of toxicity using the regression models. They were also applied to the individual models for the hierarchical clustering method. The final constraint is the training set must contain at least one example of each of the molecular fragments that are present in the test chemical [15]. This fragment constraint was applied to the hierarchical clustering and single model methods. It was not applied to the LDA method because it was not found to improve prediction concordance [2].
A filter was employed in which the maximum score from all the LDA models must exceed 0.5 (denoted from here on as the min score filter). The prediction accuracy for the compounds that were excluded by this criterion (and by the AD discussed above) was assessed to determine if they improve the overall prediction accuracy (by omitting mostly incorrect predictions).
3. Results and discussion
3.1. LDA training set statistics
The correlation statistics for the LDA models are given in Table 2. They represent the results for correlating binary (positive or negative) values for each indicator (MOA, target species, and target species-MOA) for the training set of 1053 chemicals. It was determined that a ratio of 40 chemicals to descriptors (26 descriptors per model), yielded the best results (in terms of resubstitution sensitivity) for the different indicators. Sensitivity is defined as the fraction assigned correctly for the chemicals which possess the indicator. The 40:1 ratio far exceeds the minimum recommended ratio of 5:1 [21]. For example, for fungi, there were 202 positive compounds and 850 negative compounds. The sensitivity of 0.5 indicates the model yielded positive scores for half of the chemicals which have fungi as the target species (i.e., 101 chemicals). Some of the models had low sensitivities (e.g., respiration modulation). This can be explained by the fact that some of these indicators had few positive chemicals in the training set (i.e., the dataset is heavily biased) and that sometimes chemicals with similar structures can affect multiple target species. Utilizing the target species as the indicator for the LDA models yielded a higher average training sensitivity (0.78) than using MOA (0.65) or target species-MOA (0.54). This can be explained by the fact that as the number of indicator choices increases, some of the indicators have more biased training sets.
Table 2.
Training set statistics for LDA models.
| Target species | n | Concordance | Sensitivity | Specificity |
|---|---|---|---|---|
| Fungi | 202 | 0.89 | 0.50 | 0.98 |
| Insect | 402 | 0.91 | 0.84 | 0.96 |
| Plant | 433 | 0.89 | 0.86 | 0.91 |
| Rodent | 15 | 1.00 | 0.93 | 1.00 |
|
| ||||
| Average | 0.92 | 0.78 | 0.96 | |
|
| ||||
| MOA | n | Concordance | Sensitivity | Specificity |
|
| ||||
| Anticoagulation | 15 | 1.00 | 0.93 | 1.00 |
| Biosynthesis inhibition | 311 | 0.86 | 0.64 | 0.95 |
| Growth regulation | 141 | 0.94 | 0.65 | 0.99 |
| Neurotoxicity | 377 | 0.93 | 0.88 | 0.96 |
| Photosynthesis modulation | 105 | 0.95 | 0.52 | 0.99 |
| Reactivity | 30 | 0.99 | 0.57 | 1.00 |
| Respiration modulation | 73 | 0.96 | 0.38 | 1.00 |
|
| ||||
| Average | 0.95 | 0.65 | 0.98 | |
|
| ||||
| Target species-MOA | n | Concordance | Sensitivity | Specificity |
|
| ||||
| Fungi-Biosynthesis inhibition | 124 | 0.92 | 0.42 | 0.99 |
| Fungi-Reactivity | 30 | 0.99 | 0.57 | 1.00 |
| Fungi-Respiration modulation | 48 | 0.96 | 0.21 | 1.00 |
| Insect-Neurotoxicity | 377 | 0.93 | 0.88 | 0.96 |
| Insect-Respiration modulation | 25 | 0.98 | 0.16 | 1.00 |
| Plant-Biosynthesis inhibition | 187 | 0.90 | 0.56 | 0.98 |
| Plant-Growth regulation | 141 | 0.94 | 0.65 | 0.99 |
| Plant-Photosynthesis modulation | 105 | 0.95 | 0.52 | 0.99 |
| Rodent-Anticoagulation | 15 | 1.00 | 0.93 | 1.00 |
|
| ||||
| Average | 0.95 | 0.54 | 0.99 | |
3.2. LDA prediction set statistics
The prediction statistics for the LDA models are given in Table 3. To make predictions for the external set (257 chemicals), the maximum score from all the models is utilized to predict the indicator. For all three sets of indicators (target species, MOA, and target species-MOA), the fraction correct was roughly 87% overall. This result matches the prediction accuracies obtained for aquatic toxicity mode of action [1, 2].
Table 3.
Statistics for LDA prediction set.
| Target Species | n | Fraction predicted* |
Fraction correct |
Training set sensitivity |
|---|---|---|---|---|
| Fungi | 49 | 0.73 | 0.56 | 0.50 |
| Insect | 99 | 0.88 | 0.91 | 0.84 |
| Plant | 107 | 0.90 | 0.95 | 0.86 |
| Rodent | 2 | 1.00 | 1.00 | 0.93 |
|
| ||||
| Overall | 257 | 0.86 | 0.87 | |
|
| ||||
| MOA | n | Fraction predicted* | Fraction correct | Training set sensitivity |
|
| ||||
| Anticoagulation | 2 | 1.00 | 1.00 | 0.93 |
| Biosynthesis inhibition | 77 | 0.75 | 0.86 | 0.64 |
| Growth regulation | 35 | 0.71 | 0.72 | 0.65 |
| Neurotoxicity | 93 | 0.86 | 0.96 | 0.88 |
| Photosynthesis modulation | 26 | 0.65 | 0.94 | 0.52 |
| Reactivity | 7 | 0.57 | 0.25 | 0.57 |
| Respiration modulation | 17 | 0.47 | 0.38 | 0.38 |
|
| ||||
| Overall | 257 | 0.75 | 0.86 | |
|
| ||||
| Target species - MOA | n | Fraction predicted* | Fraction correct | Training set sensitivity |
|
| ||||
| Fungi-Biosynthesis inhibition | 31 | 0.71 | 0.59 | 0.42 |
| Fungi-Reactivity | 7 | 0.43 | 0.33 | 0.57 |
| Fungi-Respiration modulation | 11 | 0.45 | 0.40 | 0.21 |
| Insect-Neurotoxicity | 93 | 0.85 | 0.98 | 0.88 |
| Insect-Respiration modulation | 6 | 0.17 | 0.00 | 0.16 |
| Plant-Biosynthesis inhibition | 46 | 0.67 | 0.90 | 0.56 |
| Plant-Growth Regulation | 35 | 0.60 | 0.86 | 0.65 |
| Plant-Photosynthesis modulation | 26 | 0.62 | 1.00 | 0.52 |
| Rodent-Anticoagulation | 2 | 1.00 | 1.00 | 0.93 |
|
| ||||
| Overall | 257 | 0.70 | 0.87 | |
A minimum score of 0.5 was required to make a prediction.
The prediction coverage decreased linearly from 86% to 70% as the number of indicator categories increased from 4 to 9. This can be attributed to the fact the training sets become more biased as the number of categories increases. The fraction correct for each indicator was highly correlated with the training set sensitivity for that indicator. This similarity is not unexpected because the overall dataset was divided randomly into training and prediction sets (with an equal distribution of the target species-MOA indicators).
3.3. LD50 training set statistics
The training set statistics for the multilinear regression models for each indicator are given in Table 4. According to the Shapiro-Wilk Test [22], the majority of the subsets (17/20) were normally distributed (when toxicity is expressed in terms of -log10(LD50 mol/kg)) with the exception of the subsets dealing fungi / biosynthesis inhibition (i.e. fungi, biosynthesis inhibition, and fungi-biosynthesis inhibition). Most of the models had acceptable regression statistics (q2>0.5, R2 > 0.6). The fungi target species has the largest difference (0.25) between the q2 and r2 value. This can be attributed to the fact that the data set for this target species is not normally distributed (outliers can reduce the q2 statistic). The LD50 models using target species as the indicator had slightly lower q2 values (on average) than for the other two indicators. This would suggest that using target species as the indicator will yield larger LD50 prediction errors.
Table 4.
Training set statistics for LD50 models.
| Target Species | n | #descriptors | q2* | R2* |
|---|---|---|---|---|
| Fungia | 102 | 13 | 0.36 | 0.61 |
| Insect | 259 | 22 | 0.42 | 0.52 |
| Plant | 193 | 23 | 0.55 | 0.66 |
| Rodent | 11 | 2 | 0.95 | 0.98 |
|
| ||||
| MOA | n | #descriptors | q2 | R2 |
|
| ||||
| Anticoagulation | 11 | 2 | 0.95 | 0.98 |
| Biosynthesis inhibitiona | 139 | 20 | 0.49 | 0.69 |
| Growth regulation | 61 | 10 | 0.76 | 0.83 |
| Neurotoxicity | 243 | 23 | 0.51 | 0.59 |
| Photosynthesis modulation | 61 | 7 | 0.55 | 0.65 |
| Reactivity | 22 | 4 | 0.57 | 0.70 |
| Respiration modulation | 28 | 5 | 0.74 | 0.82 |
|
| ||||
| Target species-MOA | n | #descriptors | q2 | R2 |
|
| ||||
| Fungi-Biosynthesis inhibitiona | 67 | 13 | 0.61 | 0.77 |
| Fungi-Reactivity | 22 | 4 | 0.57 | 0.70 |
| Fungi-Respiration modulation | 12 | 2 | 0.65 | 0.77 |
| Insect-Neurotoxicity | 243 | 23 | 0.51 | 0.59 |
| Insect-Respiration modulation | 16 | 3 | 0.74 | 0.86 |
| Plant-Biosynthesis inhibition | 70 | 14 | 0.77 | 0.86 |
| Plant-Growth regulation | 61 | 10 | 0.76 | 0.83 |
| Plant-Photosynthesis modulation | 61 | 7 | 0.55 | 0.65 |
| Rodent-Anticoagulation | 11 | 2 | 0.95 | 0.98 |
Not normally distributed according to the Shapiro-Wilk Test [22]
q2 = leave one out cross validated R2, R2= coefficient of determination
3.4. LD50 prediction set statistics
The prediction results for the LD50 prediction set are given in Table 5. In order for the prediction coverage of the LDA method to match that of the HC and SM methods, results were presented for the case in which the minimum positive score constraint was omitted. At a prediction coverage of ~94%, the LDA based predictions had R2 values (0.46, 0.48, and 0.47) which were slightly lower than those for the HC method (0.50). The SM method, however, had a lower R2 value (0.38) than either method, which illustrates the benefits of using multiple models for predicting the rat toxicity. For the methods with a prediction coverage of ~94%, the MAE (mean absolute error) values were not found to be statistically significant in terms of Welch’s t-test (95% confidence interval) [23]. To the put the MAEs in perspective, the MAE is 0.73 if the median toxicity value for the training set is used as the predicted value. This MAE value is statistically different to the predictions from the QSAR approaches using Welch’s t-test.
Table 5.
Statistics for LD50 prediction set.
| Methoda | n | Indicator | minimum positive score |
r2 | MAEb | Coverageb |
|---|---|---|---|---|---|---|
| LDA | 566 | Target Species | 0.5 | 0.45 | 0.57 | 79 |
| LDA | 566 | Target Species | 0.0 | 0.46 | 0.56 | 94 |
|
| ||||||
| LDA | 566 | MOA | 0.5 | 0.52 | 0.57 | 71 |
| LDA | 566 | MOA | 0.0 | 0.48 | 0.57 | 95 |
|
| ||||||
| LDA | 566 | Target Species-MOA | 0.5 | 0.51 | 0.57 | 69 |
| LDA | 566 | Target Species-MOA | 0.0 | 0.47 | 0.58 | 93 |
|
| ||||||
| HC | 566 | N/A | N/A | 0.50 | 0.54 | 94 |
| HC | 7276 | N/A | N/A | 0.54 | 0.50 | 89 |
| SM | 566 | N/A | N/A | 0.38 | 0.60 | 94 |
| MED | 566 | N/A | N/A | 0.00 | 0.72 | 100 |
LDA = linear discriminant analysis method, HC = hierarchical clustering method, SM = single model method, MED = use median toxicity value from the training set
MAE = mean absolute error in log10(LD50 mol/kg), coverage is the percentage of chemicals predicted
Employing the minimum positive score constraint slightly increased the R2 value for the LDA method but significantly reduced the prediction coverage (by ~24%). In addition, the results for all three sets of indicators were essentially the same. This suggests that as long as the data set is divided into manageable subsets, the associated QSAR models can account for the differences in molecular structure.
LDA models incorrectly predicted the target species thirteen times. For these compounds, if one makes the LD50 prediction utilizing the experimental target species, the mean absolute error does not improve (after removing three compounds which cannot be predicted due to constraints for the LD50 models). This indicates that improvement in predicting the LDA indicators will not significantly aid in improving the prediction of acute rat toxicity.
Utilizing a much larger training set (i.e. not filtering for pesticides) yielded comparable results for the HC method (the R2 value was 0.04 higher but the coverage was 0.05 lower). This indicates that it may not be necessary to filter the training set in order to make predictions for pesticides (as long as multiple models are used to predict the toxicity).
The LD50 prediction set results for all target species and for the fungi, insect, and plant target species are given in the Figures 3–6, respectively. A plot was not provided for the rat target species because there were only two compounds with this target species in the LD50 prediction set. These figures illustrate the HC method yields slightly better results than the SM and LDA methods overall and for the different individual target species.
Figure 3.
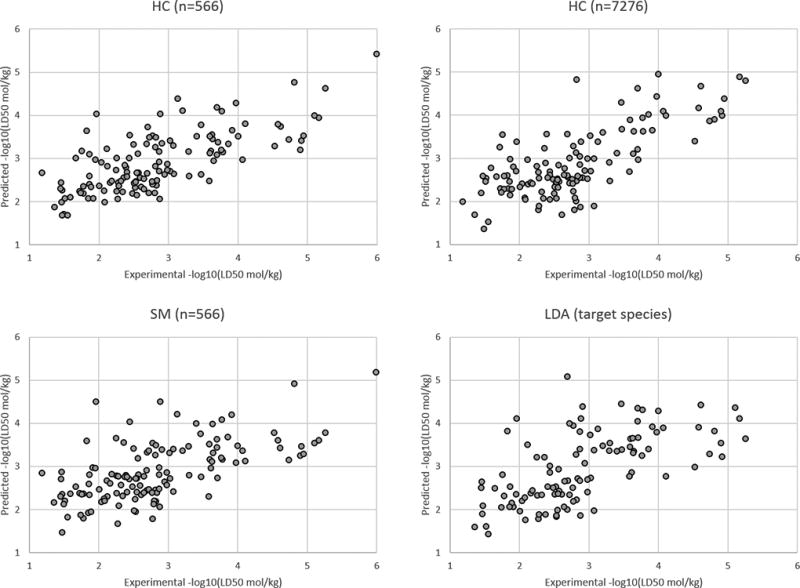
Results for the LD50 prediction set for all target species.
Figure 6.
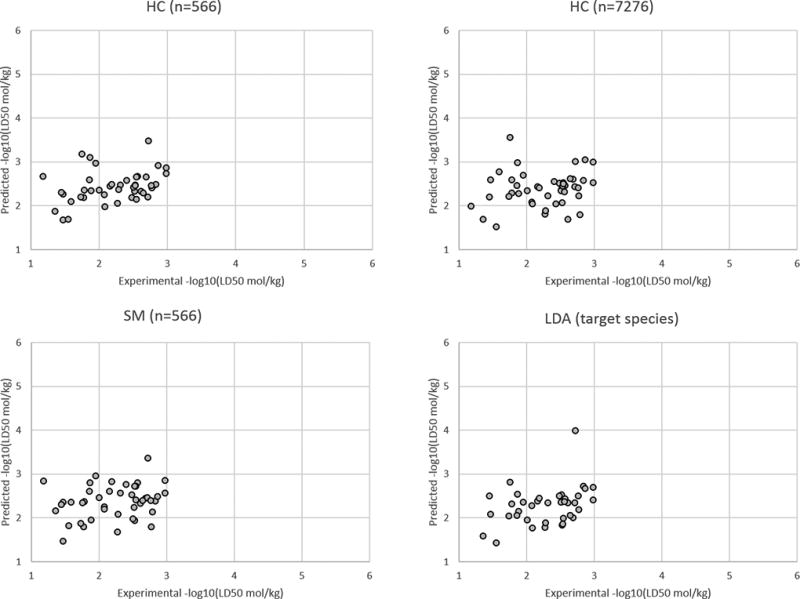
Results for the LD50 prediction set for the plant target species.
In Figure 7, toxicity is presented as a function of chain length for a series of normal alcohols for both acute rat and fish toxicity (in terms of 96 hour fathead minnow toxicity [24]). The toxicity values span more than two orders of magnitude for fish toxicity than they do for rat toxicity. For fish toxicity, a simple quadratic function of the chain length was able to perfectly correlate the data (R2 = 1.00). For rat toxicity, the correlation was much weaker (R2 = 0.38). One would expect a better correlation for compounds with presumably the same toxicity mode of action. In addition, the default experimental standard deviation of the oral rat LD50 test is 0.5 log units[25] whereas the MAE from the predicted values in this study range from 0.5–0.6 log units. This illustrates why it is difficult to predict rat toxicity to greater accuracy.
Figure 7.
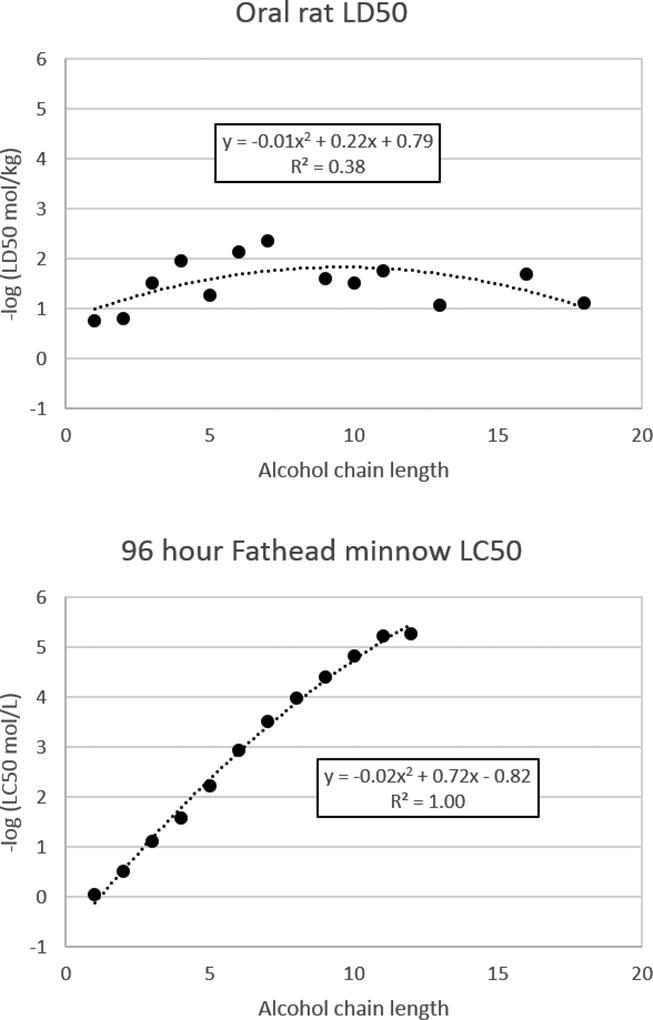
Comparison of toxicity values for acute oral rat and acute fathead minnow toxicities for a series of n-alcohols.
4. Conclusions
In this study we investigated whether chemicals are better predicted using models based on toxicologically similar chemicals. In the LDA approach, rodent toxicity is predicted using the model corresponding to the predicted indicator (i.e. pesticide target species, mode of action, or target species – mode of action). The different indicators yielded comparable prediction accuracy for predicting rodent toxicity values. In the HC approach, toxicity is predicted using the cluster models which are most similar to the chemical in terms of molecular similarity (i.e. expert defined indicators are not used to divide the data set into subsets). At a comparable prediction coverage, the HC method yielded slightly higher prediction accuracy than the LDA method. The SM method yielded the poorest results, which indicates there is an advantage to dividing the dataset into clusters or classes to predict acute toxicity. The HC method was able to make comparable predictions for the prediction set (which contains only pesticides) when a much larger training set (including a wide variety of non-pesticides) is used to develop the models.
This study illustrated that dividing the training set into subsets (or clusters) can improve prediction accuracy. However, the use of expert defined classes did not yield improved prediction statistics over machine based learning methods based purely on molecular similarity.
Supplementary Material
Figure 4.
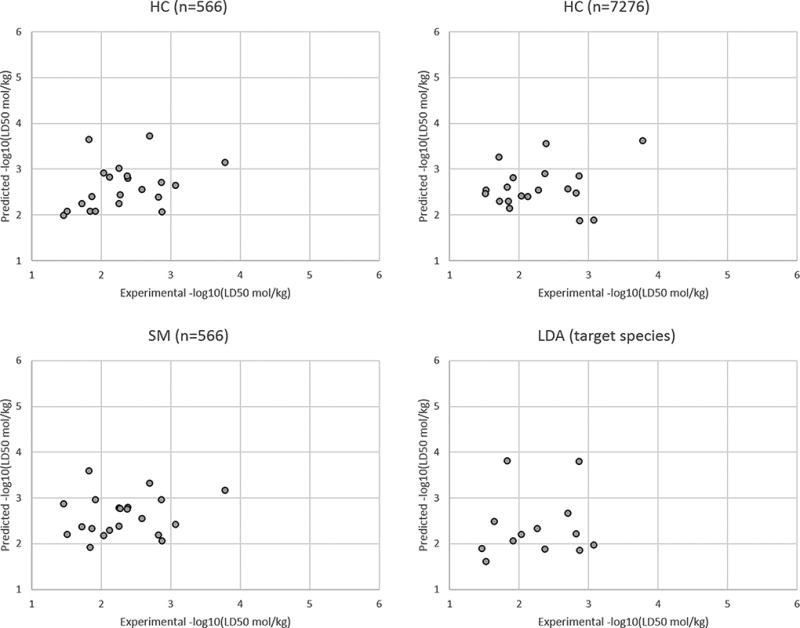
Results for the LD50 prediction set for the fungi target species.
Figure 5.
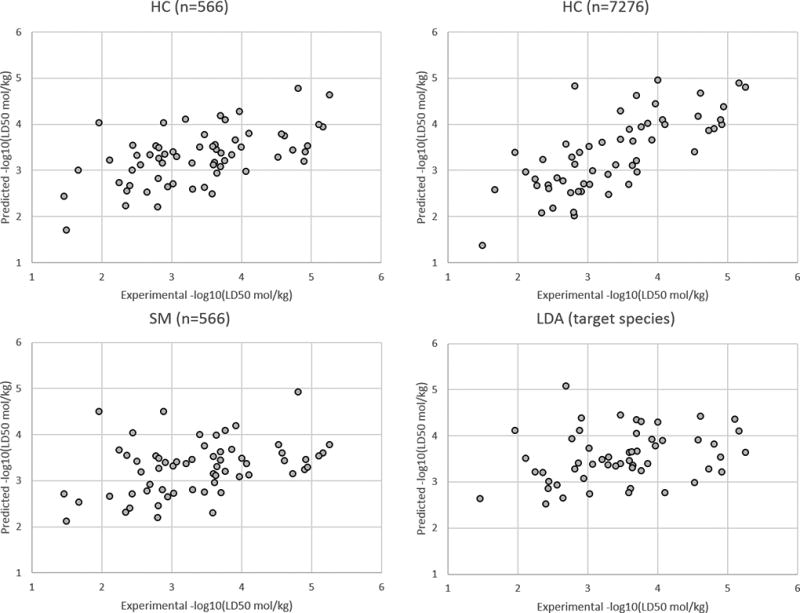
Results for the LD50 prediction set for the insect target species.
Acknowledgments
We thank Chris Russom for sharing the pesticide classification database. The views expressed in this article are those of the authors and do not necessarily represent the views or policies of the U.S. Environmental Protection Agency.
References
- 1.Martin TM, Young DM, Lilavois CR, Barron MG. Comparison of global and mode of action-based models for aquatic toxicity. SAR QSAR Environ. Res. 2015;26:245–262. doi: 10.1080/1062936X.2015.1018939. [DOI] [PubMed] [Google Scholar]
- 2.Martin TM, Grulke CM, Young DM, Russom CL, Wang NY, Jackson CR, Barron MG. Prediction of Aquatic Toxicity Mode of Action Using Linear Discriminant and Random Forest Models. J. Chem. Inf. Model. 2013;53:2229–2239. doi: 10.1021/ci400267h. [DOI] [PubMed] [Google Scholar]
- 3.National Library of Medicine. ChemIDplus database. 2006 Available at http://chem.sis.nlm.nih.gov/chemidplus/
- 4.Burden N, Sewell F, Chapman K. Testing Chemical Safety: What Is Needed to Ensure the Widespread Application of Non-animal Approaches? PLOS Biology. 2015;13:e1002156. doi: 10.1371/journal.pbio.1002156. [DOI] [PMC free article] [PubMed] [Google Scholar]
- 5.US EPA. Guidance for waiving or bridging of mammalian acute toxicity tests for pesticides and pesticide products (acute oral, acute dermal, acute inhalation, primary eye, primary dermal, and dermal sensitization) Vol. 1. Office of Pesticide Programs; Washington, D.C.: Mar, 2012. [Google Scholar]
- 6.Enslein K. An overview of structure-activity relationships as an alternative to testing in animals for carcinogenicity, mutagenicity, dermal and eye irritation, and acute oral toxicity. Tox Indust Health. 1988;4:479–498. doi: 10.1177/074823378800400407. [DOI] [PubMed] [Google Scholar]
- 7.Sazonovas A, Japertas P, Didziapetris R. Estimation of reliability of predictions and model applicability domain evaluation in the analysis of acute toxicity (LD 50) SAR QSAR Environ. Res. 2010;21:127–148. doi: 10.1080/10629360903568671. [DOI] [PubMed] [Google Scholar]
- 8.Zhu H, Martin TM, Ye L, Sedykh A, Young DM, Tropsha A. Quantitative Structure–Activity Relationship Modeling of Rat Acute Toxicity by Oral Exposure. Chem Res. Toxicol. 2009;22:1913–1921. doi: 10.1021/tx900189p. [DOI] [PMC free article] [PubMed] [Google Scholar]
- 9.Gonella Diaza R, Manganelli S, Esposito A, Roncaglioni A, Manganaro A, Benfenati E. Comparison of in silico tools for evaluating rat oral acute toxicity. SAR QSAR Environ. Res. 2015;26:1–27. doi: 10.1080/1062936X.2014.977819. [DOI] [PubMed] [Google Scholar]
- 10.US EPA. User’s Guide for T.E.S.T. (version 4.2) (Toxicity Estimation Software Tool) 2016 Available at https://www.epa.gov/chemical-research/users-guide-test-version-42-toxicity-estimation-software-tool-program-estimate.
- 11.Lagunin A, Zakharov A, Filimonov D, Poroikov V. QSAR Modelling of Rat Acute Toxicity on the Basis of PASS Prediction. Mol. Inform. 2011;30:241–250. doi: 10.1002/minf.201000151. [DOI] [PubMed] [Google Scholar]
- 12.US EPA. T.E.S.T. Version 4.2. 2016 Available at https://www.epa.gov/chemical-research/toxicity-estimation-software-tool-test.
- 13.Russom CL. Pesticide Acute MOA Database: Overview of procedures used in compiling the database and summary of results. US EPA; Duluth, MN: 2013. p. 26. [Google Scholar]
- 14.US EPA. Molecular Descriptors Guide. 2012 Available at http://www.epa.gov/nrmrl/std/qsar/MolecularDescriptorsGuide-v102.pdf.
- 15.Martin TM, Harten P, Venkatapathy R, Das S, Young DM. A Hierarchical Clustering Methodology for the Estimation of Toxicity. Toxicol. Mech. Method. 2008;18:251–266. doi: 10.1080/15376510701857353. [DOI] [PubMed] [Google Scholar]
- 16.Schüürmann G, Aptula AO, Kühne R, Ebert R-U. Stepwise Discrimination between Four Modes of Toxic Action of Phenols in the Tetrahymena pyriformis Assay. Chem Res. Toxicol. 2003;16:974–987. doi: 10.1021/tx0340504. [DOI] [PubMed] [Google Scholar]
- 17.The University of Waikato. WEKA - The Waikato Environment for Knowledge Analysis. 2007 Available at http://www.cs.waikato.ac.nz/~ml/weka/
- 18.Witten IH. Data Mining: Practical machine learning tools and techniques. Morgan Kaufmann; San Francisco: 2005. [Google Scholar]
- 19.Romesburg HC. Cluster Analysis for Researchers. Lifetime Learning Publications; Belmont, CA: 1984. [Google Scholar]
- 20.Montgomery DC. Introduction to Linear Regression Analysis. John Wiley and Sons; New York: 1982. [Google Scholar]
- 21.Eriksson L, Jaworska JS, Worth AP, Cronin MTD, McDowell RM, Gramatica P. Methods for Reliability and Uncertainty Assessment and for Applicability Evaluations of Classification- and Regression-Based QSARs. Environ. Health Persp. 2003;111:1361–1375. doi: 10.1289/ehp.5758. [DOI] [PMC free article] [PubMed] [Google Scholar]
- 22.Wikipedia. Shapiro–Wilk test. 2017 Available at https://en.wikipedia.org/wiki/Shapiro%E2%80%93Wilk_test.
- 23.Wikipedia. Independent two-sample t-test. Equal or unequal sample sizes, unequal variances. 2017 Available at https://en.wikipedia.org/wiki/Student%27s_t-test#Equal_or_unequal_sample_sizes.2C_unequal_variances.
- 24.US EPA. ECOTOX Database. 2017 Available at http://cfpub.epa.gov/ecotox/
- 25.OECD. Test No. 425: Acute Oral Toxicity: Up-and-Down Procedure. 2008 Available at http://www.oecd.org/env/ehs/testing/oecdguidelinesforthetestingofchemicals.htm.
Associated Data
This section collects any data citations, data availability statements, or supplementary materials included in this article.


