

Abstract
Design of Phase III trials in diabetic nephropathy currently requires patients at high risk of progression defined as within three years of a hard end-point (end stage renal disease, 40% loss of estimated glomerular filtration rate, or death). To improve design of these trials, we used natural history data from the Joslin Kidney Studies of chronic kidney disease in patients with diabetes to develop an improved criterion to identify such patients. This included a training cohort of 279 patients with type 1 diabetes and 134 end-points within three years, and a validation cohort of 221 patients with type 2 diabetes and 88 end-points. Previous trials selected patients using clinical criteria for baseline urinary albumin to creatinine ratio and estimated glomerular filtration rate. Application of these criteria to our cohort data yielded sensitivities (detection of patients at risk) of 70-80% and prognostic values of only 52-63%. We applied Classification and Regression Trees analysis to select from among all clinical characteristics and markers the optimal prognostic criterion that divided patients with type 1 diabetes according to risk. The optimal criterion was a serum Tumor Necrosis Factor Receptor 1 level over 4.3 ng/ml alone or 2.9-4.3 ng/ml with an albumin to creatinine ratio over 1.9 g/g. Remarkably, this criterion produced similar results in both type 1 and type 2 diabetic patients. Overall, sensitivity and prognostic value were high (72% and 81%, respectively). Thus, application of this criterion to enrollment in future clinical trials could reduce sample size required to achieve adequate statistical power for detection of treatment benefits.
Keywords: acute kidney injury, chronic kidney disease, diabetes
Introduction
Although progress has been made over the last 20 years in prevention as well as treatment of diabetic kidney disease, the risk of ESRD remains high 1,2. To mitigate this risk, new interventions must be developed and tested in clinical trials. The enormous expense of such trials effectively limits trial duration to three years, and this time constraint is challenging for diabetic nephropathy, which evolves over many years. To be successful, the trial must accumulate enough endpoints in the placebo group to give adequate power for detecting a meaningful risk-reduction in the treated group. Thus, trial size (and cost) is inversely related to how effectively the enrollment criteria enrich the study group with patients who develop ESRD within the timeframe of the trial – typically 3 years. This characteristic is the prognostic value of the enrollment criterion.
A review of clinical trials in advanced diabetic nephropathy conducted over the last 20 years illustrates the challenge 3-13. Altogether, only 941 (11%) out of 8,528 patients enrolled in the placebo groups in all the trials 3-13 reached a primary endpoint (Table 1 in supplemental material part A), so the prognostic value of the enrollment criteria was only 11%. The remaining 89% of enrolled patients were incapable of showing any benefit regardless of the intervention's effectiveness because their outcome (ESRD) was outside the timeframe of the study and were therefore uninformative. Surprisingly, no effort to develop optimal enrollment criteria for Phase III trials in diabetic nephropathy has been published.
We report here our attempt to address this lack with a comprehensive effort to develop an enrollment criterion with high prognostic value and sensitivity to support successful Phase III trials with a 3-year time constraint. Moreover, we sought to keep the criterion simple by requiring: the fewest markers, minimum effort to measure and greatest reproducibility over time so registries of patient eligible for clinical trials can be maintained easily. Toward this end, we examined baseline and follow-up data from diabetic patients with chronic kidney disease (CKD) when enrolled in the Joslin Kidney Studies. Consideration was restricted to CKD stages 3 and 4 because patients in CKD stage 1 or 2 rarely progress to ESRD within the 3-year constraint 1, 14, 15. Follow-up data for these patients included occurrences of ESRD, 40% loss of baseline eGFR or death unrelated to ESRD within three years.
In the search for an optimal enrollment criterion we evaluated the usual clinical characteristic plus the two legacy markers for nephropathy, ACR and eGFR, and two novel ones, elevated serum TNFR1 and TNFR2. Strong association of TNFRs with the risk of ESRD in Type 216 and Type 1 diabetes17, and rate of early renal decline18,19 was shown by us and confirmed in cohort studies elsewhere20-23. We used an example of machine learning methods, Classification and Regression Trees (CART)24. CART identifies the smallest set of the best performing clinical characteristics/markers and searches for values (cut-points) for each that maximizes separation between patients who are or are not at high risk of an outcome.
To illustrate, we applied the optimal enrollment criterion to the design of a hypothetical 3-year clinical trial to show the impact on reducing sample size while increasing statistical power. Finally, we used data on patients with chronic kidney disease excluded from 3-year trials by this new criterion to determine the magnitude of the ESRD risk problem that cannot be studied in clinical trials as currently constrained. They could be a significant source of enrollees into clinical trials if change in eGFR slope is accepted as a hard end-point or the duration of the clinical trials is extended to 10 years.
Results
Characteristics of the study cohorts
The study group comprised two independent cohorts of Joslin patients with diabetes and impaired renal function (CKD Stage 3 or 4) enrolled into follow-up studies conducted between1991 to 2009. The majority were enrolled in the 2000s and followed until 2012-2013. Before enrollment, these patients had been under the care of Joslin Clinic for a long time, and their inclusion in the prospective studies was unrelated to their unknown future outcomes during the subsequent 4-15 years. Thus, findings of this study reflect the unbiased contemporary natural history of the chronic kidney disease and development of ESRD in diabetes.
The T1D cohort with proteinuria and its larger number of renal outcomes served as the training panel, while the T2D cohort with microalbuminuria or proteinuria served as the validation panel. Characteristics of these cohorts are summarized in Table 1. In the T1D cohort, mean age at onset was 13 years and all patients were treated with insulin. At enrollment, all patients had long-duration diabetes, poor glycemic control, and 85% received RAS blockade. Eligibility required that proteinuria was documented by multiple ACR measurement during the 2-year interval preceding enrollment; however, the single ACR measurement at baseline examination fell in the proteinuric range for 75% rather than 100%. Median ACR for the whole group was 827 mg/g. Also by design, renal function was impaired (median 40 mL/min). Median serum concentrations of TNFR1 and TNFR2 at baseline were almost twice as high as in T1D patients with normoalbuminuria and normal renal function19.
Table 1. Clinical characteristics of the study groups.
| Characteristic | Joslin T1D | Joslin T2D |
|---|---|---|
| N=279 | N=221 | |
| At baseline: | ||
| Men | 48% | 61% |
| Age at DM onset (y) | 13 (8, 20) | 44 (38, 50) |
| Age at Entry (y) | 44 (37, 51) | 61 (57, 64) |
| Duration of DM (y) | 28 (22, 36) | 16 (12, 21) |
| Duration of care at Joslin (y) | 22 (14, 32) | 6 (2, 13) |
| Insulin Rx | 100% | 78% |
| HbA1c (%) | 8.6 (7.6, 9.5) | 7.6 (6.8, 8.8) |
| Systolic BP (mm Hg) | 133 (124, 149) | 139 (125, 152) |
| Diastolic BP (mm Hg) | 77 (70, 84) | 74 (70, 83) |
| Reno-protective RX | 85% | 92% |
| ACR mg/g | 827 (312, 1855) | 601 (117, 1734) |
| Microalbuminuria | 25% | 34% |
| eGFRcre ml/min | 40 (28, 49) | 42 (31, 50) |
| TNFR1 ng/ml | 3.9 (2.8, 5.0) | 3.5 (2.5, 4.4) |
| TNFR2 ng/ml | 7.6 (5.7, 9.5) | 6.8 (5.0, 8.7) |
| During the first 3 year Follow-up: | ||
| Cumulative risk of: | ||
| ESRD only* | 32.2% (26.6, 38.0) [85] | 18.9% (13.8, 24.5) [39] |
| eGFR loss >40%* | 14.0% (10.2, 18.3) [39] | 14.5% (10.2, 19.5) [32] |
| Deaths unrelated to ESRD* | 3.9% (2.0, 6.8) [10] | 8.3% (5.0, 12.6) [17] |
| Composite end-point | 48.0% (42.2, 53.9) [134] | 39.8% (33.5, 46.4) [88] |
Data are percent or median (25th, 75th percentiles); [Number of events]
Calculated under assumption of competing risks between ESRD, eGFR loss and deaths unrelated to ESRD
To examine the applicability of the prognostic test developed in T1D cohort to other patients with diabetes, we applied them to the Joslin T2D cohort. Diabetes was diagnosed at a much older age in this cohort (Table 1) and, at enrollment, duration of diabetes and care at Joslin were much shorter and glycemic control was better than for T1D. Systolic and diastolic blood pressures were similar to T1D, and 92% received RAS blockade. Microalbuminuria or proteinuria was documented during the preceding two years, the single ACR measurement at baseline examination identified 66% of patients in the proteinuric range. Median ACR for the whole group was 601 mg/g. Median serum concentrations of TNFR1 and TNFR2 at baseline were similar as in T1D.
Because ESRD typically develops over an interval longer than the 3-year duration of a Phase III trial, the US Food and Drug Administration (FDA) has considered accepting a 40% loss of baseline eGFR as a surrogate end-point for ESRD25. In many trials, death regardless of cause has also been included as a composite trial end-point. Therefore, we defined the end-point as onset of ESRD, a ≥40% loss of baseline eGFR, or death occurring within 3-year follow-up. In the T1D cohort, 134 patients reached this end-point, giving a 3-year cumulative risk of 48% (85 ESRD, 39 eGFR loss ≥40%, and 10 deaths unrelated to ESRD). Notably, among the 39 with ≥40% eGFR loss, ESRD developed in all during the subsequent 4-10 year follow-up. In the T2D cohort, 88 patients reached the end-point, yielding a 3-year cumulative risk of 40% (39 ESRD, 32 eGFR loss ≥40%, and 17 deaths due to causes unrelated to ESRD). Among the 32 with ≥40% eGFR loss, ESRD developed in all during subsequent 4-6 year of follow-up. To simplify the text, we refer to risk of the composite end-point as “risk of ESRD”.
Prognostic performance of enrollment criteria used in previous studies
Reported trials of measures to prevent ESRD have selected as high risk patients those with low eGFR or high ACR, using cut-points adopted from clinical practice, < 45 ml/min for eGFR and ≥ 500 mg/g for ACR. We evaluated the performance of these enrollment criteria in the follow-up data from both cohort studies (Table 2). Predictive value is the 3-year cumulative risk of ESRD in eligible enrollees and sensitivity is the proportion of outcomes in the whole cohort captured in the eligible subset. Predictive value for these two markers individually was moderate, around 60%, and increased to around 70% when the markers were combined. While, sensitivity was high for individual markers, around 80%, it decreased to 65% when they were combined. For completeness we also provide negative predictive value, i.e. the 3-year cumulative risk of ESRD in patients excluded from a trial and specificity, i.e. the proportion of patients without endpoints in trial non-eligible patients.
Table 2. Prognostic values, sensitivity, and specificity of alternative enrollment criteria for detecting ESRD (composite end-point) during 3-year follow-up in the Joslin cohorts with diabetes and chronic kidney disease*.
| Marker and criterion | Patients with positive test n (%) | Prognostic value in those with positive test (3-year cumulative risk) % [95% CI] | Prognostic value in those with negative test (3-year cumulative risk) % [95% CI] | Sensitivity % | Specificity % |
|---|---|---|---|---|---|
| eGFR ≤45 ml/min | |||||
| T1D | 172 (62%) | 63 [56-70] | 24 [17-34] | 81 | 56 |
| T2D | 132 (60%) | 52 [43-60] | 22 [15-33] | 77 | 52 |
| ACR >0.5 g/g | |||||
| T1D | 178 (64%) | 61 [54-68] | 26 [18-35] | 81 | 52 |
| T2D | 116 (52%) | 59 [51-68] | 18 [12-27] | 78 | 65 |
| eGFR ≤45 ml/min & ACR >0.5 g/g | |||||
| T1D | 122 (44%) | 73 [65-80] | 29 [22-36] | 66 | 77 |
| T2D | 85 (38%) | 67 [57-77] | 23 [17-31] | 65 | 79 |
|
| |||||
| Multi-marker criterion developed by CART†: | |||||
| Serum TNFR1 >4.3 ng/ml only or serum TNFR1 2.9 – 4.3 ng/ml and ACR >1.9 g/g | |||||
| T1D | 119 (43%) | 83 [76-89] | 22 [16-29] | 74 | 86 |
| T2D | 79 (36%) | 76 [66-85] | 20 [14-27] | 68 | 86 |
| Serum TNFR1 >4.3 ng/ml only or serum TNFR1 2.9 – 4.3 ng/ml and ACR >1.9 g/g (excluding deaths unrelated to ESRD) | |||||
| T1D | 119 (43%) | 83 [75-89] | 17 [12-24] | 79 | 86 |
| T2D | 79 (36%) | 71 [59-81] | 15 [10-22] | 72 | 81 |
[ ] 95% CI for cumulative risk
A composite end-point developed in 134 out of 279 T1D patients and in 88 of 221 T2D.
The following markers measured at baseline were included: sex, age, HbA1c, eGFR, ACR, serum TNFR1 and TNFR2
CART analysis to develop optimal multi-marker criterion to identify patients at high risk of ESRD
To determine whether higher prognostic values and sensitivity could be achieved by combining the baseline clinical characteristics, legacy markers and TNFR1 and TNFR2 into a multi-marker criterion, we included all of them in the CART analysis of the data from the T1D cohort. The analysis found only two markers that were needed to develop the optimal criterion that identified patients at high risk of ESRD: TNFR1 with a cut-point >4.3 ng/ml but if TNFR1 was between 2.4 and 4.3 ng/ml only patients with ACR with cut-point at >3.1 g/g were at high risk. This criterion's predictive value was 85% and sensitivity 72%. When applied to T2D, the validation set, these values were 71% and 57%, respectively.
The CART approach provided a simple enrollment criterion based on cut-points in just two markers and since results in both T1D and T2D cohorts were very similar, we re-fitted the diagnostic tree to the combined cohorts (Figure 1) to determine a final clinical trial enrollment criterion. Among all baseline clinical characteristics and marker values, the highest risk of an endpoint was that for patients with TNFR1 >4.3 ng/ml. This cut-point identified 104 cases. A similarly high risk was for patients with TNFR1 between 2.9 and 4.3 ng/ml and with ACR >1.9 g/g. This identified, however, only 15 cases. These two groups were combined as the high risk group with a risk of an endpoint (prognostic value) of 83% and 76% in T1D and T2D, respectively, and with sensitivity of 74% and 68%, respectively (Table 2).
Figure 1.
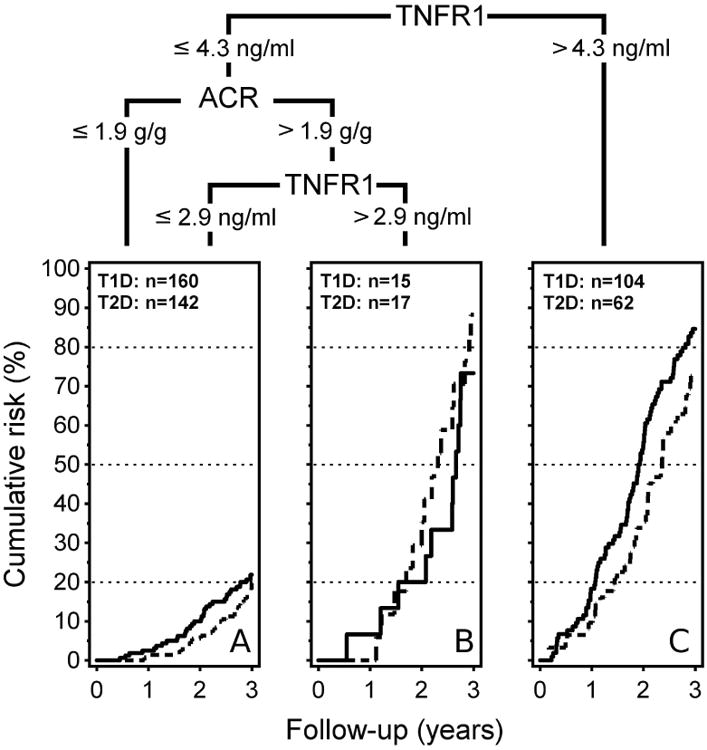
Prognostic cut-points derived from the multi-marker analysis of the merged T1D and T2D cohorts.
Plots of the cumulative risk of a study outcome within 3 years in T1D patients (solid line) and T2D patients (interrupted line).
Sex, age systolic BP, HbA1c, eGFR and TNFR2 were included in the CART analysis, but none surpassed outcome separation of achieved by TNFR1 and ACR.
Letters (A), (B) and (C) in each plot refer to the corresponding areas in Figure 3.
Patients in the combined T1D and T2D cohorts are represented by symbols in Figure 2 according to serum TNFR1 and ACR at baseline. The dots are color-coded according to the outcome at the three year follow-up. Note the overlap of the distribution of red and blue dots representing ESRD and 40% GFR loss. By moving the cut-points for TNFR1 and ACR around in Figure 2, an investigator can visualize the trade-off between sensitivity and predictive value of alternative choices. For example, the highest density of renal outcomes (red and blue dots) lies above serum levels of TNFR1 >4.3 ng/mL (incidence rate 40.5/100 patient-years). An intermediate density lies between serum TNFR1 concentrations 2.9 -4.3 ng/mL (incidence rate 13.4/100 patient-years). This subgroup, however, can be divided further into those with high risk (incidence rate 35.1/100 patient-years), if ACR was above 1.9 g/g, and those with low risk (incidence rate 9.5/100 patient-years) below this cut-point. Patients with serum TNFR1 ≤ 2.9 ng/mL have very low 3-year risk of ESRD (incidence rate 5.5/100 patient-years) regardless of baseline levels of ACR. In Figure 2, deaths unrelated to ESRD appear to be unrelated to baseline TNFR1 or ACR and, when removed from the composite end-point, the enrollment criterion's predictive value is unchanged but it gains sensitivity (see Table 2).
Figure 2. Distribution of patient outcomes in the combined study group (T1D and T2D) according to baseline values of TNFR1 and ACR.
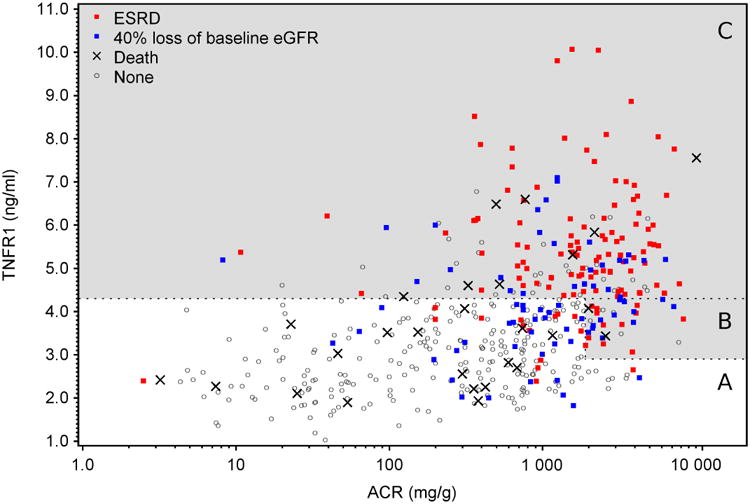
Outcomes during 3-year follow-up color coded according to type: ESRD (red), 40% baseline eGFR loss (blue), deaths unrelated to ESRD (black +) or no event (open circle). The cut-points for TNFR1 (2.9 ng/ml and 4.3 ng/ml) and ACR (1.9 g/g) shown in Figure 2 are represented by interrupted horizontal and vertical lines, respectively. The dots within the areas labeled (a), (b) and (c) represent the patients in Figure 2 plots with the corresponding labels. The gray area indicates high risk, while the white area indicates a low risk of the outcome. Note the distributions of blue and red dots overlap closely.
Effect of optimal multi-marker enrollment criterion on statistical power of a clinical trial
To illustrate how this new optimal enrollment criterion could influence the design of future clinical trials and improve the ability to detect important treatment effects, we imagined a study population of patients with diabetes and CKD 3 or 4.
Suppose 1410 patients with diabetes and CKD 3 or 4 were identified in medical records. Based on trials using the previous enrollment criteria, 282 (20%) of them are expected to reach an end-point and 1128 are not,. In such a trial cohort one would have 50% power to detect a 20% reduction of ESRD risk in the treatment arm (randomized 1:1). If the 1410 were invited for screening by the new enrollment criterion described here, only a subset would be selected for enrollment, and yet statistical power would increase. For example, the new enrollment criterion with 70% sensitivity and 80% positive prognostic value, would select only 246 of the 1410 for enrollment into the trial (123 patients for each arm). In this smaller group, 80% are expected to reach an endpoint, so a 20% reduction from 80% to 64% (difference of 16%) is more easily detected than the reduction from 20% to 16% (difference of 4%). The power of the trial to detect the 16% difference (between 80% and 64%) would be 86%, not 50%, despite the considerably reduced study size. The influence of an enrollment criterion's sensitivity and prognostic value on study group size and statistical power within this hypothetical trial are summarized in Figure 1 and Table 2 in Supplemental Material Part B.
Patients at risk of ESRD not recognized by our multi-marker criterion
Patients who met our multi-marker criterion for high-risk of ESRD within three years comprised 43% of the T1D cohort and captured 74% (sensitivity) of those at risk for this outcome. Similarly, they comprised 36% of the T2D cohort and included 68% (sensitivity) of those at risk for this outcome (Table 2). All of these patients had fast renal decline to ESRD26. Moderate decliners are not captured by this criterion although they experienced a risk of ESRD around 50% within 10 years (Figure 3A and 3B). Ourstudy had 80 moderate decliners in T1D and 71 in T2D. These patients comprised 29% and 32% respectively of T1D and T2D cohort and, while they would have been uninformative participants in a 3-year trial, their clinical course may be more susceptible to beneficial intervention than the very fast and fast decliners eligible for current FDA-approved trials.
Figure 3.
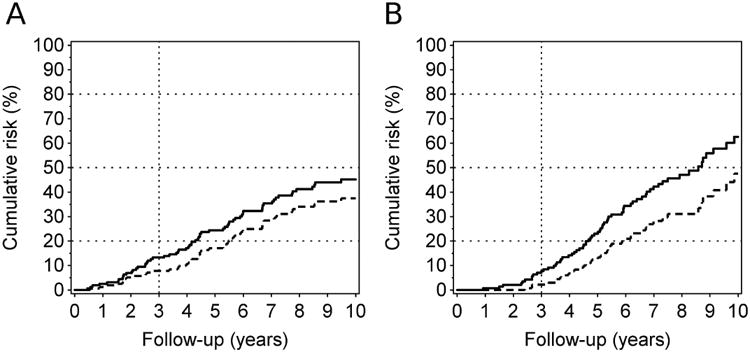
Cumulative incidence of ESRD (interrupted line) and ESRD & deaths (solid line) in patients who are not eligible for a clinical trial according to the multi-marker prognostic criterion.
Panel A: T1D Patients (n=160)
Panel B: T2D Patients (n=142).
While the incidences of ESRD and mortality are low within the first three years, it reached 45% and 63% by the 10th year of follow-up in T1D and T2D, respectively.
Overall, 48 ESRD cases occurred in T1D and 38 in T2D during 10 years of follow-up that were not picked up by the multi-marker criterion.
Discussion
For patients with diabetes the risk of ESRD remains high, and any new intervention to reduce it must be tested by clinical trial. The enrollment criterion revealed by CART analysis of four clinical characteristics (sex, age, systolic BP, HbA1c) and four markers (eGFR, ACR, TNFR1 and TNFR2) enriches the trial group with patients (fast decliners) having a high risk of progression to ESRD. Two markers determine the optimal criterion: serum TNFR1 >4.3 ng/mL, which identified most cases, and if TNFR1 was between >2.9 and 4.3 ng/mL only those with ACR >1.9 g/g were at high risk of the outcome. This composite criterion performs similarly well in T1D and T2D patients. Because the performance of serum TNFR2 was similar to TNFR1, it is not presented.
We hope that designers of future clinical trials will give more serious consideration to the prognostic values of their enrollment criteria than they have in the past. For ESRD trials, an adaptation of our optimal criterion will permit smaller and more efficient trials, as elaborated on in our results section. Recruitment of patients for diabetic nephropathy trials would be facilitated if serum TNFR1 is measured in all patients in CKD stages 3 and 4 for creating registries of patients eligible for clinical trials. Those with a concentration >4.3 ng/mL would be good candidates. Note that this level of TNFR1, indicates a high risk of ESRD even in patients with normoalbuminuria (see Fig. 2). Additional high risk patients could be found among those with TNFR1 between >2.9 and < 4.3 ng/mL if ACR is also high.
Our enrollment criterion predicts much higher ESRD risk than recent predictive models of kidney failure 27, 28, 29. Those models were based on traditional renal markers, eGFR and ACR and several clinical characteristics, such as sex, age, blood pressure, ethnicity, diabetes duration or Hba1c. Excellent performance was reported for them with the C-statistic reaching 0.9. Unfortunately, the high C-statistics are misleading. Their high values are due to the correct classification of low-risk patients, who were overwhelmingly predominant in the cohorts used for derivation and validation. These models do not capture efficiently the patients at highest risk. Unlike our criterion, which selects a group in which the 3-year ESRD risk may exceed 70-80%, these models (assuming a reasonable range of inclusion characteristics) predict a 5-year ESRD risk of 15-30% that reaches 40-50% if patients have ACR 2 g/g and eGFR 30 ml/min/1.73m2. Once again utility of an inclusion criterion should be judged by its positive predictive value (see also supplemental material part D).
While our enrollment criterion identifies the very fast and fast renal decliners and would serve the needs of 3-year trials using the approved composite end-point, it excludes patients who are moderate decliners and need 10 years to reach ESRD. These patients comprised 30% of all patients followed. If efforts were directed toward developing an enrollment criterion with a high positive predictive value and sensitivity for the subset of moderate decliners, it could be used in a screened population in tandem with enrollment into a 3-year trial. Those who did not qualify for a 3-year trial could be evaluated for enrollment in a trial designed for moderate decliners26. Before a trial can be mounted for these patients, a novel end-point based on changes in eGFR slope must be approved. One example of the use of such a design is the ongoing Preventing Early Renal Loss trial (http://www.perl-study.org/) testing the effectiveness of allopurinol to reduce renal function decline as determined by eGFR slope30. Unfortunately, while a study design based on eGFR slope is acceptable for allopurinol (an already approved drug), it is not approved by the FDA for new drugs or interventions.
Our study has several strengths that should be emphasized. The cohorts used in the study comprised diabetic patients who reached CKD stages 3 and 4 while under long-term care at the Joslin Clinic. Reliable measurements of the examined markers were performed at enrollment, and the cohorts were treated according to contemporary standards of diabetes and CKD care. They were followed for 4-15 years with complete ascertainment of relevant end-points. These features of the study allow us to generalize our findings to diabetic patients in the general population. The fact that the frequency of patients at high risk of ESRD was much lower in past trials (Table 1 in supplemental material part A) than in the Joslin cohorts suggests that past recruitment efforts were slanted toward non-progressing patients despite their impaired renal function. Application of the enrollment criterion that we developed may help to ameliorate this tendency. Finally, application of CART analysis seems to be a very robust analytical tool for developing prognostic tests, as illustrated by the excellent replication in the T2D validation cohort. Furthermore, the enrollment criterion developed with CART is much simpler and performs slightly better than one based on the alternative approach, a logistic regression score (see Supplemental Material Part C). Advantages of a CART approach over one based on logistic modeling have been reviewed31.
Several important qualifications to the findings of our study need to be recognized. As demonstrated in our recent publication32 and review article26, the majority of patients with diabetes who developed ESRD have fast renal decline that began when their renal function was normal. That decline was linear and such patients needed 3-10 years to progress from normal renal function to ESRD. Interventions to prevent or delay ESRD need to be implemented early, i.e. when renal function is normal and when sufficient time remains for the effect to be realized while patients have significant renal function remaining26. Unfortunately, no such intervention has been developed, and prognostic criteria to identify those patients while renal function is normal are non-existent26.
Findings from our study are restricted to diabetic patients with chronic kidney disease and impaired renal function. Our prognostic criterion identifies patients with very fast and fast renal decline and manifestation of a hard end-point within three years. Our study does not shed light on the design of trials for moderate decliners – neither enrollment criteria nor endpoints. Therapies whose effects are manifest after a lag interval will never be detected in short-term trials. The analytic plan for longer trials must anticipate such an outcome. This is more than a hypothetical consideration for we demonstrated in a study of T1D patients with proteinuria that a sustained period improved glycemic control (3-5 years) significantly reduced the risk of ESRD, but only during the five to ten year follow-up interval33.
Finally, two additional uncertainties of our findings should be considered. First, our criterion was developed in Joslin Cohorts that were relatively young, and their risk of death unrelated to ESRD was low. Future clinical trials may enroll much older T2D patients for whom this mortality is much higher. Application of our criterion for recruitment into such trials will be handicapped in its ability to identify such patients. Fortunately, this will result in increased sensitivity and prognostic value regarding enrichment of the trial population for patients at risk of ESRD (see Table 2). Second, calibration/validation of our prognostic criterion may need to be evaluated separately in patients of other ethnic ancestry. For example, in a prospective cohort of Pima Indians with a comparable renal phenotype we observed also robust contributions of TNFRs with a similar threshold pattern to the progression to the ESRD, nevertheless concentrations in that population were twice as high in comparison with those in Caucasian Joslin cohorts.23 These differences may be related to the ethnicity itself, a higher degree of obesity or due to the other factors that will need to be determined.
Study Groups and Methods
The study group comprised patients with diabetes who were in CKD stages 3 or 4 when enrolled in Joslin Kidney Studies. The Joslin T1D cohort with proteinuria was used as the exploratory/training panel, and the Joslin T2D cohort was used as the validation panel. Study protocols and informed consent procedures for the two studies were approved by the Institutional Review Board of Joslin Diabetes Center.
Description of study groups, measurements of clinical characteristics and determination of examined markers is described in supplemental material part C34-38.
Ascertainment of onset of ESRD, mortality and time of 40% loss of eGFR
All patients in the Joslin Kidney Studies included in this study were queried against rosters of the United States Renal Data System (USRDS) and the National Death Index (NDI) covering all events up to the end of 2012. USRDS maintains a roster of U.S. patients receiving renal replacement therapy which includes dates of dialysis and transplantation39. The NDI is a comprehensive roster of deaths in the U.S., which includes date and cause of death40, 41.
ESRD was defined by a match with the USRDS roster or a listing of renal failure among the causes of death on an NDI death certificate. The date given for the onset of ESRD was the date of first dialysis or transplantation or the date of death for those captured by death certificate. If a date of death was obtained from NDI, and ESRD had not developed, the outcome was defined as “Death unrelated to ESRD”.
If ESRD had not developed during the first 3 years of follow-up or death due to causes unrelated to ESRD had occurred in that interval, the patient was evaluated for 40% loss of eGFR. We used all available eGFR determinations for the patient performed during the first 5 years of follow-up to estimate eGFR slopes using the GLM procedure. The slopes were projected against follow-up time to determine if and when eGFR declined by 40% from the baseline eGFR.
Since the study aimed to evaluate risk of ESRD during the first 3 years, all patients who developed ESRD or died or lost 40% or more of baseline eGFR after the 3-year anniversary were considered alive as of the end of the 3rd year of follow-up.
Statistical Analysis
Characteristics of patients, including concentrations of markers in serum and urine, were summarized as medians (25th and 75th percentiles) or as counts and percentages. Medians were compared by Wilcoxon tests and proportions by χ2 or Fisher's exact tests. Cumulative incidence of ESRD and deaths unrelated to ESRD were calculated under assumption of competing risks between these two events using the cumulative incidence competing risks (CICR) approach42.
In this search for optimal enrollment criterion for future clinical trials in diabetic nephropathy to prevent ESRD, we considered as cases the patients in the study cohorts who, within three years, had any of the following: 1) the onset of ESRD, 2) a decrease ≥40% in eGFR, or 3) death. Our analytic approach was an implementation of the Classification and Regression Trees (CART) method available24 in the ‘rpart’ package for R software. The method involved hierarchical partitioning of the study group based on optimal cut-points selected from all possible cut-points in the distribution of each marker. The optimal cut-point is the one producing the widest separation in the frequency of cases in the two daughter groups. Partitioning was optimized first within the total sample and then separately within the daughters. The process was repeated until stopping criteria were met.
Each resulting set of cut-points is a candidate for a set of enrollment criteria and was evaluated in a manner similar to a diagnostic test. Patients in the high ESRD risk group identified by the set of cut-points were the “test positives” and all others the “test negatives”. Our focus was primarily on the predictive value of the criteria; i.e. the proportion of test positive patients who became cases measured as cumulative incidence of ESRD by the end of the 3rd year of follow-up. The secondary consideration was the set's sensitivity; i.e. the proportion of cases who were test positive. For planning a clinical trial with a specified power, these two characteristics of a set of enrollment criteria (sensitivity and positive predictive value) determine how many test positive patients must be identified by screening the source population (i.e. patients with proteinuria and in CKD stage 3 or 4).
For the recursive partitioning, we assumed standard default parameters. The minimum size of terminal nodes was set at 5 patients, and a partition was attempted in a node with at least 20 individuals. For simplicity of the final eligibility rule we additionally limited the tree size by removing cut-points where both daughter nodes provided the same binary event prediction, i.e. the risk of the outcome was either >50% or <50% in both.
We applied recursive partitioning to the T1D cohort as the training or discovery set and we used all four clinical characteristics (sex, age, systolic BP and HbA1c) and four (ACR, eGFR, TNFR1 and TNFR2) candidate markers to build a multi-marker tree. To test the replicability of the findings, we applied the cut-points identified in the T1D cohort to T2D patients and calculated the proportion of cases in the terminal nodes to compare predictions in T1D and T2D patients. Finally, based on good replication of our findings we re-estimated the multi-marker decision rule in T1D and T2D cohorts pooled together.
As an alternative, we used a logistic regression model to derive a score calculated from markers weighted by regression parameters. To compare performance of CART and logistic regression we selected a cutoff in the score, which identified as trial-eligible (a high-risk group) the same number of T1D patients as CART method (see the results presented in supplemental material part C).
Comparisons of our approach with other methods of characterizing prognostic tests43 are discussed in Supplemental Material Part D.
Supplementary Material
Acknowledgments
This study was supported: by the JDRF grant “Biomarkers of Diabetic Nephropathy Collaborative Research Initiative (DN-BIO)” No.3-SRA-2015-106-Q-R for sub-project “Predictors of progressive renal decline in Type 1 diabetes” to ASK and JVB; by the JDRF grant: 5-CDA-2015-89-A-B to MAN; by the National Institutes of Health grants DK-041526 to ASK, and DK-072381 to JVB; by the NIH Diabetes Research Center (DRC) grant P30 DK036836 and by grants from the Lilly Inc., and Pfizer Inc. to ASK to study biomarkers of renal decline in T2D.
Footnotes
Disclosures: ASK and MAN are co-inventors of the TNFR1 and TNFR2 patent for predicting risk of ESRD. This patent was licensed by the Joslin Diabetes Center to EKF Diagnostics.
Author Contributions: MY contributed to the study design, performed data analysis and wrote manuscript; JS contributed to the study design, performed data analysis and wrote manuscript; MAN contributed to research data collection, reviewed/edited manuscript; AS was responsible contributed to data collection and was responsible for data management and contributed to data analysis; AD, RSC, AG, KLD, NP, MDB, and JVB all contributed intellectually to the final plans of data analysis, final interpretation of the results and writing/editing the manuscript; JHW contributed to the study design, contributed to data analysis, to writing and editing of manuscript; ASK was responsible for design the study, supervised data collection and data analysis, contributed to writing and editing of manuscript.
Publisher's Disclaimer: This is a PDF file of an unedited manuscript that has been accepted for publication. As a service to our customers we are providing this early version of the manuscript. The manuscript will undergo copyediting, typesetting, and review of the resulting proof before it is published in its final citable form. Please note that during the production process errors may be discovered which could affect the content, and all legal disclaimers that apply to the journal pertain.
References
- 1.Rosolowsky ET, Skupien J, Smiles AM, et al. Risk for ESRD in type 1 diabetes remains high despite renoprotection. J Am Soc Nephrol. 2011;22(3):545–553. doi: 10.1681/ASN.2010040354. [DOI] [PMC free article] [PubMed] [Google Scholar]
- 2.de Boer IH, Rue TC, Hall YN, et al. Temporal trends in the prevalence of diabetic kidney disease in the United States. JAMA. 2011;305:2532–2539. doi: 10.1001/jama.2011.861. [DOI] [PMC free article] [PubMed] [Google Scholar]
- 3.Lewis EJ, Hunsicker LG, Bain RP, et al. The effect of angiotensin-converting-enzyme inhibition on diabetic nephropathy. The Collaborative Study Group. N Engl J Med. 1993;329(20):1456–1462. doi: 10.1056/NEJM199311113292004. [DOI] [PubMed] [Google Scholar]
- 4.Lewis EJ, Hunsicker LG, Clarke WR, et al. Renoprotective effect of the angiotensin-receptor antagonist irbesartan in patients with nephropathy due to type 2 diabetes. N Engl J Med. 2001;345(12):851–860. doi: 10.1056/NEJMoa011303. [DOI] [PubMed] [Google Scholar]
- 5.Brenner BM, Cooper ME, de Zeeuw D, et al. Effects of losartan on renal and cardiovascular outcomes in patients with type 2 diabetes and nephropathy. N Engl J Med. 2001;345(12):861–869. doi: 10.1056/NEJMoa011161. [DOI] [PubMed] [Google Scholar]
- 6.Facchini FS, Saylor KL. A low-iron-available, polyphenol-enriched, carbohydrate-restricted diet to slow progression of diabetic nephropathy. Diabetes. 2003;52(5):1204–1209. doi: 10.2337/diabetes.52.5.1204. [DOI] [PubMed] [Google Scholar]
- 7.House AA, Eliasziw M, Cattran DC, et al. Effect of B-vitamin therapy on progression of diabetic nephropathy: a randomized controlled trial. JAMA. 2010;303(16):1603–1609. doi: 10.1001/jama.2010.490. [DOI] [PubMed] [Google Scholar]
- 8.Heerspink HJ, Ninomiya T, Perkovic V, et al. Effects of a fixed combination of perindopril and indapamide in patients with type 2 diabetes and chronic kidney disease. Eur Heart J. 2010;31(23):2888–2896. doi: 10.1093/eurheartj/ehq139. [DOI] [PubMed] [Google Scholar]
- 9.Sharma K, Ix JH, Mathew AV, et al. Pirfenidone for diabetic nephropathy. J Am Soc Nephrol. 2011;22(6):1144–1151. doi: 10.1681/ASN.2010101049. [DOI] [PMC free article] [PubMed] [Google Scholar]
- 10.Imai E, Chan JC, Ito S, et al. Effects of olmesartan on renal and cardiovascular outcomes in type 2 diabetes with overt nephropathy: a multicentre, randomised, placebo-controlled study. Diabetologia. 2011;54(12):2978–2986. doi: 10.1007/s00125-011-2325-z. [DOI] [PMC free article] [PubMed] [Google Scholar]
- 11.Parving HH, Brenner BM, McMurray JJ, et al. Cardiorenal end points in a trial of aliskiren for type 2 diabetes. N Engl J Med. 2012;367(23):2204–2213. doi: 10.1056/NEJMoa1208799. [DOI] [PubMed] [Google Scholar]
- 12.de Zeeuw D, Akizawa T, Audhya P, et al. Bardoxolone methyl in type 2 diabetes and stage 4 chronic kidney disease. N Engl J Med. 2013;369(26):2492–2503. doi: 10.1056/NEJMoa1306033. [DOI] [PMC free article] [PubMed] [Google Scholar]
- 13.Navarro-González JF, Mora-Fernández C, Muros de Fuentes M, et al. Effect of pentoxifylline on renal function and urinary albumin excretion in patients with diabetic kidney disease: the PREDIAN trial. J Am Soc Nephrol. 2015;26(1):220–229. doi: 10.1681/ASN.2014010012. [DOI] [PMC free article] [PubMed] [Google Scholar]
- 14.Forsblom C, Harjutsalo V, Thorn LM, et al. Competing-risk analysis of ESRD and deaths among patients with Type 1 diabetes and macroalbuminuria. J Am Soc Nephrol. 2011;22(3):537–44. doi: 10.1681/ASN.2010020194. [DOI] [PMC free article] [PubMed] [Google Scholar]
- 15.Adler AI, Stevens RJ, Manley SE, et al. Development and progression of nephropathy in type 2 diabetes: the United Kingdom Prospective Diabetes Study (UKPDS 64) Kidney Int. 2003;63(1):225–232. doi: 10.1046/j.1523-1755.2003.00712.x. [DOI] [PubMed] [Google Scholar]
- 16.Niewczas MA, Gohda T, Skupien J, et al. Circulating TNF receptors 1 and 2 predict ESRD in type 2 diabetes. J Am Soc Nephrol. 2012;23(3):507–515. doi: 10.1681/ASN.2011060627. [DOI] [PMC free article] [PubMed] [Google Scholar]
- 17.Skupien J, Warram JH, Niewczas MA, et al. Synergism between circulating tumor necrosis factor receptor 2 and HbA(1c) in determining renal decline during 5-18 years of follow-up in patients with type 1 diabetes and proteinuria. Diabetes Care. 2014;37(9):2601–2608. doi: 10.2337/dc13-1983. [DOI] [PMC free article] [PubMed] [Google Scholar]
- 18.Gohda T, Niewczas MA, Ficociello LH, et al. Circulating TNF receptors 1 and 2 predict stage 3 CKD in type 1 diabetes. J Am Soc Nephrol. 2012;23(3):516–524. doi: 10.1681/ASN.2011060628. [DOI] [PMC free article] [PubMed] [Google Scholar]
- 19.Krolewski A, Niewczas MA, Skupien J, et al. Early progressive renal decline precedes the onset of microalbuminuria and its progression to macroalbuminuria. Diabetes Care. 2014;37(1):226–234. doi: 10.2337/dc13-0985. [DOI] [PMC free article] [PubMed] [Google Scholar]
- 20.Lopes-Virella MF, Baker NL, Hunt KJ, et al. Response to comment on Lopes-Virella et al. Baseline markers of inflammation are associated with progression to macroalbuminuria in type 1 diabetic subjects. Diabetes care 2013;36:2317-2323. Diabetes Care. 2014;37(5):e108–109. doi: 10.2337/dc13-2976. [DOI] [PMC free article] [PubMed] [Google Scholar]
- 21.Saulnier PJ, Gand E, Ragot S, et al. Association of serum concentration of TNFR1 with all-cause mortality in patients with type 2 diabetes and chronic kidney disease: follow-up of the SURDIAGENE Cohort. Diabetes Care. 2014;37(5):1425–1431. doi: 10.2337/dc13-2580. [DOI] [PubMed] [Google Scholar]
- 22.Forsblom C, Moran J, Harjutsalo V, et al. Added value of soluble tumor necrosis factor-alpha receptor 1 as a biomarker of ESRD risk in patients with type 1 diabetes. Diabetes Care. 2014;37(8):2334–2342. doi: 10.2337/dc14-0225. [DOI] [PubMed] [Google Scholar]
- 23.Pavkov ME, Nelson RG, Knowler WC, et al. Elevation of circulating TNF receptors 1 and 2 increases the risk of end-stage renal disease in American Indians with type 2 diabetes. Kidney Int. 2015;87(4):812–819. doi: 10.1038/ki.2014.330. [DOI] [PMC free article] [PubMed] [Google Scholar]
- 24.Breiman L, Friedman JH, Olshen RA, et al. Classification and Regression Trees. Wadsworth; Belmont, CA: 1984. [Google Scholar]
- 25.Levey AS, Inker LA, Matsushita K, et al. GFR decline as an end point for clinical trials in CKD: a scientific workshop sponsored by the National Kidney Foundation and the US Food and Drug Administration. Am J Kidney Dis. 2014;64(6):821–835. doi: 10.1053/j.ajkd.2014.07.030. [DOI] [PubMed] [Google Scholar]
- 26.Krolewski AS, Skupien J, Rossing P, et al. Fast renal decline to ESRD: an unrecognized feature of nephropathy in diabetes. Kidney Int. 2016 doi: 10.1016/j.kint.2016.10.046. in press. [DOI] [PMC free article] [PubMed] [Google Scholar]
- 27.Tangri N, Stevens LA, Griffith J, et al. A Predictive Model for Progression of Chronic Kidney Disease to Kidney Failure. JAMA. 2011;305(15):1553–1559. doi: 10.1001/jama.2011.451. [DOI] [PubMed] [Google Scholar]
- 28.Elley CR, Robinson T, Moyes SA, et al. Derivation and validation of a renal risk score for people with type 2 diabetes. Diabetes Care. 2013;36(10):3113–3120. doi: 10.2337/dc13-0190. [DOI] [PMC free article] [PubMed] [Google Scholar]
- 29.Jardine MJ, Hata J, Woodward M, et al. Prediction of kidney-related outcomes in patients with type 2 diabetes. Am J Kidney Dis. 2012;60(5):770–778. doi: 10.1053/j.ajkd.2012.04.025. [DOI] [PubMed] [Google Scholar]
- 30.Doria Alessandro, et al. PERL (Preventing Early Renal Loss in Diabetes): A Multicenter Clinical Trial of Allopurinol to Prevent Kidney Function Loss in Type 1 Diabetes. ClinicalTrials.gov Identifier: NCT02017171. [Google Scholar]
- 31.Henrard S, Speybroeck N, Hermans C. Classification and regression tree analysis vs. multivariable linear and logistic geregression methods as statistical tools for studying haemophilia. Haemophilia. 2015;21:713–722. doi: 10.1111/hae.12778. [DOI] [PubMed] [Google Scholar]
- 32.Skupien J, Warram JH, Smiles AM, Stanton RC, Krolewski AS. Patterns of estimated glomerular filtration rate decline leading to Ennd-Dtage Renal Disease in Type 1 diabetes. Diabetes Care. 2016 Sep; doi: 10.2337/dc16-0950. Epub. [DOI] [PMC free article] [PubMed] [Google Scholar]
- 33.Skupien J, Warram JH, Smiles A, et al. Improved glycemic control and risk of ESRD in patients with type 1 diabetes and proteinuria. J Am Soc Nephrol. 2014;25(12):2916–2925. doi: 10.1681/ASN.2013091002. [DOI] [PMC free article] [PubMed] [Google Scholar]
- 34.Krolewski AS, Laffel LM, Krolewski M, et al. Glycosylated hemoglobin and the risk of microalbuminuria in patients with insulin-dependent diabetes mellitus. N Engl J Med. 1995;332(19):1251–1255. doi: 10.1056/NEJM199505113321902. [DOI] [PubMed] [Google Scholar]
- 35.Mueller PM, Rogus JJ, Cleary PA, et al. The Genetics of Kidneys in Diabetes (GoKinD) Study: A genetics collection available for identifying the genetic susceptibility factors for diabetic nephropathy in type 1 diabetes mellitus. J Am Soc Neph. 2006;17(7):1782–90. doi: 10.1681/ASN.2005080822. [DOI] [PMC free article] [PubMed] [Google Scholar]
- 36.Warram JH, Gearin G, Laffel L, et al. Effect of duration of type I diabetes on the prevalence of stages of diabetic nephropathy defined by urinary albumin/creatinine ratio. J Am Soc Nephrol. 1996;7(6):930–937. doi: 10.1681/ASN.V76930. [DOI] [PubMed] [Google Scholar]
- 37.Skupien J, Warram JH, Smiles AM, et al. Early Renal Function Decline Predicts Risk of ESRD: 5-18 year Follow-up of Patients with Type 1 Diabetes and Proteinuria. Kidney Int. 2012;82(5):589–597. doi: 10.1038/ki.2012.189. [DOI] [PMC free article] [PubMed] [Google Scholar]
- 38.Levey AS, Stevens LA, Schmid CH, et al. A new equation to estimate glomerular filtration rate. Ann Intern Med. 2009;150(9):604–612. doi: 10.7326/0003-4819-150-9-200905050-00006. [DOI] [PMC free article] [PubMed] [Google Scholar]
- 39.Agodoa LY, Eggers PW. Renal replacement therapy in the United States: data from the United States Renal Data System. Am J Kidney Dis. 1995;25(1):119–133. doi: 10.1016/0272-6386(95)90638-x. [DOI] [PubMed] [Google Scholar]
- 40.Centers for Disease Control and Prevention. National Center for Health Statistics: Data Access—National Death Index. [Accessed October 10, 2010]; Available at: http://www.cdc.gov/nchs/ndi.htm.
- 41.Cowper DC, Kubal JD, Maynard C, et al. A primer and comparative review of major US mortality databases. Ann Epidemiol. 2002;12(7):462–468. doi: 10.1016/s1047-2797(01)00285-x. [DOI] [PubMed] [Google Scholar]
- 42.Caplan RJ, Pajak TF, Cox JD. Analysis of the probability and risk of cause-specific failure. Int J Radiat Oncol Biol Phys. 1994;29:1183–1186. doi: 10.1016/0360-3016(94)90416-2. [DOI] [PubMed] [Google Scholar]
- 43.Kerr KF, Wang Z, Janes H, et al. Net reclassification indices for evaluating risk prediction instruments: a critical review. Epidemiology. 2014;25:114–121. doi: 10.1097/EDE.0000000000000018. [DOI] [PMC free article] [PubMed] [Google Scholar]
Associated Data
This section collects any data citations, data availability statements, or supplementary materials included in this article.