Abstract
Stimulus frequency otoacoustic emissions (SFOAEs) can have multiple time varying components, including multiple internal reflections. It is, therefore, necessary to study SFOAEs using techniques that can represent their time-frequency behavior. Although various time-frequency schemes can be applied to identify and filter SFOAE components, their accuracy for SFOAE analysis has not been investigated. The relative performance of these methods is important for accurate characterization of SFOAEs that may, in turn, enhance the understanding of SFOAE generation. This study using in silico experiments examined the performance of three linear (short-time Fourier transform, continuous wavelet transform, Stockwell transform) and two nonlinear (empirical mode decomposition and synchrosqueezed wavelet transform) time-frequency approaches for SFOAE analysis. Their performances in terms of phase-gradient delay estimation, frequency specificity, and spectral component extraction are compared, and the relative merits and limitations of each method are discussed. Overall, this paper provides a comparative analysis of various time-frequency methods useful for otoacoustic emission applications.
I. INTRODUCTION
Stimulus frequency otoacoustic emissions (SFOAEs) offer unique opportunities for probing cochlear function non-invasively. The frequency specificity and relatively simpler interpretation of SFOAEs offer an advantage over other evoked emissions such as distortion-product otoacoustic emissions (Kalluri and Shera, 2013). Both the magnitude and phase of SFOAEs convey information that is important for characterizing cochlear amplifier behavior. At a given frequency, SFOAEs can have multiple components with different delays that originate from cochlear mechanical irregularities (Sisto and Moleti, 2007). Identification of these components, their time span, and other features are crucial for accurate interpretation of SFOAEs. These components provide more detailed insights into the generation of SFOAEs, paving the way for relevant clinical utilities. SFOAEs are measured as a function of stimulus frequency, which can be transformed into equivalent SFOAE waveforms as a function of time through inverse Fourier transform, hereafter referred to as time-domain SFOAEs. Time-domain SFOAEs can be interpreted as a summation of time varying components of different frequencies. Time-frequency analysis (TFA) techniques can be applied to segregate these components and obtain simultaneous time and frequency information. The accuracy of the TFA approach determines the validity of these components.
Cochlear properties, such as the sharpness of mechanical tuning and its variation along the cochlear length, can be inferred from phase-gradient delays (Shera and Bergevin, 2012; Bergevin and Shera, 2010; Bergevin et al., 2015). The phase-gradient delay is defined as the negative rate of change of SFOAE phase with respect to frequency. Several signal processing approaches have been proposed to estimate phase-gradient delay from the raw phase data. The energy weighting which weighs the raw delay values with respect to the magnitude response, and peak picking (picks the delay values only at magnitude peaks) were found to be less erroneous (Shera and Bergevin, 2012). However, multiple internal reflections may complicate the interpretation of SFOAE delays and introduce bias in the estimation of phase-gradient delays. Filtering out multiple internal reflections in the time-frequency domain is one of the preferred approaches to circumvent this problem. To carry out filtering in the time-frequency domain, the TFA techniques are applied over time-domain SFOAEs to obtain time-frequency representations (TFRs). In the TFR, multiple internal reflection components express themselves as delayed and possibly attenuated components around the actual SFOAEs. Time-frequency filtering masks regions in the TFR that correspond to multiple internal reflections by making corresponding coefficients zero and thereby removes the multiple internal reflection components. The effectiveness of the filtering relies on the accuracy of the TFA approach and, in turn, determines the estimation accuracy for phase-gradient delay.
All TFA techniques are governed by the Gabor uncertainty principle, which states that the time and frequency resolutions are trade-offs (Boashash, 2015). A TFA method resulting in good time resolution is likely to make compromises on frequency resolution and vice versa. However, the accuracy and compactness of TFR can be improved by choosing method-dependent parameters, considering the nature of the data. Therefore, it is essential to examine the suitability of various TFA techniques for analyzing SFOAEs.
The main goal of the current study was to present a comparative assessment of different TFA approaches for analyzing SFOAEs. There are three kinds of TFA approaches: quadratic, linear, and nonlinear techniques. Quadratic TFAs are used to obtain time-frequency energy distribution instead of a TFR and enable a direct interpretation of instantaneous power spectrum and spectral energy density. The linear TFAs satisfy the superposition principle, which states that if a waveform is a linear combination of some components then its TFR is the linear combination of the TFRs of each of the constituent components. The nonlinear techniques do not satisfy the superposition principle. The performance of quadratic TFA approaches (e.g., Wigner-Ville distribution) depends on the effective cancellation of the cross terms, which is a major limitation. The cross terms are artifacts that arise from the nonlinearity in quadratic TFA approaches and cause interaction between the positive and negative frequency terms when there are multiple frequency tones present at a particular time (Boashash, 2015). On the other hand, linear TFA techniques are efficient and relatively computationally simpler to implement. Nonlinear data-driven approaches, such as syncrosqueezing transform, reassign the TFR and offer significant improvement in obtaining a more accurate TFR (Rilling and Flandrin, 2008). The accuracy of a TFA approach can be evaluated from the analysis of simulated signals (e.g., linear and nonlinear frequency modulated signals) with known instantaneous amplitude and frequency information. The present study, using in silico experiments, examined the accuracy of three popular linear TFA [short-time Fourier transform (STFT), continuous wavelet transform (CWT), Stockwell transform (ST)] and two nonlinear TFA techniques [empirical mode decomposition (EMD) and synchrosqueezed wavelet transform (SWT)] specifically for SFOAE analysis.
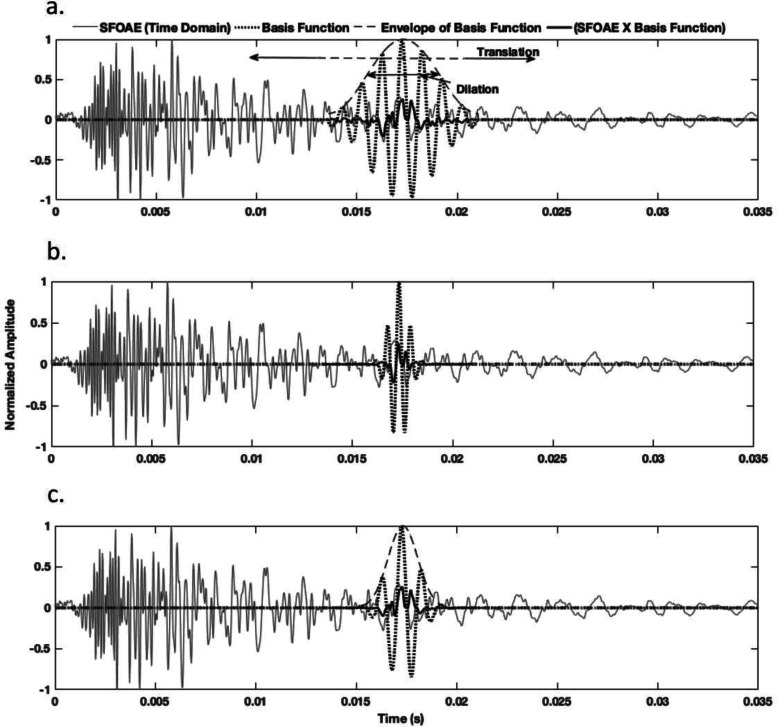
The STFT is a widely used method and was derived directly from discrete Fourier transform evaluated over a fixed time-domain analysis window. The CWT introduces analysis with varying time and frequency resolution by employing a mother wavelet that dilates according to a specified scaling function and translates in time. Due to the freedom in variation allowed for the mother wavelets, many of them are quite distinct from the Fourier basis. The CWT analysis result is referred to as time-scale representation instead of a TFR. However, the time-frequency information can be deciphered from CWT by appropriate mathematical mapping. The basis function in ST is similar to that of a complex Mortlet wavelet (Stockwell et al., 1996; Ventosa et al., 2008). Figures 1(a)–1(c) show the basis functions of STFT, CWT with a complex Morlet wavelet, and ST correlated over a time-domain SFOAE waveform. The basis function is dependent on the frequency. For a fixed frequency, the basis function translates over time, and correlation coefficient at each point is an estimate of the spectral information at that time and frequency. For a complex basis function, the real and imaginary coefficients are computed separately, resulting in complex valued spectral information. The dilation of basis function or width of its envelope (also interpreted as the width of the window function) determines the frequency resolution. For STFT, the width of the window function or dilation parameter is fixed, giving rise to a fixed frequency resolution. However, in the cases of CWT and ST the dilation parameter is dependent on the frequency component being measured. For both CWT and ST, dilation parameter is inversely proportional to the analysis frequency. The basis function in ST is similar to that of the CWT with complex Mortlet wavelet (Ventosa et al., 2008). The ST differs from the CWT through the perspective that it has a windowed Fourier basis that provides direct interpretation of frequency. The ST, essentially, is a multi-resolution extension of STFT, which combines the advantages of STFT and CWT.
FIG. 1.
Illustration of translation and dilation of the basis functions (dotted) for (a) STFT, (b) CWT, and (c) ST to obtain TFR for SFOAE waveforms. Bold black lines show the point wise multiplication of the basis function and SFOAE waveform.
EMD is an adaptive and data-driven TFA method. The data-driven decomposition property of EMD enables the segregation of nearly independent constituent components. One or more of the constituent components may correspond to unwanted information, and this property has been utilized for filtering out noise or extracting relevant information in multiple domains (Kopsinis and McLaughlin, 2009). The patterns in real-world data can be short and intermittent. EMD facilitates the discovery of intrinsic patterns at multiple scales, while not requiring the rigid assumptions of harmonic or stationary data structures, and produces physically meaningful intrinsic mode functions (IMFs; Mandic et al., 2013). For instance, the electroencephalogram (EEG) is a key diagnostic tool for pathology related to epileptic signals (interictal spikes) that get contaminated by muscle artifacts. The EMD has been used to remove these muscle artifacts from EEG signals (Safieddine et al., 2012). Each IMFs is a constituent component that captures some distinct characteristics of a composite multi-component waveform. The multiple internal reflection components are constituent components of a composite SFOAE waveform, and it is expected that one or more IMFs may resemble them. Therefore, multiple internal reflection components can be rejected by removing the corresponding IMFs. Motivated by this, an attempt was made to verify the hypothesis that IMFs uniquely encode multiple internal reflections and SFOAE components.
Synchrosqueezing was first introduced in the context of analyzing auditory signals for improving the compactness or concentration of the TFR (Daubechies and Maes, 1996). Synchrosqueezing is a time-frequency reallocation method that sharpens the TFR by reassigning its value to a different point in the time-frequency plane, which is determined by the local behavior of the TFR for a given time-frequency point (Auger et al., 2013). Synchrosqueezing can be applied over the TFR computed with STFT, CWT, or ST. Here, we applied synchrosqueezing transform on CWT because of its advantages over STFT and similarity with ST (Ventosa et al., 2008).
In this study, we evaluated the strength and limitations of various TFA techniques from the perspective of SFOAE analysis. As the true value of parameters in real SFOAEs is unknown, we analyzed simulated, but realistic SFOAE data. For a comparative assessment, an objective criterion based on the known value of the phase-gradient delay and three subjective criteria based on ideal properties of TFR were considered. Phase-gradient delay was considered as an effective objective measure due to the availability of actual phase-gradient delay values from the simulated model and its relative importance in measuring cochlear properties. The accuracy in estimation of phase-gradient delay is directly related to the removal of multiple internal reflection components. Removal of multiple internal reflection components depends on the time-frequency filtering, which in turn depends on the accuracy of the TFR. Thus, the accuracy of a TFA method is directly related to the accuracy of phase-gradient delay estimation. The CWT and ST are expected to yield better accuracy than STFT due to their multi-resolution ability. In addition, ST and CWT are expected to yield similar performance due to the similarity in their basis functions.
II. METHODS
A. Simulated SFOAEs
SFOAEs were simulated in accordance with the model graciously shared by Dr. Christopher Shera (Shera and Bergevin, 2012). The model parameters were kept similar to a previous study, as far as was practicable (Shera and Bergevin, 2012). The SFOAE pressure with multiple internal reflections is expressed as
| (1) |
where P0(f) is the stimulus source pressure, GME(f) characterizes round trip middle-ear transmission, and R(f) represents the cochlear reflectance. The cochlear reflectance is the complex amplitude of reverse-traveling waves, normalized with respect to forward traveling waves at the stapes.
The SFOAE pressure with additive noise N(f), at frequency f is expressed as
| (2) |
N(f) consists of random complex numbers with normal distribution. The root mean square noise levels were adjusted to keep the mean signal-to-noise ratio (SNR) greater than 15 dB. The SNR values of real SFOAEs might not always be acceptable at every stimulus frequency. In such cases, measurements that do not pass the specified SNR criteria are excluded from the analysis. The SFOAE frequencies spanned between 0.4 and 8 kHz. The frequency spacing was kept uniform with a spacing of 11 Hz.
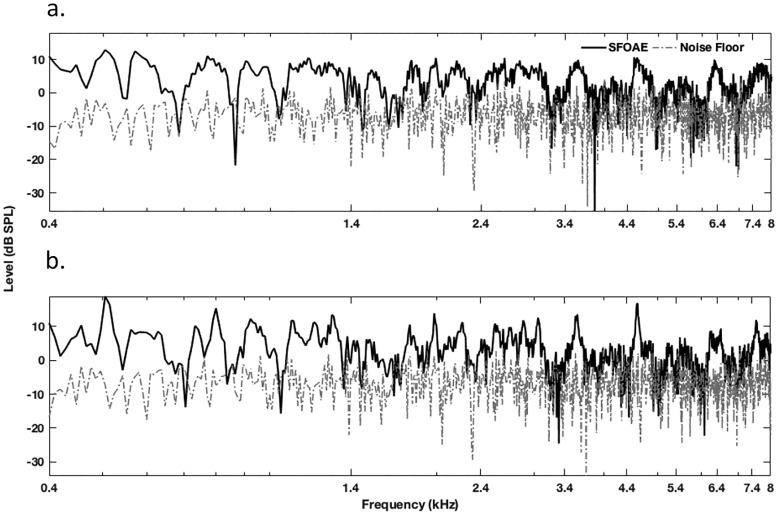
The distinction among emissions simulating different runs was incorporated by a random variation of the irregularity function. We created a total of 800 different sets of simulated emissions for this study. To generate multiple internal reflection components, the stapes reflection coefficient for retrograde cochlear waves was chosen as 0.58 + 0.58j, with a modulus value of . The magnitude plot and noise floor of simulated SFOAEs with a mean SNR of 15 dB with different reflection coefficients are shown in Fig. 2. For analysis, data at each frequency that did not pass the minimum SNR criteria of 15 dB were discarded. The time-domain equivalent of SFOAE was computed using inverse discrete Fourier transform. The sampling rate was 44.1 kHz. One-sided recursive exponential filters of the order 10 and cutoffs equal to one cycle were used to cancel periodic repetitions in the time-domain.
FIG. 2.
Simulated SFOAE signals and noise floor with a mean SNR of 15 dB, and modulus of reflection coefficient (a) and (b) .
B. TFA
TFA decomposes a waveform into constituent time-localized frequency components. The time-frequency decomposition extracts instantaneous amplitude and phase change of individual components from a multi-component signal. This information is particularly useful for OAE analysis for identification of spectral components that have different delay or latency characteristics.
The multi-component time-domain SFOAE signal s(t) as a function of time variable t can be expressed as
| (3) |
where sl(t) corresponds to the lth spectral component with a frequency, represented mathematically as , and is interpreted as an oscillatory mode or spectral component similar to Fourier analysis with time varying amplitude, frequency, and phase. Here, e(t) represents the noise in the waveform or the residue contributing to estimation errors and L denotes the number of components. The objective of each TFA method is to extract the components sl(t), their magnitudes Al(t), and their phases ϕl(t).
1. Linear TFA techniques
The generalized expression for linear transforms can be expressed as
| (4) |
where is referred to as the basis function. The core of the linear techniques is the choice of this basis functions, i.e., the pre-assigned family of templates. The basis determines the shape of the time-frequency atoms, and consequently, the time and frequency resolutions. The inner products of a translating and dilating basis function with time-domain SFOAE waveforms result in the time-frequency coefficient matrix. The elements of this matrix are complex numbers encapsulating the magnitude and phase at any given time and frequency. The types and properties of the basis functions drive the values in the time-frequency coefficient matrix. The specific basis functions corresponding to STFT, CWT, and ST are discussed in Secs. II B 1 a–II B 1 c.
a. STFT.
The STFT of a discrete domain SFOAE sequence s(n) is expressed as
| (5) |
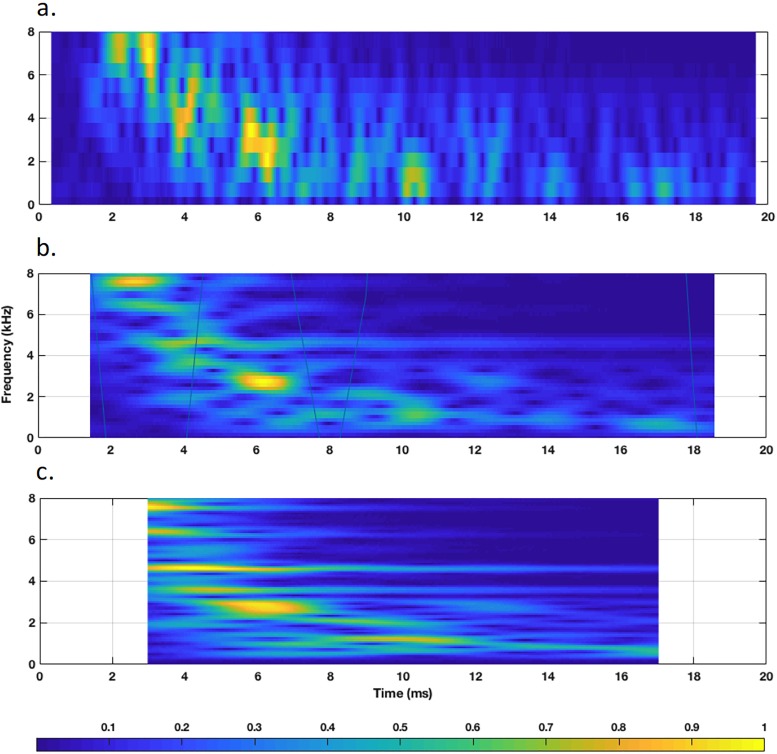
Here, w(n) represents the time-domain window function. Here, m, n, k, and N denote a temporary variable, time samples, frequency samples, and length of time-domain SFOAE signal, respectively. The window function localizes the spectrum to a specific time point. Therefore, the type of window function and its length play a major role in determining the accuracy of the STFT. The basis function for STFT is the window multiplied by the complex Fourier basis. The window slides in time to compute the frequency spectrum corresponding to each point on the time-frequency grid. A Hamming window with a width of 64 sample points was chosen for simulations (Zelle et al., 2017). The window width was determined by an exhaustive search to minimize the delay estimation error. Because of the fixed width of this window function, STFT has a fixed frequency resolution, which leads to inaccuracies in identifying temporal variation simultaneously for both low and high frequency components. The TFRs obtained with STFT window widths of 32, 128, and 264 samples are shown in Fig. 3. By comparing the TFRs, it can be observed that the spread along the frequency axis decreases and the spread along the time axis increases with increasing window width. In such a scenario, the most accurate window width for analysis cannot be determined with certainty unless the signal properties are known a priori. It is obvious that the outcomes are dependent on the window parameters.
FIG. 3.
(Color online) TFR of a sample SFOAE signal computed by STFT with window widths of (a) 32, (b) 128, and (c) 256 samples.
b. CWT.
The expression for CWT is similar to the generalized expression in Eq. (4). The basis function for CWT () is referred to as the “mother wavelet.” The mother wavelet can be chosen from a broad range of families and is governed by the wavelet admissibility conditions (Addison, 2017). The choice of the mother wavelet is dependent primarily on the nature of data to be analyzed. Two basis functions, a complex Morlet wavelet, and a basis whose shape resembles a temporal envelope of the frequency response of a low-pass Butterworth filter are used in the OAE literature (Tognola et al., 1997; Sisto and Moleti, 2007). Shera and Bergevin (2012) showed that both wavelets yield similar results. The complex Morlet wavelet basis from the MATLAB (MathWorks, Natick, MA) signal processing toolbox was chosen for the present analysis and is expressed as
| (6) |
where fb controls the delay in time domain or bandwidth in frequency domain and f0 is the center frequency.
c. ST.
The ST belongs to the CWT family, but with an added advantage of windowed Fourier basis function. The ST is expressed as (Stockwell et al., 1996)
| (7) |
The window function w(n) in ST is a frequency dependent generalized Gaussian function with parameters adopted from Mishra and Biswal (2016).
2. Nonlinear TFA techniques
a. EMD.
The IMFs in EMD were computed in accordance with the shifting theorem that characterizes the constituent oscillatory modes within the waveform (Flandrin et al., 2004). The EMD algorithm for extracting IMFs of a time-domain SFOAE signal can be summarized as follows:
-
(i)
Identify the local maxima and minima of the s(n).
-
(ii)
Use cubic spline interpolation to join local maxima to generate the upper envelope, and use the local minima to generate the lower envelope Imin(n).
-
(iii)
Find the local mean: Imean(n) = [Imax(n) + Imin(n)]/2.
-
(iv)
Extract the detail coefficients: d(n) = s(n) + Imean(n).
-
(v)
Check if d(n) is an IMF by verifying the following two conditions: The number of extrema and the number of zero crossings must differ by less than one, and at any given point the mean value of the envelope defined by the local maxima and the envelope defined by the local minima must be zero.
-
(vi)
Repeat steps (i)–(iv) to extract the first IMF, IMF1(n) = d(n).
After the first IMF was derived, the second IMF was generated from the residue r(n) = s(n) – IMF1(n). This process was iteratively conducted for finding all IMFs until the final residue was obtained from which no more IMFs could be derived. At the end of the decomposition, the SFOAE waveform can be expressed as
| (8) |
where L is the number of IMFs, IMFl(n) is the lth IMF, and r(n) is the final residue. The IMFs can be interpreted as coefficients of data-driven basis functions that may represent constituent spectral modes. Hilbert transform was applied over the IMFs for finding their analytic equivalent, which provided information regarding instantaneous amplitude and phase variation of each IMF. Here, EMD along with Hilbert transform is referred to as Hilbert-Huang transform (HHT). The Fourier-like representation obtained by HHT can be expressed as
| (9) |
where Al(n) and Φl(n) denote the instantaneous amplitude and phase of lth IMF at time index n, respectively, as computed from the Hilbert transform. The notation denotes the real part of the complex values.
b. SWT.
Reassigned TFRs can be obtained by applying synchrosqueezing transform over an existing TFR. The accuracy of the reassigned TFRs are not limited by the Gabor uncertainty principle, however, a higher accuracy is not always guaranteed (Gardner and Magnasco, 2006). Synchrosqueezing transformation is used to transform a representation in the time-frequency plane to its corresponding distribution in the instantaneous time and instantaneous frequency plane. The instantaneous frequency is defined as the first derivative of the phase with respect to time, and the instantaneous time is defined as first derivative of phase with respect to frequency subtracted from the current time. Synchrosqueezing alters the TFR obtained with any TFA approach, as a result, the spread of energy in the time-frequency plane gets concentrated around a relatively narrow region and enables more specific information regarding the TFR. In this study, synchrosqueezing transform was applied over the CWT result with the analytic Morlet wavelet. Synchrosqueezed transform applied over the CWT, referred to as SWT, is expressed as
| (10) |
where WT(n,ak) represents the time-scale matrix computed by CWT at time indices n and discrete scales ak. denotes the instantaneous frequency. Δω = ωk – ωk–1 denotes the spacing between two successive frequency bins with indices k and k – 1.
C. Comparison metrics
1. Objective assessment criteria
Estimation of phase-gradient delay.
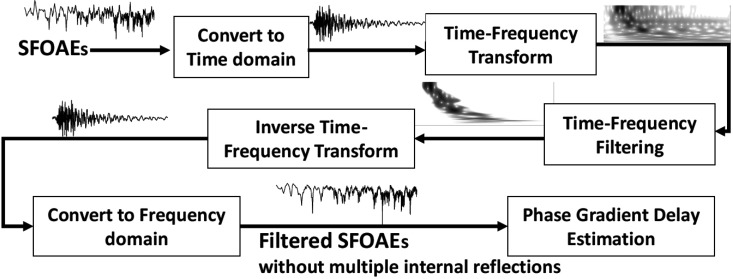
A graphical illustration of the procedure for canceling multiple internal reflection components and estimating phase-gradient delay is shown in Fig. 4. SFOAEs as a function of frequency were converted into equivalent time-domain SFOAEs. An appropriate TFA algorithm was applied over the time-domain SFOAEs to obtain the TFR. TFR gives the constituent time varying spectral components of the SFOAE. Time-frequency filtering was applied over the TFR to cancel out the multiple internal reflection components.
FIG. 4.
Block diagram describing the process of canceling multiple internal reflections through time-frequency filtering and estimation of phase-gradient delay.
The first step in performing time-frequency filtering is to extract the delay information from the TFR. Considering TF(t,f) as the TFR matrix obtained from a given TFA technique, the column corresponding to a frequency f is a set of values as a function of time, representing the time varying magnitude and phase at that frequency. The magnitude plotted with respect to time shows one or more peaks and valleys. The time varying spectra provide the ability to distinguish multiple internal reflection components from the primary SFOAE reflection component. The primary component is expected to have a peak magnitude greater than multiple internal reflections. The delay of the primary component can be computed from the TFR by time-localizing the maximum peak at each frequency. The location of maximum peak value may not accurately correspond to the delay due to the presence of noise and may be affected by the inaccuracies in the time-frequency method. Shera and Bergevin (2012) computed delay from the energy distribution of TFR, which is a relatively accurate procedure. The partial delay τTFR(t) is computed as
| (11) |
where denotes the SFOAE energy at every location in the time-frequency plane. The summation extends over the entire length of the time-domain signal. The delay at each frequency was recursively calculated according to the following equation until a specific termination criterion was met:
| (12) |
The factor α is a constant. The recursive computation of delay (τTFR) was terminated when the fractional difference between any two successive delay estimations became less than 1%.
In the second step, after obtaining the delay values corresponding to each frequency, time-frequency filtering was performed by masking the region around the delay versus frequency curve. We adopted the time-frequency filtering procedure along with the parameter values reported in Shera and Bergevin (2012). A tenth-order recursive exponential window was used as a masking function for filtering (Shera and Zweig, 1993). This window function was centered around the time point corresponding to the delay value, and was gradually tapered to zero on both sides. The value of α in Eq. (12) determined the performance of the filtering. Shera and Bergevin (2012) suggested that a value within the range of 1.6–1.9 would yield similar results. We fixed the value of α as 1.9 for all simulations in this paper. The regions of the time-frequency plane that may correspond to multiple internal reflections were canceled out in the time-frequency filtering process.
Post filtering, inverse TFA was performed over the filtered time-frequency spectra to obtain the filtered SFOAE waveform in the time domain. Fast Fourier transform was applied on this filtered waveform for obtaining the filtered SFOAE in the frequency domain. The phase-gradient delay was computed from the filtered SFOAE in the frequency domain. The peak picking strategy was used to compute the phase-gradient delay. Following initial computation, the Loess smoothing with a factor of 0.9 was applied on the raw phase-gradient delay data for obtaining the fitted phase-gradient delay plot. The smoothing factor for Loess fitting could be between 0 and 1. A value of 0 follows the raw values of phase-gradient delay, while a value of 1 applies maximum smoothing. It was found that a Loess factor of 0.9 resulted in minimum error when an estimated phase-gradient delay was compared with a known phase-gradient delay.
2. Subjective assessment criteria
The phase-gradient delay was used as an objective measure for comparing various methods, primarily because the true values were known from the simulated SFOAE model. However, SFOAE analysis is not limited to cancellation of multiple internal reflection components and estimation of phase-gradient delay. Therefore, few additional assessment criteria were considered, such as time-frequency energy concentration, frequency specificity, and extraction of constituent spectral components. As the true values of these measures were not known, these measures are referred to as subjective assessment criteria. Each criterion is evaluated according to the theoretical foundations in time-frequency signal processing and from the perspective of their utility in physiological characterization.
a. Energy concentration.
The TFR indicates how the spectral components are distributed in the time-frequency plane. Higher energy concentration implies a more specific TFR and infers that the time and frequency domain leakages are minimal. Higher energy concentration shows up as thinner lines in TFR plot and implies less ambiguity in extracting time-localized frequency information.
b. Frequency specificity.
The spread of magnitude around a particular frequency (width of the peak) was quantified and referred to as frequency specificity (van Vugt et al., 2007). Frequency specificity represents the amount of spectral leakage and the ability to distinguish closely spaced spectral components. It was defined as the average of normalized magnitudes over time and can be expressed as
| (13) |
Here, n and k represent the time and frequency sample, respectively.
c. Spectral components.
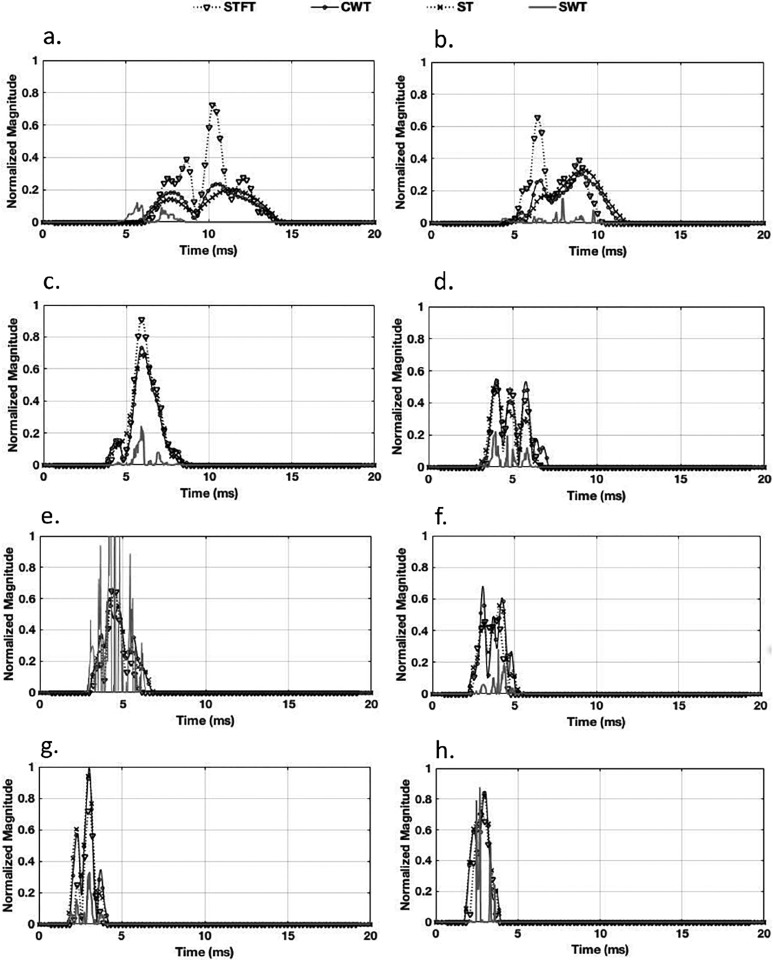
The magnitude variation of spectral components indicates the existence of multiple delay components and shows their distinguishability. Spectral components were extracted for 1, 2, 3, 4, 5, 6, 7, and 8 kHz. The magnitude of each component was normalized for a comparative assessment.
III. RESULTS
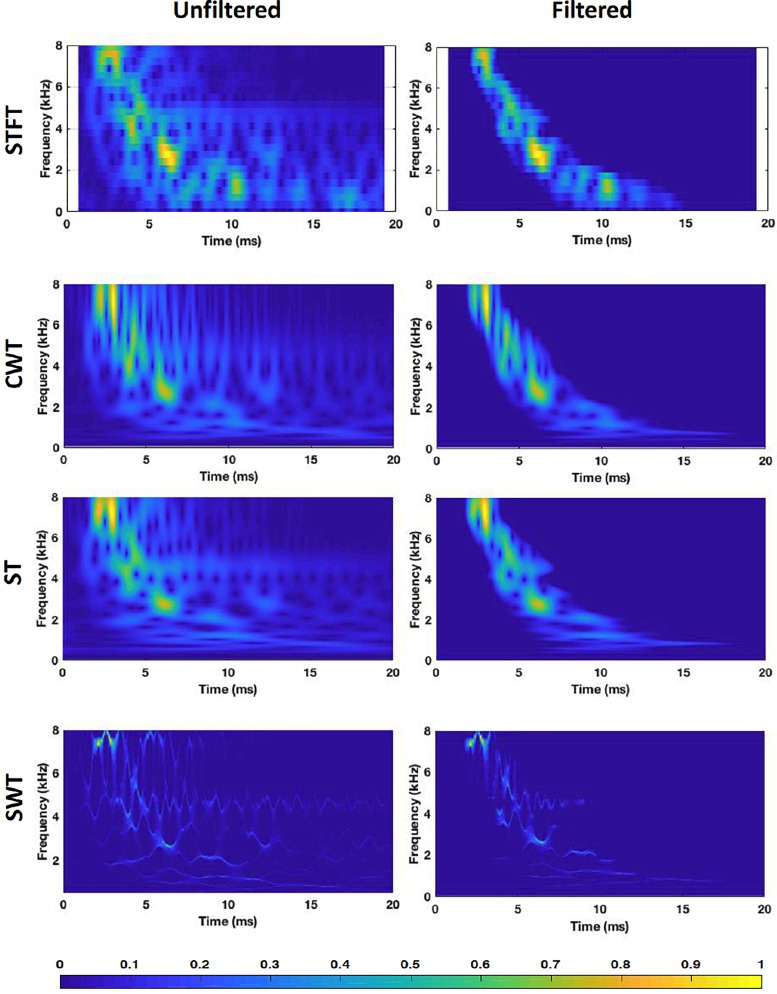
The TFRs for one set of simulated SFOAEs with and without time-frequency filtering, computed by STFT, CWT, ST, and SWT are shown in Fig. 5. The resolution of STFT appears to be coarse. The TFRs of CWT and ST appear to be similar. The TFR for SWT appears as concentrated thin lines. These thin lines represent instantaneous time and frequency values after reassignment of the energy.
FIG. 5.
(Color online) TFRs of a sample SFOAE waveform (left column) and their corresponding time-frequency filtered residues (right column) computed with various TFA methods, STFT, CWT, ST, and SWT.
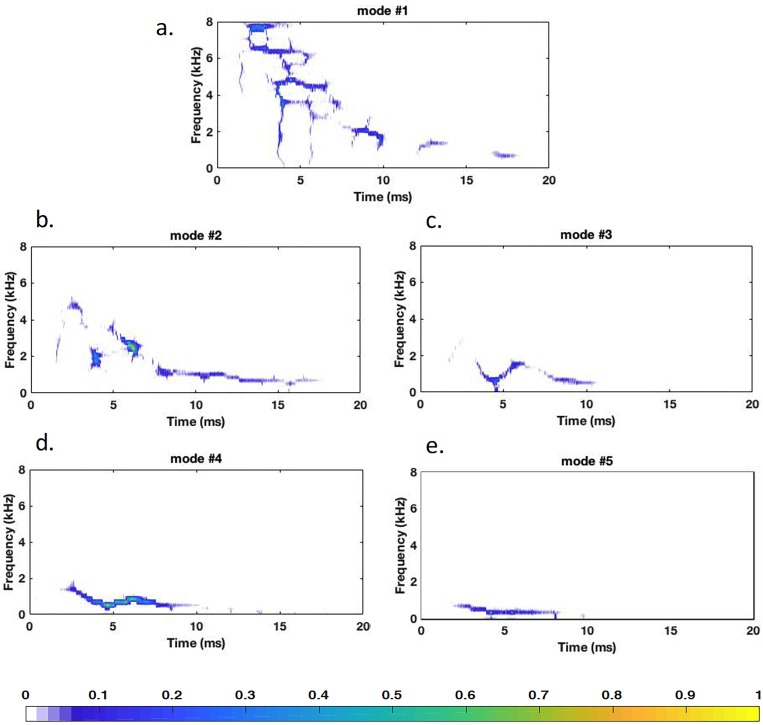
The TFR of modes extracted from the EMD procedure are presented in Fig. 6. The time-domain SFOAE waveform was decomposed into five distinct constituent modes and each mode has unique characteristics. Figure 6 suggests that modes #1–3 have major contributions in the SFOAE waveform, whereas modes #4 and #5 have negligible contributions only in the low frequency range. The four most significant modes were preserved for studying the impact on phase-gradient delay estimation.
FIG. 6.
(Color online) Time-frequency representation of different intrinsic modes computed from EMD.
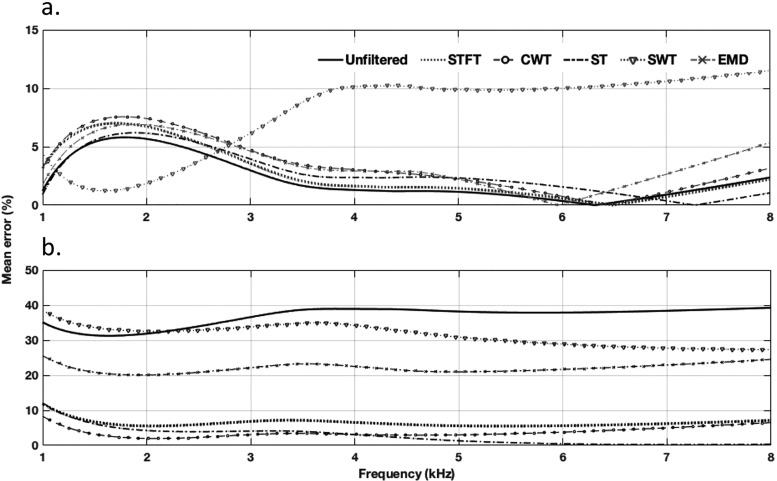
The mean percentage of errors for phase-gradient delay estimation for various methods for SFOAEs simulated without multiple internal reflections are plotted in Fig. 7(a). It shows that none of the filtering methods, excluding SWT, introduce significant bias in phase-gradient delay estimation. The root mean square estimation errors, computed across frequencies were 1.60, 2.78, 3.38, and 3.24% for unfiltered, STFT, CWT, and ST filtering, respectively. All the methods except SWT gave comparable results and were similar to the unfiltered data with estimation errors less than 5%.
FIG. 7.
Mean errors in estimation of phase-gradient delay after time-frequency filtering for SFOAEs (a) without multiple internal reflection components (), and (b) with multiple internal reflection components (), for various time-frequency analysis methods.
Figure 7(b) shows the mean percentage of errors in estimating phase-gradient delay when multiple internal reflection components were present (i.e., ). The mean error in phase-gradient delay estimation without filtering was roughly 30%–40%. The root mean square errors after time-frequency filtering, combined across all frequencies for STFT, CWT, and ST were found to be 6.41, 3.91, and 3.52%, respectively. It appears that the mean errors for all TFA methods but SWT were less compared to the unfiltered condition. For EMD filtering, the mean error in estimating phase-gradient delay was nearly 25%. The modes in EMD did not appropriately represent the SFOAE components, therefore, further analysis for EMD is not presented.
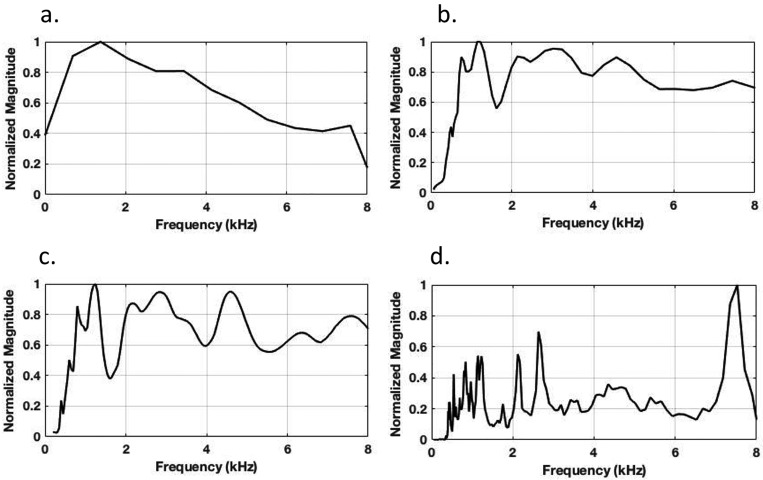
Figure 8 shows the frequency specificity of the TFA techniques for a representative SFOAE signal. The height of the peak at each frequency of interest represents the relative contribution of that spectral component. The wider peaks indicate that frequency specificity of STFT is the poorest among all the methods. The STFT parameters can be altered to obtain narrower peaks; however, we have already optimized it with respect to the known phase-gradient delay, i.e., the parameters that gave minimal errors in phase-gradient delay estimation. There can be one and only one TFR of a given signal that is correct. There is an inherent assumption that the method (with optimal parameters) that gives the most accurate TFR will likely provide accurate characterization of other subjective metrics. The exact values of other metrics were not known from the model, so it is not appropriate to vary the optimal TFA parameters for each metric. The number of peaks and specificity in case of CWT and ST are superior to STFT. The ST shows narrower peaks compared to the CWT. In addition, the number of peaks in case of ST are more than that of CWT. SWT demonstrates very good frequency specificity, or anti-leakage property, due to the reassignment.
FIG. 8.
Frequency specificity of a sample SFOAE signal computed with (a) STFT, (b) CWT, (c) ST, and (d) SWT.
The time varying spectral components corresponding to 1–8 kHz with 1 kHz spacing were extracted from the TFR and are shown in Fig. 9. The magnitude of each component was normalized within the test for a comparative assessment. Each peak in the magnitude plot of a spectral component denotes a constituent subcomponent with a specific delay. The 1 kHz component has two distinct peaks when extracted from TFR computed by CWT and ST. The 1 kHz spectral component extracted through STFT has more than two peaks. The results are similar for other frequencies.
FIG. 9.
Time varying spectral components corresponding to frequencies (a) 1 kHz, (b) 2 kHz, (c) 3 kHz, (d) 4 kHz, (e) 5 kHz, (f) 6 kHz, (g) 7 kHz, and (h) 8 kHz.
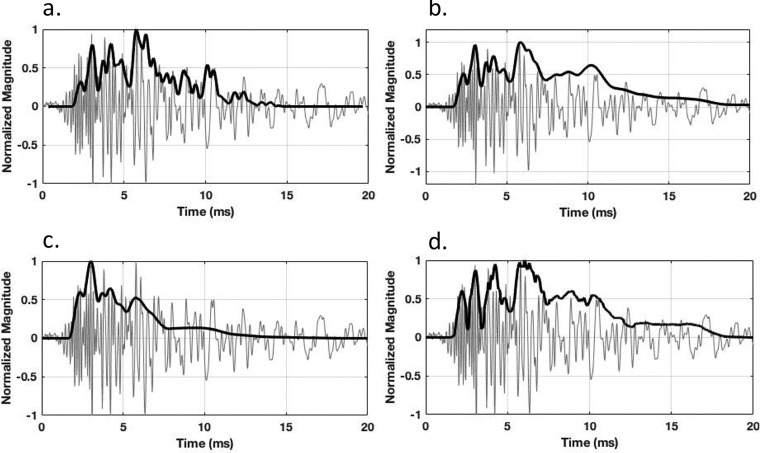
The average of TFR-extracted spectral components are shown in Fig. 10. Ideally, the average of all TFR-extracted spectral components should correspond to the envelope of the time-domain SFOAE signal. However, in practice, this is not the case due to the time versus frequency trade off governed by the Gabor uncertainty principle. The closer resemblance to the SFOAE envelope indicates more accurate time resolution. The four methods closely track the variation of magnitude envelopes of time-domain SFOAEs with nearly equivalent efficacy. The shape of the envelopes was found to be similar for STFT, CWT, and ST.
FIG. 10.
Time-domain SFOAE signal (gray) and the envelope (black) estimated from spectral averages of TFR components computed with (a) STFT, (b) CWT, (c) ST, and (d) SWT.
IV. DISCUSSION
The relative performances of STFT, CWT, ST, EMD, and SWT were examined for SFOAE analysis. The effectiveness of these TFAs in removing multiple internal reflections for estimating phase-gradient delays from 800 SFOAE simulations was compared. Additionally, their frequency specificity and usefulness for obtaining desired spectral components were evaluated.
The mean phase-gradient delay estimation errors for STFT, CWT, and ST were found to be very similar, with the lowest errors for ST. The selected window length for STFT minimized the error in estimation for phase-gradient delay. The near equivalent performance of STFT, according to the theory of multi-resolution analysis (Boashash, 2015), suggests that the variation of spectral components is minimal. This does not necessarily mean that real SFOAEs do not have fast varying components.
The mode decomposition property of EMD is utilized to extract features and segregate noise or unwanted information (Kopsinis and McLaughlin, 2009). However, EMD could only partially filter out multiple internal reflections when evaluated at a group level (800 simulations). For EMD to work, the extracted IMFs should independently model the SFOAE components and multiple internal reflections. The IMFs can be extracted in several ways. We evaluated the basic method for computing IMFs via the sifting technique. However, if IMFs extracted by some other technique can uniquely model the SFOAE and multiple internal reflection components, EMD based filtering may perform better.
The cancellation of multiple internal reflections was poor for filtering with SWT, as well. Reconstructing part of the signal corresponding to direct emission from the ridges of the SWT time-frequency grid potentially could resolve this issue, however, it requires developing a filtering approach based on the tracking of appropriate time-frequency ridges.
The root mean square estimation errors were less than 5% for SFOAEs without multiple internal reflections for all the methods except SWT. This implies that the method, which gives accurate phase-gradient delay estimation when multiple internal reflections are present, does not introduce any signal processing errors in the absence of multiple internal reflections. The present results for the CWT method are comparable to that of Shera and Bergevin (2012). They reported a mean error of 5% for the CWT method for SFOAEs simulated without multiple internal reflections. For SFOAEs simulated with multiple internal reflections, the root mean square estimation error for CWT filtering reduces to 3.91% from a mean error of roughly 30%–40% without filtering. These results are in conformance with those reported by Shera and Bergevin (2012). They reported a mean error of roughly 20%–30% for unfiltered SFOAEs and a mean error of less than 1% with CWT filtering. The slight mismatch with their results could be potentially due to the randomness of simulated SFOAEs.
In cases of real SFOAEs, there is always some amount of multiple internal reflections; however, there is no way to know the degree of their contribution. The time-frequency filtering with STFT, CWT, or ST does not introduce any significant signal processing errors and efficiently removes the multiple internal reflection components. It can be considered as a preferred approach to get rid of multiple internal reflections.
A narrow peak with regard to frequency specificity indicates that most of the energy is centered around a particular frequency and that spectral leakage is minimal. The frequency specificity of STFT was found to be poorest among all methods. In contrast, ST and CWT yielded better and comparable frequency specificity. Although a narrower window width could enhance the frequency specificity for STFT, it will degrade the phase-gradient delay estimation and adversely affect the extraction of constituent components. The extracted SFOAE modes or IMFs for EMD could not be mapped to analytical information, such as components based on delay, as they do not refer to a fixed basis function. For SWT, the shapes of the peaks were arbitrary, which makes characterization and segregation of components based on delay challenging. SWT appears to have very sharp frequency specificity, but has relatively higher phase-gradient delay estimation errors.
The adopted SFOAE model is a phenomenological model of the emission process. The multiple internal reflection components are assumed to have longer delay and very low energy compared to SFOAEs. In cases of multiple sources, the delays are relatively shorter compared to multiple internal reflection components. Thus, the time-frequency filtering may not remove these relatively short delay components. In such cases, these components can be tracked from the TFR of filtered SFOAEs by extracting the time varying spectral components.
Although these TFA methods were evaluated using simulated SFOAE analysis, similar conclusions could be expected for the TFA of other types of OAEs, such as distortion-product OAEs. These methods can be applied to remove short delay components from transient-evoked OAEs, and separate distortion and reflection components for distortion-product OAEs.
In summary, the performance of STFT was slightly poorer compared to CWT and ST due to its fixed frequency resolution, which is determined by the fixed width of the analysis window. This limitation is alleviated in case of CWT due to the variation of scales of the Morlet wavelet. The Morlet wavelet consists of the Gaussian modulated exponential function. The ST has an exponential basis multiplied by the Gaussian window function. Because of this similarity in basis functions, CWT and ST showed similar performances. The synchrosqueezing operation reassigns the wavelet TFR, resulting in thin curves representing high energy concentrated regions. SWT showed minimum spectral leakage and high energy concentration; however, it fails to cancel multiple internal reflections. Although ST gave relatively better performance among the five tested TFA methods, it can be concluded that either ST or CWT is appropriate for SFOAE analysis.
ACKNOWLEDGMENTS
This work was supported by the National Institute on Deafness and Other Communication Disorders of the National Institutes of Health (Grant No. R03DC014573). We thank Christopher Shera for kindly sharing the SFOAE model.
References
- 1. Addison, P. S. (2017). The Illustrated Wavelet Transform Handbook: Introductory Theory and Applications in Science, Engineering, Medicine and Finance, 2nd ed. ( CRC Press, Philadelphia, PA: ). [Google Scholar]
- 2. Auger, F. , Flandrin, P. , Lin, Y. T. , McLaughlin, S. , Meignen, S. , Oberlin, T. , and Wu, H. T. (2013). “ Time-frequency reassignment and synchrosqueezing: An overview,” IEEE Signal Process. Mag. 30(6), 32–41. 10.1109/MSP.2013.2265316 [DOI] [Google Scholar]
- 3. Bergevin, C. , Manley, G. A. , and Köppl, C. (2015). “ Salient features of otoacoustic emissions are common across tetrapod groups and suggest shared properties of generation mechanisms,” Proc. Natl. Acad. Sci. U.S.A. 112(11), 3362–3367. 10.1073/pnas.1418569112 [DOI] [PMC free article] [PubMed] [Google Scholar]
- 4. Bergevin, C. , and Shera, C. A. (2010). “ Coherent reflection without traveling waves: On the origin of long-latency otoacoustic emissions in lizards,” J. Acoust. Soc. Am. 127(4), 2398–2409. 10.1121/1.3303977 [DOI] [PMC free article] [PubMed] [Google Scholar]
- 5. Boashash, B. (2015). Time-Frequency Signal Analysis and Processing: A Comprehensive Reference, 2nd ed. ( Academic, London: ). [Google Scholar]
- 6. Daubechies, I. , and Maes, S. (1996). “ A nonlinear squeezing of the continuous wavelet transform based on auditory nerve models,” in Wavelets in Medicine and Biology, edited by Aldroubi A. and Unser M. ( CRC Press, Philadelphia, PA: ), pp. 527–546. [Google Scholar]
- 7. Flandrin, P. , Rilling, G. , and Goncalves, P. (2004). “ Empirical mode decomposition as a filter bank,” IEEE Signal Process. Lett. 11(2), 112–114. 10.1109/LSP.2003.821662 [DOI] [Google Scholar]
- 8. Gardner, T. J. , and Magnasco, M. O. (2006). “ Sparse time-frequency representations,” Proc. Natl. Acad. Sci. U.S.A. 103(16), 6094–6099. 10.1073/pnas.0601707103 [DOI] [PMC free article] [PubMed] [Google Scholar]
- 9. Kalluri, R. , and Shera, C. A. (2013). “ Measuring stimulus-frequency otoacoustic emissions using swept tones,” J. Acoust. Soc. Am. 134(1), 356–368. 10.1121/1.4807505 [DOI] [PMC free article] [PubMed] [Google Scholar]
- 10. Kopsinis, Y. , and McLaughlin, S. (2009). “ Development of EMD-based denoising methods inspired by wavelet thresholding,” IEEE Trans. Signal Process. 57(4), 1351–1362. 10.1109/TSP.2009.2013885 [DOI] [Google Scholar]
- 11. Mandic, D. P. , Rehman, N. u. , Wu, Z. , and Huang, N. E. (2013). “ Empirical mode decomposition-based time-frequency analysis of multivariate signals: The power of adaptive data analysis,” IEEE Signal Process. Mag. 30(6), 74–86. 10.1109/MSP.2013.2267931 [DOI] [Google Scholar]
- 12. Mishra, S. K. , and Biswal, M. (2016). “ Time-frequency decomposition of click evoked otoacoustic emissions in children,” Hear. Res. 335, 161–178. 10.1016/j.heares.2016.03.003 [DOI] [PubMed] [Google Scholar]
- 13. Rilling, G. , and Flandrin, P. (2008). “ One or two frequencies? The empirical mode decomposition answers,” IEEE Trans. Signal Process. 56(1), 85–95. 10.1109/TSP.2007.906771 [DOI] [Google Scholar]
- 14. Safieddine, D. , Kachenoura, A. , Albera, L. , Birot, G. , Karfoul, A. , Pasnicu, A. , Biraben, A. , Wendling, F. , Senhadji, L. , and Merlet, I. (2012). “ Removal of muscle artifact from EEG data: Comparison between stochastic (ICA and CCA) and deterministic (EMD and wavelet-based) approaches,” EURASIP J. Adv. Signal Process. 2012(1), 127. 10.1186/1687-6180-2012-127 [DOI] [Google Scholar]
- 15. Shera, C. A. , and Bergevin, C. (2012). “ Obtaining reliable phase-gradient delays from otoacoustic emission data,” J. Acoust. Soc. Am. 132(2), 927–943. 10.1121/1.4730916 [DOI] [PMC free article] [PubMed] [Google Scholar]
- 16. Shera, C. A. , and Zweig, G. (1993). “ Noninvasive measurement of the cochlear traveling-wave ratio,” J. Acoust. Soc. Am. 93(6), 3333–3352. 10.1121/1.405717 [DOI] [PubMed] [Google Scholar]
- 17. Sisto, R. , and Moleti, A. (2007). “ Transient evoked otoacoustic emission latency and cochlear tuning at different stimulus levels,” J. Acoust. Soc. Am. 122(4), 2183–2190. 10.1121/1.2769981 [DOI] [PubMed] [Google Scholar]
- 18. Stockwell, R. G. , Mansinha, L. , and Lowe, R. P. (1996). “ Localization of the complex spectrum: The S transform,” IEEE Trans. Signal Process. 44(4), 998–1001. 10.1109/78.492555 [DOI] [Google Scholar]
- 19. Tognola, G. , Grandori, F. , and Ravazzani, P. (1997). “ Time-frequency distributions of click-evoked otoacoustic emissions,” Hear. Res. 106(1), 112–122. 10.1016/S0378-5955(97)00007-5 [DOI] [PubMed] [Google Scholar]
- 20. van Vugt, M. K. , Sederberg, P. B. , and Kahana, M. J. (2007). “ Comparison of spectral analysis methods for characterizing brain oscillations,” J. Neurosci. Methods 162(1), 49–63. 10.1016/j.jneumeth.2006.12.004 [DOI] [PMC free article] [PubMed] [Google Scholar]
- 21. Ventosa, S. , Simon, C. , Schimmel, M. , Danobeitia, J. , and Manuel, A. (2008). “ The S-transform from a wavelet point of view,” IEEE Trans. Signal Process. 56(7), 2771–2780. 10.1109/TSP.2008.917029 [DOI] [Google Scholar]
- 22. Zelle, D. , Lorenz, L. , Thiericke, J. , Gummer, A. , and Dalhoff, E. (2017). “ Input-output functions of the nonlinear-distortion component of distortion-product otoacoustic emissions in normal and hearing-impaired human ears,” J. Acoust. Soc. Am. 141(5), 3203–3219. 10.1121/1.4982923 [DOI] [PMC free article] [PubMed] [Google Scholar]


