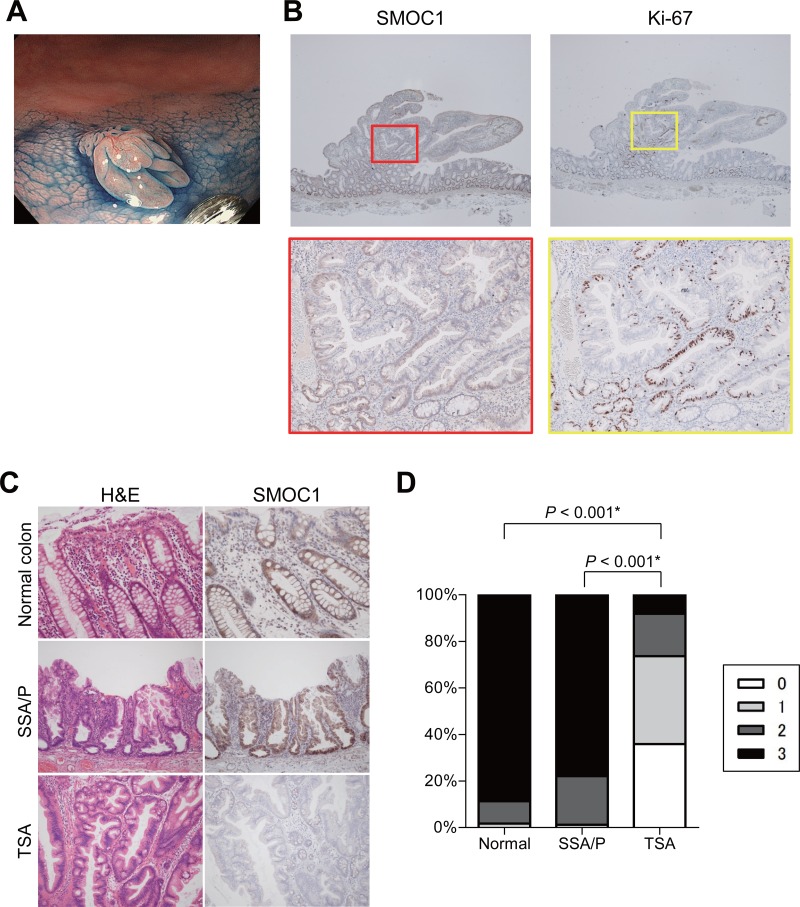
Figure 3. Immunohistochemical analysis of SMOC1 in serrated lesions.
(A) Endoscopic view of a TSA with protruding and flat components. (B) SMOC1 (left) and Ki-67 (right) staining in the TSA specimen shown in (A). Magnified views indicated by red and yellow boxes are shown below. (C) Representative views of hematoxylin and eosin (left) and SMOC1 (right) staining in normal colonic tissue, SSA/P and TSA specimens. (D) Summarized results for SMOC1 expression levels in normal colon (n = 23), SSA/Ps (n = 12) and TSAs (n = 11). *Fisher's exact test.

