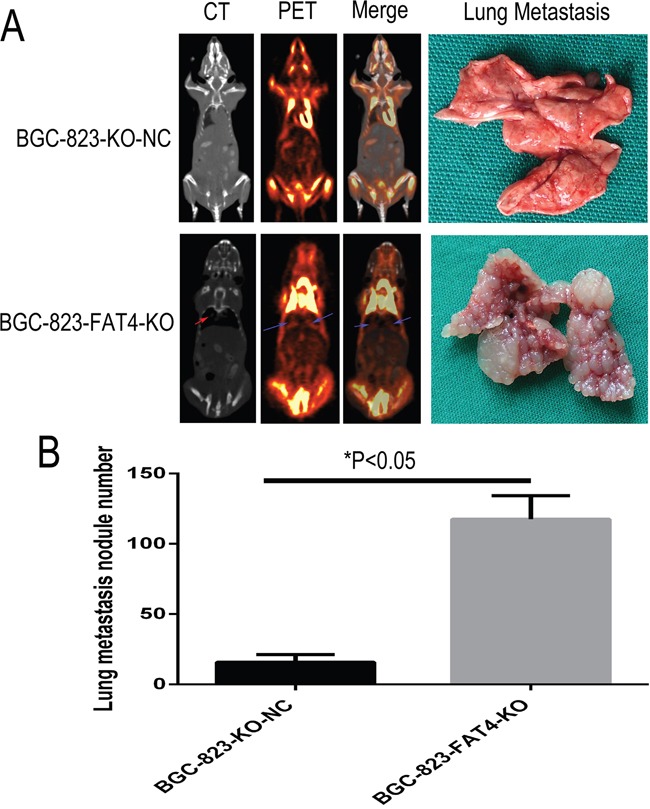
Figure 6. Effect of FAT4 knockout on lung metastasis of GC cells in the nude mice model using PET-CT scans.

(A) PCT-CT scan analysis showing metastasis status at 5 weeks after tail vein injection of BGC-823-FAT4-KO and BGC-823-KO-NC cells into nude mice. CT scan images (left of A) show tumor nodules in the lungs from BGC-823-FAT4-KO group (indicated by red arrow), whereas tumor nodules are absent or less clearly defined in the lungs of the control group. PET scan image (left central of A) and merge analysis image (right central of A) show higher 18F-FDG activity in the lungs of BGC-823-FAT4-KO group than the BGC-823-KO-NC group (indicated by blue arrows). The lung metastasis histology figures (top right of A) shown fewer number of lung metastasis nodes in BGC-823-KO-NC, but the numbers of lung metastasis nodes are dramatically increased in BGC-823-FAT4-KO (below right of A). (B) Histogram plots show increased number of metastatic tumor nodules in the BGC-823-FAT4-KO group mice (n=5) than BGC-823-KO-NC group (n=5). Data represent mean ± SD from 3 independent experiments. * denotes P < 0.05.
