

Abstract
Diffuse intrinsic pontine glioma (DIPG) is a highly aggressive glial tumor that occurs in children. The extremely poor median and 5-year survival in children afflicted with DIPG highlights the need for novel biology-driven therapeutics. Here, we have implicated the chromatin remodeler and regulator of brain development called RE1 Silencing Transcription Factor (REST), in DIPG pathology. We show that REST protein is aberrantly elevated in at least 21% of DIPG tumors compared to normal controls. Its knockdown in DIPG cell lines diminished cell growth and decreased their tumorigenicity in mouse intracranial models. DIPGs are vascularized tumors and interestingly, REST loss in DIPG cells also caused a substantial decline in tumor vasculature as measured by a decrease in CD31 and VEGFR2 staining. These observations were validated in vitro, where a significant decline in tube formation by human umbilical vein endothelial cells (HUVEC) was seen following REST-loss in DIPG cells. Mechanistically, REST controlled the secretion of a pro-angiogenic molecule and ligand for VEGFR2 called Gremlin-1 (GREM-1), and was associated with enhanced AKT activation. Importantly, the decline in tube formation caused by REST loss could be rescued by addition of recombinant GREM-1, which also caused AKT activation in HUVECs and human brain microvascular endothelial cells (HBMECs). In summary, our study is the first to demonstrate autocrine and paracrine functions for REST in DIPG development. It also provides the foundation for future investigations on anti-angiogenic therapies targeting GREM-1 in combination with drugs that target REST-associated chromatin remodeling activities.
Keywords: DIPG, REST, vasculature, gremlin, VEGFR2
INTRODUCTION
Diffuse intrinsic pontine glioma (DIPG) is a highly aggressive glial tumor that occurs primarily in children between the ages of 5 and 10. DIPG originates in the pons, an area of the brain responsible for many essential functions such as coordination, breathing and heartbeat [1–3]. The median survival period for children with DIPG is currently only around 9 months, and the 5-year survival is less than 1% [4, 5]. The precarious location of the tumor precludes surgery [6–8]. It is also a highly infiltrative tumor and chemotherapy has modest efficacy at best. Therefore, focal radiation therapy is the current accepted standard of care [1, 9, 10]. Thus, there is a clear need for new therapies based on a better understanding of tumor biology. In the past, lack of DIPG tumor tissue and absence of animal models hampered investigations on tumor biology and therapeutics discovery. However, in recent years, availability of biopsy and access to tumor tissue samples resulted in successful development of DIPG cell cultures and high throughput genomic analyses of DIPG tumors. It has now become possible to pursue investigations at the molecular level [11–18].
DIPG are classified as Grade II-IV gliomas that include diffuse astrocytoma, anaplastic astrocytoma or glioblastoma. Under new WHO classification many DIPGs are defined as diffuse midline gliomas with H3K27M mutation [19]. The H3K27M mutation is a hallmark of more than 80% of DIPGs, implicating epigenetic perturbations in DIPG genesis [20]. The role of this mutation in tumor development is under active investigation in a number of groups [21–26]. Mutations in ACVR1 and TP53, amplification in PDGFαR and aberrations in MYC and MYCN are also found in a sub-set of DIPG patients [14, 27–29]. PI3K and MAPK signaling pathways are highly activated in a majority of DIPG tumors [30].
Here, we have focused on delineating the role of a chromatin remodeler called RE1 Silencing Transcription Factor (REST) in DIPG development. REST is a zinc finger DNA binding protein and is associated with two independent chromatin-remodeling complexes at its amino (N-) and carboxy (C-) terminus [31–33]. It is regulator of brain development and most studies have focused on its function as a negative regulator of neuronal lineage specification in embryonic stem cells and neural progenitors [34–43]. REST expression is dysregulated in various tumors of neural or neural crest origin including medulloblastoma [44, 45], glioblastoma [46, 47], Ewings sarcoma [48, 49] and neuroblastoma [50–52]. Previous work from our group and others has shown that REST is important for medulloblastoma progression and maintenance [53]. However, REST biology in DIPG has not been evaluated thus far.
Here we show that REST gene and protein expression is elevated in DIPG samples compared to normal controls. It is also expressed to various levels in DIPG cell lines. REST loss diminished DIPG cell growth in vitro and formation of intracranial tumors. This was due to a decrease in cell proliferation. In addition, DIPG tumors resulting from cells with REST loss exhibited a decrease in CD31, an endothelial marker, and vascular endothelial growth factor receptor 2 (VEGFR2) staining. In vitro assays revealed a significant decrease in the ability of human umbilical vascular endothelial cells (HUVEC) to form tubes when cultured in medium harvested from DIPG cells where REST expression was knocked down. This change in tube formation was not due to endothelial cell proliferation. In mechanistic studies, we observed that levels of REST and that of the pro-angiogenic protein and ligand for VEGFR2, Gremlin-1 (GREM-1), were directly correlated in DIPG xenografts. REST knockdown caused a decline in secreted GREM-1 as measured by ELISA. Knockdown of GREM-1 decreased the ability of DIPG cells to support the formation of tubes in vitro by both HUVEC and human brain micro-vascular endothelial cells (HBMECs). The ability of GREM-1 to promote downstream AKT activation in HUVEC and HBMECs was confirmed using recombinant GREM-1. Thus, our study is the first to implicate REST in DIPG tumors. We also demonstrate an autocrine and paracrine function for REST in DIPG development. The latter involves upregulation of GREM-1 and AKT activation.
RESULTS
REST is expressed at variable levels in human DIPG
To evaluate REST expression in DIPG, we obtained microarray datasets containing gene expression values in human DIPG tumors from Gene Expression Omnibus (www.ncbi.nlm.nih.gov/geo) and analyzed through the GEO2R interface. REST mRNA levels were significantly elevated in DIPG tumor samples (n=35) compared to normal brain (n=10). This elevation was particularly significant in DIPGs with H3K27M mutation (Figure 1A). Further, human formalin-fixed paraffin-embedded (FFPE) DIPG specimens (n=19) obtained at autopsy were subjected to immunohistochemical (IHC) analyses. REST expression was scored by a neuropathologist as a negative (0)/ weak and focal (+)/ weak, diffuse or multifocal (++)/ strong and focal (+++)/or strong, diffuse or multifocal (++++). Normal brainstem samples are from patients with DIPG tumors, but from a region where tumor was thought not to be present. Approximately, 21% of tumors showed increased REST expression compared to total number of samples analyzed (Figure 1B; Table 1). REST transcript and protein levels in three human DIPG (SU) cell lines were determined by q-RT-PCR and western blotting. As shown in Figure 1C, REST mRNA levels were higher in SU-DIPG-IV and SU-DIPG-VI compared to SU-DIPG-XIII. However, REST protein levels were higher in SU-DIPG-IV and SU-DIPG-XIII relative to SU-DIPG-VI (Figure 1D).
Figure 1. REST expression is elevated in human DIPG.
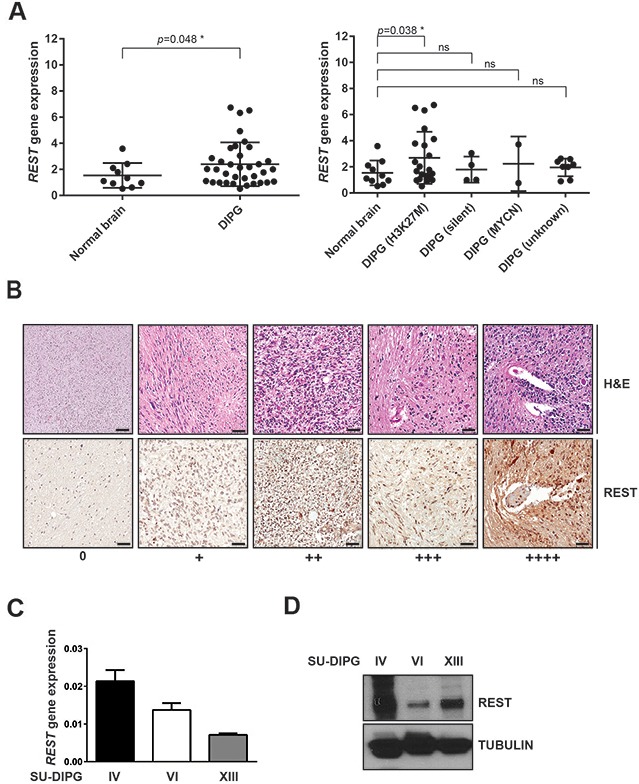
(A) Gene expression profiles measured by microarray. Gene expression datasets deposited in GEO were retrieved and analyzed using GEO2R as described in Materials and Methods. A comparison between normal brain samples and a total of 35 DIPG patient samples were shown on the left side. The same set of patient samples were subdivided into three distinct subgroups (H3-K27M, silent and MYCN) [16] and were compared with samples of an unknown subgroup on the right side. Each dot corresponds to one individual patient. Bars represent mean with standard deviations. *p<0.05; ns=non-significant. (B) Hematoxylin-eosin (H&E) and immunohistochemical analysis (IHC) for REST in FFPE DIPG tumor specimens (n=19) and normal pons (n=2) was performed as described in materials and methods. Staining was scored by a neuropathologist as negative (0), weak and focal (+1), weak diffuse or multifocal (+2), strong and focal (+3), strong diffuse or multifocal (+4). Scale bar, 50μm. REST gene expression and protein levels in SU-DIPG-IV, -VI and -XIII cell lines were determined by (C) Q-RT-PCR and (D) Western blotting respectively. GAPDH was to normalize REST gene expression. Tubulin served as a loading control for Western blot analysis.
Table 1. Immunohistochemical analysis of REST protein expression in FFPE human DIPG specimens.
| Sample | Highest Quantified REST staining Levels | ||||
|---|---|---|---|---|---|
| 0 | + | ++ | +++ | ++++ | |
| Normal Brain Stem (2) | 1 | 1 | |||
| Tumor (19) | 2 | 4 | 4 | 5 | 4 |
REST expression was scored by a neuropathologist as a negative (0)/ weak and focal (+)/ weak, diffuse or multifocal (++)/ strong and focal (+++)/or strong, diffuse or multifocal (++++). Normal brainstem samples are from brainstems that had DIPG tumors but were read where tumor was not present.
REST loss blocks DIPG cell growth in vitro and in vivo
To investigate if REST played a role in DIPG genesis, SU-DIPG-IV and SU-DIPG-XIII were transduced with lentivirus expressing a control shRNA or two different shRNA against REST (shRNA1 and shRNA 2). REST expression was evaluated by Q-RT-PCR and was found to be knocked down by 60% in SU-DIPG-IV and 85% in SU-DIPG-XIII cell lines with REST shRNA1 (Figure 2A). Similarly, 45% and 53% knockdown efficiencies were noted with both cell lines, respectively for REST shRNA2 (Figure 2A). MTT assays were then performed to study the consequence of REST loss on the growth of SU-DIPG-IV and –XIII cells, in vitro. Growth was measured at 24, 48 and 72-hours post-transduction with control or REST-specific shRNA. As shown in Figure 2B, REST loss decreased cell growth relative to control shRNA expressing cells. This ranged between 76%-63% and 50%-29% for SU-DIPG-IV and -XIII cells, respectively (Figure 2B). These observations suggest that REST is required to sustain DIPG cell growth in vitro.
Figure 2. REST is required for DIPG growth.
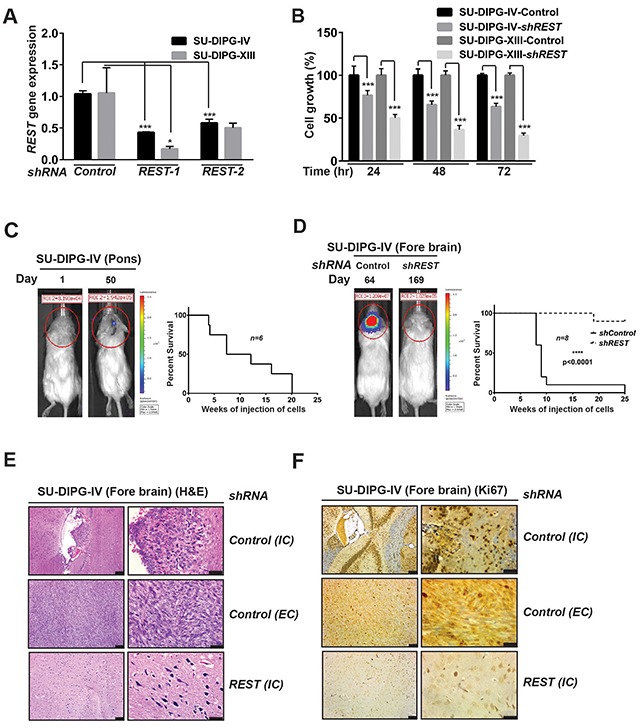
(A) Efficiency of REST knockdown following lentiviral transduction of SU-DIPG-IV and –XIII cells using shRNA against REST or control shRNA was determined by Q-RT-PCR analyses. Significance was found to be ***p<0.001 (SU-DIPG-IV) and *<0.05 (SU-DIPG-XIII). (B) DIPG growth was assessed using MTT assay. SU-DIPG-IV and SU-DIPG-XIII cells transduced with control shRNA or shREST were grown for 24, 48, 72 h, respectively and cell viability was determined by MTT assay at the indicated time points. Significance was found to be ***p<0.001 (SU-DIPG-IV), ***<0.001 (SU-DIPG-XIII). (C) Growth of SU-DIPG-IV- ffluc cells in the pons of NSG mice on day 1 and day 50 after implantation was assessed by bioluminescence imaging after injecting SU-DIPG-IV cells into the pons (n=6) (left panel). A Kaplan Meier survival curve is shown in the right panel. (D) Growth of SU-DIPG-IV-ffluc cells transduced with either control shRNA or REST shRNA into the forebrain of mice (n=8) was monitored by bioluminescence imaging (left panel). Kaplan Meier curves were generated to demonstrate a significant (p<0.0001) difference in survival between the 2 cohorts of mice. (E) H&E staining was performed to show the presence of robust intracranial (IC) and extracranial (EC) tumors in mice receiving injections of SU-DIPG-IV-ffluc cells transduced with control shRNA and sparser IC tumors in mice implanted with SU-DIPG-IV-ffluc cells transduced with REST shRNA. (F) IHC to measure Ki67 staining in tumors described in E. Scale bars in E & F, 50μm (left panel); 20μm (right panel).
The requirement for REST in maintaining DIPG growth in vivo was examined in a mouse xenograft mouse model of DIPG. First, the ability of SU-DIPG-IV cells to grow in the pons of immunodeficient NOD scid gamma (NSG) mice was examined by stereotactic implantation of stably expressing firefly luciferase (ffluc) cells in mouse pons. Tumor growth was monitored by bioluminescence imaging (BLI) once a week. As shown in the representative image in Figure 2C (left panel), BLI signal was detected 50 days after orthotopic implantation of SU-DIPG-IV cells. Kaplan Meier analysis showed that all mice (n=6) succumbed to tumors by 20 weeks (Figure 2C, right panel). The effect of REST loss on tumorigenesis was studied through injection of REST-shRNA1 or control shRNA-expressing cells into the forebrain [54]. Whereas 100% of animals (n=8 each) receiving injections of control shRNA expressing SU-DIPG-IV cells died within 7-24 weeks, bioluminescent signal was not observed in animals that were implanted with cells expressing REST-shRNA1 even after 169 days (Figure 2D, left panel, data not shown). However, one mouse in the latter group died as shown in Figure 2D (right panel). Gross examination of the brains revealed a larger tumor burden in mice implanted with control shRNA expressing SU-DIPG-IV cells compared to mice implanted with SU-DIPG-IV cells expressing REST-shRNA1 (Supplementary Figure 1A). Notably, the former group showed both intracranial (IC) and extracranial (EC) tumors, whereas substantially smaller IC tumors resulted from implantation of cells expressing REST-shRNA1 (Figure 2D). Hematoxylin-eosin (H&E) staining of the brain sections is shown in Figure 2E. Immunostaining of brain sections showed significant Ki67 positivity in EC and IC in control shRNA expressing tumors in contrast to tumors resulting from REST-shRNA1-transduced cells (Figure 2E-2F and Supplementary Figure 1B). These observations indicate that REST is required for DIPG growth in vivo.
REST modulates vasculature in DIPG tumors in vivo, and tube formation in vitro
Interestingly, H&E sections also seemed to suggest REST-dependent increases in tumor vasculature. To further investigate this, SU-DIPG-IV cells were transduced with lentivirus expressing REST shRNA1 or control shRNA and equal number of viable cells were implanted into the forebrain of NSG mice (n=6). Tumors were allowed to grow and mice were sacrificed, their brains harvested and sectioned for IHC staining using CD31 antibody to mark endothelial cells. As seen in Figure 3A, a significant difference in CD31 staining and tumor vasculature was observed between REST shRNA1 and control shRNA expressing intracranial (IC) and extracranial (EC) tumors. The number of vessels were quantitated to arrive at the plot shown in the right panel of Figure 3A (and Supplementary Figure 2A), wherein a significant decrease in the number of blood vessels was observed in REST shRNA1-expressing tumors compared to IC and EC tumors in mice implanted with cells expressing control shRNA. Levels of the pro-angiogenic receptor VEGFR2 were also found to parallel CD31 in these tumors (Figure 3B and Supplementary Figure 2B). These results suggested an involvement of REST-in modulation of DIPG vasculature.
Figure 3. REST expression correlates with increase in number of blood vessels.
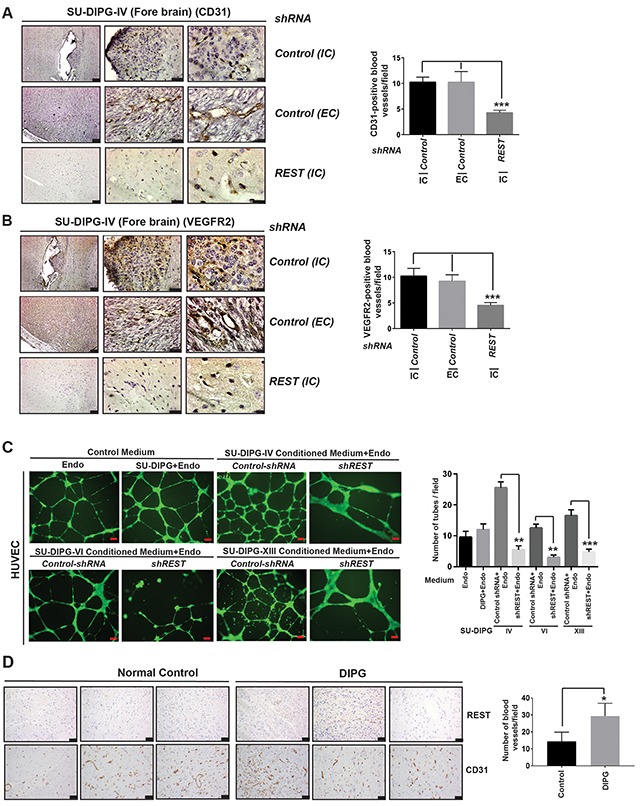
(A) Mice brains bearing tumors of SU-DIPG-IV cells expressing control shRNA (top and middle panel) or shREST (bottom panel) were stained with antibodies against the endothelial marker, CD31 (left panel). IC=intracranial tumors; EC=extra-cranial tumors. Quantitation of CD31-positive blood vessels between REST-expressing and REST-deficient DIPG tumors is shown in the right panel. Data shown is mean +/- SD, ***p<0.001, n=4. (B) The above brains were also stained with anti-VEGFR2 antibody (left panel) and quantification is provided in the right panel. Data shown is mean +/- SD, ***p<0.001; n=4. Scale bars in Figure A and B, 50μm (left panel); 20μm (middle panel) and 5 μm in right panel. (C) In vitro tube assay with human umbilical vein endothelial cells (HUVEC) were performed by culturing cells in endothelial medium alone or with unconditioned DIPG culture medium or endothelial medium with conditioned media from SU-DIPG-IV, -VI and -XIII cells stably transduced with either control shRNA or REST-specific shRNA. Endothelial medium and conditioned medium were used in a 1:1 ratio. Tube formation in matrigel was photographed after 16h (left panel) and quantitated (right panel). Data shown is mean+/- SD, **p<0.01; ***p<0.001, n=4. Scale bar, 100μm. (D) Immunohistochemical analysis (IHC) for REST and CD31 in FFPE DIPG tumor specimens (n=3) and normal controls (n=3) was performed as described in materials and methods. Scale bar, 100μm. Data shown is for CD31 quantification, mean+/- SD, *p<0.05 (right panel). CD31 positive blood vessels were counted in four different areas in each normal or tumor sample. An average number of vessels from 3 normal control and 3 DIPG tumor samples are shown.
In vitro assays were also performed to follow up on the above observations. Tube formation assay is a rapid and quantitative method to study the effects of compounds or conditioned media on formation of blood vessel like tubes in matrigel by endothelial cells [55]. To this end, human umbilical vein endothelial cells (HUVEC) were incubated with the conditioned medium obtained from SU-DIPG-IV, -VI and -XIII cells transduced with lentiviral expressing REST shRNA1 or control shRNA. We observed that HUVEC incubated with conditioned medium from REST-expressing SU-DIPG-IV, -VI and -XIII cells formed significantly higher (2-3 fold) number of tubes in matrigel compared to HUVEC incubated with the medium from DIPG cells with REST expression knocked down (Figure 3C). An increase in HUVEC cell growth was not seen under our experimental conditions, indicating that the conditioned medium from REST-expressing DIPG cells was not due to an effect on HUVEC cell numbers (Supplementary Figure 2B). To establish a correlation between REST levels and vasculature, human DIPG FFPE samples and sections from non-tumor brain stems were subjected to IHC using anti-REST and anti-CD31 antibodies. Two out of three tumor samples were positive for REST staining, whereas REST was absent in normal brain stem samples. Furthermore, a significant increase in the number of blood vessels, as measured by CD31 staining, was seen in DIPG specimens relative to normal controls (Figure 3D, right panel). These observations suggest that the increase in CD31 in DIPGs was tumor specific and dependent on REST, and was not due to normal variations in vasculature in the brain stem.
REST increases GREM-1 secretion
Since VEGFR2 was found to be elevated in DIPG xenograft tumors in vivo, we focused on known ligands for this receptor. Vascular endothelial growth factor (VEGF) is a key ligand for VEGFR2 [56]. We first searched the microarray datasets containing gene expression values for VEGF expression in human DIPG and normal controls as explained in Materials and Methods section. As shown in Supplementary Figure 3A-3C, expression of VEGF isoforms -A, -B and -C was not significantly different between normal controls and DIPG tumors as a group or when sub-grouped based on their H3K27M status. Analyses of conditioned culture medium from SU-DIPG-IV, -VI and –XIII cells using a commercially available human angiogenesis proteome profiler array kit did not reveal VEGF protein in the three cell lines (Supplementary Figure 3D). A second ligand that binds VEGFR2, and one which is known to promote angiogenesis is Gremlin-1 (GREM-1) [57–60]. IHC revealed that SU-DIPG-IV xenografts did indeed express GREM-1 at higher levels compare to tumors from REST-deficient isogenic cells (Figure 4A). GREM-1 gene expression was also detected by Q-RT-PCR in all 3 DIPG lines (Figure 4B), supporting GREM-1 as a candidate downstream effector of REST-mediated pro-angiogenic effect on HUVEC. REST-dependent changes in GREM-1 levels were also measured by ELISA, using conditioned medium from REST-expressing or REST-deficient SU-DIPG-IV cells. A significantly higher level of GREM-1 was detected in media from DIPG cells transduced with control shRNA compared to medium from shREST DIPG cells (Figure 4C). Interestingly, a REST-dependent difference in GREM-1 gene expression was not observed in DIPG patient samples when compared to normal controls, with the exception of a small decrease in DIPG MYCN subgroup with a very limited number of specimens (Figure 4D). These findings suggest that REST may control GREM-1 at the post-transcriptional level.
Figure 4. GREM-1 is secreted by DIPG cells in a REST-dependent manner.
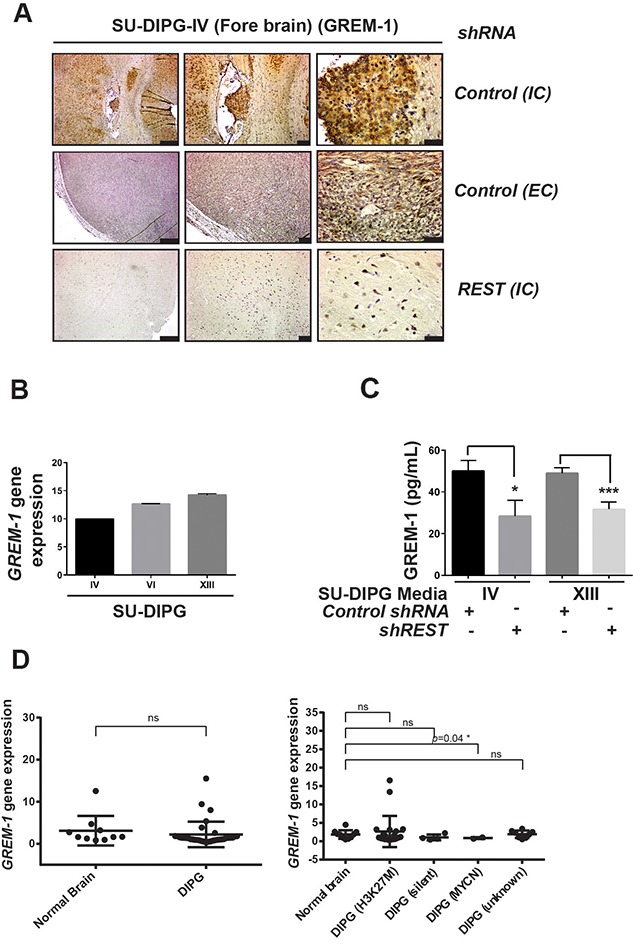
(A) Tumor-bearing brains of mice implanted with SU-DIPG-IV cells stably expressing either control shRNA or REST-specific shRNA were analyzed by IHC for GREM-1 expression. IC=intracranial tumors; EC=extracranial tumors. Scale bars, 200μm (left panel); 50μm (middle panel) and 20 μm in right panel (B) GREM-1 gene expression in SU-DIPG -IV, -VI and –XIII cells were obtained by Q-RT-PCR measurements. GREM-1 expression was normalized to GAPDH. (C) GREM-1 secretion in conditioned medium from SU-DIPG (-IV and -XIII) cells transduced with either control shRNA or REST-specific shRNA was measured by ELISA. GREM-1 levels were expressed as pg/mL. Data shown as mean+/- SD, *p<0.05; **p<0.01; n=3. (D) Gene expression datasets deposited in GEO were retrieved and analyzed for GREM-1 gene expression using GEO2R as described in Materials and Methods. A comparison between normal brain samples (n=10) and DIPG patient samples (n=35) were shown. Each dot corresponds to one individual patient. Bars represent mean with standard deviations. *p<0.05; ns=non-significant.
GREM-1 promotes tube formation and AKT activation in HUVEC and HBMEC
To confirm the effects of GREM-1 on endothelial cells, the gene was knocked down in SU-DIPG-IV cells lentiviral transduction of two different shRNAs against GREM-1 (GREM-1.1 and GREM-1.2). Cells transduced with control shRNA were included for comparison. Efficiency of GREM-1 knockdown was measured by Q-RT-PCR analysis and found to be approximately 85-90% (Figure 5A). As shown in Figure 5B, GREM-1 loss in DIPG cells led to a significant decline in tube formation by HUVEC and HBMEC when compared to that supported by DIPG cells expressing GREM-1 (Figure 5B and 5C). Conversely, addition of recombinant human GREM-1 to conditioned medium from shGREM-1.1 expressing DIPG cells restored tube formation activity of HUVEC and HBMEC (Figure 5B and 5C). As a first step, VEGFR2 protein expression was detected in HUVEC and HBMEC but not in SU-DIPG-IV, -VI and –XIII cells, as measured by Western blotting (Figure 5D). A downstream effect of GREM-1 interaction with its receptor VEGFR2 is activation of AKT signaling [61]. This suggested a paracrine effect of GREM-1 on HUVEC and HBMEC (Figure 5E). Together these findings suggest that REST elevates GREM-1 expression, which influences tube formation by endothelial cells in a paracrine manner (Figure 6).
Figure 5. GREM-1 is required for tube formation in vitro.
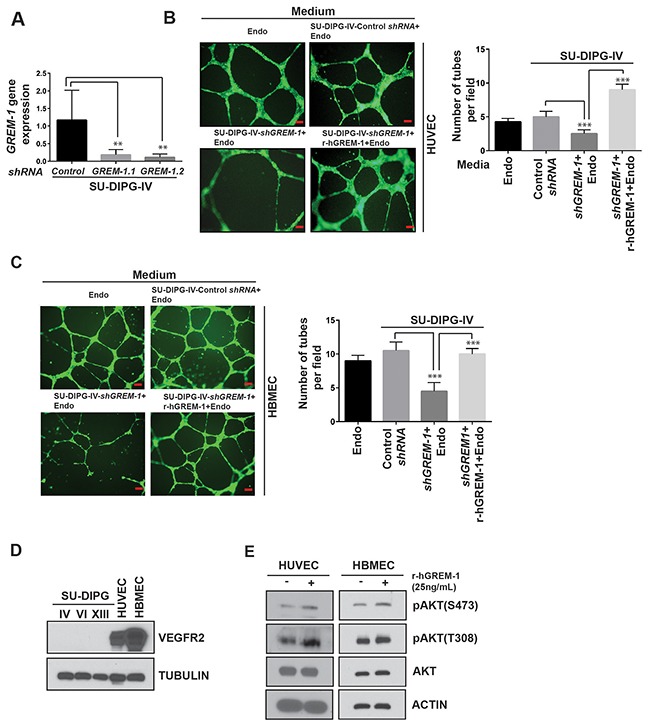
(A) Q-RT-PCR analysis of GREM-1 gene expression in SU-DIPG-IV cells stably expressing either control shRNA or GREM-1-specific shRNA. Lentiviral constructs expressing two different GREM-1 shRNAs (GREM-1.1 and GREM-1.2) were used to knockdown GREM-1. Efficiency of GREM-1 knockdown was determined by Q-RT-PCR and expression was normalized to 18s RNA. Significance is as shown (**p<0.01) (B-C) HUVEC or human brain microvascular endothelial cells (HBMEC) were cultured in endothelial cell medium and or conditioned medium from either control shRNA or shGREM-1.2 transfected SU-DIPG-IV cells. Tube formation in matrigel was measured after 16h and images were obtained. The ability of GREM-1 to rescue loss of tube formation upon REST knockdown was determined by addition of human-recombinant GREM-1 (rGREM-1) to conditioned media-endothelial media mix. Scale bars, 100μm. (C) Quantification of tubes in matrigel shown in Figure B (right panels). Data shown is mean +/- SD, ***p<0.001, n=3. (D) Western blot analysis to assess VEGFR2 levels in SU-DIPG-IV, -VI and –XIII cells, HUVECs and HBMECs was done using anti-VEGFR2 antibodies. Tubulin served as a loading control. (E) Western blot analysis was performed to assess AKT signaling downstream of GREM-1 interaction with its potential receptor VEGFR2 in HUVEC and HBMEC. Anti-pAKT (S473), anti-pAKT (T308), total AKT, and anti-actin were employed.
Figure 6. Model to explain mechanism of REST-mediated control of DIPG vasculature.

A pro-angiogenic molecule Gremlin is secreted by DIPG in a REST-dependent manner. Gremlin interacts with cell surface receptor VEGFR2 present in endothelial cells and causes increased vasculature. In addition, REST also controls DIPG growth.
DISCUSSION
REST is a regulator of neuronal differentiation genes and has been mostly investigated in this context during normal brain development and brain tumors [31, 38, 40, 41, 45, 51, 53]. A recent study also demonstrated a novel role for REST in maintenance of genomic integrity during S phase in normal neural progenitors [33]. Consistent with these observations, REST appears to regulate brain tumor cell proliferation and tumor growth [62–65]. Other reports have implicated REST in the control of glioblastoma cell migration [66]. Aberrant REST expression has been associated with poor outcomes in several neural cancers, likely in part due to poor therapeutic response [50, 67]. These studies have largely focused on cell intrinsic activities influenced by REST. Here, we report both a cell-intrinsic and a cell-extrinsic contribution of REST towards the development of the pediatric brain tumor, DIPG. We show for the first time that a significant number of human DIPGs had elevated REST gene expression, particularly so in the H3K27M-positive samples. Additionally, 20% of human DIPGs express REST protein at elevated levels compared to normal controls. Although control tissues were obtained from “normal” areas distal to the tumor, DIPG is a diffusively infiltrative tumor and there certainly existed a possibility that stronger REST expression seen in our normal controls may be from invasive tumor cells. In effect, we may have underestimated the number of tumor samples with REST protein elevation. That this may indeed be the case is suggested by our observation that REST analyses of tumor samples we found that REST expression is extremely low to absent in control brain stem sections obtained from patients that did not have a brain tumor. Consistent with data from other neural tumors such as medulloblastoma, neuroblastoma and glioblastoma multiforme, REST is also required for maintenance of DIPG growth in vitro and in vivo [31, 34, 50]. Although, mechanisms remain to be uncovered, REST is known to control the expression of molecules involved in regulating cell proliferation such as p27 and USP37 [62, 63]. Another important area of investigation that needs to be followed up in the future centers around the possibility that REST activity in concert with histone H3K27 methylation may modulate the expression of target genes involved in development and lineage specification. Support for the above comes from published data which have shown an interaction between REST and polycomb repressive complex-2 (PRC2) [68, 69]. For example, co-recruitment of REST-co-REST-LSD1 and PRC2 to regulatory regions of bivalent genes through the long-noncoding RNA, HOTAIR, is thought to promote gene repression [68]. Yet other groups have shown a mutually exclusive occupancy of REST and PRC2 at consensus REST binding sites, known as RE1 motifs, located near CpG islands of genes [69]. Here, REST expression would prevent PRC2 occupancy leading to a reduction in histone H3K27 trimethylation and consequent gene activation, whereas its loss would promote PRC2 binding, an increase in histone H3K27 trimethylation and silencing of target gene expression. Whether this relates to the variable correlation between DNA methylation status and histone H3K27 trimethylation at some genes but not others in H3K27M mutated DIPG cells, remains to be examined [70, 71].
Of additional interest is our finding that REST enhances DIPG vasculature. Magnetic resonance imaging (MRI) studies in DIPGs have shown that the average cerebral blood volumes in areas of occult enhancement are significantly higher than non-enhancing areas of the same tumor, raising the possibility that tumor development is accompanied by an increase in angiogenesis [72]. This study is the first to formally validate this observation in animal models of DIPG. It is also consistent with a previously described role for REST in modulating the vasculature in Ewing's sarcoma [49].
Angiogenesis, a process of sprouting of blood vessels from existing ones, is determined by a balance between pro-angiogenic factors and angiogenesis inhibitors [73–75]. Members of the vascular endothelial growth factor (VEGF) and fibroblast growth factor (FGF) family are well-studied inducers of angiogenesis [76–80]. Surprisingly, there were no significant differences in VEGF mRNA between normal controls and DIPG, and VEGF-C protein was not secreted by DIPG cells. However, GREM-1, a glycoprotein and member of the Dan family of cysteine knot-secreted proteins was found to be secreted by the three DIPG cell lines studied [81]. GREM-1 is a strong antagonist of signaling through bone morphogenic protein (BMP), a pathway that is believed to play an important role in DIPG development [82]. Although a number of studies on GREM-1 have examined its function in the control of patterning during embryonic development and regulation of early limb, lung, kidney and bone development, increased GREM-1 expression has also been described in various cancers including lung, kidney, ovary, breast, colon and pancreatic cancers [83–86]. GREM-1 expression in the normal neuronal and astrocytic compartments and its interaction with SLIT, a family of axonal guidance proteins, has been shown to control chemotaxis of monocytes in the brain [87, 88]. In glial-tumors such as GBM, GREM-1 overexpression in the cancer stem cells (CSCs) compartment was found to be necessary to maintain tumor cell growth in vitro and in vivo [89, 90]. GREM-1 overexpression in glioma cell lines also promoted epithelial to mesenchymal transition (EMT) through upregulated expression of E-Cadherin and BMP7, and activation of TGF-β signaling through engagement of BMP receptors I and II [89]. Of specific relevance to observations in our study is the fact that GREM-1 is an agonist of vascular endothelial growth factor receptor, VEGFR2 [57]. Its interaction with VEGFR2 is known to control angiogenesis by promoting migration of endothelial cells [81]. This is consistent with our findings that ectopic GREM-1 expression does not affect endothelial cell growth, but does enhance tube formation in vitro. Expression of VEGFR2 in HUVEC and HBMEC in vitro and in the DIPG tumor vasculature in vivo also supports the possibility that GREM-1 acting through VEGFR2 may modulate DIPG angiogenesis (Figure 6). However, we cannot rule out additional roles for GREM-1 in DIPG development such as promoting EMT or immunomodulation, which has been described in other tumors [88, 91].
The molecular mechanisms underlying REST-dependent upregulation of GREM-1 is a subject of ongoing investigation. REST is associated with a number of chromatin remodeling enzymes, whose activity can be inhibited by drugs that are currently in use in the clinic or are being investigated in pre-clinical studies [5, 92–94]. These agents may have applications in the treatment of REST-expressing DIPGs in the future. Finally, our results also suggest that the efficacy of VEGF inhibitors targeting VEGF alone against these tumors may be limited and potential trials considering their use to target DIPG vasculature may have need to be re-evaluated [95]. Prophylactic anti-Gremlin antibodies have shown promise in pulmonary arterial hypertension in mice, which may support its examination either alone or in combination studies in animal models of DIPG [96].
MATERIALS AND METHODS
Analyses of DIPG samples
Immunohistochemical analyses of normal and tumor samples were performed by Dr. Veena Rajaram following Institutional Review Board (IRB) approval. Paraffin-embedded brain sections were immunohistochemically stained by hematoxylin eosin (H&E), and REST protein expression was analyzed using anti-REST antibody (Cat# IHC-00141; Bethyl, Montgomery, TX; 1:100 dilution) followed by DAB staining (Vector laboratories, Burlingame, CA). Slides were evaluated for REST levels by neuropathologist utilizing a 5-point grading scale as described in Figure 1A.
Cell culture
SU-DIPG cell lines (IV, VI and XIII) were grown under conditions previously described [5]. 293T cells were grown in DMEM medium in the absence of serum. Human Umbilical Vein Endothelial Cells (HUVEC; Cat# CC2519) and EGM-2 bullet kit (endothelial basal media and growth factors; Cat# CC3162) were purchased from Lonza (Allendale, NJ) and were cultured according to manufacturer's recommendations. Human Brain Microvascular Endothelial Cells (HBMEC; Cat# HEC02) and Endo-Growth medium were purchased from Neuromics (Edina, MN) and cultured in complete Endo-Growth medium (Cat# MED001) in combination with EGM-2 media (1:4 ratio).
Lentivirus production and transduction
293T cells were transfected with lentiviral constructs expressing GFP and shRNAs against REST or GREM-1 were purchased from M.D. Anderson Cancer Center (MDACC) Core facility (shRNA and ORF-eome Core) and co-transfected with plasmids pax2 and MD2 (for packaging) using OptiMEM®I and Lipofectamine® 2000 Reagent (Cat# 31985-062 and 11668-019, Thermo-Fisher Scientific, Waltham, MA) according to protocols from MDACC Core facility. Lentiviral particles were harvested 48 hours after transfection by filtering supernatant using a 70μm syringe filter and spinning filtered medium at 1,500 RPM for 5 minutes. Transduction of SU-DIPG cell lines was done by incubating cells with shRNA-expressing lentivirus for 72 hours, and then flow sorted for GFP positive DIPG cells at the MDACC Cell Sorting Core facility. Knockdown of REST or GREM-1 was confirmed by Q-RT-PCR. For in vivo experiments, GFP positive REST-knockdown SU-DIPG-IV cells were transduced with firefly luciferase co-expressing Mkate lentivirus and sorted for mKate. These cells were injected into NSG mice to develop tumors. Nucleotide sequences for shRNAs purchased from the shRNA and ORF-eome Core at MDACC are as follows.
shREST-1: 5’-TTGAAGTTGCTTCTATCTG-3’;
shREST-2: 5’-TTTGAACTGTAAATATCTG-3’,
shGREM-1.1: 5’-AGATTCTTACTTGGCTTAA-3’;
shGREM-1.2: 5’-ACCATGATGGTCACACTCA-3’
Control shRNA: 5’-ATCTCGCTTGGGCGAGA GT-3’.
Q-RT-PCR
RNA was isolated from cells using Zymo Research Quick-RNATM MiniPrep Kit (Cat# 11-328; Genesee Scientific, San Diego, CA 11-328) and resuspended in water. RNA was quantified using NanoDrop 1000 (Thermos Fisher Scientific, Wilmington, DE). At least 300ng of RNA from each sample was reverse-transcribed using the Bio-Rad iScriptTM cDNA Synthesis Kit (Cat# 170-8891; Bio-Rad, Hercules, CA). Reverse transcription was completed on the Bio-Rad T100 Thermal Cycler (Bio-Rad, Hercules, CA). qPCR was performed on the Roche LightCycler® 96 using Roche LightCycler® 480 SYBR Green I Master mix (Cat# 04707516001; Roche, Indianapolis, IN) and 0.5μL of 10mM each primer. Relative mRNA expression after normalizing to GAPDH or 18s was determined by the comparative 2-ΔΔCT method [97]. Primer sequences are as below.
| Primer Name | Primer Sequence |
|---|---|
| Human REST-Forward | 5’-GGCAGCTGCTGTGATTACCT-3’ |
| Human REST-Reverse | 5’-AGTTGTTATCCCCAACCGGC-3’ |
| Human GREM-1-Forward | 5’-GCCAGACAAGGCCCAGCACAATGAC-3’ |
| Human GREM-1-Reverse | 5’-GGTATTTGCGCTCCGTCACATG-3’ |
| Human GAPDH-Forward | 5’-CGCTCTCTGCTCCTCCTGTT-3’ |
| Human GAPDH-Reverse | 5’-CCATGGTGTCTGAGCGATGT-3’ |
| Human 18s-Forward | 5’-CGGCGACGACCCATTCGAAC-3’ |
| Human 18s-Reverse | 5’-GAATCGAACCCTGATTCCCCGTC-3’ |
MTT assay
SU-DIPG-IV and /or SU-DIPG-XIII cells were plated in a 96-well plate at a density of 6,000 cells/well in 100μL complete media. At various times (24, 48 or 72h) after lentiviral transduction with control shRNA or REST-shRNA, 50μL of media was decanted, and 25ng of 98% Thiazolyl Blue Tetrazolium Bromide (MTT) (Cat# M2128-1G; Sigma, St. Louis, MO) was added. Cells were incubated for 2-4 hours before 100 μl of DMSO was added to each well and triturated to uniformly suspend the MTT precipitate. Plates were read for absorbance (570/650 nm) with a SPECTRAmax®PLUS384 Microplate Spectrophotometer (Molecular Devices, Sunnyvale, CA).
In vivo assays
All animal experiments and procedures were approved by the Institutional Animal Care and Use Committee (IACUC). SU-DIPG cells were injected into the pons or forebrain of 4-6 month old NOD scid gamma null (NSG; NOD.Cg-Prkdcscid Il2rgtm1Wjl/SzJ JAX) mice (The Jackson Laboratory, Bar Harbor, ME) [54]. SU-DIPG-IV stably expressing firefly luciferase (ffluc) were suspended in sterile PBS prior to employing a sterile field for injection of either 1 million SU-DIPG-IV-ffluc into the pons (1mm posterior to lamboid suture, 1mm lateral to midline, 5mm below skull surface) or 500,000 SU-DIPG-IV-ffluc into the forebrain (1.5mm anterior to lamboid, 2.5mm right of midline, 2mm deep), using a Harvard Apparatus (Holliston, MA) and 26 guage gas tight Hamilton syringe. Mice were anesthetized using 2-4% inhalant isoflurane prior to the surgical procedure. Bioluminescent imaging of DIPG tumors was performed using the Caliper LifeSciences IVIS Spectrum IVIS200 in vivo imaging system (Hopkinton, MA). Mice were injected with 150mg/kg with D-Luciferin (Cat# E1605; Promega Corporation, Madison, WI) through an intraperitoneal (IP) route, and sacrificed upon onset of clinical signs or signs of solid tumors formed in the brain and grown through skull. Brains were collected and sectioned for IHC analysis.
Immunohistochemistry
Mice brain tissues were fixed in 10% neutral buffered formalin and embedded in paraffin blocks. 4-μm-thick brain sections were cut and used for immunohistochemical (IHC) analysis. After deparafinization and rehydration, heat-mediated antigen retrieval and blocking, sections were incubated with primary antibodies to REST (Cat# IHC-00141; Bethyl, Montgomery, TX), CD31 (Cat# ab28364; Abcam, Cambridge, MA), VEGFR2 (Cat# 2479; Cell Signaling Technology, Danvers, MA), Ki67 (Cat# AB9260; Millipore, Billerica, MA), and Gremlin-1 (Cat# PA5-13123; Thermo-Fisher Scientific, Waltham, MA) at 4°C overnight. After washing, sections were incubated with secondary antibody conjugated to horse radish peroxidase (Cat# 111-035-003 and Cat# 115-035-003; Jackson ImmunoResearch Labs, West Grove, PA) for 2 h at room temperature. All incubations were performed under humidified conditions. After washing, slides were developed using 3,3′-diaminobenzidine substrate (DAB; Cat# Vector Laboratories, Burlingame, CA), counterstained with hematoxylin, dehydrated, mounted and visualized under a microscope (Nikon ECLIPSE E200; Melville, NY). Images were obtained using an Olympus SC100 camera (Waltham, MA) attached to the microscope. Images were processed using CellSens Entry microscopy imaging software (Olympus Life Sciences, Waltham, MA).
In vitro angiogenesis assay
In vitro angiogenesis assay (tube formation assay) was performed as described previously [98]. Briefly, Matrigel (Cat# 354230; Thermo Fisher Scientific, Waltham, MA; 100 μl/well) was placed in 96 well sterile culture plates. HUVEC or HBMEC (5 × 10⁴ cells per 25μL) mixed in conditioned medium from DIPG or plain DIPG medium (1:1 ratio) were placed on top of the matrigel and incubated in a CO2 incubator at 37°C. After 16 h, cells were stained with Calcein-AM (Cat# C3100MP; Thermo Fisher Scientific, Waltham, MA) for 30 min, rinsed with the endothelial cell medium. Tube formation in matrigel was visualized under a fluorescence microscope (Nikon Eclipse Ti-E, Melville, NY) and images were taken with a camera (Andor, Zyla, Concord, MA) attached to the microscope. Image analysis and quantification was done using NIS elements AR software (Nikon, Melville, NY).
Western blot analysis
Cell lysates were prepared by lysing DIPG cells or HUVEC or HBMEC in EBC lysis buffer (50 mM Tris, pH 8.0, 120 mM NaCl, and 0.5% NP-40) supplemented with protease inhibitors (Thermo Fisher Scientific, Waltham, MA) and phosphatase inhibitor cocktail-2 (Sigma, St. Louis, MO). Lysates were clarified and protein concentration in supernatants was measured using Bio-Rad protein assay dye reagent (Bio-Rad Laboratories, Hercules, CA). Samples were then subjected to SDS-PAGE and Western blot analyses with the following primary antibodies: REST (Cat# 07579; Millipore, Billerica, MA), pAKTSer473 (Cat# 9271, Cell Signaling Technology (CST), Danvers, MA) p-AKTT308, (Cat# 5106; CST, Danvers, MA), AKT (Cat# 9272; CST, Danvers, MA), VEGFR2 (Cat# 2479; CST, Danvers, MA) and Tubulin-HRP (Cat# ab40742; Abcam, Cambridge, MA). After washing and incubation with the corresponding HRP-conjugated secondary antibodies (Jackson Immuno Research, West Grove, PA), membranes were developed using SuperSignal (Cat# 34075; Cat#34087; Thermo-Scientific, Waltham, MA) followed by autoradiography.
Human angiogenesis proteome profiler assay
Proteome profiler human angiogenesis array kit (Cat# ARY007, R&D Systems Minneapolis, MN) was used to measure expression of 55 angiogenesis related proteins including VEGF-C. Conditioned media from SU-DIPG (-IV, -VI and -XIII) cells were collected for the assay as per manufacture's conditions.
ELISA
GREM-1 levels in DIPG conditioned medium were quantified using a ELISA kit according to manufacturer's recommendations (Neo BioLab, Woburn, MA).
GEO2R analysis
Microarray datasets containing the gene expression values of diffuse intrinsic pontine glioma (DIPG) patients were obtained from Gene Expression Omnibus (www.ncbi.nlm.nih.gov/geo). We used GSE50025 dataset which contained Illumina HT-12 V4 BeadChip Array profiling of 35 DIPG samples and 10 normal brain controls [16] to evaluate gene expression. The data were analyzed through the GEO2R interface (http://www.ncbi.nlm.nih.gov/geo/geo2r/) as previously described [99]. Microarray data were normalized in Partek Genomics Suite v6.6 using per-probe median-centered quantile normalization. p-values for comparisons between sample groups were obtained using the unpaired t-test with Welch's correction.
Statistical analysis
Experimental data reported was Mean ± SD of a minimum of 3 samples. A P value of < 0.05 was considered to be statistically significant. Student's t test was performed for significance between groups. GraphPad Prism version 6.01 for Windows (GraphPad Software, San Diego, CA) was used to generate graphs.
SUPPLEMENTARY MATERIALS FIGURES
Acknowledgments
The authors thank Dr. Michelle Monje, Stanford University, Stanford, CA for providing human SU-DIPG cell lines.
Abbreviations
- DIPG
Diffuse Intrinsic Pontine Glioma
- REST
RE1 Silencing Transcription Factor
- GREM-1
Gremlin 1
- VEGFR2
Vascular Endothelial Growth Factor Receptor-2
- HUVEC
Human Umbilical Vein Endothelial Cells
- HBMEC
Human Brain Microvascular Endothelial Cells
- BLI
Bioluminescence Imaging
- ffluc
firefly luciferase
- NSG
Nod Skid Gamma
- IC
Intracranial
- EC
Extracranial
- FFPE
Formalin-Fixed, Paraffin-Embedded.
Footnotes
Author contributions
SS, BK and SM were involved in conceptualization and performance of in vitro and in vivo experiments, data analysis and generation of manuscript. KS, YY and KC were involved in experimental design, execution of experiments and analyses. RL, SG, JN, VR, JF & VG were involved in study supervision, experimental design, data analysis, review of pathology, and writing of manuscript.
CONFLICTS OF INTEREST
The authors declare no conflicts of interest.
FUNDING
This work was supported by grants from the National Institutes of Health (NIH-Grant# 5R01-NS-079715-01) to VG and Hyundai Hope on Wheels Research Award to JF and VG.
REFERENCES
- 1.Vanan MI, Eisenstat DD. DIPG in children - what can we learn from the past? Front Oncol. 2015;5:237. doi: 10.3389/fonc.2015.00237. https://doi.org/10.3389/fonc.2015.00237 [DOI] [PMC free article] [PubMed] [Google Scholar]
- 2.Steffen-Smith EA, Baker EH, Venzon D, Shandilya S, Bent RS, Warren KE. Measurements of the pons as a biomarker of progression for pediatric DIPG. J Neurooncol. 2014;116:127–33. doi: 10.1007/s11060-013-1266-4. https://doi.org/10.1007/s11060-013-1266-4 [DOI] [PMC free article] [PubMed] [Google Scholar]
- 3.Warren KE. Diffuse intrinsic pontine glioma: poised for progress. Front Oncol. 2012;2:205. doi: 10.3389/fonc.2012.00205. https://doi.org/10.3389/fonc.2012.00205 [DOI] [PMC free article] [PubMed] [Google Scholar]
- 4.Donaldson SS, Laningham F, Fisher PG. Advances toward an understanding of brainstem gliomas. J Clin Oncol. 2006;24:1266–72. doi: 10.1200/JCO.2005.04.6599. https://doi.org/10.1200/JCO.2005.04.6599 [DOI] [PubMed] [Google Scholar]
- 5.Grasso CS, Tang Y, Truffaux N, Berlow NE, Liu L, Debily MA, Quist MJ, Davis LE, Huang EC, Woo PJ, Ponnuswami A, Chen S, Johung TB, et al. Functionally defined therapeutic targets in diffuse intrinsic pontine glioma. Nat Med. 2015;21:555–9. doi: 10.1038/nm.3855. https://doi.org/10.1038/nm.3855 [DOI] [PMC free article] [PubMed] [Google Scholar]
- 6.Hashizume R. Epigenetic targeted therapy for diffuse intrinsic pontine glioma. Neurol Med Chir (Tokyo) 2017;57:331–42. doi: 10.2176/nmc.ra.2017-0018. https://doi.org/10.2176/nmc.ra.2017-0018 [DOI] [PMC free article] [PubMed] [Google Scholar]
- 7.Zhai GG, Malhotra R, Delaney M, Latham D, Nestler U, Zhang M, Mukherjee N, Song Q, Robe P, Chakravarti A. Radiation enhances the invasive potential of primary glioblastoma cells via activation of the Rho signaling pathway. J Neurooncol. 2006;76:227–37. doi: 10.1007/s11060-005-6499-4. https://doi.org/10.1007/s11060-005-6499-4 [DOI] [PubMed] [Google Scholar]
- 8.Freese C, Takiar V, Fouladi M, DeWire M, Breneman J, Pater L. Radiation and subsequent reirradiation outcomes in the treatment of diffuse intrinsic pontine glioma and a systematic review of the reirradiation literature. Pract Radiat Oncol. 2017;7:86–92. doi: 10.1016/j.prro.2016.11.005. https://doi.org/10.1016/j.prro.2016.11.005 [DOI] [PubMed] [Google Scholar]
- 9.King AR, Corso CD, Chen EM, Song E, Bongiorni P, Chen Z, Sundaram RK, Bindra RS, Saltzman WM. Local DNA repair inhibition for sustained radiosensitization of high-grade gliomas. Mol Cancer Ther. 2017 doi: 10.1158/1535-7163.MCT-16-0788. https://doi.org/10.1158/1535-7163.MCT-16-0788 [DOI] [PMC free article] [PubMed]
- 10.Miyahara H, Yadavilli S, Natsumeda M, Rubens JA, Rodgers L, Kambhampati M, Taylor IC, Kaur H, Asnaghi L, Eberhart CG, Warren KE, Nazarian J, Raabe EH. The dual mTOR kinase inhibitor TAK228 inhibits tumorigenicity and enhances radiosensitization in diffuse intrinsic pontine glioma. Cancer Lett. 2017;400:110–6. doi: 10.1016/j.canlet.2017.04.019. https://doi.org/10.1016/j.canlet.2017.04.019 [DOI] [PMC free article] [PubMed] [Google Scholar]
- 11.Lin GL, Monje M. A Protocol for rapid post-mortem cell culture of diffuse intrinsic pontine glioma (DIPG) J Vis Exp. 2017 doi: 10.3791/55360. https://doi.org/10.3791/55360 [DOI] [PMC free article] [PubMed]
- 12.Jones C, Karajannis MA, Jones DTW, Kieran MW, Monje M, Baker SJ, Becher OJ, Cho YJ, Gupta N, Hawkins C, Hargrave D, Haas-Kogan DA, Jabado N, et al. Pediatric high-grade glioma: biologically and clinically in need of new thinking. Neuro Oncol. 2017;19:153–61. doi: 10.1093/neuonc/now101. https://doi.org/10.1093/neuonc/now101 [DOI] [PMC free article] [PubMed] [Google Scholar]
- 13.Baker SJ, Ellison DW, Gutmann DH. Pediatric gliomas as neurodevelopmental disorders. Glia. 2016;64:879–95. doi: 10.1002/glia.22945. https://doi.org/10.1002/glia.22945 [DOI] [PMC free article] [PubMed] [Google Scholar]
- 14.Wu G, Diaz AK, Paugh BS, Rankin SL, Ju B, Li Y, Zhu X, Qu C, Chen X, Zhang J, Easton J, Edmonson M, Ma X, et al. The genomic landscape of diffuse intrinsic pontine glioma and pediatric non-brainstem high-grade glioma. Nat Genet. 2014;46:444–50. doi: 10.1038/ng.2938. https://doi.org/10.1038/ng.2938 [DOI] [PMC free article] [PubMed] [Google Scholar]
- 15.Huether R, Dong L, Chen X, Wu G, Parker M, Wei L, Ma J, Edmonson MN, Hedlund EK, Rusch MC, Shurtleff SA, Mulder HL, Boggs K, et al. The landscape of somatic mutations in epigenetic regulators across 1,000 paediatric cancer genomes. Nat Commun. 2014;5:3630. doi: 10.1038/ncomms4630. https://doi.org/10.1038/ncomms4630 [DOI] [PMC free article] [PubMed] [Google Scholar]
- 16.Buczkowicz P, Hoeman C, Rakopoulos P, Pajovic S, Letourneau L, Dzamba M, Morrison A, Lewis P, Bouffet E, Bartels U, Zuccaro J, Agnihotri S, Ryall S, et al. Genomic analysis of diffuse intrinsic pontine gliomas identifies three molecular subgroups and recurrent activating ACVR1 mutations. Nat Genet. 2014;46:451–6. doi: 10.1038/ng.2936. https://doi.org/10.1038/ng.2936 [DOI] [PMC free article] [PubMed] [Google Scholar]
- 17.Paugh BS, Zhu X, Qu C, Endersby R, Diaz AK, Zhang J, Bax DA, Carvalho D, Reis RM, Onar-Thomas A, Broniscer A, Wetmore C, Zhang J, et al. Novel oncogenic PDGFRA mutations in pediatric high-grade gliomas. Cancer Res. 2013;73:6219–29. doi: 10.1158/0008-5472.CAN-13-1491. https://doi.org/10.1158/0008-5472.CAN-13-1491 [DOI] [PMC free article] [PubMed] [Google Scholar]
- 18.Lewis PW, Allis CD. Poisoning the “histone code” in pediatric gliomagenesis. Cell Cycle. 2013;12:3241–2. doi: 10.4161/cc.26356. https://doi.org/10.4161/cc.26356 [DOI] [PMC free article] [PubMed] [Google Scholar]
- 19.Louis DN, Perry A, Reifenberger G, von Deimling A, Figarella-Branger D, Cavenee WK, Ohgaki H, Wiestler OD, Kleihues P, Ellison DW. The 2016 world health organization classification of tumors of the central nervous system: a summary. Acta Neuropathol. 2016;131:803–20. doi: 10.1007/s00401-016-1545-1. https://doi.org/10.1007/s00401-016-1545-1 [DOI] [PubMed] [Google Scholar]
- 20.Cohen KJ, Jabado N, Grill J. Diffuse intrinsic pontine gliomas-current management and new biologic insights. Is there a glimmer of hope? Neuro Oncol. 2017 doi: 10.1093/neuonc/nox021. https://doi.org/10.1093/neuonc/nox021 [DOI] [PMC free article] [PubMed]
- 21.Funato K, Major T, Lewis PW, Allis CD, Tabar V. Use of human embryonic stem cells to model pediatric gliomas with H3.3K27M histone mutation. Science. 2014;346:1529–33. doi: 10.1126/science.1253799. https://doi.org/10.1126/science.1253799 [DOI] [PMC free article] [PubMed] [Google Scholar]
- 22.Nagaraja S, Vitanza NA, Woo PJ, Taylor KR, Liu F, Zhang L, Li M, Meng W, Ponnuswami A, Sun W, Ma J, Hulleman E, Swigut T, et al. Transcriptional dependencies in diffuse intrinsic pontine glioma. Cancer Cell. 2017;31:635–52 e6. doi: 10.1016/j.ccell.2017.03.011. https://doi.org/10.1016/j.ccell.2017.03.011 [DOI] [PMC free article] [PubMed] [Google Scholar]
- 23.Mohammad F, Weissmann S, Leblanc B, Pandey DP, Hojfeldt JW, Comet I, Zheng C, Johansen JV, Rapin N, Porse BT, Tvardovskiy A, Jensen ON, Olaciregui NG, et al. EZH2 is a potential therapeutic target for H3K27M-mutant pediatric gliomas. Nat Med. 2017;23:483–92. doi: 10.1038/nm.4293. https://doi.org/10.1038/nm.4293 [DOI] [PubMed] [Google Scholar]
- 24.Piunti A, Hashizume R, Morgan MA, Bartom ET, Horbinski CM, Marshall SA, Rendleman EJ, Ma Q, Takahashi YH, Woodfin AR, Misharin AV, Abshiru NA, Lulla RR, et al. Therapeutic targeting of polycomb and BET bromodomain proteins in diffuse intrinsic pontine gliomas. Nat Med. 2017;23:493–500. doi: 10.1038/nm.4296. https://doi.org/10.1038/nm.4296 [DOI] [PMC free article] [PubMed] [Google Scholar]
- 25.Nikbakht H, Panditharatna E, Mikael LG, Li R, Gayden T, Osmond M, Ho CY, Kambhampati M, Hwang EI, Faury D, Siu A, Papillon-Cavanagh S, Bechet D, et al. Spatial and temporal homogeneity of driver mutations in diffuse intrinsic pontine glioma. Nat Commun. 2016;7:11185. doi: 10.1038/ncomms11185. https://doi.org/10.1038/ncomms11185 [DOI] [PMC free article] [PubMed] [Google Scholar]
- 26.Cordero FJ, Huang Z, Grenier C, He X, Hu G, McLendon RE, Murphy SK, Hashizume R, Becher OJ. Histone H3.3K27M represses p16 to accelerate gliomagenesis in a murine model of DIPG. Mol Cancer Res. 2017 doi: 10.1158/1541-7786.MCR-16-0389. https://doi.org/10.1158/1541-7786.MCR-16-0389 [DOI] [PMC free article] [PubMed]
- 27.Taylor KR, Vinci M, Bullock AN, Jones C. ACVR1 mutations in DIPG: lessons learned from FOP. Cancer Res. 2014;74:4565–70. doi: 10.1158/0008-5472.CAN-14-1298. https://doi.org/10.1158/0008-5472.CAN-14-1298 [DOI] [PMC free article] [PubMed] [Google Scholar]
- 28.Kleiblova P, Shaltiel IA, Benada J, Sevcik J, Pechackova S, Pohlreich P, Voest EE, Dundr P, Bartek J, Kleibl Z, Medema RH, Macurek L. Gain-of-function mutations of PPM1D/Wip1 impair the p53-dependent G1 checkpoint. J Cell Biol. 2013;201:511–21. doi: 10.1083/jcb.201210031. https://doi.org/10.1083/jcb.201210031 [DOI] [PMC free article] [PubMed] [Google Scholar]
- 29.Puget S, Philippe C, Bax DA, Job B, Varlet P, Junier MP, Andreiuolo F, Carvalho D, Reis R, Guerrini-Rousseau L, Roujeau T, Dessen P, Richon C, et al. Mesenchymal transition and PDGFRA amplification/mutation are key distinct oncogenic events in pediatric diffuse intrinsic pontine gliomas. PLoS One. 2012;7:e30313. doi: 10.1371/journal.pone.0030313. https://doi.org/10.1371/journal.pone.0030313 [DOI] [PMC free article] [PubMed] [Google Scholar]
- 30.Wu YL, Maachani UB, Schweitzer M, Singh R, Wang M, Chang R, Souweidane MM. Dual inhibition of PI3K/AKT and MEK/ERK pathways induces synergistic antitumor effects in diffuse intrinsic pontine glioma cells. Transl Oncol. 2017;10:221–8. doi: 10.1016/j.tranon.2016.12.008. https://doi.org/10.1016/j.tranon.2016.12.008 [DOI] [PMC free article] [PubMed] [Google Scholar]
- 31.Su X, Gopalakrishnan V, Stearns D, Aldape K, Lang FF, Fuller G, Snyder E, Eberhart CG, Majumder S. Abnormal expression of REST/NRSF and Myc in neural stem/progenitor cells causes cerebellar tumors by blocking neuronal differentiation. Mol Cell Biol. 2006;26:1666–78. doi: 10.1128/MCB.26.5.1666-1678.2006. https://doi.org/10.1128/MCB.26.5.1666-1678.2006 [DOI] [PMC free article] [PubMed] [Google Scholar]
- 32.Monaghan CE, Nechiporuk T, Jeng S, McWeeney SK, Wang J, Rosenfeld MG, Mandel G. REST corepressors RCOR1 and RCOR2 and the repressor INSM1 regulate the proliferation-differentiation balance in the developing brain. Proc Natl Acad Sci USA. 2017;114:E406–E15. doi: 10.1073/pnas.1620230114. https://doi.org/10.1073/pnas.1620230114 [DOI] [PMC free article] [PubMed] [Google Scholar]
- 33.Nechiporuk T, McGann J, Mullendorff K, Hsieh J, Wurst W, Floss T, Mandel G. The REST remodeling complex protects genomic integrity during embryonic neurogenesis. Elife. 2016;5:e09584. doi: 10.7554/eLife.09584. https://doi.org/10.7554/eLife.09584 [DOI] [PMC free article] [PubMed] [Google Scholar]
- 34.Huang Z, Bao S. Ubiquitination and deubiquitination of REST and its roles in cancers. FEBS Lett. 2012;586:1602–5. doi: 10.1016/j.febslet.2012.04.052. https://doi.org/10.1016/j.febslet.2012.04.052 [DOI] [PMC free article] [PubMed] [Google Scholar]
- 35.Schoenherr CJ, Anderson DJ. The neuron-restrictive silencer factor (NRSF): a coordinate repressor of multiple neuron-specific genes. Science. 1995;267:1360–3. doi: 10.1126/science.7871435. [DOI] [PubMed] [Google Scholar]
- 36.Battaglioli E, Andres ME, Rose DW, Chenoweth JG, Rosenfeld MG, Anderson ME, Mandel G. REST repression of neuronal genes requires components of the hSWI.SNF complex. J Biol Chem. 2002;277:41038–45. doi: 10.1074/jbc.M205691200. https://doi.org/10.1074/jbc.M205691200 [DOI] [PubMed] [Google Scholar]
- 37.Nesti E, Corson GM, McCleskey M, Oyer JA, Mandel G. C-terminal domain small phosphatase 1 and MAP kinase reciprocally control REST stability and neuronal differentiation. Proc Natl Acad Sci USA. 2014;111:E3929–36. doi: 10.1073/pnas.1414770111. https://doi.org/10.1073/pnas.1414770111 [DOI] [PMC free article] [PubMed] [Google Scholar]
- 38.Mandel G, Fiondella CG, Covey MV, Lu DD, Loturco JJ, Ballas N. Repressor element 1 silencing transcription factor (REST) controls radial migration and temporal neuronal specification during neocortical development. Proc Natl Acad Sci USA. 2011;108:16789–94. doi: 10.1073/pnas.1113486108. https://doi.org/10.1073/pnas.1113486108 [DOI] [PMC free article] [PubMed] [Google Scholar]
- 39.Ballas N, Mandel G. The many faces of REST oversee epigenetic programming of neuronal genes. Curr Opin Neurobiol. 2005;15:500–6. doi: 10.1016/j.conb.2005.08.015. https://doi.org/10.1016/j.conb.2005.08.015 [DOI] [PubMed] [Google Scholar]
- 40.Ballas N, Grunseich C, Lu DD, Speh JC, Mandel G. REST and its corepressors mediate plasticity of neuronal gene chromatin throughout neurogenesis. Cell. 2005;121:645–57. doi: 10.1016/j.cell.2005.03.013. https://doi.org/10.1016/j.cell.2005.03.013 [DOI] [PubMed] [Google Scholar]
- 41.Gao Z, Ure K, Ding P, Nashaat M, Yuan L, Ma J, Hammer RE, Hsieh J. The master negative regulator REST/NRSF controls adult neurogenesis by restraining the neurogenic program in quiescent stem cells. J Neurosci. 2011;31:9772–86. doi: 10.1523/JNEUROSCI.1604-11.2011. https://doi.org/10.1523/JNEUROSCI.1604-11.2011 [DOI] [PMC free article] [PubMed] [Google Scholar]
- 42.Aoki H, Hara A, Era T, Kunisada T, Yamada Y. Genetic ablation of Rest leads to in vitro-specific derepression of neuronal genes during neurogenesis. Development. 2012;139:667–77. doi: 10.1242/dev.072272. https://doi.org/10.1242/dev.072272 [DOI] [PubMed] [Google Scholar]
- 43.Otto SJ, McCorkle SR, Hover J, Conaco C, Han JJ, Impey S, Yochum GS, Dunn JJ, Goodman RH, Mandel G. A new binding motif for the transcriptional repressor REST uncovers large gene networks devoted to neuronal functions. J Neurosci. 2007;27:6729–39. doi: 10.1523/JNEUROSCI.0091-07.2007. https://doi.org/10.1523/JNEUROSCI.0091-07.2007 [DOI] [PMC free article] [PubMed] [Google Scholar]
- 44.Lawinger P, Venugopal R, Guo ZS, Immaneni A, Sengupta D, Lu W, Rastelli L, Marin Dias Carneiro A, Levin V, Fuller GN, Echelard Y, Majumder S. The neuronal repressor REST/NRSF is an essential regulator in medulloblastoma cells. Nat Med. 2000;6:826–31. doi: 10.1038/77565. https://doi.org/10.1038/77565 [DOI] [PubMed] [Google Scholar]
- 45.Fuller GN, Su X, Price RE, Cohen ZR, Lang FF, Sawaya R, Majumder S. Many human medulloblastoma tumors overexpress repressor element-1 silencing transcription (REST)/neuron-restrictive silencer factor, which can be functionally countered by REST-VP16. Mol Cancer Ther. 2005;4:343–9. doi: 10.1158/1535-7163.MCT-04-0228. https://doi.org/10.1158/1535-7163.MCT-04-0228 [DOI] [PubMed] [Google Scholar]
- 46.Conti L, Crisafulli L, Caldera V, Tortoreto M, Brilli E, Conforti P, Zunino F, Magrassi L, Schiffer D, Cattaneo E. REST controls self-renewal and tumorigenic competence of human glioblastoma cells. PLoS One. 2012;7:e38486. doi: 10.1371/journal.pone.0038486. https://doi.org/10.1371/journal.pone.0038486 [DOI] [PMC free article] [PubMed] [Google Scholar]
- 47.Kamal MM, Sathyan P, Singh SK, Zinn PO, Marisetty AL, Liang S, Gumin J, El-Mesallamy HO, Suki D, Colman H, Fuller GN, Lang FF, Majumder S. REST regulates oncogenic properties of glioblastoma stem cells. Stem Cells. 2012;30:405–14. doi: 10.1002/stem.1020. https://doi.org/10.1002/stem.1020 [DOI] [PMC free article] [PubMed] [Google Scholar]
- 48.Sankar S, Gomez NC, Bell R, Patel M, Davis IJ, Lessnick SL, Luo W. EWS and RE1-silencing transcription factor inhibit neuronal phenotype development and oncogenic transformation in Ewing sarcoma. Genes Cancer. 2013;4:213–23. doi: 10.1177/1947601913489569. https://doi.org/10.1177/1947601913489569 [DOI] [PMC free article] [PubMed] [Google Scholar]
- 49.Zhou Z, Yu L, Kleinerman ES. EWS-FLI-1 regulates the neuronal repressor gene REST, which controls Ewing sarcoma growth and vascular morphology. Cancer. 2014;120:579–88. doi: 10.1002/cncr.28555. https://doi.org/10.1002/cncr.28555 [DOI] [PMC free article] [PubMed] [Google Scholar]
- 50.Liang J, Tong P, Zhao W, Li Y, Zhang L, Xia Y, Yu Y. The REST gene signature predicts drug sensitivity in neuroblastoma cell lines and is significantly associated with neuroblastoma tumor stage. Int J Mol Sci. 2014;15:11220–33. doi: 10.3390/ijms150711220. https://doi.org/10.3390/ijms150711220 [DOI] [PMC free article] [PubMed] [Google Scholar]
- 51.Palm K, Metsis M, Timmusk T. Neuron-specific splicing of zinc finger transcription factor REST/NRSF/XBR is frequent in neuroblastomas and conserved in human, mouse and rat. Brain Res Mol Brain Res. 1999;72:30–9. doi: 10.1016/s0169-328x(99)00196-5. [DOI] [PubMed] [Google Scholar]
- 52.Lietz M, Cicchetti P, Thiel G. Inverse expression pattern of REST and synapsin I in human neuroblastoma cells. Biol Chem. 1998;379:1301–4. [PubMed] [Google Scholar]
- 53.Taylor P, Fangusaro J, Rajaram V, Goldman S, Helenowski IB, MacDonald T, Hasselblatt M, Riedemann L, Laureano A, Cooper L, Gopalakrishnan V. REST is a novel prognostic factor and therapeutic target for medulloblastoma. Mol Cancer Ther. 2012;11:1713–23. doi: 10.1158/1535-7163.MCT-11-0990. https://doi.org/10.1158/1535-7163.MCT-11-0990 [DOI] [PMC free article] [PubMed] [Google Scholar]
- 54.Lal S, Lacroix M, Tofilon P, Fuller GN, Sawaya R, Lang FF. An implantable guide-screw system for brain tumor studies in small animals. J Neurosurg. 2000;92:326–33. doi: 10.3171/jns.2000.92.2.0326. https://doi.org/10.3171/jns.2000.92.2.0326 [DOI] [PubMed] [Google Scholar]
- 55.DeCicco-Skinner KL, Henry GH, Cataisson C, Tabib T, Gwilliam JC, Watson NJ, Bullwinkle EM, Falkenburg L, O'Neill RC, Morin A, Wiest JS. Endothelial cell tube formation assay for the in vitro study of angiogenesis. J Vis Exp. 2014:e51312. doi: 10.3791/51312. https://doi.org/10.3791/51312 [DOI] [PMC free article] [PubMed]
- 56.Simons M, Gordon E, Claesson-Welsh L. Mechanisms and regulation of endothelial VEGF receptor signalling. Nat Rev Mol Cell Biol. 2016;17:611–25. doi: 10.1038/nrm.2016.87. https://doi.org/10.1038/nrm.2016.87 [DOI] [PubMed] [Google Scholar]
- 57.Mitola S, Ravelli C, Moroni E, Salvi V, Leali D, Ballmer-Hofer K, Zammataro L, Presta M. Gremlin is a novel agonist of the major proangiogenic receptor VEGFR2. Blood. 2010;116:3677–80. doi: 10.1182/blood-2010-06-291930. https://doi.org/10.1182/blood-2010-06-291930 [DOI] [PubMed] [Google Scholar]
- 58.Chiodelli P, Mitola S, Ravelli C, Oreste P, Rusnati M, Presta M. Heparan sulfate proteoglycans mediate the angiogenic activity of the vascular endothelial growth factor receptor-2 agonist gremlin. Arterioscler Thromb Vasc Biol. 2011;31:e116–27. doi: 10.1161/ATVBAHA.111.235184. https://doi.org/10.1161/ATVBAHA.111.235184 [DOI] [PubMed] [Google Scholar]
- 59.Lavoz C, Alique M, Rodrigues-Diez R, Pato J, Keri G, Mezzano S, Egido J, Ruiz-Ortega M. Gremlin regulates renal inflammation via the vascular endothelial growth factor receptor 2 pathway. J Pathol. 2015;236:407–20. doi: 10.1002/path.4537. https://doi.org/10.1002/path.4537 [DOI] [PubMed] [Google Scholar]
- 60.Erdmann R, Ozden C, Weidmann J, Schultze A. Targeting the Gremlin-VEGFR2 axis - a promising strategy for multiple diseases? J Pathol. 2015;236:403–6. doi: 10.1002/path.4544. https://doi.org/10.1002/path.4544 [DOI] [PubMed] [Google Scholar]
- 61.Liu Y, Chen Z, Cheng H, Chen J, Qian J. Gremlin promotes retinal pigmentation epithelial (RPE) cell proliferation, migration and VEGF production via activating VEGFR2-Akt-mTORC2 signaling. Oncotarget. 2017;8:979–87. doi: 10.18632/oncotarget.13518. https://doi.org/10.18632/oncotarget.13518 [DOI] [PMC free article] [PubMed] [Google Scholar]
- 62.Das CM, Taylor P, Gireud M, Singh A, Lee D, Fuller G, Ji L, Fangusaro J, Rajaram V, Goldman S, Eberhart C, Gopalakrishnan V. The deubiquitylase USP37 links REST to the control of p27 stability and cell proliferation. Oncogene. 2013;32:1691–701. doi: 10.1038/onc.2012.182. https://doi.org/10.1038/onc.2012.182 [DOI] [PMC free article] [PubMed] [Google Scholar]
- 63.Dobson THW, Hatcher RJ, Swaminathan J, Das CM, Shaik S, Tao RH, Milite C, Castellano S, Taylor PH, Sbardella G, Gopalakrishnan V. Regulation of USP37 expression by REST-associated G9a-dependent histone methylation. Mol Cancer Res. 2017;15:1073–84. doi: 10.1158/1541-7786.MCR-16-0424. https://doi.org/10.1158/1541-7786.MCR-16-0424 [DOI] [PMC free article] [PubMed] [Google Scholar]
- 64.Marisetty AL, Singh SK, Nguyen TN, Coarfa C, Liu B, Majumder S. REST represses miR-124 and miR-203 to regulate distinct oncogenic properties of glioblastoma stem cells. Neuro Oncol. 2017;19:514–23. doi: 10.1093/neuonc/now232. https://doi.org/10.1093/neuonc/now232 [DOI] [PMC free article] [PubMed] [Google Scholar]
- 65.Bai Y, Lathia JD, Zhang P, Flavahan W, Rich JN, Mattson MP. Molecular targeting of TRF2 suppresses the growth and tumorigenesis of glioblastoma stem cells. Glia. 2014;62:1687–98. doi: 10.1002/glia.22708. https://doi.org/10.1002/glia.22708 [DOI] [PMC free article] [PubMed] [Google Scholar]
- 66.Zhang D, Li Y, Wang R, Li Y, Shi P, Kan Z, Pang X. Inhibition of REST suppresses proliferation and migration in glioblastoma cells. Int J Mol Sci. 2016:17. doi: 10.3390/ijms17050664. https://doi.org/10.3390/ijms17050664 [DOI] [PMC free article] [PubMed]
- 67.Liang J, Meng Q, Zhao W, Tong P, Li P, Zhao Y, Zhao X, Li H. An expression based REST signature predicts patient survival and therapeutic response for glioblastoma multiforme. Sci Rep. 2016;6:34556. doi: 10.1038/srep34556. https://doi.org/10.1038/srep34556 [DOI] [PMC free article] [PubMed] [Google Scholar]
- 68.Tsai MC, Manor O, Wan Y, Mosammaparast N, Wang JK, Lan F, Shi Y, Segal E, Chang HY. Long noncoding RNA as modular scaffold of histone modification complexes. Science. 2010;329:689–93. doi: 10.1126/science.1192002. https://doi.org/10.1126/science.1192002 [DOI] [PMC free article] [PubMed] [Google Scholar]
- 69.Dietrich N, Lerdrup M, Landt E, Agrawal-Singh S, Bak M, Tommerup N, Rappsilber J, Sodersten E, Hansen K. REST-mediated recruitment of polycomb repressor complexes in mammalian cells. PLoS Genet. 2012;8:e1002494. doi: 10.1371/journal.pgen.1002494. https://doi.org/10.1371/journal.pgen.1002494 [DOI] [PMC free article] [PubMed] [Google Scholar]
- 70.Bender S, Tang Y, Lindroth AM, Hovestadt V, Jones DT, Kool M, Zapatka M, Northcott PA, Sturm D, Wang W, Radlwimmer B, Hojfeldt JW, Truffaux N, et al. Reduced H3K27me3 and DNA hypomethylation are major drivers of gene expression in K27M mutant pediatric high-grade gliomas. Cancer Cell. 2013;24:660–72. doi: 10.1016/j.ccr.2013.10.006. https://doi.org/10.1016/j.ccr.2013.10.006 [DOI] [PubMed] [Google Scholar]
- 71.Saratsis AM, Kambhampati M, Snyder K, Yadavilli S, Devaney JM, Harmon B, Hall J, Raabe EH, An P, Weingart M, Rood BR, Magge SN, MacDonald TJ, et al. Comparative multidimensional molecular analyses of pediatric diffuse intrinsic pontine glioma reveals distinct molecular subtypes. Acta Neuropathol. 2014;127:881–95. doi: 10.1007/s00401-013-1218-2. https://doi.org/10.1007/s00401-013-1218-2 [DOI] [PMC free article] [PubMed] [Google Scholar]
- 72.Conway AE, Reddick WE, Li Y, Yuan Y, Glass JO, Baker JN, Kun LE, Broniscer A, Patay Z. “Occult” post-contrast signal enhancement in pediatric diffuse intrinsic pontine glioma is the MRI marker of angiogenesis? Neuroradiology. 2014;56:405–12. doi: 10.1007/s00234-014-1348-9. https://doi.org/10.1007/s00234-014-1348-9 [DOI] [PMC free article] [PubMed] [Google Scholar]
- 73.Huang Z, Bao SD. Roles of main pro- and anti-angiogenic factors in tumor angiogenesis. World J Gastroenterol. 2004;10:463–70. doi: 10.3748/wjg.v10.i4.463. [DOI] [PMC free article] [PubMed] [Google Scholar]
- 74.Carmeliet P, Jain RK. Angiogenesis in cancer and other diseases. Nature. 2000;407:249–57. doi: 10.1038/35025220. https://doi.org/10.1038/35025220 [DOI] [PubMed] [Google Scholar]
- 75.Jain RK, di Tomaso E, Duda DG, Loeffler JS, Sorensen AG, Batchelor TT. Angiogenesis in brain tumours. Nat Rev Neurosci. 2007;8:610–22. doi: 10.1038/nrn2175. https://doi.org/10.1038/nrn2175 [DOI] [PubMed] [Google Scholar]
- 76.Nagy JA, Dvorak AM, Dvorak HF. VEGF-A and the induction of pathological angiogenesis. Annu Rev Pathol. 2007;2:251–75. doi: 10.1146/annurev.pathol.2.010506.134925. https://doi.org/10.1146/annurev.pathol.2.010506.134925 [DOI] [PubMed] [Google Scholar]
- 77.Stiver SI, Tan X, Brown LF, Hedley-Whyte ET, Dvorak HF. VEGF-A angiogenesis induces a stable neovasculature in adult murine brain. J Neuropathol Exp Neurol. 2004;63:841–55. doi: 10.1093/jnen/63.8.841. [DOI] [PubMed] [Google Scholar]
- 78.Sobol-Milejska G, Mizia-Malarz A, Musiol K, Chudek J, Bozentowicz-Wikarek M, Wos H, Mandera M. Serum levels of vascular endothelial growth factor (VEGF) and basic fibroblast growth factor (bFGF) in children with brain tumours. Adv Clin Exp Med. 2017 doi: 10.17219/acem/62320. https://doi.org/10.17219/acem/62320 [DOI] [PubMed]
- 79.Giacomini A, Chiodelli P, Matarazzo S, Rusnati M, Presta M, Ronca R. Blocking the FGF/FGFR system as a “two-compartment” antiangiogenic/antitumor approach in cancer therapy. Pharmacol Res. 2016;107:172–85. doi: 10.1016/j.phrs.2016.03.024. https://doi.org/10.1016/j.phrs.2016.03.024 [DOI] [PubMed] [Google Scholar]
- 80.Dell'Era P, Belleri M, Stabile H, Massardi ML, Ribatti D, Presta M. Paracrine and autocrine effects of fibroblast growth factor-4 in endothelial cells. Oncogene. 2001;20:2655–63. doi: 10.1038/sj.onc.1204368. https://doi.org/10.1038/sj.onc.1204368 [DOI] [PubMed] [Google Scholar]
- 81.Stabile H, Mitola S, Moroni E, Belleri M, Nicoli S, Coltrini D, Peri F, Pessi A, Orsatti L, Talamo F, Castronovo V, Waltregny D, Cotelli F, et al. Bone morphogenic protein antagonist Drm/gremlin is a novel proangiogenic factor. Blood. 2007;109:1834–40. doi: 10.1182/blood-2006-06-032276. https://doi.org/10.1182/blood-2006-06-032276 [DOI] [PubMed] [Google Scholar]
- 82.Taylor KR, Mackay A, Truffaux N, Butterfield YS, Morozova O, Philippe C, Castel D, Grasso CS, Vinci M, Carvalho D, Carcaboso AM, de Torres C, Cruz O, et al. Recurrent activating ACVR1 mutations in diffuse intrinsic pontine glioma. Nat Genet. 2014;46:457–61. doi: 10.1038/ng.2925. https://doi.org/10.1038/ng.2925 [DOI] [PMC free article] [PubMed] [Google Scholar]
- 83.Merino R, Rodriguez-Leon J, Macias D, Ganan Y, Economides AN, Hurle JM. The BMP antagonist Gremlin regulates outgrowth, chondrogenesis and programmed cell death in the developing limb. Development. 1999;126:5515–22. doi: 10.1242/dev.126.23.5515. [DOI] [PubMed] [Google Scholar]
- 84.Costello CM, Cahill E, Martin F, Gaine S, McLoughlin P. Role of gremlin in the lung: development and disease. Am J Respir Cell Mol Biol. 2010;42:517–23. doi: 10.1165/rcmb.2009-0101TR. https://doi.org/10.1165/rcmb.2009-0101TR [DOI] [PubMed] [Google Scholar]
- 85.Church RH, Ali I, Tate M, Lavin D, Krishnakumar A, Kok HM, Hombrebueno JR, Dunne PD, Bingham V, Goldschmeding R, Martin F, Brazil DP. Gremlin1 plays a key role in kidney development and renal fibrosis. Am J Physiol Renal Physiol. 2017;312:F1141–F57. doi: 10.1152/ajprenal.00344.2016. https://doi.org/10.1152/ajprenal.00344.2016 [DOI] [PMC free article] [PubMed] [Google Scholar]
- 86.Namkoong H, Shin SM, Kim HK, Ha SA, Cho GW, Hur SY, Kim TE, Kim JW. The bone morphogenetic protein antagonist gremlin 1 is overexpressed in human cancers and interacts with YWHAH protein. BMC Cancer. 2006;6:74. doi: 10.1186/1471-2407-6-74. https://doi.org/10.1186/1471-2407-6-74 [DOI] [PMC free article] [PubMed] [Google Scholar]
- 87.Topol LZ, Modi WS, Koochekpour S, Blair DG. DRM/GREMLIN (CKTSF1B1) maps to human chromosome 15 and is highly expressed in adult and fetal brain. Cytogenet Cell Genet. 2000;89:79–84. doi: 10.1159/000015568. https://doi.org/10.1159/000015568 [DOI] [PubMed] [Google Scholar]
- 88.Chen B, Blair DG, Plisov S, Vasiliev G, Perantoni AO, Chen Q, Athanasiou M, Wu JY, Oppenheim JJ, Yang D. Cutting edge: bone morphogenetic protein antagonists Drm/Gremlin and Dan interact with Slits and act as negative regulators of monocyte chemotaxis. J Immunol. 2004;173:5914–7. doi: 10.4049/jimmunol.173.10.5914. [DOI] [PubMed] [Google Scholar]
- 89.Guan Y, Cheng W, Zou C, Wang T, Cao Z. Gremlin1 promotes carcinogenesis of glioma in vitro. Clin Exp Pharmacol Physiol. 2017;44:244–56. doi: 10.1111/1440-1681.12697. https://doi.org/10.1111/1440-1681.12697 [DOI] [PubMed] [Google Scholar]
- 90.Yan K, Wu Q, Yan DH, Lee CH, Rahim N, Tritschler I, DeVecchio J, Kalady MF, Hjelmeland AB, Rich JN. Glioma cancer stem cells secrete Gremlin1 to promote their maintenance within the tumor hierarchy. Genes Dev. 2014;28:1085–100. doi: 10.1101/gad.235515.113. https://doi.org/10.1101/gad.235515.113 [DOI] [PMC free article] [PubMed] [Google Scholar]
- 91.Rodrigues-Diez R, Rodrigues-Diez RR, Lavoz C, Carvajal G, Droguett A, Garcia-Redondo AB, Rodriguez I, Ortiz A, Egido J, Mezzano S, Ruiz-Ortega M. Gremlin activates the Smad pathway linked to epithelial mesenchymal transdifferentiation in cultured tubular epithelial cells. Biomed Res Int. 2014;2014:802841. doi: 10.1155/2014/802841. https://doi.org/10.1155/2014/802841 [DOI] [PMC free article] [PubMed] [Google Scholar]
- 92.Maury E, Hashizume R. Epigenetic modification in chromatin machinery and its deregulation in pediatric brain tumors: insight into epigenetic therapies. Epigenetics. 2017;12:353–69. doi: 10.1080/15592294.2016.1278095. https://doi.org/10.1080/15592294.2016.1278095 [DOI] [PMC free article] [PubMed] [Google Scholar]
- 93.Morales La Madrid A, Hashizume R, Kieran MW. Future clinical trials in DIPG: bringing epigenetics to the clinic. Front Oncol. 2015;5:148. doi: 10.3389/fonc.2015.00148. https://doi.org/10.3389/fonc.2015.00148 [DOI] [PMC free article] [PubMed] [Google Scholar]
- 94.Johung TB, Monje M. Diffuse intrinsic pontine glioma: new pathophysiological insights and emerging therapeutic targets. Curr Neuropharmacol. 2017;15:88–97. doi: 10.2174/1570159X14666160509123229. [DOI] [PMC free article] [PubMed] [Google Scholar]
- 95.Sitohy B, Nagy JA, Dvorak HF. Anti-VEGF/VEGFR therapy for cancer: reassessing the target. Cancer Res. 2012;72:1909–14. doi: 10.1158/0008-5472.CAN-11-3406. https://doi.org/10.1158/0008-5472.CAN-11-3406 [DOI] [PMC free article] [PubMed] [Google Scholar]
- 96.Ciuclan L, Sheppard K, Dong L, Sutton D, Duggan N, Hussey M, Simmons J, Morrell NW, Jarai G, Edwards M, Dubois G, Thomas M, Van Heeke G, et al. Treatment with anti-gremlin 1 antibody ameliorates chronic hypoxia/SU5416-induced pulmonary arterial hypertension in mice. Am J Pathol. 2013;183:1461–73. doi: 10.1016/j.ajpath.2013.07.017. https://doi.org/10.1016/j.ajpath.2013.07.017 [DOI] [PMC free article] [PubMed] [Google Scholar]
- 97.Livak KJ, Schmittgen TD. Analysis of relative gene expression data using real-time quantitative PCR and the 2(-Delta Delta C(T)) method. Methods. 2001;25:402–8. doi: 10.1006/meth.2001.1262. https://doi.org/10.1006/meth.2001.1262 [DOI] [PubMed] [Google Scholar]
- 98.Ponce ML. Tube formation: an in vitro matrigel angiogenesis assay. Methods Mol Biol. 2009;467:183–8. doi: 10.1007/978-1-59745-241-0_10. https://doi.org/10.1007/978-1-59745-241-0_10 [DOI] [PubMed] [Google Scholar]
- 99.Barrett T, Wilhite SE, Ledoux P, Evangelista C, Kim IF, Tomashevsky M, Marshall KA, Phillippy KH, Sherman PM, Holko M, Yefanov A, Lee H, Zhang N, et al. NCBI GEO: archive for functional genomics data sets--update. Nucleic Acids Res. 2013;41:D991–5. doi: 10.1093/nar/gks1193. https://doi.org/10.1093/nar/gks1193 [DOI] [PMC free article] [PubMed] [Google Scholar]
Associated Data
This section collects any data citations, data availability statements, or supplementary materials included in this article.