Abstract
Background
Worldwide, femoral head necrosis (FHN), which is also known as avascular necrosis of the femoral head or osteonecrosis of the femoral head, affects millions of people. Excess alcohol intake and steroid use are two common associations with FHN, but their pathogenesis remains unknown. The aim of this study was to develop an in vitro model using human chondrocytes to study alcohol-induced and steroid-induced FHN.
Material/Methods
In this study, the in vitro model used a monolayer culture of articular chondrocytes derived from patients with non-traumatic FHN (Ficat and Arlet, Stage III). Normal chondrocytes were obtained from patients with femoral neck fracture resulting from road traffic accident (Garden, Stage IV). Alcohol-stimulated and steroid-stimulated articular chondrocytes were evaluated by a cell proliferation assay, measurement of calcium levels (alizarin red), measurement of alkaline phosphatase (ALP) levels, detection of glycosaminoglycan (GAG) secretion using safranin O histochemical staining, and analysis of cartilage-specific genes, ACAN, SOX9, OPG, TGF-β, RANKL, and RUNX2, using quantitative real-time polymerase chain reaction (qRT-PCR).
Results
Both alcohol and steroids, but especially steroids, accelerated the degradation of cartilage by suppression of chondrogenesis while promoting chondrocyte hypertrophy and activating osteogenic differentiation, as assessed by cell proliferation assay, detection of glycosaminoglycan (GAG) secretion, and analysis of cartilage-specific genes.
Conclusions
A human chondrocyte-derived in vitro model of alcohol-induced and steroid-induced FHN demonstrated chondrocyte hypertrophy and activated osteogenic differentiation.
MeSH Keywords: 11-Hydroxycorticosteroids, Chondrocytes, Femur Head Necrosis
Background
Femoral head necrosis (FHN), also known as avascular necrosis of the femoral head or osteonecrosis of the femoral head, is a disease that currently affects 8.12 million patients in China [1]. Multiple risk factors for FHN include trauma to the hips, excessive alcohol use, steroid use, genetic factors, and inflammatory or autoimmune diseases, which have all been reported to be the cause or contribute to the progression of FHN, but idiopathic cases also exist [2,3].
Among the various non-traumatic causes leading to FHN, alcohol abuse and prolonged steroid use are among the leading factors [4]. Alcohol abuse and long periods of drinking alcohol have been reported to increase the incidence of alcohol-induced FHN [5,6]. Animal models of FHN that have used local injections of ethanol into the joint, have confirmed the association between ethanol and FHN [7,8]. Alcohol has been shown to cause osteoporosis and osteonecrosis by inducing adipogenesis and inhibiting osteogenesis in mesenchymal stem cells (MSCs) [9–11].
A study in China, conducted between January 1990 to July 2011, and a nationwide epidemiologic survey from Japan in 2005 included retrospective data that supported the association between steroid use and osteonecrosis [12,13]. Corticosteroid use has been reported to contribute to non-traumatic FHN by inducing apoptosis of osteocytes and chondrocytes and inducing inflammation [14–17]. However, the mechanism of the pathogenesis of non-traumatic osteonecrosis is still unclear, which limits the application of the most appropriate treatment for FHN.
The aim of this study was to develop an in vitro model of a cultured monolayer of human chondrocytes to study alcohol-induced and steroid-induced FHN. The articular chondrocytes were derived from the patients with non-traumatic FHN, with normal chondrocytes obtained during repair of cases of femoral neck fracture resulting from road traffic accident. Using this model, it was possible to compare the pathological process found in abnormal and normal chondrocytes.
Material and Methods
Sample collection
The patients with femoral head necrosis (FHN) and with femoral neck fracture were enrolled in the study, which was conducted at the First Affiliated Hospital of Guangxi Medical University. The experimental protocol was reviewed and approved by the Ethics Committee of the Guangxi Medical University, Nanning, China. The patients were diagnosed with alcohol-induced and steroid-induced FHN respectively according to their medical history. A history of alcoholism was defined as an alcohol intake of 100 gm per day for 20 years. Patients were identified who had prednisone therapy of 10 mg per day for 20 years.
Patients were identified as having Stage III FHN according to the Ficat and Arlet classification (subchondral collapse without flattening of the femoral head). Femoral neck fracture resulting from road traffic accident was categorized as Stage IV according to the Garden classification (completely displaced fracture with no contact between the fracture fragments).
All patients signed informed consents to participate in the study. All procedures were in accordance with the Helsinki Declaration [18].
Cell isolation and culture
Primary articular chondrocytes were isolated from the femoral head by collagenase digestion. Briefly, after washing with phosphate-buffered saline (PBS) under sterile condition, cartilage tissues were cut into pieces between 0.5–1 mm3. And then samples were treated with 2 mg/mL collagenase type II (Gibco) for 3 hours after digested with 0.25% trypsin (Solarbio, China) for 30 min. Chondrocytes were collected and re-suspended in culture media after being centrifuged at 1000 rpm for 5 min. Culture media were based on alpha-modified Eagle’s medium (α-MEM, Gibco) containing 1% (v/v) penicillin/streptomycin (Solarbio) and 10% (v/v) fetal bovine serum (FBS, Gibco). Cells were cultured in the incubator with 5% CO2. All further studies were carried out with chondrocytes at the second passage.
MTS cell proliferation assay
Cell proliferation was measured using the colorimetric MTS assay, using 3-(4,5-dimethylthiazol-2-yl)-5-(3-carboxymethoxyphenyl)-2-(4-sulfophenyl)-2H-tetrazolium in the CellTiter 96® AQueous One Solution Cell Proliferation Assay (Promega). Briefly, the MTS reagent was added to the culture medium and incubated at 37°C for 4 hours. The absorbance at 490 nm was detected using a microplate reader (Thermo Scientific, Shanghai, China).
Cell viability assay
Vital staining was performed with 5 μg/ml fluorescein diacetate (FDA) (Life Technologies, Carlsbad, California, USA) and 20 μg/ml propidium iodide (PI) (Life Technologies) in PBS on cells incubated in the dark for 5 min at room temperature. All images were observed and photographed using a laser scanning confocal microscope (Nikon A1, Tokyo, Japan).
Safranin O staining
Safranin O staining was used to detect glycosaminoglycan (GAG) production levels in the cultured cells. Briefly, cells were fixed with 4% paraformaldehyde at room temperature for 30 minutes and stained with safranin O (Sigma, USA) at a concentration of 0.1% for 10 minutes. Light microscopy was undertaken (BX53, Olympus, Japan) and photomicrographic images were taken.
Biochemical analysis
Chondrocytes were harvested using 20 μg/mL proteinase K (Sigma) at 56°C for 10 hours after 2, 5, and 8 days of culture. DNA content of cells was stained using Hoechst 33258 (Invitrogen, USA) for 5 min, and then measured with a spectrofluorometer at 460 nm (emission) and 360 nm (excitation). Calf thymus DNA was used as an internal standard. Total intracellular glycosaminoglycan (GAG) secretion was measured spectrophotometrically at 525 nm, with 1,9-dimethylmethylene blue (DMMB) dye (Sigma, USA) using a FlexStation 3 Multi-Mode Microplate Reader (Molecular Devices, USA) and quantified with a standard curve against chondroitin sulfate (Sigma, USA). Finally, the GAG content was calculated by normalizing to the total DNA content obtained before analysis.
Quantitative real-time polymerase chain reaction (qRT-PCR)
Total RNA was extracted using an RNA isolation kit (Tiangen Biotechnology, Beijing, China) following the instructions of the manufacturer. Reverse transcription of RNA was carried out using a reverse transcription kit (Fermentas, USA) and the following protocol 25°C for 5min, 42°C for 60 min, and 72°C for 5 min. Amplification was performed with the Fast Start Universal SYBR Green Master Mix (Roche, Germany) for 10 min at 95°C, 15 s at 95°C, and 1 min at 60°C on a real-time fluorescence quantitative instrument (Roche, USA). The primers are listed in Table 1. Glyceraldehyde-3-phosphate dehydrogenase (GAPDH) was used as the internal reference. Results were analyzed by the 2−ΔΔCT method. The experiments were performed in triplicate for gene expression.
Table 1.
Primers for real-time polymerase chain reaction.
| Gene name | Forward primer | Reverse primer |
|---|---|---|
| GAPDH | 5′-CTATAAATTGAGCCCGCAGC-3′ | 5′-GACCAAATCCGTTGACTCCG-3′ |
| ACAN | 5′-CTACACGCTACACCCTCGAC-3′ | 5′-ACGTCCTCACACCAGGAAAC-3′ |
| SOX9 | 5′-AAGCTCTGGAGACTTCTGAACG-3′ | 5′-CGTTCTTCACCGACTTCCTCC-3′ |
| OPG | 5′-GCCTGGCACCAAAGTAAACG-3′ | 5′-TACGAAGCTGCTCGAAGGTG-3′ |
| RANKL | 5′-TTGGAGCAATTACGGGGTGA-3′ | 5′-TTGCGCTAGATGACACCCTC-3′ |
| RUNX2 | 5′-TGTCATGGCGGGTAACGATG-3′ | 5′-CCCTAAATCACTGAGGCGGT-3′ |
| TGF-β | 5′-CTAATGGTGGAAACCCACAACG-3′ | 5′-TATCGCCAGGAATTGTTGCTG-3′ |
GAPDH – glyceraldehyde-3-phosphate dehydrogenase as the normalization control; ACAN – aggrecan; SOX9 – SRY-related high mobility group-box gene9; OPG – osteoprotegerin; RANKL – receptor activator for nuclear factor-κ B ligand; RUNX2 – runt-related transcription factor 2; TGF-β – transforming growth factor-β.
Analysis of cell morphology by light microscopy
At each time point, cells were washed twice with PBS and then fixed with 4% paraformaldehyde for 30 min. The cells were then stained with hematoxylin and eosin (H&E) using a histochemical kit (Nanjing Jiancheng Biotech, Nanjing, China). Photomicrographic images were captured by light microscopy (Olympus BX53, Japan).
Immunohistochemistry for type II collagen expression by light microscopy
Fixed cultured cells were exposed to 10% (v/v) hydrogen peroxide (H2O2) at room temperature for 15 min to block any endogenous peroxidase activity and then treated with normal goat serum for 20 min at room temperature. Cell samples were incubated with the primary antibody to type II collagen (Boster, Wuhan, China) (1: 200) overnight at 4°C. Specimens were incubated with the secondary antibody at room temperature for 15 min, and then stained with a 3, -3-diaminobenzidine tetrahydrochloride (DAB) kit (Boster, Wuhan, China), and counterstained with hematoxylin. Light microscopic images were observed and captured using an Olympus BX53 microscope (Olympus, Japan).
Alizarin red staining for calcium
Following cell culture for 2 days, 5 days and 8 days, the cells were washed twice with PBS, and then fixed in 4% paraformaldehyde for 30 min. The cells underwent evaluation of calcium levels using alizarin red staining, according to the standard protocol. Light microscopic images were observed and captured using an Olympus BX53 microscope (Olympus, Japan). The alizarin red staining areas were calculated by evaluation of three images.
Alkaline phosphatase (ALP) activity
Following cell culture for 2 days, 5 days and 8 days, the cells were washed twice with PBS and then lysed using RIPA lysis buffer (Beyotime, Beijing, China). The intracellular ALP activity was evaluated quantitatively using an Alkaline Phosphatase Assay Kit (Beyotime, Beijing, China) according to the manufacturer’s instructions (http://www.beyotime.com/product/P0321.htm). The ALP activity was detected at the wavelength of 405 nm using a microplate reader (Thermo, Germany).
Statistical analysis
Data were presented as the mean ± standard deviation (SD), and analyzed by one-way analysis of variance (ANOVA) followed by Dunnett’s post hoc test. The level of significance was set at P<0.05.
Results
Cell proliferation and cell viability assay
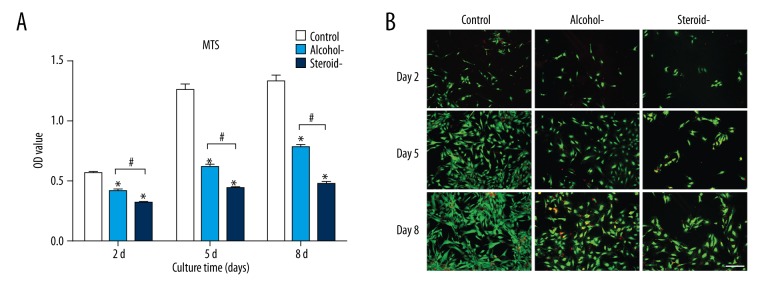
Cell proliferation was detected by the MTS method. As shown in Figure 1A, cells in the control group had significantly greater cell proliferation levels compared with the groups of alcohol-induced and steroid-induced femoral head necrosis (FHN) from day 2 to day 8. The proliferation of chondrocytes from cartilage of alcohol-induced FHN was increased compared with steroid-induced FHN, showing that both alcohol and steroids inhibited the proliferation of articular chondrocytes, but that steroid use exerted the greater inhibitory effect.
Figure 1.
Cell proliferation and cell assay of chondrocytes in an in vitro model of human femoral head necrosis (FHN). Cell proliferation (A) and cell viability (B) assay of chondrocytes from cartilage of control, alcohol-induced, and steroid-induced femoral head necrosis (FHN). Scale bar: 200 μm. N=3, mean ±SD, *, # indicates P<0.05.
Cell viability was assayed by vital staining performed with fluorescein diacetate (FDA) and propidium iodide (PI) staining. Viable cells were stained green and dead cells were stained red. As shown in Figure 1B, alcohol and steroid exposure both decreased the survival of viable chondrocytes, but steroid use exerted the greater inhibitory effect. These findings were consistent with the cell proliferation assay results.
Detection of glycosaminoglycan (GAG) secretion
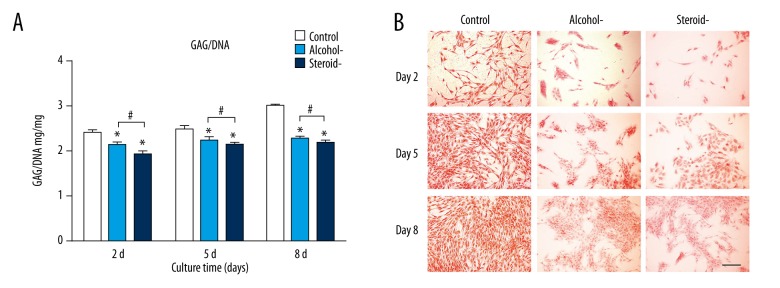
Glycosaminoglycan (GAG) production in the alcohol-induced group was 86.77%, 90%, and 75.83% of the control at day 2, day 5 and day 8. GAG production in the steroid-induced group was 78.92%, 86%, and 72.85% of the control at day 2, day 5 and day 8. Steroid use resulted in the greatest inhibitory effect among the three groups (Figure 2A). As a chondrocyte-specific stain, safranin O staining indicated more GAG secretion with more intense staining. In Figure 2B, staining in the control cells increased over time, and staining in the alcohol-induced group was increased compared with the steroid-induced group. Staining was least intense in the steroid-induced group compared with the other groups. These findings were consistent with the cell proliferation assay and cell viability results.
Figure 2.
Glycosaminoglycan (GAG) analysis of chondrocytes in an in vitro model of human femoral head necrosis (FHN). Glycosaminoglycan (GAG) analysis (A) and safranin O staining (B) of chondrocytes from cartilage of control, alcohol-induced, and steroid-induced femoral head necrosis (FHN). Scale bar: 200 μm. N=3, mean ±SD, *, # indicates P<0.05.
Gene analysis
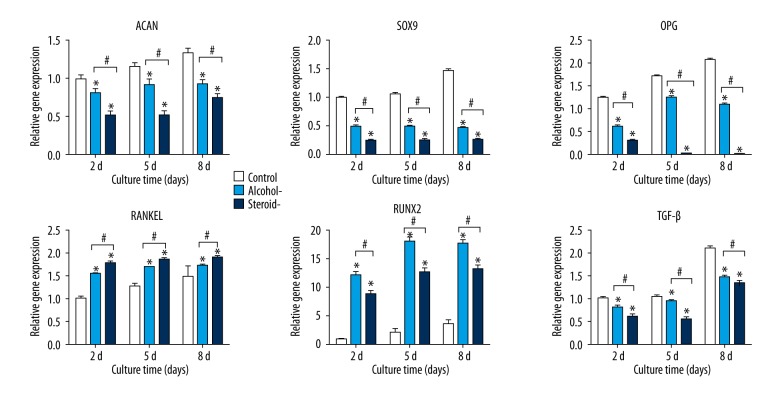
Chondrocytes in the control group, alcohol-induced group, and steroid-induced group were further investigated using gene expression analysis by quantitative real-time polymerase chain reaction (qRT-PCR).. Aggrecan (ACAN) is a cartilage-specific proteoglycan; SRY-related high mobility group-box gene 9 (SOX9) is a chondrogenic transcription factor [19]. The mRNA expression of cartilaginous gene SOX9 and ACAN, osteogenesis-related gene osteoprotegerin (OPG) and pleiotropic cytokine transforming growth factor-β (TGF-β) in alcohol-induced and steroid-induced groups were markedly lower compared with the control group, and chondrocytes the from the steroid-induced group showed the lowest values (Figure 3). In contrast, the expression of receptor activator for nuclear factor-κ B ligand (RANKL) and runt-related transcription factor 2 (RUNX2) in the alcohol-induced and steroid-induced FHN groups were greater when compared with the control group.
Figure 3.
Expression of cartilage-specific genes, ACAN, SOX9, OPG, TGF-β, RANKL, and RUNX2 using quantitative real-time polymerase chain reaction (qRT-PCR) in chondrocytes in an in vitro model of human femoral head necrosis (FHN). Aggrecan (ACAN), SRY-related high mobility group-box gene9 (SOX9), osteoprotegerin (OPG), receptor activator for nuclear factor-κ B ligand (RANKL), runt-related transcription factor 2 (RUNX2), and transforming growth factor-β (TGF-β) expression of chondrocytes from cartilage of control, alcohol-induced and steroid-induced femoral head necrosis (FHN), using quantitative real-time polymerase chain reaction (qRT-PCR). N=3, mean ±SD, *, # indicates P<0.05.
Cell morphological findings
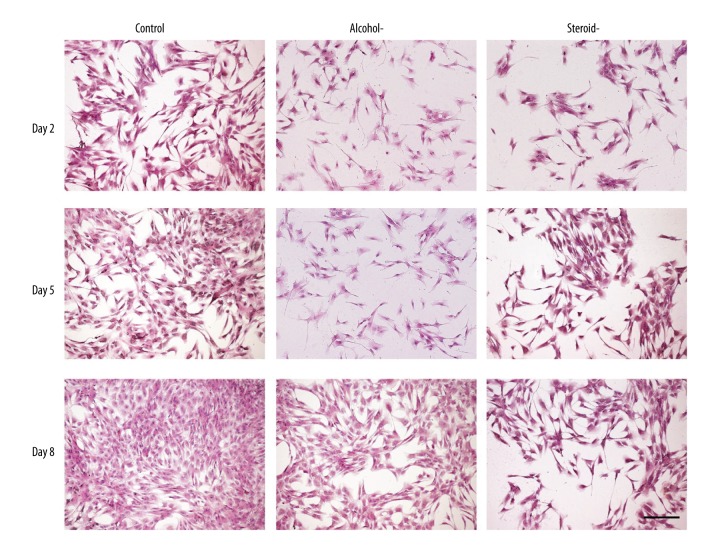
Compared with the polygonal morphology (Figure 4) typical of chondrocytes of the control cells, cells in the alcohol-induced and steroid-induced FHN groups became small and irregular, with decreasing cell numbers and an increased nuclear-cytoplasmic ratio, predominantly for the cells in the steroid-induced FHN group.
Figure 4.
Photomicrograph of the chondrocyte morphology in an in vitro model of human femoral head necrosis (FHN). Morphology of the chondrocytes in the in vitro model of the control, alcohol-induced, and steroid-induced femoral head necrosis (FHN). Scale bar: 200 μm.
Immunohistochemistry for collagen type II
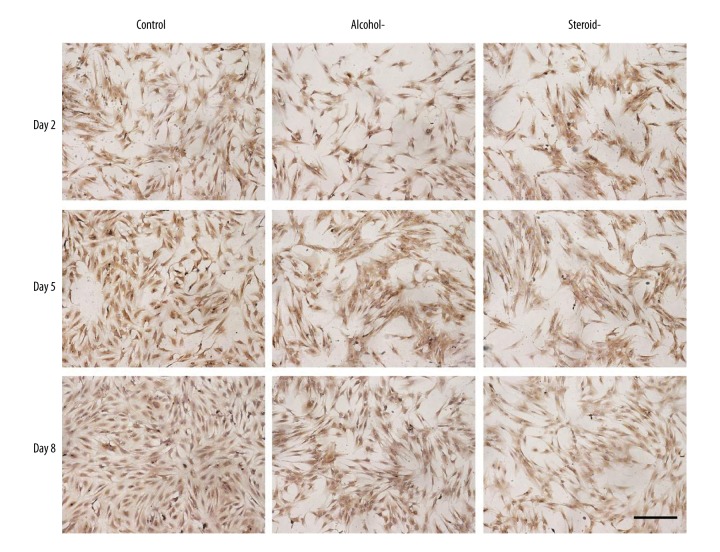
As an indicator of cartilage differentiation, collagen type II was detected by immunohistochemical staining (Figure 5). Positive staining of chondrocytes in the control group increased from day 2 to day 8. At all observation points, immunostaining for collagen type II for the alcohol-induced and steroid-induced FHN groups was weaker than that of the control. Immunostaining for the steroid-induced FHN group was almost absent, suggesting the least production of collagen type II.
Figure 5.
Photomicrograph of the immunohistochemistry staining for collagen type II in chondrocytes an in vitro model of human femoral head necrosis (FHN). Collagen type II staining of chondrocytes from control, alcohol-induced, and steroid-induced femoral head necrosis (FHN). Scale bar: 200 μm.
ALP and alizarin red staining
To confirm the observed effects on osteogenesis, ALP measurements (Figure 6A) and alizarin red staining for calcium (Figure 6B) were performed at day 2, day 5 and day 8. Alizarin red staining was used to indicate the calcium mineralized nodule (Table 2) of chondrocytes undergoing osteogenesis. Consistent with the quantitation of ALP (Table 3) less positive ALP expression (indigo colored) and alizarin red staining (orange colored) was found in the normal chondrocytes. Positive ALP staining and mineralized nodule formation were both increased with time in the alcohol-induced and steroid-induced FHN groups, which also showed more ALP positive staining compared with than that in the normal chondrocytes.
Figure 6.
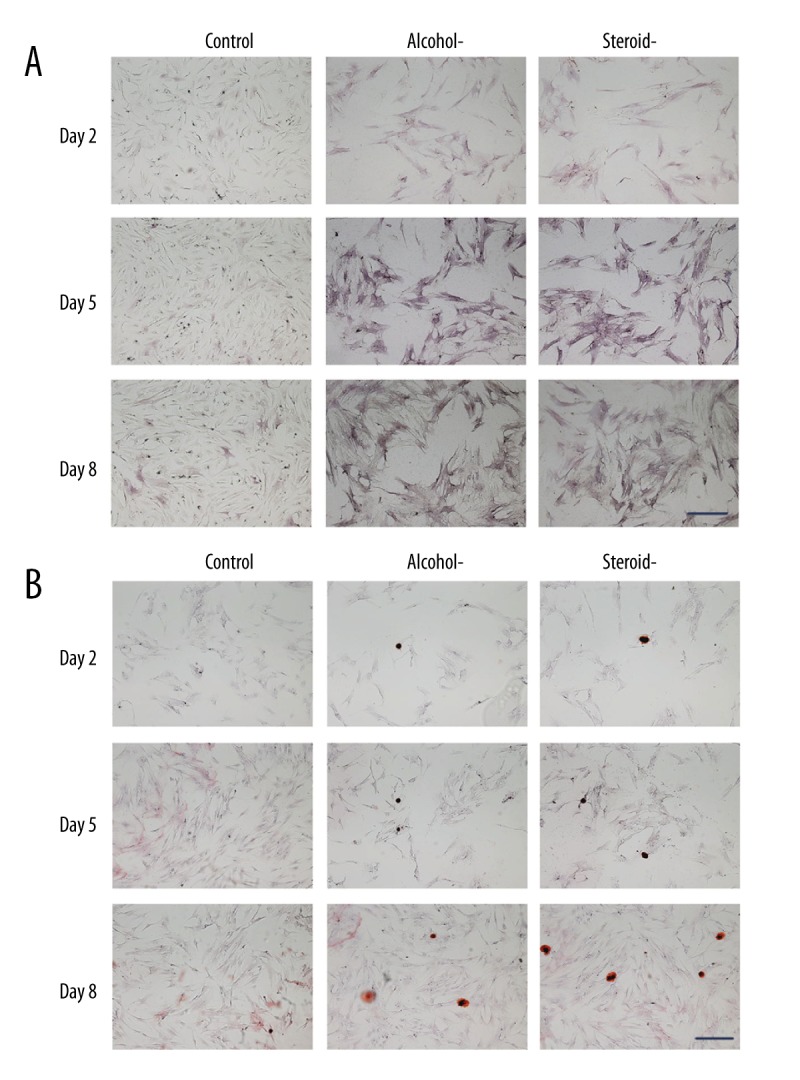
Photomicrograph of the histochemical staining for alkaline phosphatase (ALP) and alizarin red in chondrocytes in an in vitro model of human femoral head necrosis (FHN). Alkaline phosphatase (ALP) staining and alizarin red staining of chondrocytes from control, alcohol-induced, and steroid-induced femoral head necrosis (FHN). Positive ALP (indigo) and alizarin red staining (orange). Scale bar: 200 μm.
Table 2.
Numbers of mineralized nodules.
| Days | Control (n=3) | Alcohol (n=3) | Steroid (n=3) |
|---|---|---|---|
| 2 | 4.33±0.58 | 12.67±1.53 | 17.67±1.15 |
| 5 | 6.33±1.55 | 22.33±2.08 | 31.67±2.89 |
| 8 | 15.33±1.53 | 40.33±1.15 | 51.67±2.31 |
Table 3.
The quantitative determination of ALP activity.
| Days | Control (n=3) | Alcohol (n=3) | Steroid (n=3) |
|---|---|---|---|
| 2 | 2.13±0.22 | 5.49±0.14 | 7.71±0.72 |
| 5 | 3.47±0.35 | 8.87±0.29 | 10.25±0.54 |
| 8 | 5.21±0.57 | 11.12±0.83 | 13.66±0.62 |
Discussion
The aim of this study was to develop an in vitro model using human chondrocytes to study alcohol-induced and steroid-induced femoral head necrosis (FHN), a condition that is also known as avascular necrosis of the femoral head or osteonecrosis of the femoral head,. In the present study, comparison of chondrocytes grown in culture from alcohol-induced and steroid-induced FHN groups showed that both alcohol and steroids inhibited cell growth and the synthesis of cartilage-specific markers of articular chondrocytes while promoting osteogenic differentiation. The results demonstrated that alcohol and steroids might accelerate cartilage degradation by inducing hypertrophy and ossification.
These findings are supported by those of previously published studies. For example, a study by Study of Youm et al. demonstrated that apoptosis of osteocytes plays an important role in the pathogenesis of FHN induced by alcohol and steroids [20]. Zhang et al. showed that glucocorticoid-induced FHN in broiler chickens affected the proliferation, differentiation, and apoptosis of chondrocytes [15]. In the present study, we found that alcohol or steroid markedly prevented the growth of chondrocytes isolated from the patients suffering from alcohol-induced and steroid-induced FHN, but particularly in steroid-induced FHN (Figure 1A). These results are supported by previously published findings of the inhibitory effects of alcohol and steroids on chondrocyte proliferation and viability in a study on osteonecrosis of the femoral head [20].
As one of the main components of cartilage matrix, glycosaminoglycan (GAG) plays a key role in maintaining cartilage load-bearing capacity [21]. Compared with the control, chondrocytes from alcohol-induced and steroid-induced FHN secreted fewer amounts of GAG (Figure 2). Safranin O staining is a specific method to assess the synthesis of GAG, and an increased degree of staining in images of safranin O staining reflected the accumulation of GAG.
Aggrecan (ACAN) is a cartilage-specific proteoglycan composed of GAGs, and the ACAN gene expression of chondrocytes from alcohol-induced and steroid-induced FHN was significantly lower compared with the controls. As a chondrogenic transcription factor that enhances the production of cartilage matrix, SOX9 has a key role in chondrogenesis [22]. In this study, high expression levels of SOX9 in the control cells and low expression in alcohol-induced and steroid-induced FHN were consistent with ACAN mRNA expression and GAG production. Furthermore, unlike SOX9, which is believed to be an initiator of chondrogenesis, RUNX2 is considered to be a regulator for the later stages of endochondral ossification. Endochondral ossification is a sequential process that involves chondrocyte proliferation, differentiation, cartilage calcification, cell death, resorption, and eventual remodeling into bone tissue. In Figure 3, gene RUNX2 expression of chondrocytes from alcohol-induced and steroid-induced FHN were increased compared with the control, which suggests that osteogenic differentiation of chondrocytes was greater than in the control chondrocytes. TGF-β, a traditional growth factor that is effective in preventing dedifferentiation and promoting cartilage repair, has a key role in regulating the chondrogenesis of mesenchymal stem cells (MSCs). mRNA level of the TGF-β gene from alcohol-induced and steroid-induced FHN was notably lower compared with the control chondrocytes, which suggests that alcohol and steroid impaired chondrogenic differentiation. Osteoprotegerin (OPG) has a direct effect on promoting the proliferation of chondrocytes, and the findings of this study demonstrated that OPG gene expression presented with a similar trend on cell proliferation (Figures 1, 3) [23].
Morphological observations, shown in Figure 4, confirmed the inhibitory effect of alcohol and steroids on chondrocytes, especially the effects of steroids. Collagen type II is a marker of the non-hypertrophic chondrocyte [24], and collagen type II is an important component of extracellular matrix (ECM). As shown in Figure 5, when compared with the positive staining in the control, staining of chondrocytes from alcohol-induced and steroid-induced FHN were weak, which was consistent with the quantitative and qualitative assay of GAG, as shown in Figure 2.
Previously published findings suggest that the RANKL/OPG ratio has a negative correlation with femoral neck bone mineral density and that gene-gene interaction exerts a significant effect on bone remodeling [25]. A high ratio of RANKL/OPG in the steroid-induced FHN group indicated that steroids might induce FHN by inhibiting osteogenesis.
Conclusions
A human chondrocyte-derived in vitro model of alcohol-induced and steroid-induced femoral head necrosis (FHN) was developed and demonstrated chondrocyte hypertrophy and osteogenic differentiation in response to alcohol and steroid treatment. This in vitro chondrocyte model may form the basis for further studies on the causes and control of FHN.
Footnotes
Source of support: This work has been financially supported by the National Natural Science Fund of China (81472054 and 81760326), the National Key Research and Development Program of China (2016YFB0700804), the Guangxi Scientific Research and Technological Development Foundation (Guikegong 1598013-15, Guike AB16450003 and Guikegong 1598012-6), the Guangxi High School Innovative Team and Distinguished Scholars Program (third batch), the Distinguished Young Scholars Program of Guangxi Medical University
Conflict of interest
None.
References
- 1.Microsurgery Department of the Orthopedics Branch of the Chinese Medical Doctor Association; Group from the Osteonecrosis and Bone Defect Branch of the Chinese Association of Reparative and Reconstructive Surgery; Microsurgery and Reconstructive Surgery Group of the Orthopedics Branch of the Chinese Medical Association. Chinese guideline for the diagnosis and treatment of osteonecrosis of the femoral head in adults. Orthoped Surgery. 2017;9(1):3–12. doi: 10.1111/os.12302. [DOI] [PMC free article] [PubMed] [Google Scholar]
- 2.Zhao D, Cui D, Wang B, et al. Treatment of early stage osteonecrosis of the femoral head with autologous implantation of bone marrow-derived and cultured mesenchymal stem cells. Bone. 2012;50(1):325–30. doi: 10.1016/j.bone.2011.11.002. [DOI] [PubMed] [Google Scholar]
- 3.Su P, Zhang L, Peng Y, et al. A histological and ultrastructural study of femoral head cartilage in a new type II collagenopathy. Int Orthoped. 2010;34(8):1333–39. doi: 10.1007/s00264-010-0985-9. [DOI] [PMC free article] [PubMed] [Google Scholar]
- 4.Mont MA, Cherian JJ, Sierra RJ, et al. Nontraumatic osteonecrosis of the femoral head: Where do we stand today? A ten-year update. J Bone Joint Surg. 2015;97:1604–27. doi: 10.2106/JBJS.O.00071. [DOI] [PubMed] [Google Scholar]
- 5.Matsuo K, Hirohata T, Sugioka Y, et al. Influence of alcohol intake, cigarette smoking, and occupational status on idiopathic osteonecrosis of the femoral head. Clin Orthoped Rel Res. 1988;(234):115–23. [PubMed] [Google Scholar]
- 6.Hirota Y, Hirohata T, Fukuda K, et al. Association of alcohol intake, cigarette smoking, and occupational status with the risk of idiopathic osteonecrosis of the femoral head. Am J Epidemiol. 1993;137(5):530–38. doi: 10.1093/oxfordjournals.aje.a116706. [DOI] [PubMed] [Google Scholar]
- 7.Zhu ZH, Gao YS, Luo SH, et al. An animal model of femoral head osteonecrosis induced by a single injection of absolute alcohol: An experimental study. Med Sci Monit. 2011;17(4):97–102. doi: 10.12659/MSM.881708. [DOI] [PMC free article] [PubMed] [Google Scholar]
- 8.Wang C, Wang J, Zhang Y, et al. A canine model of femoral head osteonecrosis induced by an ethanol injection navigated by a novel template. Int J Med Sci. 2013;10(11):1451–58. doi: 10.7150/ijms.6314. [DOI] [PMC free article] [PubMed] [Google Scholar]
- 9.Wezeman FH, Gong Z. Adipogenic effect of alcohol on human bone marrow-derived mesenchymal stem cells. Alcoholism. 2004;28(7):1091–101. doi: 10.1097/01.alc.0000130808.49262.f5. [DOI] [PubMed] [Google Scholar]
- 10.Cui Q, Wang Y, Saleh KJ, et al. Alcohol-induced adipogenesis in a cloned bone-marrow stem cell. J Bone Joint Surg. 2006;88(3):148–54. doi: 10.2106/JBJS.F.00534. [DOI] [PubMed] [Google Scholar]
- 11.Wang Y, Li Y, Mao K, et al. Alcohol-induced adipogenesis in bone and marrow: A possible mechanism for osteonecrosis. Clin Orthoped Rel Res. 2003;410(410):213–24. doi: 10.1097/01.blo.0000063602.67412.83. [DOI] [PubMed] [Google Scholar]
- 12.Wang XS, Zhuang QY, Weng XS, et al. Etiological and clinical analysis of osteonecrosis of the femoral head in Chinese patients. Chinese Med J. 2013;126(2):290–95. [PubMed] [Google Scholar]
- 13.Fukushima W, Fujioka M, Kubo T, et al. Nationwide epidemiologic survey of idiopathic osteonecrosis of the femoral head. Clin Orthoped Rel Res. 2010;468(10):2715–24. doi: 10.1007/s11999-010-1292-x. [DOI] [PMC free article] [PubMed] [Google Scholar]
- 14.Weinstein RS. Glucocorticoid-induced osteonecrosis. Endocrine. 2012;41(2):183–90. doi: 10.1007/s12020-011-9580-0. [DOI] [PMC free article] [PubMed] [Google Scholar]
- 15.Zhang M, Shi CY, Zhou ZL, Hou JF. Bone characteristics, histopathology, and chondrocyte apoptosis in femoral head necrosis induced by glucocorticoid in broilers. Poultry Sci. 2017;96(6):1609–14. doi: 10.3382/ps/pew466. [DOI] [PubMed] [Google Scholar]
- 16.Okazaki S, Nishitani Y, Nagoya S, et al. Femoral head osteonecrosis can be caused by disruption of the systemic immune response via the toll-like receptor 4 signalling pathway. Rheumatol. 2009;48(3):227–32. doi: 10.1093/rheumatology/ken462. [DOI] [PubMed] [Google Scholar]
- 17.Okazaki S, Nagoya S, Matsumoto H, et al. Development of non-traumatic osteonecrosis of the femoral head requires toll-like receptor 7 and 9 stimulations and is boosted by repression on nuclear factor kappa B in rats. Lab Invest. 2015;95(1):92–99. doi: 10.1038/labinvest.2014.134. [DOI] [PMC free article] [PubMed] [Google Scholar]
- 18.World Medical Association Declaration of Helsinki. Ethical principles for medical research involving human subjects. JAMA. 2013;310(20):2191–94. doi: 10.1001/jama.2013.281053. [DOI] [PubMed] [Google Scholar]
- 19.Jiang T, Xu G, Wang Q, et al. In vitro expansion impaired the stemness of early passage mesenchymal stem cells for treatment of cartilage defects. Cell Death Dis. 2017;8(6):e2851. doi: 10.1038/cddis.2017.215. [DOI] [PMC free article] [PubMed] [Google Scholar]
- 20.Youm YS, Lee SY, Lee SH. Apoptosis in the osteonecrosis of the femoral head. Clin Orthoped Surg. 2010;2(4):250–55. doi: 10.4055/cios.2010.2.4.250. [DOI] [PMC free article] [PubMed] [Google Scholar]
- 21.Robinson D, Ash H, Yayon A, et al. Characteristics of cartilage biopsies used for autologous chondrocytes transplantation. Cell Transplant. 2001;10(2):203–8. [PubMed] [Google Scholar]
- 22.Tew SR, Li Y, Pothacharoen P, et al. Retroviral transduction with SOX9 enhances re-expression of the chondrocyte phenotype in passaged osteoarthritic human articular chondrocytes. Osteoarth Cartil. 2005;13(1):80–89. doi: 10.1016/j.joca.2004.10.011. [DOI] [PubMed] [Google Scholar]
- 23.Feng ZY, He ZN, Zhang B, Chen Z. Osteoprotegerin promotes the proliferation of chondrocytes and affects the expression of ADAMTS-5 and TIMP-4 through MEK/ERK signaling. Mol Med Rep. 2013;8(6):1669–79. doi: 10.3892/mmr.2013.1717. [DOI] [PubMed] [Google Scholar]
- 24.Mendler M, Eich-Bender SG, Vaughan L, et al. Cartilage contains mixed fibrils of collagen types II, IX, and XI. J Cell Biol. 1989;108(1):191–97. doi: 10.1083/jcb.108.1.191. [DOI] [PMC free article] [PubMed] [Google Scholar]
- 25.Crisafulli A, Altavilla D, Squadrito G, et al. Effects of the phytoestrogen genistein on the circulating soluble receptor activator of nuclear factor kappaB ligand-osteoprotegerin system in early postmenopausal women. J Clin Endocrinol Metab. 2004;89(1):188–92. doi: 10.1210/jc.2003-030891. [DOI] [PubMed] [Google Scholar]


