Summary
The planarian Schmidtea mediterranea is an important model for stem cell research and regeneration. We report the first highly contiguous genome assembly of Schmidtea mediterranea, using long-read sequencing and a de novo assembler (MARVEL) enhanced for low complexity reads. The S. mediterranea genome is highly polymorphic and repetitive genome, and harbors a novel class of giant Gypsy retroelements. Further, the genome assembly lacks a number of highly conserved genes, including critical components of the mitotic spindle assembly checkpoint, yet planarians maintain checkpoint function. Our genome assembly provides a key model system resource that will be useful for studying regeneration and the evolutionary plasticity of cell biological core mechanisms.
Introduction
Rapid regeneration from tiny tissue pieces makes planarians a prime model system for regeneration. Abundant adult pluripotent stem cells termed neoblasts power regeneration and the continuous turn-over of all cell types1–3 and transplantation of a single neoblast can rescue a lethally irradiated animal4. Planarians therefore constitute also a prime model system for stem cell pluripotency and its evolutionary underpinnings5. The taxonomic clade Platyhelminthes (“flatworms”) also harbors parasitic lineages with a massive impact on human health, such as blood flukes (Trematoda) and tape worms (Cestoda)6. Here, the phylogenetic position of planarians as free-living flatworms7 provides a reference point towards an understanding of the evolution of parasitism8.
Despite modest genome sizes mostly in the range of 1-2 Gbp, planarian genome resources are so far limited. Although the model species Schmidtea mediterranea (Smed) was sequenced by Sanger sequencing, even 11.6x coverage of ~600 bp Sanger reads yielded only a highly fragmented assembly (N50 19 Kbp)9. Recent high coverage short-read approaches yielded similarly fragmented assemblies10,11. The high A/T content of ~70% represents one known assembly challenge. Further, standard DNA isolation procedures perform poorly on planarians, which so far precluded the application of long-read sequencing approaches or BAC-clone scaffolding.
We here report a first highly contiguous PacBio SMRT long-read sequencing12 assembly of the Smed genome. Giant Gypsy/Ty3 retroelements, abundant AT-rich microsatellites and inbreeding-resistant heterozygosity collectively provide an explaination for why previous short-read approaches were unsuccessful. We find a loss of gene synteny in the genome of S. mediterranea and other flatworms. In analysis of highly conserved genes, we find a loss of MAD1 and MAD2, suggesting a MAD1-MAD2 independent spindle assembly check point. Our Smed genome assembly provides a resource for probing the evolutionary plasticity of cell biological core mechanisms, as well as the genomic underpinnings of regeneration and the many other fascinating phenomena that planarians so uniquely expose to experimental scrutiny.
Results
De novo long read assembly of the planarian genome
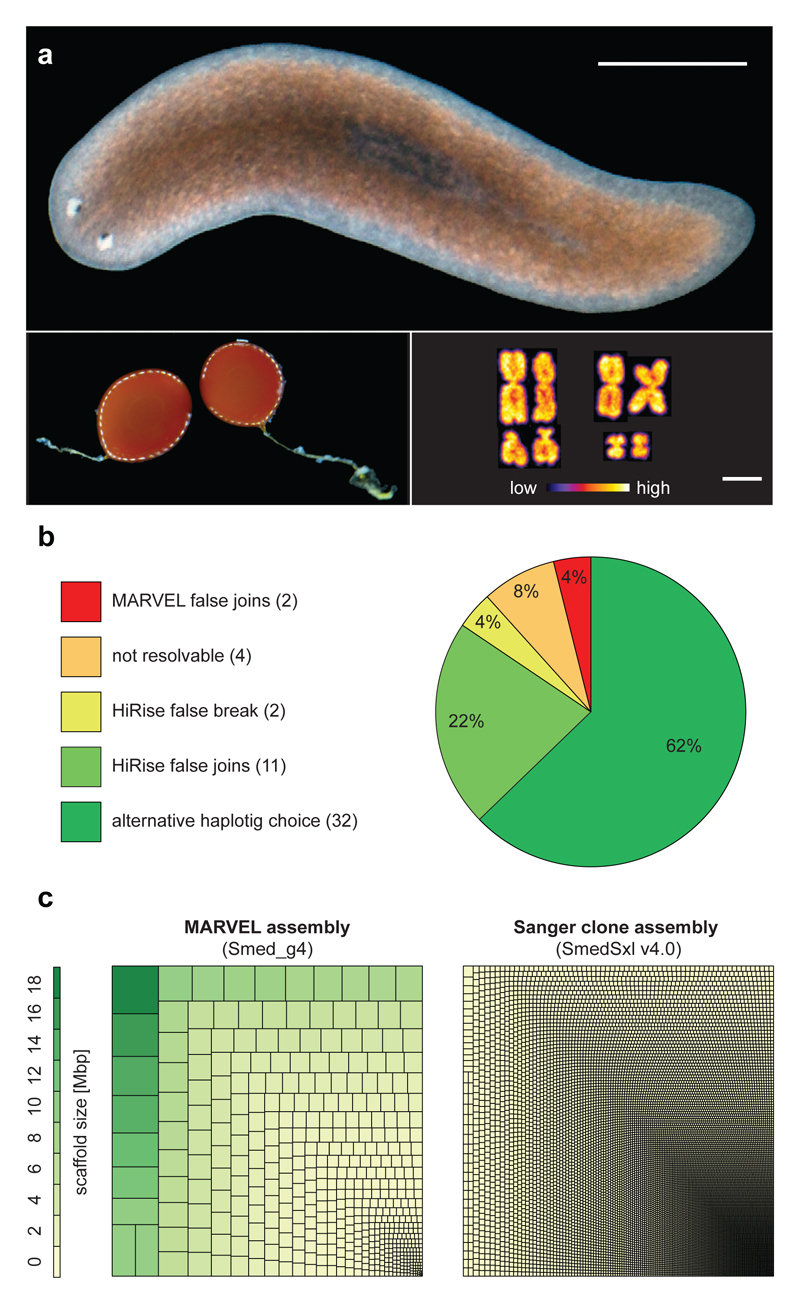
In preparation for genome sequencing, we inbred the sexual strain of S. mediterranea (Smed) (Fig. 1a) for > 17 successive sib-mating generations in the hope of decreasing heterozygosity. Further, we developed a new DNA isolation protocol that meets the purity and high molecular weight requirements of PacBio long-read sequencing12 (Extended Data Fig. 1a-d, Supplementary Information S1-2). We used MARVEL, a new long-read genome assembler developed for low complexity read data (Supplementary Information S3, Nowoshilow et al., The axolotl genome and the evolution of key tissue formation regulators. Nature https://doi.org/10.1038/nature25458 (2018). An initial de novo MARVEL assembly of reads > 4 kbp with approximately 60x genome coverage show improvement over Canu, the PacBio assembly tool (Canu15) and showed substantial improvements over existing Smed assemblies based on short read sequencing (Extended Data Table 1). We further made use of the Chicago/HiRise in vitro proximity ligation method16 for scaffolding (Extended Data Fig. 1e, Supplementary Information S4). The polished haplotype-filtered (see below) and error-corrected (Supplementary Information S5) Smed assembly consists of 481 scaffolds with a N50 length of 3.85 Mbp (Extended Data Table 1).
Figure 1. Long-range contiguous genome assembly of S. mediterranea (Smed).
a) Individual of the sequenced sexual strain. Left: Egg cocoons. Right: Karyotype (2N = 8). Scale bars: 2 mm and 2.5 µm. b) Chicago quality control of the assembly. c) Treemap comparison between the MARVEL Smed assembly and the most contiguous existing Smed Sanger assembly10. Squares encode the relative contribution of individual scaffolds/contigs to assembly size.
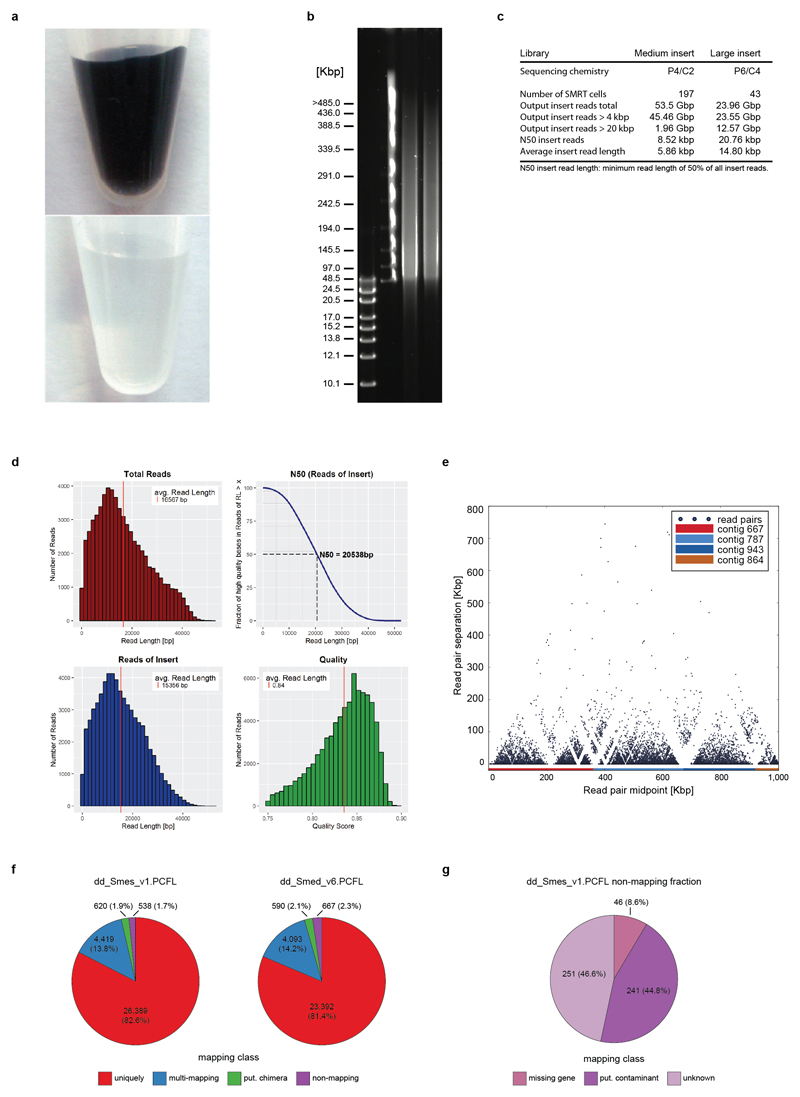
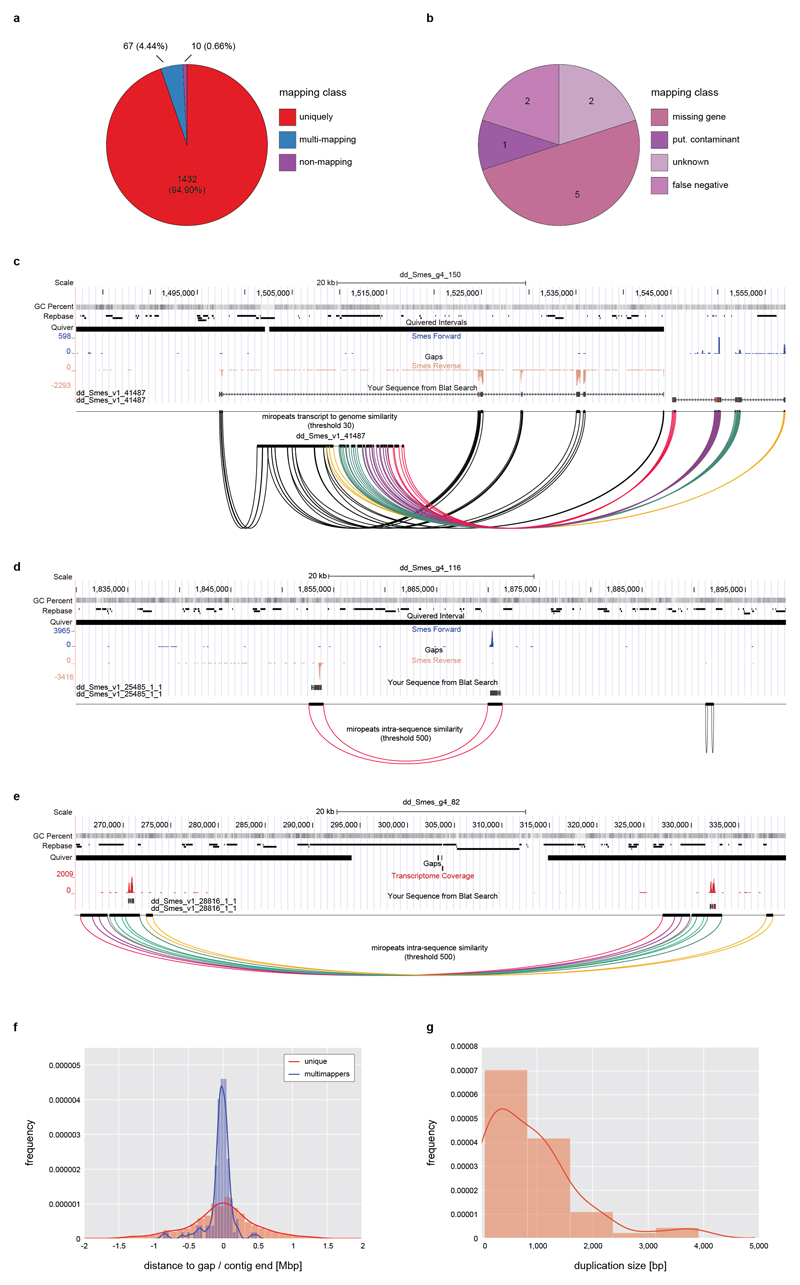
To assess the quality of this genome assembly, we back-mapped a transcriptome of the sequenced strain (Supplementary Information S6) and found mapping of >99 % of transcripts, thus confirming both near-completeness and accuracy of the assembly (Supplementary Information S7, Extended Data Fig. 1f,g). To assess global assembly contiguity, we analyzed structural conflicts between the MARVEL assembly and Chicago/HiRise scaffolding. Out of a total of 51 such events across the 782.1 Mbp of assembled genome sequence, only two represented unambiguous MARVEL assembly mistakes (Fig. 1b, Supplementary Information S4.3). Further, high-stringency back-mapping of high confidence cDNA sequences (Supplementary information S7.3) confirmed assembly contiguity below the ~ 1 kbp resolution limit of the Chicago/HiRise method, with small-scale sequence duplications near assembly gaps as only minor inconsistencies (Extended Data Fig. 2).
Our Smed genome assembly represents a major improvement over existing Smed assemblies10 (Fig. 1c) and more generally, the first long-range contiguous assembly of a non-parasitic flatworm species. A UCSC genome browser instance with supplemental quality control, annotation and experimental data tracks (Supplementary Information S8) is available at PlanMine17 (http://planmine.mpi-cbg.de). All analyses in this manuscript refer to the assembly release version dd_Smed_g4. The current source code of the MARVEL assembler is available at https://github.com/schloi/MARVEL. The execution scripts used for Smed can be found in the respective subfolder of the examples folder.
Assembly challenges in the Smed genome
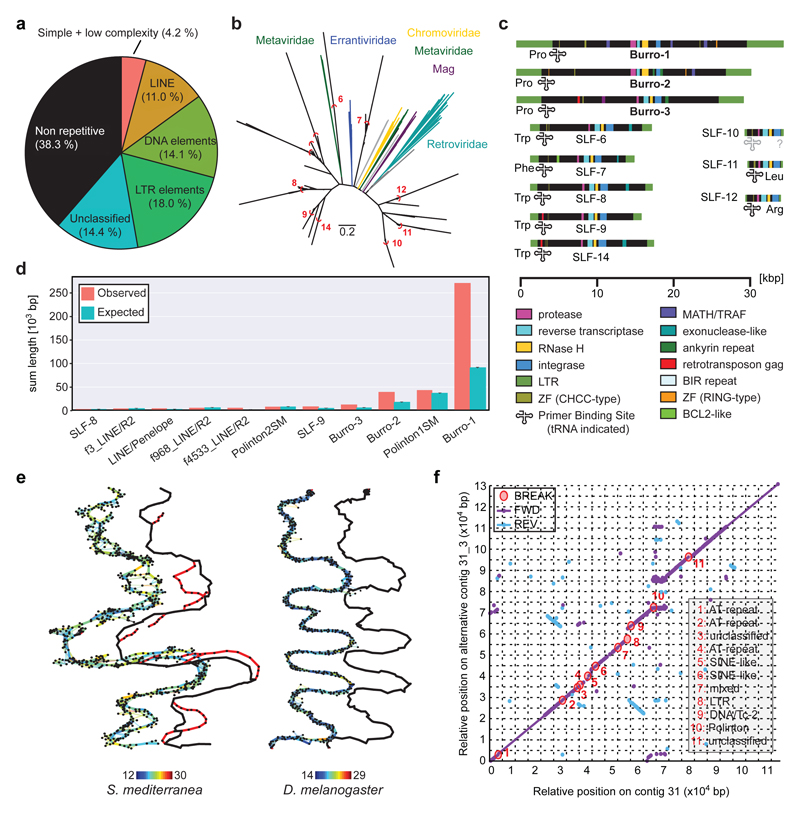
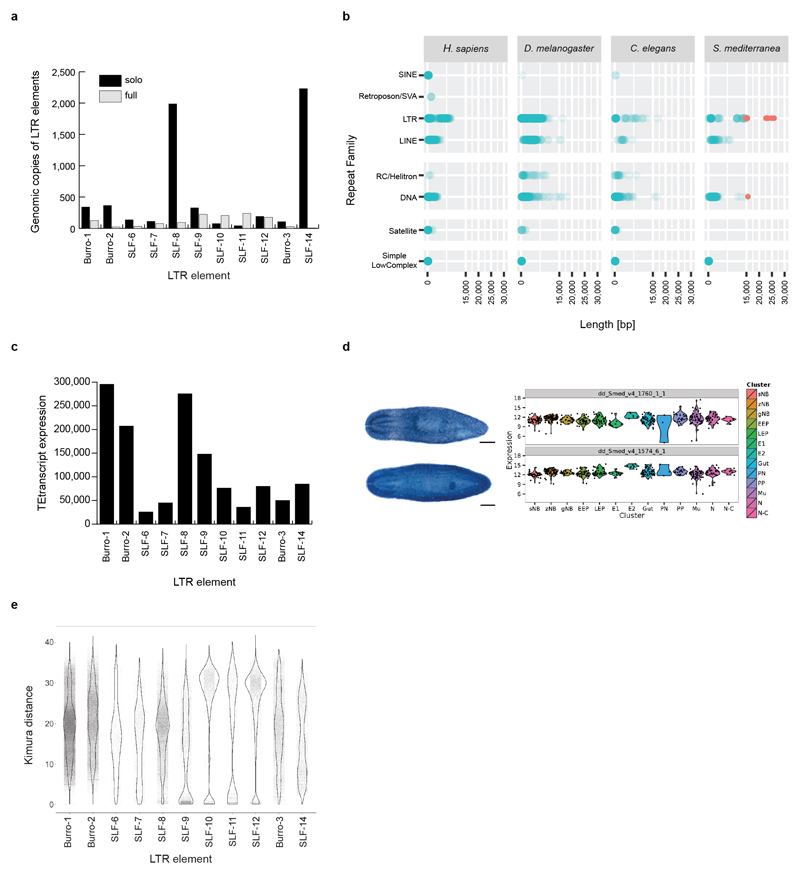
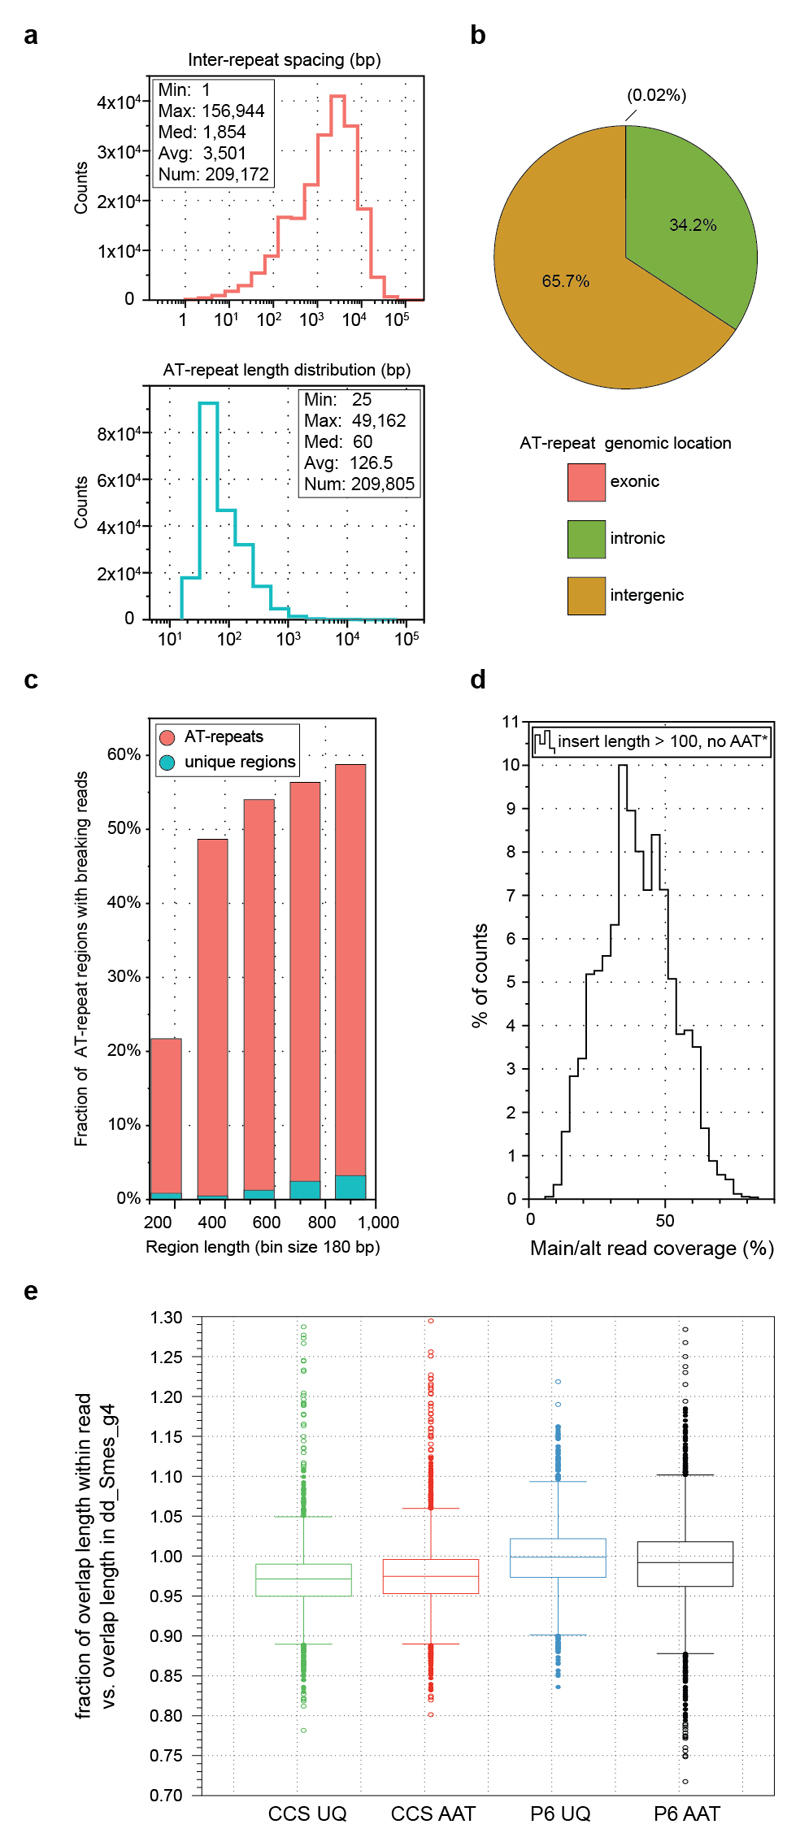
To understand why the Smed genome was recalcitrant to prior short-read assembly, we first analyzed its repeat content (Supplementary Information S9). A repetitive fraction of 61.7 % (Fig. 2a) significantly exceeds the 38 % or 46 % repeat content of the mouse or human genomes18. We detected > 7,000 insertions of 11 distinct families of Long Terminal Repeat (LTR) retroelements (Fig. 2b; Extended Data Fig. 3a, Supplementary Information S10). These do not cluster with known Metaviridae (Fig. 2b), suggesting that they represent either extremely divergent or so far undescribed retroelement families. Three families reach an exceptional size of > 30 kbp, which is more than 3-times longer than the 5-10 kbp typically observed in vertebrates (Fig. 2c, Extended Data Fig 3b). The only known similar-sized LTRs are the plant-specific Ogre-elements19, which is why we refer to the giant Smed repeat families Burro (Big, Unknown Repeat Rivaling Ogre; Supplementary Information S10.3). Burro elements are pervasively transcribed (Extended Data Fig. 3c,d. Supplementary Information S10.4), yet their high degree of intra-family sequence divergence suggests a relatively ancient invasion (Supplementary Table 1, Supplementary Information S10.5, Extended Data Fig. 3e). Burro-1, with 130 fully assembled copies the most abundant giant retroelement, is highly overrepresented at contig ends and 50 % of all current scaffolds terminate in a Burro-1 element (Fig. 2d, Supplementary Information S10.6). Therefore, these abundant > 30 kbp repeat elements still limit the size of the current assembly. Additionally, abundant AT-rich microsatellite regions disrupt the alignment of spanning reads and thus also reduce contig contiguity (Extended data Fig. 4, Supplementary Information S11). Finally, the Smed assembly graphs showed substantial structural heterogeneity (Supplementary Information S12) in form of bubbles (transient divergences in sequencing read alignments) and spurs (divergences without re-connection), which were largely absent from a comparable genome assembly, of Drosophila melanogaster using PacBio sequencing and MARVEL aseembly (Fig. 2e, Supplementary Information S12.1) or 17 other species (Supplementary Table 2). Prominent causes of assembly divergences were heterozygous mobile element insertions or microsatellite tracts (Figure 2f, Extended Data Fig 4d, Supplementary Information S12.3). The persistence of substantial genomic heterozygosity in spite of 17 successive sib-mating generations confirms inefficient meiotic recombination in Smed20.
Figure 2. Smed Assembly challenges.
a) Repeat content of the assembly. b) Long Terminal Repeat (LTR) family phylogeny. Known LTR families are shown in colour, Smed LTR families in black. Red arcs delimit clusters for consensus calculation. Scale bar: 0.2 substitutions/site. c) Domain annotation of the 11 Smed LTR families. SLF: Smed LTR Family. d) Enrichment analysis of indicated repeat elements within the terminal 1,000 bp of all scaffolds (n = 962). “Expected” represent mean repeat frequency with 95% bootstrap CI (n = 1,000). e) Graphical representation of representative ~1.6 Mbp and ~1.7 Mbp segments of Smed (left) and D. melanogaster (right) MARVEL PacBio assembly graph segments. Thick lines: Consensus sequence; thin lines: individual read alignments; Colour-coding: alignment quality (blue: low, red: high); black marks: repeats. The contig tour of the final haploid genome assembly is shown offset to the right, alternative regions are shown in red. f) Dot plot comparison between a representative alternative region and the corresponding main contig. Fwd: Forward match. Rev: Reverse match. Break: insertions/deletions > 99 bp. Break annotations (right) list repeat categories that cover > 60% of the insertion/deletion sequence, “mixed” indicates contributions of multiple repeat classes.
Overall, the combination of giant repeat elements, low-complexity regions and inbreeding-resistant heterozygosity provides an explanation for why prior short-read sequencing assemblies of Smed have proven so challenging. The long-range contiguity that we achieved in the Smed genome assembly and similarly substantial improvements of the recently published PacBio genome assembly of the flatworm species Macrostomum lignano21 (Supplementary Table 2), further emphasizes the improvements that the combination of long-read sequencing with our MARVEL assembler offers in the assembly of challenging genomes.
Comparative analysis of the planarian gene complement
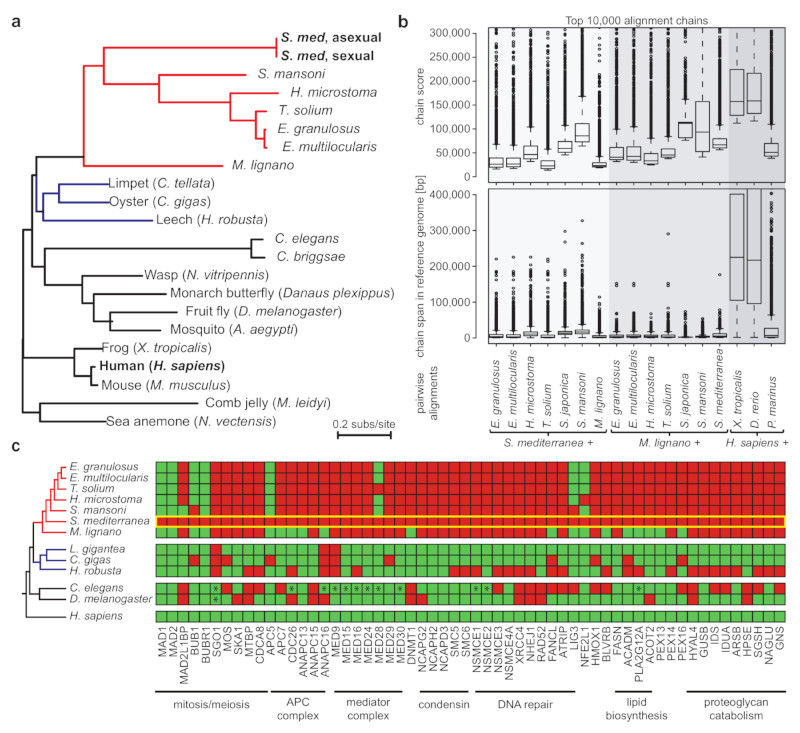
We next annotated the Smed gene complement, relying on our planarian transcriptome resources17 (Supplementary Information S13). Our analysis showed a high divergence of Smed gene sequences (Supplementary Information S14) en par with Caenorhabditis elegans (Fig. 3a). In contrast, the low degree of sequence substitutions between the sexual and asexual Smed strains (Fig. 3a) and nearly identical mapping statistics of the two transcriptomes to the genome (Supplementary Information S7.1, Extended Data Fig. 1f) establish the utility of our assembly for both strains.
Figure 3. Genome divergence of Smed and other flatworms.
a) Protein sequence divergence amongst 51 single copy genes (Supplementary Table 3). Branch length: substitutions per site, color coding: flatworms (red) and lophotrochozoan outgroups (blue). b) Whole genome alignments of Smed, M. lignano and H. sapiens against the indicated reference genomes. The distribution of the alignment score (top) and alignment span (bottom) of the top 10,000 chains of co-linear alignments is shown as box plots, with boxes indicating the 1st quartile, the median and the 3rd quartile with whiskers extending up to 1.5 times the interquartile distance. Outliers are defined as > 1.5 times the interquartile and are shown as dots. c) Presence (green) or absence (red) of highly conserved genes in the indicated species. The yellow box highlights Smed. *: homologues secondarily identified by manual searches.
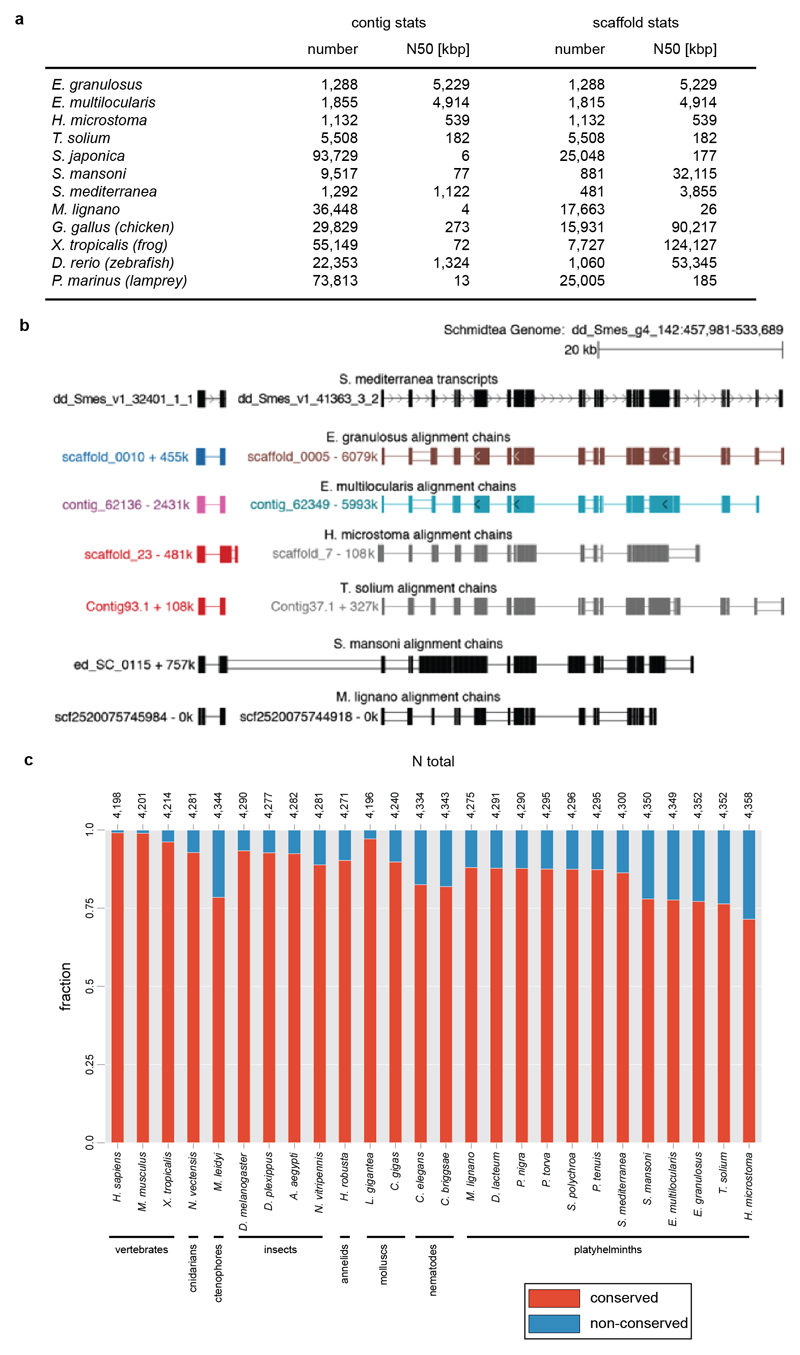
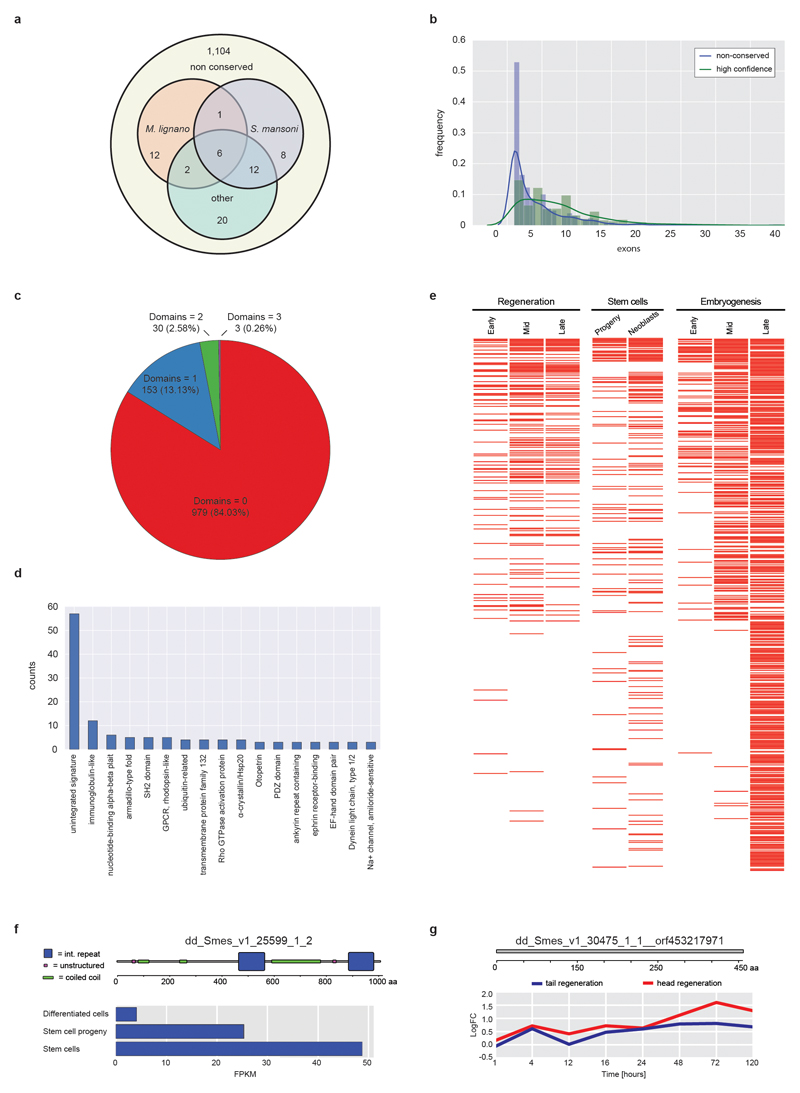
To evaluate the Smed genome structure, we performed whole genome alignments (Supplementary Information S15) with the available parasitic flatworm genomes6 and a draft genome of the platyhelminth M. lignano21 (Fig. 3b). The highest alignment similarity was found between Smed and the parasitic flatworm Schistosoma mansoni, which is consistent with the platyhelminth phylogeny7. However, alignments were mostly limited to individual exons of specific genes irrespective of the quality of the various assemblies (Extended Data Fig. 5a,b). In general, flatworm genome comparisons resulted in alignment chains much shorter and lower-scoring than those obtained from comparisons across the tetrapod (human-frog) or vertebrate (human-zebrafish) clade (Fig. 3b). Together with likely > 1,000 planarian-specific protein coding genes (Supplementary Information S16; Supplementary Table 5, Extended Data Figure 6a-g), our data show a high degree of genome divergence in Smed and other flatworms.
We therefore next investigated gene loss in planarians. Our analysis deliberately focused on highly conserved genes, such that the absence of sequence similarity alone provides a strong indication of loss (Supplementary Information S17). We identified 452 highly conserved gene losses shared between Smed and other planarians (Fig. 3c), which compares to 284 and 757 such losses in D. melanogaster and C. elegans (Extended Data Fig. 5c). Gene loss in planarians is therefore broadly in range with established invertebrate model organisms. However, the lost genes included 124 homologues of essential genes in humans or mice (Supplementary Table 6) and generally key components of multiple cell biological core mechanisms (Fig. 3c). Specifically, planarians lack multiple highly conserved components of DNA double strand break (DSB) repair, including Rad52, XRCC4, XLF, SMC5/6 and the entire condensin II complex22. A possibly consequent reliance on mutagenic DSB repair pathways (e.g., micro-homology mediated end joining)23 could account for both the abundance of microsatellite repeats and the structural divergence of the Smed genome (Fig. 3b), but raises questions regarding the extraordinary resistance of planarians to DSB inducing γ-irradiation4.
Further, planarians are missing recognizable homologues of key metabolic genes. Loss of Fatty Acid Synthase (FASN) is striking in face of its essential role in eukaryotic de novo fatty acid synthesis and may indicate a particular dependence of planarians on dietary lipids. The loss of the heme break-down enzymes HMOX1 and BRVB despite maintained heme biosynthesis capacity24 is similarly unusual for a free living eukaryote (C. elegans lost both25). Remarkably, the above and multiple other genes were missing not only in planarians, but also in the parasite genomes6 and the transcriptome of the macrostomid M. lignano26 (Fig. 3c). Given their broad conservation in the lophotrochozoan sister clade, their broad absence in flatworms represents a likely ancestral loss. This complicates for example the interpretation of FASN loss in the parasitic lineages as specific adaptation to parasitism6. Conversely, the absence of key metabolic genes as phylogenetic signal underscores the utility of free-living flatworms as model systems for the parasitic lineages and the development of anti-helminthic reagents8.
A Mad1/Mad2-independent spindle check-point?
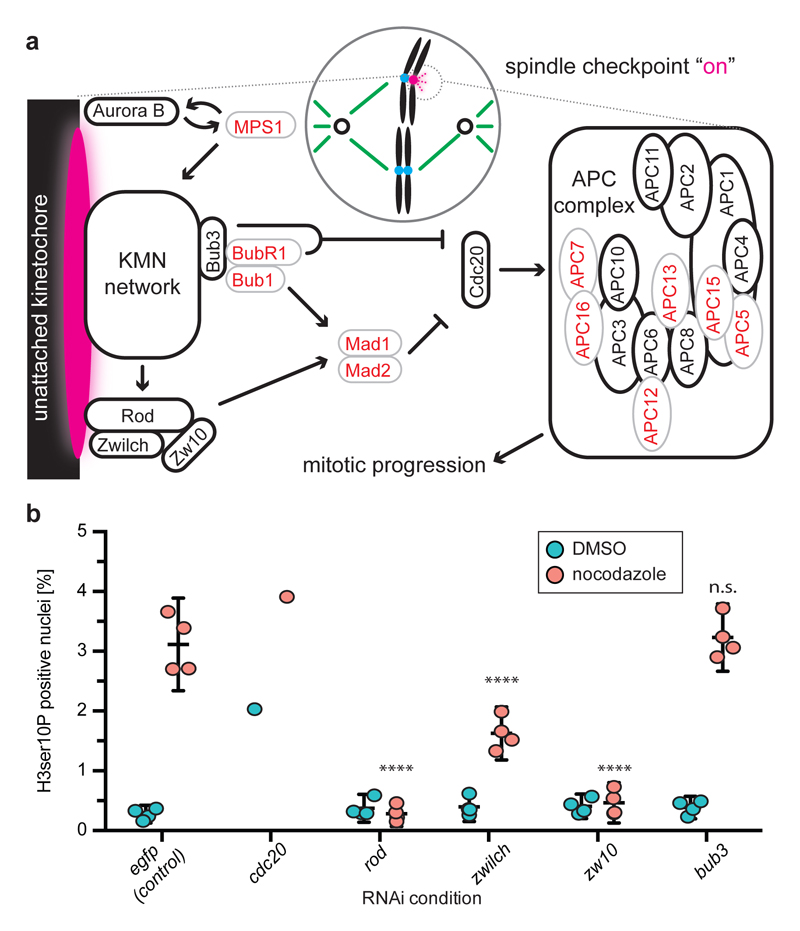
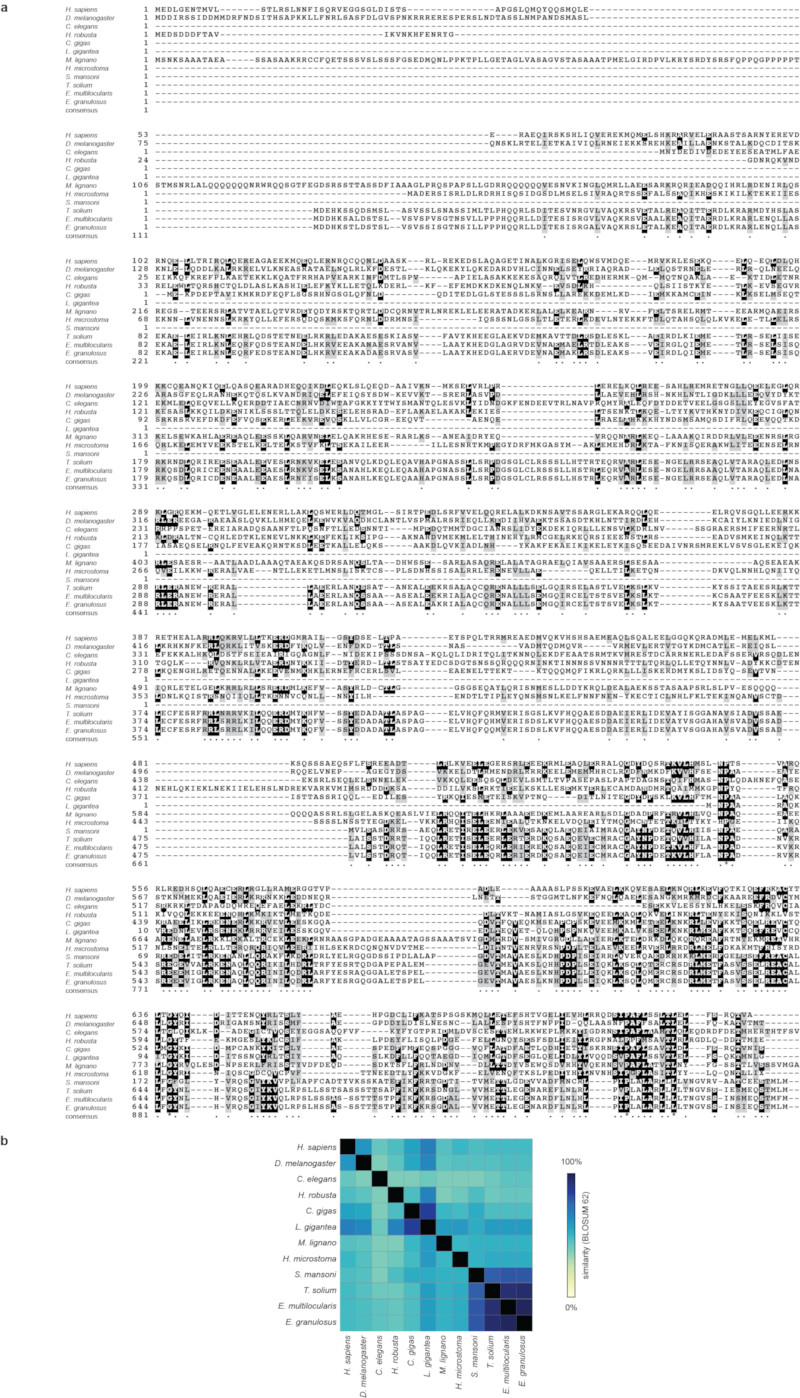
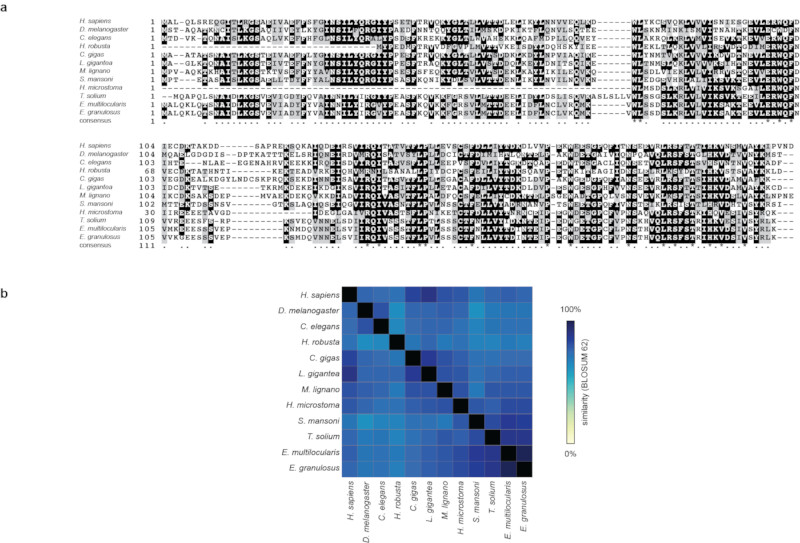
The apparent absence of Mad1 and Mad2 in planarians (Fig. 3c) raises the question of whether planarians have a functional SAC, and how essential cellular functions can be maintained in absence of supposed core components. Both are near-universally conserved due to essential roles in the spindle assembly checkpoint (SAC), which guards against aneuploidy27 by inhibiting cell cycle progression as long as even a single chromosome remains unattached to the mitotic spindle14. Though Mad1 and Mad2 homologues are easily identifiable in all other flatworms examined (Extended Data Figure 7, 8), not even flatworm queries could identify significant homologues in Smed or the transcriptomes of 5 other planarian species. Therefore, planarians have very likely lost Mad1, Mad2 and multiple other SAC components (Fig. 4a). The known M-phase arrest of planarian cells upon pharmacological interference with spindle function28 (Fig. 4b) is therefore remarkable, as it indicates the maintenance of a SAC-like response despite a lack of supposed SAC core components.
Figure 4. Spindle assembly checkpoint (SAC) function in likely absence of Mad1:Mad2.
a) Cartoon illustration of SAC core components and function. Black/Red: Components conserved/missing in Smed. KMN network: KNL1, MIS12 complex, NDC80 complex. b) Fractional abundance of mitotic cells under RNAi of the indicated SAC components, with (red) and without (cyan) nocodazole pre-treatment. Values are shown as mean with 95% confidence intervals (n=4 biological replicates, 10 pooled animals, 5 technical replicates with 5-6 images each). cdc20(RNAi) is shown as single replicate due to rapid stem cell loss (Supplementary Information S18, Extended Data Fig. 9a, b). TSignificance assessment by two-way ANOVA, followed by Dunnett’s post-hoc test (****P < 0.0001; n.s. not significant), excluding cdc20(RNAi).
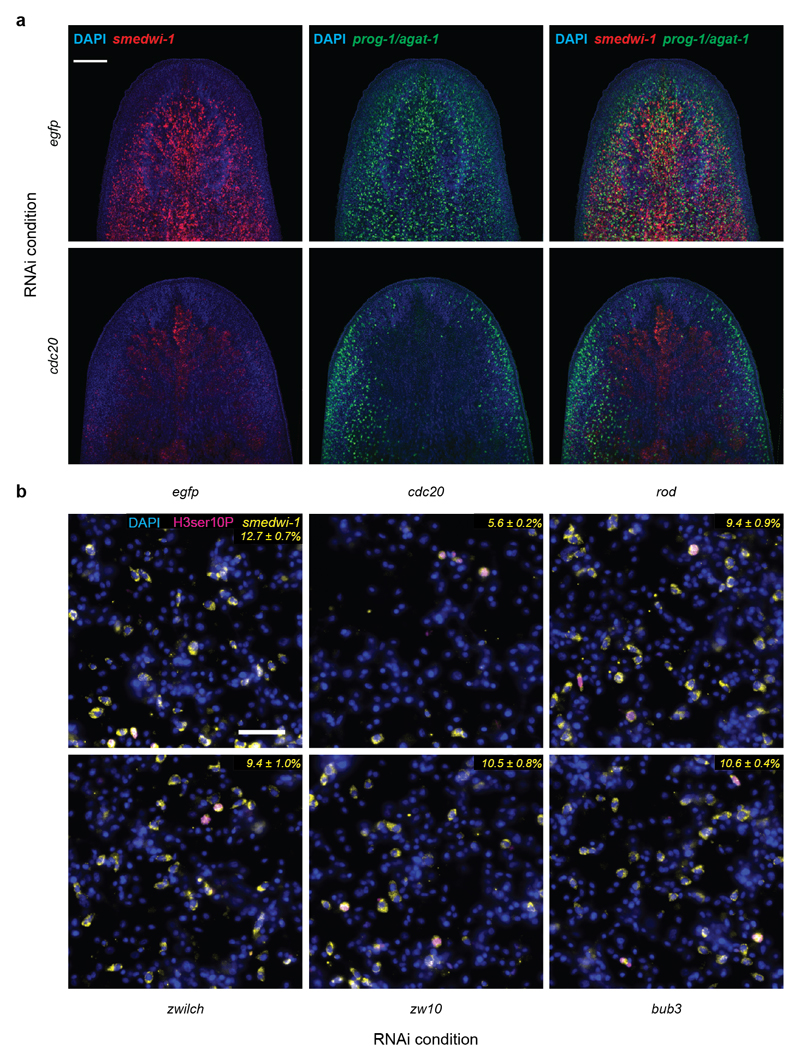
In order to explore the underlying mechanisms, we targeted remaining components of the SAC network (Fig. 4a) by RNA interference (RNAi) and quantified the fraction of M-phase arrested cells with or without the microtubule depolymerizing drug nocodazole (Fig. 4b, Supplementary Information S18). The dramatic increase in the proportion of M-phase cells and subsequent loss under RNAi of Cdc20 (Fig. 4b, Extended Data Figure 9a) or the APC/C subunit Cdc2329 indicate that APC/C inhibition remains rate limiting for planarian M-phase progression. The SAC-mediated regulation of Cdc20 in human cells involves the recruitment of Mad1 and Mad2 to the kinetochore by two molecular complexes thought to act in parallel, the broadly conserved Knl1-Bub3-Bub1 (KBB) complex and the Rod-Zw10-Zwilch (RZZ) complex that has been studied less because of its absence in yeast (Fig. 4a)30. Lack of clear Knl1 and Mis12 homologues and lack of a cell cycle phenotype of bub3(RNAi) (Fig. 4b) jointly indicate that planarians have lost the entire KBB complex. However, we could identify clear RZZ complex homologues and intriguingly, their knock-down prevented the nocodazole-mediated M-phase arrest without affecting basal stem cell numbers or proliferation (Fig. 4b, Extended Data Figure 9b). Therefore, planarian Rod-Zwilch-Zw10 either control APC/C-Cdc20 independently of Mad1/Mad2 or in concert with homologues that have lost defining sequence features (Extended Data Figure 6, 7). Our results motivate the examination of putative Mad1/2 independent roles of the Rod-Zwilch-Zw10 complex also in other model systems and, together with the striking evolutionary plasticity of the SAC network in eukaryotes13, generally challenge our understanding of a cell biological core mechanism.
Discussion
We here report the first highly contiguous genome sequence of the planarian model species Schmidtea mediterranea, which enables the genomic analysis of whole body regeneration, stem cell pluripotency, lack of organismal ageing and other fascinating features of this model system. The resulting bird’s eye view of a “difficult” genome using long-read sequencing and de novo assembly also highlights significant challenges remaining to be overcome. In the case of Smed, these include an abundance of low complexity microsatellite repeats, inbreeding-resistant heterozygosity and a new class of extraordinarily long LTR elements. However, the fact that the scaffold size of newly reported genome assemblies often remains significantly below the 3.7 Mbp of the Smed assembly (Extended Data Table 1) indicates that similar challenges may be wide-spread. We therefore expect that the specific improvements of the MARVEL assembler towards heterozygous and/or compositionally biased sequencing data (Novojilow et al., coordinated in press at Nature) will be useful for enhancing assembly contiguity in de novo genome sequencing projects.
Our genome assembly also shows a high extent of structural rearrangements and the absence of a number of conserved genes in the Smed genome. However, also D. melanogaster, C. elegans or other animals show loss of “essential” genes13,25,31, which raises a general conundrum: How can animals survive and compete while lacking core components of essential mechanisms? In cell biological terminology, “core mechanism” signifies a chain of molecular interactions that explain a given process in multiple species, while “essentiality” indicates importance for organismal survival. The emergence of viable yeast strains upon deletion of essential genes32 or the competitiveness of hundreds of extant planarian species in a diversity of habitats worldwide33 both relativize “essentiality”. Our demonstration of SAC function in likely absence of Mad1 and Mad2 suggests that our genetic and mechanistic understanding of SAC function is incomplete. Further studies on planarians and other “non-traditional” model organisms are needed to understand the basis and mechanism of these cellular functions. Such function-oriented, rather than gene-centric view of biological mechanism abstracts general function from individual molecules and is therefore likely to ultimately also facilitate the reverse engineering of biology.
Extended Data
Extended Data Figure 1. Smed sequencing and assembly quality control.
a) Smed genomic DNA preparations: The established protocol (top) yields a black solution due to co-purification of porphyrin pigments. Bottom: improved protocol, which removes contaminants including the pigment and therefore results in clear preparations. b) The improved protocol consistently yields HMW DNA, as shown by the pulse field gel electrophoresis of two independent preparations (lanes 3, 4) and DNA size markers in lanes 1 and 2. c) Overview of all PacBio sequencing runs for the Smed assembly. d) Sequencing statistics of a representative PacBio RS II SMRT cell (P6/C4 chemistry). Total output: 1,053.4 Mbp, Reads of insert: 976.4 Mbp, maximal read length: 52,441 bp. e) Connectivity matrix plot illustrating Chicago library read-pair distances after HiRise scaffolding. Colour coding identifies individual contigs contributing to the scaffold dd_Smed_g4_1. f) Mapping characteristics of Smed transcriptomes against the genome assembly with > 60% query coverage and > 60 % sequence identity as cut-off criteria. Left: the dd_Smes_v1.PCFL transcriptome of the sequenced strain. Right: dd_Smed_v6.PCFL transcriptome of the asexual strain. The pie charts visualize the absolute number and relative proportions of transcripts mapping with the indicated characteristics. g) Further analysis of the 538 non-mapping Smes transcripts from e) (see Supplementary Information 7). Missing gene: Transcripts that map uniquely to the SmedSxl v4.0 assembly10 and have annotated orthologues in at least 5 other planarian species in PlanMine17. Putative contaminant: Top RefSeq BLAST hit in a likely contaminant species. Unknown: All remaining transcripts. The fact that only 46 out of 31,966 Smes transcripts are classified as genuinely missing indicates that the Smed assembly is largely complete. In contrast, 1,229 transcripts that uniquely mapped to the Smed genome and had orthologues in at least 5 other planarian species failed to map to the previously published SmedSxl v4.0 assembly10. Substantial gaps in the previous assembly also mean that the number of missing genes in the Smed assembly may be slightly higher, as some may have been classified as “unknown”.
Extended Data Figure 2. Assembly validation by high stringency transcript back-mapping.
a) Quality control of the Smed assembly by means of high stringency back mapping of 1,509 high confidence (HC) cDNAs. HC-cDNAs were defined as having BLAST hits with > 90% query and subject coverage in 7 other planarian transcriptomes in PlanMine17. HC-cDNAs were mapped to the Smed assembly using > 90 % query coverage and sequence identity as cut-off criteria. The pie chart visualizes the absolute number and relative proportions of HC-cDNAs mapping with the indicated characteristics. b) Further analysis of the 10 HC-cDNAs classified as non-mapping from a) by intersection with the mapping results of Extended Data Fig. 1g. These 2 were designated as “false positive”, since both mapped to the Smed genome with > 90 % query coverage and sequence identity using BLAT. c) UCSC genome browser screenshot (75 kbp window) of the genomic mapping location of one of the two “unknown” HC-cDNAs as single example of a mapping failure due to an actual assembly error. The example documents inversion of the 5’-end of the cDNA within a low confidence stretch at a contig end (lack of coverage in the Quiver track). The inversion is supported by i) inverted RNAseq read mapping and ii) inversion of the cDNA sequence shown in the respective tracks. Below: Color-coded Miropeats similarity plots of respective regions. d), e) Examples of genomic mapping loci of HC-cDNA transcripts out of the multi-mapping category in a), browser screen shots as described in c). d) Example of a likely legitimate (biological) gene duplication in a gap-free high confidence region. e) Micro tandem duplication surrounding a scaffolding gap in a repeat rich region. f) Multi-mapping HC-cDNAs map preferentially to contig ends. The histogram graphs the distance of the closest gap or contig end for the 67 multi-mappers and a corresponding number of unique mappers a). g) Estimated size of the duplicated regions of multi-mapping HC-cDNAs. Jointly, this analysis identifies a small fraction of small-scale duplications at assembly gaps in the Smed assembly, which can be easily identified with the help of the various quality control tracks in the PlanMine genome browser.
Extended Data Figure 3. Repeats in the Smed assembly.
a) Abundance estimation of solo and full-length LTR elements in the Smed assembly. Elements SLF-8 and SLF14 show a large number of solo-LTRs compared to full-length copies, indicating a large number of excision events by homologous recombination. Of the Burro elements, Burro-1 was the most abundant with 124 full-length copies, followed by Burro-3 and Burro-2 with 25 and 23 full-length copies, respectively.
b) Length comparison of indicated repeat consensi classes in H. sapiens, D. melanogaster and C. elegans. For Smed, we used a custom library generated in this study. Dark colours indicate predominant lengths of specific repeat classes. Red: repeat consensi with more than 15 kbp in length). c) Expression analysis of gypsy LTR elements in Smed RNAseq data using TETranscripts. The 3 most transcriptionally active elements were Burro-1, Burro-2 and SLF-8. d) LTR Expression analysis by whole mount in situ hybridization and single cell expression data34. Top: SLF-9 derived transcript. Bottom: Burro-1 derived transcript. Both are broadly transcribed in many Smed cell types (CIW4 strain, n=1 biological replicate, 10 animals). Scale bar: 250 µm. e) Kimura distance plot of Smed LTR elements. Substitution levels varied by element, but also within element groups. Burro-1/2/3 and SLF-8 all contain elements spread over a large range of substitution levels, possibly indicative of continued activity over large time scales. The remaining elements are characterised by more defined peaks in expansion, with the highest average divergences being seen in the smallest elements characterized (SLF-10/11/12), making these amongst the oldest within the genome. Interestingly, both SLF-8 and SLF-9 have representative elements with particularly low substitution rates, potentially indicating a recent or ongoing expansion.
Extended Data Figure 4. AT-rich microsatellites in the Smed genome.
a) Features of AT-rich microsatellites. Left: Inter-repeat spacing of repeats > 99 bp in length. Right: Repeat length. AT-rich microsatellites with an average length of 120 bp occur every ~3,500 bp. b) Genomic distribution of repeats > 99 bp in length. c) Increased probability of read alignment termination within microsatellite repeats. Individual size bins were analyzed separately for microsatellite repeats (red) or non-repetitive regions (cyan). Although accounting for only 4.2 % of the assembly size, microsatellite repeats significantly limit assembly contiguity due to an increased probability of read alignment loss. d) Genome-wide coverage ratios of insertion/deletion sequences > 99 bp and excluding AT-repeats.
e) Read length variation analysis across AT-rich repeat regions (AAT) in regular PacBio sequencing data compared to Circular Consensus Sequencing (CCS) coverage of the same region. CCS reads sample the same genomic region multiple times. The lack of a clear difference in the length variation of specific AT-repeats (AAT) between repetitive sequencing of the same DNA molecule (CCS data set) versus sequencing reads representing different DNA molecules (regular PacBio data) indicates that repeat length variations are mainly technical in nature. Rather than repeat length polymorphisms, the most likely cause of the detrimental effect of the repeats is the increased ambiguity in low complexity sequence alignments (Supplementary Information S11.4). Unique (UQ) regions were included as controls. (Green) CCS_UQ: CCS subread length variation versus the consensus length of all subreads in binned unique regions (n = 3300). (Red) CCS_UQ: CCS subread length variation versus the consensus length of all subreads in binned AT-repeat regions (n = 4825). (Blue) P6_UQ: Length variation of individual reads in the regular PacBio sequencing data (P6/C4) versus the consensus length of the region in the Smed assembly in binned unique regions (n = 3310). (Black) P6_AT: Length variation of individual reads in the regular PacBio sequencing data (P6/C4) versus the consensus length of the region in the Smed assembly in binned AT-repeat regions (n = 5085). Dots: outliers, horizontal line in the middle of the box: 2nd quartile == median, box ranges: from 1st quartile to 3rd quartile, whiskers: interquartile range (IQR, midspread): 75th and 25th percentile.
Extended Data Figure 5. comparative genomics.
a) Table listing contig and scaffold N50 statistics of the genomes used for the comparative genome alignments in Fig. 3b. The table reveals that the basal vertebrate lamprey genome assembly is more fragmented (similar or lower N50 values) than most other platyhelminth genomes. Nevertheless, the human to lamprey genome alignment has equivalent or even higher alignment chain scores and spans, indicating that the true extent of sequence divergence and loss of conserved gene order in platyhelminths is likely an underestimate.
b) Example of a top-scoring alignment chain. The UCSC genome browser screenshot of the Smed genome shows that alignments predominantly overlap exons of the two transcripts shown at the top. This example is one of the few cases of apparent gene order conservation between Smed and S. mansoni. Blocks in the alignment chains represent local alignments, connecting single lines represent deletions in the query genome and double lines represent regions with sequence in both Smed and the query genome that do not align. c) Comparative loss analysis of highly conserved genes across the 26 indicated species. Red: Conserved gene fraction, defined as the proportion of orthogroups containing at least 9 out of the 14 non-flatworm species and the query species. Blue: Lost fraction of highly conserved genes, defined as the proportion of orthogroups containing at least 9 out of the 14 non-flatworm species, but not the query species (See Supplementary Information S17).
Absolute numbers of highly conserved genes are shown on top, with slight fluctuations caused by species-specific sequence duplications.
Extended Data Figure 6. Planarian-specific genes.
a) Conservation of 1,165 flatworm-specific genes (Supplementary Information S16.1) amongst flatworm species. Only 61 sequences had sequence homologues in the indicated flatworm species (Other = T. solium, E. multilocularis, E. granulosus, H. microstoma), indicating that this gene set mostly represents planarian-specific genes. b) and c) characteristics of planarian-specific genes. b) Distribution of exon numbers compared to a control gene set (HC-cDNAs; Extended Data Fig. 2a), indicating an enrichment of single exon genes. c) Number of predicted domains (InterProScan), indicating that only a minority contains predicted domains. d) Identity of detected domains (Pfam and SUPERFAMILY). “unintegrated signatures” designates recurring sequence motifs that are not grouped into InterPro entries. These might represent so far un-curated or weakly supported motifs that do not pass InterPro's integration standards. e) Differential expression of 626 planarian-specific genes in published Smed RNAseq data sets of different regeneration phases (left), stem cells or progeny populations (middle) or specific developmental stages (right). Red lines indicate differential expression relative to the control of each series (white = no change). Genes were ordered using rank by sum. The high proportion of differential expression indicates the widespread contribution of lineage-specific genes to planarian biology. f) and g) Specific examples of non-conserved genes. Top: SMART domain representation. Bottom: Differential expression under the indicated conditions.
Extended Data Figure 7. Sequence conservation of Mad1 protein in non-planarian flatworms.
a) COBALT multiple protein sequence alignment of the Mad1 homologues of the indicated species (including all the non-planarian flatworm species of Fig. 3c). b) Heatmap of BLOSUM62 sequence similarity matrix generated from alignment in a), demonstrating significant sequence conservation of Mad1 homologues even in flatworms.
Extended Data Figure 8. Sequence conservation of Mad2 protein in non-planarian flatworms.
a) COBALT multiple protein sequence alignment of the Mad2 homologues of the indicated species (including all the non-planarian flatworm species of Fig. 3c). b) Heatmap of BLOSUM62 sequence similarity matrix generated from alignment in a), demonstrating significant sequence conservation of Mad2 homologues even in flatworms.
Extended Data Figure 9. Effect of cdc20(RNAi) and SAC components on the planarian stem cell compartment.
a) Fluorescent whole mount in situ hybridization of the planarian head region. Stem cells (neoblasts) were visualized by a smedwi-1 probe (red), early+late progeny by pooled prog-1 and agat-1 probes (green). Nuclear counterstaining by DAPI (blue). Top: RNAi control against egfp, Bottom: cdc20(RNAi), which results in a dramatically decreased number of smedwi-1 and prog-1/agat-1 positive cells after 3 rounds of RNAi feeding. This indicates the loss of neoblasts and a concomitant reduction in progenitor numbers (n=1 biological replicate, 10 animals). Scale bar: 200 µm. b) Effect of indicated RNAi treatments on planarian stem cell abundance. Representative images of cell macerates, stained with DAPI (nuclei, blue), anti-H3ser10P (mitotic cells, magenta) and smedwi-1 in situ hybridization (stem cells, yellow). Numbers indicate the mean fraction ± s.d. of smedwi-1 positive cells of total cells quantified by nuclear counting using DAPI (n=1, 10 pooled animals, 5 technical replicates with 5 images each). Scale bar: 50 µm.
Extended Data Table 1. S. mediterranea genome assembly comparisons.
Final Smed_g4 assembly characteristics are highlighted in bold.
| Assembly | SmedSxl v4.0 | GCA_000691995.1 | PacBio-Canu | PacBio - MARVEL | g4 assembly |
|---|---|---|---|---|---|
| Technology | Sanger | Illumina | PacBio | PacBio | PacBio + Chicago |
| Assembler | NA | SOAPdenovo | Canu | MARVEL | MARVEL + HiRise |
| Assembly length (Mb) | 787.5 | 700.7 | 938.8 | 782.1 | 774.0 |
| Contigs | |||||
| # contigs | 112,641 | 108,794 | 7,637 | 1,839 | 1,292 |
| Longest contig | 149,108 | 132,070 | 2,212,985 | 4,363,926 | 5,343,607 |
| Contig N50 | 11,977 | 10,721 | 194,023 | 708,691 | 1,121,568 |
| Scaffolds | |||||
| # scaffolds | 15,334 | 12,782 | NA | NA | 481 |
| Longest scaffold | 893,023 | 1,050,243 | NA | NA | 17,761,579 |
| Scaffold N50 | 80,447 | 83,932 | NA | NA | 3,854,845 |
| % in gaps | 13.87 | 14.32 | 0 | 0 | 0.01 |
Supplementary Material
Supplementary Information is linked to the online version of the paper at www.nature.com/nature.
Acknowledgements
We thank Jun-Hoe Lee for multiple sequence alignments, Drs Tobias Boothe and Miquel Vila Farré for karyotyping, Andreas Hejnol, Arshad Desai and Jörg Mansfeld for critical reading of the manuscript and DoveTail Genomics staff for graphical support. We thank the following MPI-CBG facilities for their support: DNA sequencing, Scientific computing, Light microscopy. We thank Dr. Vladimir Benes and the EMBL GeneCore and Andreas Dahl and the Deep Sequencing Group (SFB 655/BIOTEC) for RNA sequencing and Stephanie von Kannen, Heino Andreas, Sylvia Clausing und Nicola Gscheidel for technical support. This project received funding from the European Research Council (ERC) under the European Union’s Horizon 2020 research and innovation program (grant agreement number 649024) and the Max Planck Society. GRY was supported by the Francis Crick Institute under award FC001162 (Jonathan P. Stoye). The Crick receives its core funding from Cancer Research UK, the UK Medical Research Council, and the Wellcome Trust.
Footnotes
Author Contributions
Conceptualization: J.C.R., E.M., S.S.; Methodology: M.A.G., M.P., A.R., G.Y., S.W., H.B., I.H., M.H., J.C.R; Formal Analysis: M.A.G., M.P., A.R., G.Y., H.B., I.H.; S.W., T.S., M.H.; Investigation: M.A.G., M.P., A.R., M.H., J.C.R; Writing – Original Draft: J.C.R.; Writing – Review & Editing: J.C.R., E.M., M.H., S.P.; Visualization: J.C.R., M.H., S.P., I.H., H.B., S.W., G.Y., A.R., M.P., M.A.G.; Funding Acquisition: J.C.R., E.M., S.S., A.D. All authors read and approved of the manuscript.
Author Information
Reprints and permissions information is available at www.nature.com/reprints.
The Smed genome assembly is accessible at GenBank under the accession number NNSW00000000 and also at the PlanMine planarian browser http://planmine.mpi-cbg.de.
All DNA and RNA reads were deposited at the Sequence Read Archive under the bioproject accession PRJNA379262.
The authors declare no competing financial interests.
Data availability
The Smed genome assembly is accessible at GenBank under the accession number NNSW00000000 and can also be browsed at and downloaded from http://planmine.mpi-cbg.de.
All DNA and RNA reads were deposited at the Sequence Read Archive under the bioproject accession PRJNA379262 and under the following SRA accession numbers:
PacBio p4 data- SRX2700681 and SRX2700682;
PacBio p6 data - SRX2700683, PacBio CCS data - SRX2700684;
DNA Shotgun - SRX2700686; DNA Chicago - SRX2700687 and RNA-Seq - SRX2700685.
Source code
The current source code of the MARVEL assembler is available at https://github.com/schloi/MARVEL. The execution scripts used for Smed can be found in the respective subfolder of the examples folder.
References
- 1.Rink JC. Stem cell systems and regeneration in planaria. Dev Genes Evol. 2013;223:67–84. doi: 10.1007/s00427-012-0426-4. [DOI] [PMC free article] [PubMed] [Google Scholar]
- 2.Saló E, Agata K. Planarian regeneration: a classic topic claiming new attention. Int J Dev Biol. 2012;56:3–4. doi: 10.1387/ijdb.123495es. [DOI] [PubMed] [Google Scholar]
- 3.Reddien PW, Sánchez Alvarado A. Fundamentals of planarian regeneration. Annu Rev Cell Dev Biol. 2004;20:725–757. doi: 10.1146/annurev.cellbio.20.010403.095114. [DOI] [PubMed] [Google Scholar]
- 4.Wagner DE, Wang IE, Reddien PW. Clonogenic neoblasts are pluripotent adult stem cells that underlie planarian regeneration. 2011;332:811–816. doi: 10.1126/science.1203983. [DOI] [PMC free article] [PubMed] [Google Scholar]
- 5.Onal P, et al. Gene expression of pluripotency determinants is conserved between mammalian and planarian stem cells. EMBO J. 2012;31:2755–2769. doi: 10.1038/emboj.2012.110. [DOI] [PMC free article] [PubMed] [Google Scholar]
- 6.Tsai IJ, et al. The genomes of four tapeworm species reveal adaptations to parasitism. Nature. 2013;496:57–63. doi: 10.1038/nature12031. [DOI] [PMC free article] [PubMed] [Google Scholar]
- 7.Laumer CE, Hejnol A, Giribet G. Nuclear genomic signals of the ‘microturbellarian’ roots of platyhelminth evolutionary innovation. Elife. 2015;4 doi: 10.7554/eLife.05503. [DOI] [PMC free article] [PubMed] [Google Scholar]
- 8.Collins JJ, Newmark PA. It's no fluke: the planarian as a model for understanding schistosomes. PLoS Pathog. 2013;9:e1003396. doi: 10.1371/journal.ppat.1003396. [DOI] [PMC free article] [PubMed] [Google Scholar]
- 9.Cantarel BL, et al. MAKER: an easy-to-use annotation pipeline designed for emerging model organism genomes. Genome Res. 2008;18:188–196. doi: 10.1101/gr.6743907. [DOI] [PMC free article] [PubMed] [Google Scholar]
- 10.Robb SMC, Gotting K, Ross E, Sánchez Alvarado A. SmedGD 2.0: The Schmidtea mediterranea genome database. Genesis. 2015;53:535–546. doi: 10.1002/dvg.22872. [DOI] [PMC free article] [PubMed] [Google Scholar]
- 11.Nishimura O, et al. Unusually Large Number of Mutations in Asexually Reproducing Clonal Planarian Dugesia japonica. PLoS ONE. 2015;10:e0143525. doi: 10.1371/journal.pone.0143525. [DOI] [PMC free article] [PubMed] [Google Scholar]
- 12.Eid J, et al. Real-Time DNA Sequencing from Single Polymerase Molecules. Science. 2009;323:133. doi: 10.1126/science.1162986. [DOI] [PubMed] [Google Scholar]
- 13.van Hooff JJ, Tromer E, van Wijk LM, Snel B, Kops GJ. Evolutionary dynamics of the kinetochore network in eukaryotes as revealed by comparative genomics. EMBO Rep. 2017 doi: 10.15252/embr.201744102. e201744102. [DOI] [PMC free article] [PubMed] [Google Scholar]
- 14.Musacchio A, Salmon ED. The spindle-assembly checkpoint in space and time. Nat Rev Mol Cell Biol. 2007;8:379–393. doi: 10.1038/nrm2163. [DOI] [PubMed] [Google Scholar]
- 15.Koren S, et al. Canu: scalable and accurate long-read assembly via adaptive k-mer weighting and repeat separation. Genome Res. 2017 doi: 10.1101/gr.215087.116. gr.215087.116. [DOI] [PMC free article] [PubMed] [Google Scholar]
- 16.Putnam NH, et al. Chromosome-scale shotgun assembly using an in vitro method for long-range linkage. Genome Res. 2016;26:342–350. doi: 10.1101/gr.193474.115. [DOI] [PMC free article] [PubMed] [Google Scholar]
- 17.Brandl H, et al. PlanMine - a mineable resource of planarian biology and biodiversity. Nucleic Acids Res. 2016;44:D764–73. doi: 10.1093/nar/gkv1148. [DOI] [PMC free article] [PubMed] [Google Scholar]
- 18.Mouse Genome Sequencing Consortium et al. Initial sequencing and comparative analysis of the mouse genome. Nature. 2002;420:520–562. doi: 10.1038/nature01262. [DOI] [PubMed] [Google Scholar]
- 19.Macas J, Neumann P. Ogre elements--a distinct group of plant Ty3/gypsy-like retrotransposons. Gene. 2007;390:108–116. doi: 10.1016/j.gene.2006.08.007. [DOI] [PubMed] [Google Scholar]
- 20.Guo L, Zhang S, Rubinstein B, Ross E, Alvarado AS. Widespread maintenance of genome heterozygosity in Schmidtea mediterranea. Nature Ecology & Evolution. 2016;1:0019. doi: 10.1038/s41559-016-0019. [DOI] [PMC free article] [PubMed] [Google Scholar]
- 21.Wasik K, et al. Genome and transcriptome of the regeneration-competent flatworm, Macrostomum lignano. Proc Natl Acad Sci USA. 2015;112:12462–12467. doi: 10.1073/pnas.1516718112. [DOI] [PMC free article] [PubMed] [Google Scholar]
- 22.Lai A, Kosaka N, Abnave P, Sahu S, Aboobaker A. The Abrogation Of Condensin Function Provides Independent Evidence For Defining The Self-Renewing Population Of Pluripotent Stem Cells. bioRxiv. 2017 doi: 10.1101/143339. 143339. [DOI] [PMC free article] [PubMed] [Google Scholar]
- 23.Ceccaldi R, Rondinelli B, D'Andrea AD. Repair Pathway Choices and Consequences at the Double-Strand Break. Trends Cell Biol. 2016;26:52–64. doi: 10.1016/j.tcb.2015.07.009. [DOI] [PMC free article] [PubMed] [Google Scholar]
- 24.Stubenhaus BM, et al. Light-induced depigmentation in planarians models the pathophysiology of acute porphyrias. Elife. 2016;5 doi: 10.7554/eLife.14175. [DOI] [PMC free article] [PubMed] [Google Scholar]
- 25.Rao AU, Carta LK, Lesuisse E, Hamza I. Lack of heme synthesis in a free-living eukaryote. Proc Natl Acad Sci USA. 2005;102:4270–4275. doi: 10.1073/pnas.0500877102. [DOI] [PMC free article] [PubMed] [Google Scholar]
- 26.Grudniewska M, et al. Transcriptional signatures of somatic neoblasts and germline cells in Macrostomum lignano. Elife. 2016;5:3389. doi: 10.7554/eLife.20607. [DOI] [PMC free article] [PubMed] [Google Scholar]
- 27.Santaguida S, Amon A. Short- and long-term effects of chromosome mis-segregation and aneuploidy. Nat Rev Mol Cell Biol. 2015;16:473–485. doi: 10.1038/nrm4025. [DOI] [PubMed] [Google Scholar]
- 28.McWhinnie MA, Gleason MM. Histological Changes in Regenerating Pieces of Dugesia dorotocephala Treated with Colchicine. Biol Bull-Us. 1957;112:371–376. [Google Scholar]
- 29.Kang H, Sánchez Alvarado A. Flow cytometry methods for the study of cell-cycle parameters of planarian stem cells. Dev Dyn. 2009;238:1111–1117. doi: 10.1002/dvdy.21928. [DOI] [PubMed] [Google Scholar]
- 30.Silió V, McAinsh AD, Millar JB. KNL1-Bubs and RZZ Provide Two Separable Pathways for Checkpoint Activation at Human Kinetochores. Dev Cell. 2015;35:600–613. doi: 10.1016/j.devcel.2015.11.012. [DOI] [PubMed] [Google Scholar]
- 31.Sekelsky J. DNA Repair in Drosophila: Mutagens, Models, and Missing Genes. Genetics. 2017;205:471–490. doi: 10.1534/genetics.116.186759. [DOI] [PMC free article] [PubMed] [Google Scholar]
- 32.Rancati G, et al. Aneuploidy underlies rapid adaptive evolution of yeast cells deprived of a conserved cytokinesis motor. Cell. 2008;135:879–893. doi: 10.1016/j.cell.2008.09.039. [DOI] [PMC free article] [PubMed] [Google Scholar]
- 33.Schockaert ER, et al. Global diversity of free living flatworms (Platyhelminthes, ‘Turbellaria’) in freshwater. Hydrobiologia. 595:41–48. [Google Scholar]
- 34.Wurtzel O, et al. A Generic and Cell-Type-Specific Wound Response Precedes Regeneration in Planarians. Dev Cell. 2015;35:632–645. doi: 10.1016/j.devcel.2015.11.004. [DOI] [PMC free article] [PubMed] [Google Scholar]
Associated Data
This section collects any data citations, data availability statements, or supplementary materials included in this article.


