

Abstract
Purpose
As tissue engineering continues to mature, it is necessary to develop new technologies that bring insight into current paradigms and guide improvements for future experiments. To this end, we have developed a system to characterize our bioartificial heart (BAH) model and compare them to functional native structures.
Methods
In the present study, the hearts of adult Sprague-Dawley were decellularized resulting in a natural three-dimensional cardiac scaffold. Neonatal rat primary cardiac cells were then cultured within a complex 3D fibrin gel, forming a 3-dimensional cardiac construct, which was sutured to the acellular scaffold and suspended in media for 24–48 hours. The resulting bioartificial hearts (BAHs) were then affixed with 16 electrodes, in different configurations to evaluate not only the electrocardiographic characteristics of the cultured tissues, but to also test the system’s consistency.
Results
Histological evaluation showed cellularization and cardiac tissue formation. The BAHs and native hearts were then evaluated with our 16-channel flexible system to acquire the metrics associated with their respective electrophysiological properties. Time delays between the native signals were in the range of 0 to 95ms. As well, color maps revealed a trend in impulse propagation throughout the native hearts. After evaluation of the normal rat QRS complex we found the average amplitude of the R-wave to be 5351.48 ± 44.92μV and the average QRS duration was found to be 10.61 ± 0.18ms. In contrast, BAHs exhibited more erratic and non-uniform activity that garnered no appreciable quantification.
Conclusions
The data collected in this study proves our system’s efficacy for EKG data procurement.
Index Terms: Cardiac Constructs, Bioengineered Hearts, Cell Culture, Electrical Impulse Propagation Maps, Heart Electrophysiology, Heart, Tissue Engineering
I. Purpose
Subsequent to acute myocardial infarction, ischemic conditions in the affected area of the heart result in the advancement of myopathic cardiac tissue. Accumulation of necrotic tissue over time deteriorates the heart’s capacity to function properly leading ultimately to ischemic hypoxia. Though several treatments paradigms exist for this resultant effect of heart disease, heart transplant remains the most effective mitigator of chronic cardiac maladies. However, a deficit of donor organs for transplantation compounds issues for prospective recipients with the number of adults on the waiting list for heart transplants having increased by 51% from 2004 to 2015 [1]. As organ donor registrant numbers have remained stagnate over the previous 11 years (2004 to 2015) and waiting lists continually expand, it is essential that alternative treatment modalities are investigated.
Tissue engineering investigates the development of biological substitutes that serve in augmenting or replacing damaged tissues [2]. More specifically, cardiac tissue engineering ultimately seeks to develop a functional myocardium to improve or replace weakend myocardium, in addition to modeling the physiology of cardiac development and diseases [3]. The intricate ansiotropic structure of native cardiac muscle facilitates the electrical activity within the heart [4]. It is these electrical impulses that regulate the cardiac cycle and maintain sphygmic synchronisity. There are several models to support the fabrication of 3D artificial heart muscle within our laboratory [5–10], as well as other cardiovascular components necessary for the treatment of heart ailments [11–13].
As we continue to advance various models of artificial heart muscle and other tissues, creating systems with an ability to accurately evaluate and compare the functionality of both engineered and native structures becomes fundementally indespensable. Here, we address the need of such characterization by developing a novel flexible 16 electrode system to record the electrical potentials of a bioengineered heart (BAH) model. Development of the BAH presents a prospective alternative for end-stage heart failure by exploiting decellularized hearts as an anatomically correct scaffold with which to proliferate functional cardiac myocytes that have an ability to maintain native heart characteristics [14, 15]. Our system provides a wealth of accurate electrical information about 3D tissues both natural and engineered. Where our previous studies, as well as other research groups experienced issues with signal fractionation (19) or electrode stiffness issues, we have developed custom signal processing algorithms and have engineered our electrodes for maximum biocompatibility and surface contact [16–18], while maintaining signal integrity. We will show that by customizing the hardware and software, our configuration is capable of accurately, consistently, and cost effectively capturing data regarding impulse propagation, time delays between channels, as well as other metrics associated with heart function such as heart rate and high resolution data pertaining to the QRS complex. Overall, our system provides a versatile platform with which to evaluate our engineered tissue’s electrical characteristics and guide future research to more efficient iterations.
III. Methods
All institutional and national guidelines for the care and use of laboratory animals were followed and approved by the appropriate institutional committees.
A. Fabrication of BAHs
First, mature cardiomyocytes are disassociated from the native tissues revealing a natural extracellular matrix (ECM). Native rodent hearts were removed from 3 to 6 month old Sprague-Dawley rats and immediately rinsed in a phosphate buffered saline solution to prevent blood coagulation. The hearts were then incubated in a series of decellularization solutions (15 mL) as indicated in Table 1, and placed in an orbital shaker (60 RPM at 25°C) over the course of 14 days. Finally, decellularized heart scaffolds were washed (3x) and placed in PBS 24 hours prior to construct formation to remove any trace of decellularization solutions.
Table 1.
Decellularization protocol
| Components | Schedule | |
|---|---|---|
| Solution 1 | 80% Glycerol* 0.9% NaCl 0.05% NaN3 25mM EDTA |
Days 0–2 |
| Solution 2 | 4.2% sodium deoxycholate 0.05% NaN3 |
Days 2–4 |
| Solution 3 | 1% SDS 0.05% NaN3 |
Days 4–6 and Days 8–10 |
| Solution 4 | 0.05% NaN3 | Days 12–14 |
| Solution 5 | 3% Triton X-100* 0.05% NaN3 |
Days 6–8 and Days 10–12 |
Bv volume
Next, we fabricated the cardiac tissue by coating each 35mm tissue culture plate with 2mL of SYLGARD (PDMS, type 184 silicone elastomer) (Dow Chemical Corporation, Midland, MI), which was allowed to cure completely (2 weeks), and then sterilized with 80% ethanol prior to use. A fibrin gel was formed by adding 1mL of CM containing 10U/mL thrombin with 500μL of saline, containing 20mg/mL fibrinogen to each PDMS coated culture plate. Four minutien pins (Fine Science Tools, Foster City, CA) (0.1mm diameter), were placed in the culture plate as anchor points where the tissues would eventually form a 20mm×20mm square. To ensure complete mixing of both solutions and complete plate coverage, the culture plates were shaken and placed in the incubator (45 minutes) to stimulate the formation of the gel. To seed the fibrin gel, neonatal primary cardiac cells were isolated from the hearts of 2 to 3 day old Sprague-Dawley rats utilizing a pre-established protocol [19]. Cells were diluted in CM at 2 million cells/mL, plated in 2mL of CM, and placed back into the incubator (37°C, 5% CO2) with media changes every other day.
Four to five days after plating, the bioengineered heart muscle constructs were fully formed and ready for wrapping. Bioengineered hearts were formed using a previously established protocol [11]. A 1.58mm diameter tubule was inserted through the aorta of each of the decellularized rat hearts which served to suspend the BAH during experimentation [Fig. 1(a)]. The decellularized scaffolds were placed on the surface of the inverted tissues as can be seen in Fig. 1(b). The fabricated constructs were then unpinned and gently sutured to the decellularized pericardium scaffold using sterile 6–0 polypropylene sutures (AD Surgical, Sunnyvale, CA) [Fig. 1(c)]. The completed constructs were suspended in a 50 mL conical tube containing CM (15mL) and ε-aminocaproic acid (2 mg/ml) [Fig. 1(d)], and placed in an incubator (37°C, 5%CO2) for a period of 24 to 48 hours before the electrophysiological characteristics were assessed.
Fig. 1.
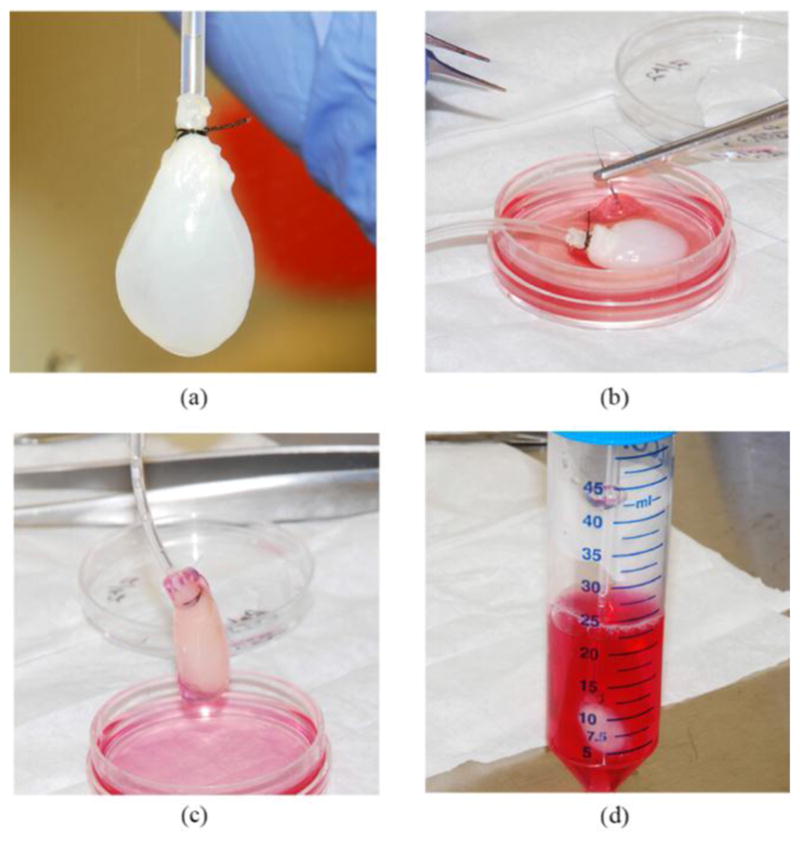
Method for Fabrication of BAH (a) Decellularized rat heart for scaffold. (b) Suturing of the 3D-AHM to the surface of the decellularized heart. (c) Fully sutured construct. (d) Completed constructs suspended in a 50 mL conical tube for incubation
B. Design, Fabrication of the Flexible Electrodes
We designed and fabricated 16 highly flexible individual microelectrodes able to obtain EKG readings from native rat hearts and the bioartificial heart developed within our laboratory. Each microelectrode consisted of a 42AWG micro coaxial cable (15cm) (Mouser Electronics, Mansfield, TX) stripped at either end (1.5cm), with one end connected to a single DuPont style male crimp pin and connector housing, and the other soldered (lead free) to a flexible stainless steel spring (2cm) (0.457mm ID) (Motion Dynamics, Fruitport, MI) [Fig. 2(a)]. This spring allows for greater flexibility in gathering EKG data from the three-dimensional cardiac surface, while providing a non-toxic attachment to the tissues. The joint between the spring and coaxial cable was reinforced using standard silicone tubing (0.51mm ID) [Fig. 2(b)], which also served as an insulator after the electrode was attached to the tissue surface, preventing electrode-electrode interference.
Fig. 2.
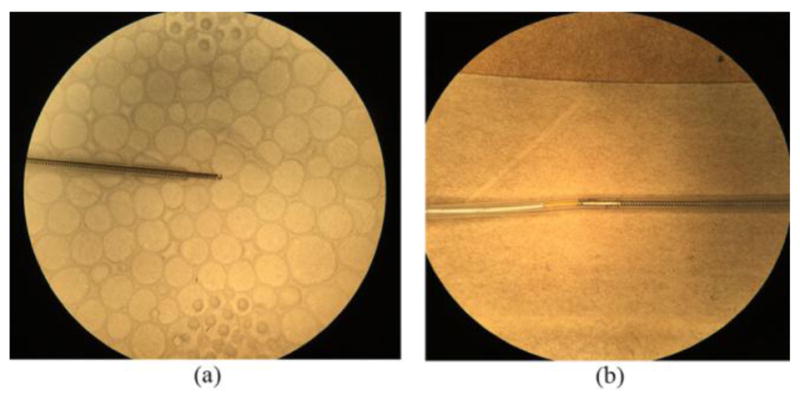
Flexible microelectrode design (a) Flexible stainless steel spring with 0.457mm internal diameter. (b) Spring and coaxial cable joint reinforced with standard silicone tubing
C. Testing of Bioartificial Hearts (BAHs)
The bioengineered hearts were suspended using a triangular base support stand and Tri-Grip clamps. Each of the 16 electrodes was attached to the tissue surface by carefully turning the spring into the surface being mindful to minimize any damage to the tissues. The electrodes were placed in a four by four array as accurately as possible [Fig. 3(a)].
Fig. 3.

Testing of BAHs before and after epinephrine with flexible electrode system (a) Suspended BAH with electrodes attached. (b) Submerged BAH in epinephrine with electrodes attached
Our laboratory used the commercially available RHD2000-Series Amplifier Evaluation system (Intan Technologies, Los Angeles, CA) and modified it to fit our purpose. This highly customizable system includes an Opal Kelly XEM 6010 USB/TPGA interface module capable of supporting up to 256 low noise amplifier channels with sampling rates ranging from 1 to 30kS/s. For the purpose of this study we used a sampling rate of 5kS/s and a bandwidth between 0.09Hz and 1.00kHz.
Once set up is complete, the electrode board sends the information collected at the tissue/electrode interface to the amplifier board and subsequently to the USB interface board via a serial peripheral interface (SPI) cable. The electrical potential of each BAH was measured for a 10-minute period, then, with the electrodes still attached, the BAH was submerged in a solution containing 10% 2mM epinephrine mix (Krebs, glucose, and epinephrine) and 90% CM [Fig. 3(b)], and recorded for an additional 5 minutes.
D. Native Rat Heart Testing
To further validate our current system for EKG data collection, the electrophysiological properties of native mammalian tissue were evaluated. Briefly, the hearts of 2–3 month old anesthetized Sprague-Dawley female rats were removed and immediately fastened to a Lagendorff perfusion system and perfused with a modified Krebs solution (120mM NaCl, 25mM NaHCO3, 5.4mM KCL, 1.2mM NaH2PO4, 1mM MgCl2, 1.8mM CaCl2, and 5.5mM glucose). Each of the 16 microelectrodes was connected to the heart in one of three configurations [Fig. 4]. This allowed us to test the ability of the system to acquire electrical potentials in any desired area of the heart. In all three configurations, four electrodes were placed in line along the interventricular septum, with the remaining eight evenly distributed between the surfaces of the right and left ventricles. Each recording session (3 configurations) lasted 20 minutes totaling 60 minutes per heart.
Fig. 4.

Different configurations used for placement of flexible electrodes during native rat heart testing (a) Configuration 1, four electrodes placed on the interventricular septum with 6 electrodes on either ventricle. (b) Configuration 2, the six electrodes left and right of the interventricular septum are transposed to a vertical position. (c) Configuration 3, furthest three vertically arranged electrodes are placed horizontally, perpendicular to the septum
E. Data Analysis
After the data was collected for both the engineered hearts and the native hearts, the RHD data were extracted with a MATLAB script file provided (open-source) by Intan Technologies that imports the recorded data into MATLAB for analysis and run through a custom m-file to analyze said data. After reviewing and graphing each individual data set, representative waves with minimal interference artifacts from physical, acoustic, or electronic sources were selected. To avoid any nonconforming signals, we verified that the data was consistent throughout the different segments collected for each tissue specimen. To establish a baseline, the data were detrended and then bandpass filtered at 0.05–60Hz for BAHs, and 0.05–100Hz for native hearts.
After this basic filtering, files were run through MATLAB’s signal processing toolbox for cross correlation using the ‘xcorr’ command and a for loop, to determine the lag in signals between a chosen reference and the other 15 channels. This information was used to create tables containing the time delays from channel to channel, as well as construct electrical impulse propagation color maps using ‘imagesc’. Peak analysis was also performed with the ‘findpeaks’ command to evaluate the QRS complex and obtain duration, amplitude, and frequency detail of each segment, which were then illustrated with customized subplots representative of each configuration.
II. Results
A. BAH Formation
Hearts extracted from adult Sprague Dawley rats were subjected to a series of decellularization solutions following the protocol outlined in Table 1. During the decellularization procedure the hearts became distinctly clearer and more translucent as the process progressed until all the cells had been removed, leaving behind an extracellular matrix scaffold.
During the process of fabrication of the artificial heart muscle, we plated each cardiac construct with 4×10⁶ cells, which begin to contract spontaneously after 2 days in culture. Delamination of the fibrin-cardiomyocyte construct begins around day 3 after cell plating and continues for an additional 1–2 days until the construct is fully formed. Normal functioning constructs were able to maintain contractile performance for a period of 8 days after plating, after which, a significant decrease in performance was observed. For this reason we proceeded to use the formed constructs for the formation of bioartificial hearts after four to five days in culture; leaving an additional three to four days for patch stabilization and testing.
Before melding the tissue construct with the acellular ECM we washed the decellularized hearts removing sodium azide, which can lead to the lysing of cells and ultimately cell death if not completely removed. Since cells tend to remain within the top surface layers of the fibrin gel during 3D-AHM formation, heart muscle constructs were carefully inverted exposing the majority of functional cells to the outer surface allowing for ease of electrical potential measurement of the tissues.
B. Electrophysiological Properties of BAHs
The electrical potentials of each heart model were acquired for periods of 10 minutes with no significant waveforms being detected during testing. The heart constructs were then submerged in the epinephrine media mix to increase contractile rate and wave amplitude of the tissue. We first generated a subplot of the waveforms collected at all 16 channels and displayed them analogous to the configuration the electrodes were placed on the surface of the tissue [Fig. S1(a)]. With the epinephrine mix we observed an increase in the rate of contraction and amplitude of the electrical impulse [Fig. S1(b)]. However, the data acquired, though significant with respect to the non-epinephrine testing, displayed an erratic behavior hindering the construction of accurate electrical impulse color maps.
C. Electrophysiological Properties of Native Mammalian Heart
We evaluated the native electrophysiological properties hearts from two to three month old Sprague Dawley rats to validate the system developed for this study. Each heart was recorded for 20 minutes per electrode configuration. Upon completing each 20-minute recording session, we constructed subplots of all three configurations looking for the signature QRS wave as well as measuring the amplitude and frequency of each data set; all configurations yielded readable signals in all channels [Fig. S2]. Of note, some variations in the QRS complex were seen in some channels.
Next, we performed cross correlation analysis to obtain the time delays between each electrode with respect to a chosen reference channel, giving us the number of sample lags in between the signals. For this study, we chose the electrode placed at the top of the interventricular septum as the reference for each configuration. Since we know the sampling rate used during testing as well as the number of sample lags, we were able to calculate time delay between each electrode and the chosen reference electrode. We found that the delay times between the signals for configuration one were in the range of 0ms to 40ms, for configuration two they were in the range of 0ms to 75ms, and for configuration yielded a range of 0ms to 95ms.
Once the time delay tables were formed, we used these values to construct electrical maps by assigning a range of colors to the time delay values with the MATLAB command ‘imagesc’. Electrical impulse propagation color maps of each configuration provide additional visualization of the signal propagation through the tissue of the native heart [Fig. 5]. Each of these maps shows that moving from the reference in a downward direction along the interventricular septum, time is incrementing as the distance increases for all three configurations.
Fig. 5.

Electrical Impulse propagation color map. This is a visual representation of the delay times between the reference electrode (red) and all other electrodes. This information allows us to visualize the propagation of the signal through the native heart for all three configurations. (a) Impulse propagation seen with configuration 1. (b) Impulse propagation seen with configuration 2. (c) Impulse propagation seen with configuration 3
Additionally, an impulse propagation trend can also be seen throughout sections of the heart, most noticeably in configuration 1 [Fig. 5(a)]. However, at certain channels the time delay ceases to increase, displaying some asynchronicity in differing areas of the maps.
Lastly, the previously chosen raw data files were also run through an m-file written to perform peak analysis of the acquired data where 10 second segments were chosen that best identified the QRS complex of the EKG signal [Fig. 6(a)]. We used these segments from all channels to calculate the amplitude of the R-wave and QRS duration for each configuration [Fig. 6(b–c)]. Average R-wave amplitude and QRS duration for configuration 1 were found to be 5463.73 ± 22.10μV and 8.70 ± 0.02ms respectively. Average R-wave amplitude and QRS duration for configuration 2 were found to be 6035.58 ± 84.10μV and 9.24 ± 0.04ms respectively. Lastly, average R-wave amplitude and QRS duration for configuration 3 were found to be 4555.14 ± 28.60μV and 13.88 ± 0.47ms respectively.
Fig. 6.
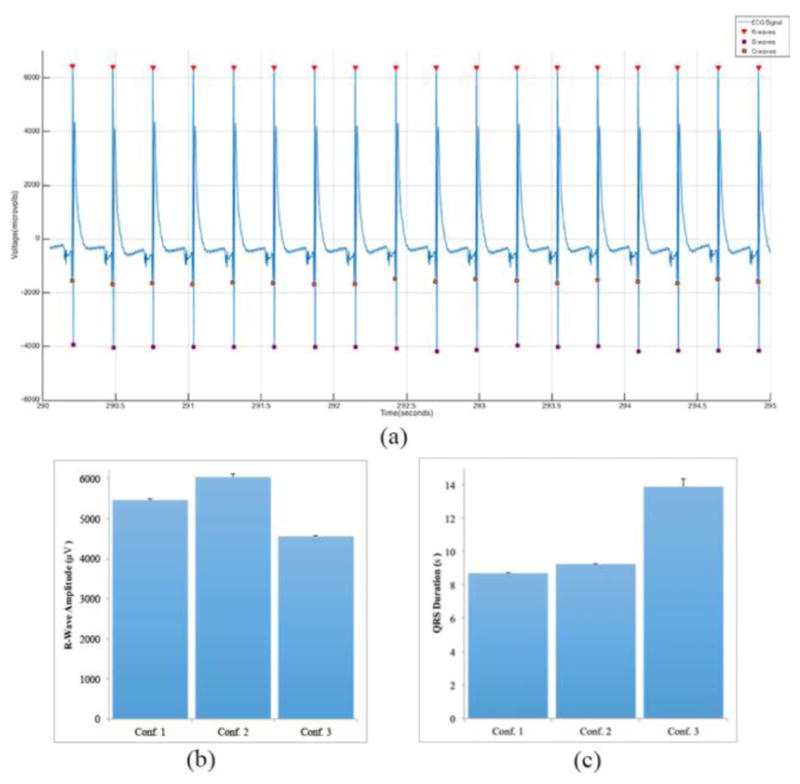
Evaluation of the QRS complex from the data collected. (a) 10 second segment that shows the Q -wave, R-wave, and S-wave clearly marked. (b) Average R-wave amplitude for all three configurations. (c) Average QRS duration for all three configurations
III. DISCUSSION
The heart is an intricate system incapable of self-repairing areas of tissue that has been damaged due to ischemic conditions resultant of myocardial infarction. Heart muscle tissue engineering emphasizes alleviating such detrimental, and too often fatal maladies, by investigating the latest methodology to fabricate native tissue equivalents and ultimately produce constructs that resemble native mammalian tissue in function and capacity, to repair, replace or even augment infarcted tissues. Developing phenotypically and physiologically relevant tissues requires us to assess the functional performance of the fabricated tissues. Though strategies for engineering cardiac tissues have advanced significantly, there remains a need for proper instrumentation to fully evaluate and understand tissue models developed in the laboratory. The research described in this study focused on the development of a versatile flexible system capable of measuring the electrophysiological properties of bioartificial hearts developed in-vitro, in addition to the characteristics of the native rat heart.
The decellularization protocol took place over the course of two weeks. The native rat hearts were immersed in the decellularization solutions instead of actively perfusing them through the hearts as done in previous studies [20]. This was done in order to maximize the efficiency of the protocol and fully remove all cells from the heart. After the decellularization of the hearts, the remaining extracellular matrix appeared to remain intact and ready for the formation of the heart constructs. In a previously developed study within our laboratory, the efficiency of our protocol was tested and characterization of the acellular scaffold was performed [11]. The results acquired from H&E and Masson’s trichrome staining during that study showed the striated extracellular matrix network without any cellular presence. Additionally, immunohistological staining of the acellular hearts showed a collagen rich network without any cells.
The next step in our process is forming 3D-AHM, which involves the plating of isolated neonatal rat primary cardiac cells consisting of cardiomyocytes, fibroblasts, endothelial cells, smooth muscle cells, cardiac stem cells, and pacemaker cells on a complex fibrin gel. Our BAH fabrication process is completed by securing the fully formed, and spontaneously contracting, 3D-AHM patch to the acellular scaffold with a simple interrupted over and under suturing technique (6-0 Polypropylene).
This methodology has been proven to provide an effective delivery vehicle of functional cardiomyocytes to the decellularized scaffold in lieu of passive seeding of the cardiac cells [20]. Previous studies have demonstrated that coating or direct cell injections are inefficient due to cells being washed away from the scaffold and not given time to integrate or bind to the ECM. By enveloping the heart with our cardiac muscle construct, a majority of the cultured cells were retained by the ECM creating a more functional heart model to test with our system. Furthermore, a recently published study on the development of BAH within our laboratory shows the potential functionality of our constructs [11]. Moreover, a secondary study within our laboratory showed the optimization of the cardiac muscle used during BAH development [21].
Study of the electrophysiological properties of tissue equivalents fabricated in vitro is crucial to furthering engineered tissue development. Instrumentation previously developed for assessing electrical impulses, has focused on muscle constructs rather than the more complex models used during this study. To fill the gap between planar tissue constructs and more complex native cardiac structures, we fabricated a highly flexible 16-microelectrode system that is compatible with the RHD200 Evaluation System from Intan Technologies. This system not only efficiently collects electrical impulse data from complex cardiac constructs, it also bypasses problems attributed to previously developed systems. For instance, one research group used a custom fabricated cylindrical plexiglass chamber fitted into an electrically grounded brass casing [22]. This system used 8 microelectrodes placed 1.5mm to 5mm away from the site of stimulation on the heart muscle. The data collected with this system exhibits fractionation and low amplitude, preventing proper analysis of impulse propagation. A second group employing contact fluorescence imaging (CFI) was able to collect electrophysiological data by placing the target specimen in a chamber above a fiber bundle, however, this system cannot be used with complex cardiac constructs [16]. Lastly, a direct contact system previously developed within our laboratory proved efficient at gathering the desired electrophysiological characteristics of 3D-AHM. Unfortunately, due to the rigid construction of this device, it was ineffective in acquiring the electrical potential of a 3D surface, i.e. bioartificial hearts or native rat hearts.
Our novel flexible system was capable in recording the electrical potentials of bioartificial hearts with and without epinephrine. However, no discernible EKG waveforms were detected during testing that would allow us to perform any valuable data analysis. This can be due to the fact that the tissues were only suspended in media from one to two days, leaving little time for the 3D-AHM to more functionally integrate with the acellular scaffold. In addition, the allotted time may not be sufficient to allow the tissues to recuperate from the invasive procedure of suturing them onto the decellularized heart. Testing of BAHs that have been in culture for more than two days is necessary to better understand the electrical properties of this model. The limiting factor for gathering electrophysiological BAH data in this case was not a fault with the system, but in the actual evaluated model. This outcome highlights the need for such scrutinous evaluation of engineered tissues. Data collected using this method will help guide future iterations of our lab’s tissue constructs.
Since no usable data was acquired from previous testing, the heart constructs were submerged in an epinephrine media mix to increase the contraction rate of the tissues. Each data subset was evaluated to select the most optimal representative samples containing minimal interference, and then plotted to analyze the EKG signal seen in all 16 channels. We observed an increase in the rate of contraction and amplitude of the electrical impulse proving the functionality of our system. Though the data acquired was significant with respect to previous testing, the electrical impulses displayed an erratic behavior similar to the previous test hindering the construction of accurate impulse maps and EKG quantification. In the future, it may prove pertinent to maintain the bioengineered hearts in culture for longer periods of time before attaching the system.
With the native rat heart, our system was used to evaluate the electrical impulse in one of three configurations [Fig. 4]. This allowed us to demonstrate the versatility of the system to acquire electrical potentials in any desired area of the heart. Selected data was then run through a series of custom MATLAB programs designed to evaluate each of the individual configurations separately. We observed the distinct QRS complex at each channel and constructed subplots of all three configurations as can be seen in Fig. S2. The cause of variations in amplitude are not clear. While some exhibit an increase in amplitude as shown in the centerline of figure S2a–c, some flanking electrodes to the extreme right and left of each configuration show seemingly random differences in amplitude. This may be due to that specific area having a low electrical potential, or poor electrode contact. To rule out the latter issue, future studies should increase the number of electrodes to gain a clearer picture of electrical signal strength patterns. These findings validate the versatility of our system to be used in any configuration and with any three-dimensional construct desired.
As previously mentioned, computation of the time delay between each channel and the chosen reference was done by calculating the maximum cross correlation value, which indicates the point where the signals are best aligned as determined by the number of samples the signal is lagging by. We chose the top center electrode along the interventricular septum as the reference due to the electrical impulses originating in the SA node then traveling to the AV node, and finally through the bundle of His and down the bundle branches, on either side of the interventricular septum. A visual trend of gradually increasing time delays as distance increases down the interventricular septum can be seen in all three electrical color maps [Fig. 5]. This is what we expected to see due to the aforementioned impulse propagation in the heart. A trend in electrical impulse distribution can also be seen throughout other sections of the heart (most noticeably configuration 1), but it is not continuous at every point. This can be seen in the electrode located in the right ventricle adjacent to the third electrode down the interventricular septum. We hypothesize the disparity of impulse distribution seen here is due to a less than ideal connection at that point and can be easily fix by better securing the electrode to the surface of the heart. Additionally, to better understand impulse propagation through the ventricles, it may be of value to record localized electrical maps using an electrode toward the apex of the heart as the reference, and individually evaluating the left and right regions of the heart as the signal travels from the bottom up in the ventricles. In the future, electrode placement guides for each configuration should be designed, to accurately determine the distance between electrodes and thus permit the calculation of conduction velocities.
From the data collected we identified the QRS complex of the EKG signal. From our tests we found the average R-wave amplitude and QRS duration for configuration 1 were 5463.73 ± 22.10μV and 8.70 ± 0.02ms respectively. Average R-wave amplitude and QRS duration for configuration 2 were found to be 6035.58 ± 84.10μV and 9.24 ± 0.04ms respectively. Lastly, average R-wave amplitude and QRS duration for configuration 3 were found to be 4555.14 ± 28.60μV and 13.88 ± 0.47ms respectively. R-wave amplitude values are similar to the values previously obtained with our first system [17]. Furthermore, observed QRS duration values are similar to those seen in previous studies [23, 24]. Although, our system has been shown to properly acquired desired metrics, further improvement is needed to place electrodes in very precise locations allowing us to calculate conduction velocities. Finally, further studies need to be completed to improve our BAH model to better be able to assess its electrophysiological properties.
IV. Conclusion
A novel 16-microelectrode flexible EKG measuring device was developed to assess the electrophysiological properties of BAHs and other 3D cardiac tissues developed by our group. Testing of the system proved its ability to quantify time delay, impulse propagation, and other metrics pertaining to electrical potential of each cardiac specimen. This system has a high range of flexibility, allowing it to be used with a wide variety of tissue models. However, there was difficulty defining the exact distance between electrodes. This distance needs to be accurately defined to calculate impulse propagation velocities. In the future, manufacturing templates with different configurations will remedy this problem. To sum, this system has given us valuable information pertaining to our current BAH model and has raised questions as to how to improve future tissue constructs. By continually improving the efficacy of our BAH model, we will continue to bridge the gap between native and engineered tissues.
Supplementary Material
EKG data stream of BAH. (a) BAH electrical activity without stimulus. (b) BAH activity after being submerged in the media -epinephrine mixture
Subplots displaying the electrical potentials of native rat hearts collected (a) EKG subplot using configuration 1. (b) EKG subplot using configuration 2. (c) EKG subplot using configuration 3
Acknowledgments
This work was supported in part by the National Institutes of Health under Grant R01-EB011516.
The researchers would like to acknowledge NIH for provision of funding for this research (Grant number: R01-EB011516). We would also like to thank the Department of Biomedical Engineering and the Cullen College of Engineering at University of Houston for further financial support.
Footnotes
COI disclosure
Betsy H. Salazar, Kristopher Hoffman, Anilkumar Reddy, Sridhar Madala, and Ravi K. Birla declare that they have no conflict of interest.
The Institutional Animal Care and Use Committee (IACUC) at the University of Houston, approved all animal protocols in accordance with the “Guide for the Care and Use of Laboratory Animals” (NIH publication 86-23, 1986).
No human studies were carried out by the authors for this article.
Contributor Information
Betsy H. Salazar, Biomedical Engineering Department at the University of Houston, Houston, TX 77204 USA.
Kristopher A. Hoffman, University of Houston, Houston, TX 77204 USA
Anilkumar K. Reddy, Baylor College of Medicine, Houston, TX 77030 USA; and with Indus Instruments, Webster, TX 77598 USA.
Sridhar Madala, Indus Instruments, Webster, TX 77598 USA.
Ravi K. Birla, Biomedical Engineering Department at the University of Houston, Houston, TX 77204 USA
References
- 1.Colvin M, Smith JM, Skeans MA, Edwards LB, Uccellini K, Snyder JJ, et al. OPTN/SRTR 2015 Annual Data Report: Heart. Am J Transplant. 2017;17(Suppl 1):286–356. doi: 10.1111/ajt.14128. [DOI] [PubMed] [Google Scholar]
- 2.Langer R, Vacanti JP. Tissue engineering. Science. 1993;260(5110):920–6. doi: 10.1126/science.8493529. [DOI] [PubMed] [Google Scholar]
- 3.Zimmermann WH, Melnychenko I, Wasmeier G, Didie M, Naito H, Nixdorff U, et al. Engineered heart tissue grafts improve systolic and diastolic function in infarcted rat hearts. Nature medicine. 2006;12(4):452–8. doi: 10.1038/nm1394. [DOI] [PubMed] [Google Scholar]
- 4.Bian W, Badie N, Himel HDt, Bursac N. Robust T-tubulation and maturation of cardiomyocytes using tissue-engineered epicardial mimetics. Biomaterials. 2014;35(12):3819–28. doi: 10.1016/j.biomaterials.2014.01.045. [DOI] [PMC free article] [PubMed] [Google Scholar]
- 5.Baar K, Birla R, Boluyt MO, Borschel GH, Arruda EM, Dennis RG. Self-organization of rat cardiac cells into contractile 3-D cardiac tissue. The FASEB Journal. 2004 doi: 10.1096/fj.04-2034fje. [DOI] [PubMed] [Google Scholar]
- 6.Blan NR, Birla RK. Design and fabrication of heart muscle using scaffold-based tissue engineering. J Biomed Mater Res A. 2008;86(1):195–208. doi: 10.1002/jbm.a.31642. [DOI] [PubMed] [Google Scholar]
- 7.Evers R, Khait L, Birla RK. Fabrication of functional cardiac, skeletal, and smooth muscle pumps in vitro. Artificial organs. 2011;35(1):69–74. doi: 10.1111/j.1525-1594.2010.01007.x. [DOI] [PubMed] [Google Scholar]
- 8.Huang YC, Khait L, Birla RK. Contractile three-dimensional bioengineered heart muscle for myocardial regeneration. J Biomed Mater Res A. 2007;80(3):719–31. doi: 10.1002/jbm.a.31090. [DOI] [PubMed] [Google Scholar]
- 9.Khait L, Hodonsky CJ, Birla RK. Variable optimization for the formation of three-dimensional self-organized heart muscle. In vitro cellular & developmental biology Animal. 2009;45(10):592–601. doi: 10.1007/s11626-009-9234-1. [DOI] [PubMed] [Google Scholar]
- 10.Migneco F, Hollister SJ, Birla RK. Tissue-engineered heart valve prostheses: ‘state of the heart’. Regenerative medicine. 2008;3(3):399–419. doi: 10.2217/17460751.3.3.399. [DOI] [PubMed] [Google Scholar]
- 11.Hogan M, Mohamed M, Tao ZW, Gutierrez L, Birla R. Establishing the framework to support bioartificial heart fabrication using fibrin-based three-dimensional artificial heart muscle. Artificial organs. 2015;39(2):165–71. doi: 10.1111/aor.12318. [DOI] [PubMed] [Google Scholar]
- 12.Mohamed MA, Hogan MK, Patel NM, Tao ZW, Gutierrez L, Birla RK. Establishing the Framework for Tissue Engineered Heart Pumps. Cardiovasc Eng Technol. 2015;6(3):220–9. doi: 10.1007/s13239-015-0211-4. [DOI] [PubMed] [Google Scholar]
- 13.Patel NM, Tao ZW, Mohamed MA, Hogan MK, Gutierrez L, Birla RK. Engineering 3D bio-artificial heart muscle: the acellular ventricular extracellular matrix model. ASAIO J. 2015;61(1):61–70. doi: 10.1097/MAT.0000000000000158. [DOI] [PMC free article] [PubMed] [Google Scholar]
- 14.Gilbert TW, Sellaro TL, Badylak SF. Decellularization of tissues and organs. Biomaterials. 2006;27(19):3675–83. doi: 10.1016/j.biomaterials.2006.02.014. [DOI] [PubMed] [Google Scholar]
- 15.Ketchedjian A, Jones AL, Krueger P, Robinson E, Crouch K, Wolfinbarger L, Jr, et al. Recellularization of decellularized allograft scaffolds in ovine great vessel reconstructions. Ann Thorac Surg. 2005;79(3):888–96. doi: 10.1016/j.athoracsur.2004.09.033. discussion 96. [DOI] [PubMed] [Google Scholar]
- 16.Bursac N, Parker KK, Iravanian S, Tung L. Cardiomyocyte cultures with controlled macroscopic anisotropy: a model for functional electrophysiological studies of cardiac muscle. Circulation research. 2002;91(12):e45–54. doi: 10.1161/01.res.0000047530.88338.eb. [DOI] [PubMed] [Google Scholar]
- 17.Salazar B, Reddy A, Tao Z, Madala S, Birla R. 32-Channel System to Measure the Electrophysiological Properties of Bioengineered Cardiac Muscle. IEEE transactions on bio-medical engineering. 2015 doi: 10.1109/TBME.2015.2399437. [DOI] [PubMed] [Google Scholar]
- 18.Salazar BH, Hoffman KA, Reddy AK, Madala S, Birla RK. Noninvasive Measurement of EKG Properties of 3D Artificial Heart Muscle. AIMS Cell and Tissue Engineering. 2017;1(1):12–30. [Google Scholar]
- 19.Blan NR, Birla RK. Design and fabrication of heart muscle using scaffold-based tissue engineering. Journal of Biomedical Materials Research Part A. 2008;86A(1):195–208. doi: 10.1002/jbm.a.31642. [DOI] [PubMed] [Google Scholar]
- 20.Ott HC, Matthiesen TS, Goh SK, Black LD, Kren SM, Netoff TI, et al. Perfusion-decellularized matrix: using nature’s platform to engineer a bioartificial heart. Nature medicine. 2008;14(2):213–21. doi: 10.1038/nm1684. [DOI] [PubMed] [Google Scholar]
- 21.Tao ZW, Mohamed M, Hogan M, Gutierrez L, Birla RK. Optimizing a spontaneously contracting heart tissue patch with rat neonatal cardiac cells on fibrin gel. Journal of tissue engineering and regenerative medicine. 2014 doi: 10.1002/term.1895. [DOI] [PMC free article] [PubMed] [Google Scholar]
- 22.Bursac N, Papadaki M, Cohen RJ, Schoen FJ, Eisenberg SR, Carrier R, et al. Cardiac muscle tissue engineering: toward an in vi tro model for electrophysiological studies. The American journal of physiology. 1999;277(2 Pt 2):H433–44. doi: 10.1152/ajpheart.1999.277.2.H433. [DOI] [PubMed] [Google Scholar]
- 23.Fraser RS, Harley C, Wiley T. Electrocardiogram in the normal rat. Journal of applied physiology. 1967;23(3):401–2. doi: 10.1152/jappl.1967.23.3.401. [DOI] [PubMed] [Google Scholar]
- 24.Sambhi MP, White FN. The electrocardiogram of the normal and hypertensive rat. Circulation research. 1960;8:129–34. doi: 10.1161/01.res.8.1.129. [DOI] [PubMed] [Google Scholar]
Associated Data
This section collects any data citations, data availability statements, or supplementary materials included in this article.
Supplementary Materials
EKG data stream of BAH. (a) BAH electrical activity without stimulus. (b) BAH activity after being submerged in the media -epinephrine mixture
Subplots displaying the electrical potentials of native rat hearts collected (a) EKG subplot using configuration 1. (b) EKG subplot using configuration 2. (c) EKG subplot using configuration 3