Seventy to eighty percent of X-linked retinitis pigmentosa are associated with RPGR mutations. This disease-specific autofluorescence study provides data on baseline values, progression rates, symmetry, and associations with age and genotype. These findings can guide future treatment trials and contribute to clinical care of patients with RPGR-associated retinitis pigmentosa.
Key words: fundus autofluorescence, retinal diseases, retinitis pigmentosa, RPGR
Abstract
Purpose:
Quantitative analysis of hyperautofluorescent rings and progression in subjects with retinitis pigmentosa associated with retinitis pigmentosa GTPase regulator (RPGR) gene mutations.
Methods:
Prospective observational study of 46 subjects. Ring area, horizontal and vertical diameter measurements taken from outer and inner ring borders. Intraobserver repeatability, baseline measurements, progression rates, interocular symmetry, and association with age and genotype were investigated.
Results:
Baseline ring area was 11.8 ± 13.4 mm2 and 11.4 ± 13.2 mm2 for right and left eyes, respectively, with very strong interocular correlation (r = 0.9398; P < 0.0001). Ring area constriction was 1.5 ± 2.0 mm2/year and 1.3 ± 1.9 mm2/year for right and left eyes, respectively, with very strong interocular correlation (r = 0.878, P < 0.0001). Baseline ring area and constriction rate correlated negatively with age (r = −0.767; P < 0.0001 and r = −0.644, P < 0.0001, respectively). Constriction rate correlated strongly with baseline area (r = 0.850, P < 0.0001). Age, but not genotype, exerted a significant effect on constriction rates (P < 0.0001), with greatest rates of progression seen in younger subjects. An exponential decline overall was found.
Conclusion:
This study provides disease-specific baseline values and progression rates together with a repeatability assessment of fundus autofluorescence metrics. Our findings can guide future treatment trials and contribute to the clinical care of patients with RPGR-associated retinitis pigmentosa.
Retinitis pigmentosa (RP) as a collection of genetically diverse disorders is a common form of retinal degeneration with a prevalence of 1:3,000; with 30% to 40% of cases inherited through an autosomal dominant (AD) route, 45% to 60% through an autosomal recessive (AR) route, and 5% to 15% as an X-linked trait.1–6 Three quarters of X-linked RP (XLRP) can be attributed to mutations arising within the retinitis pigmentosa GTPase regulator (RPGR) gene.6–8 RPGR-associated retinopathy is especially severe, as characterized by early disease onset in childhood and fast progression.9
Fundus autofluorescence (FAF) is an established modality for studying retinal structure (and indirectly function) in vivo in RP.10–24 The FAF signal is believed to be derived predominantly from accumulation of lipofuscin/related metabolites in the retinal pigment epithelium25 secondary to photoreceptor outer segment phagocytosis.26 Increased lipofuscin levels have been correlated with photoreceptor loss.27 The presence of abnormally high FAF signal intensity in surviving areas of retina where metabolic activity is high and low or absent signals in regions of outer retinal atrophy has been demonstrated in RP.10,28 Specifically, a parafoveal ring of hyperautofluorescence that constricts over time is evident in patients with RP.13,15–20,24 Ring size has been correlated with retinal function as determined by static and kinetic perimetry, microperimetry, and electrophysiological testing (pattern ERG P50 and multifocal ERG amplitudes), with greater preservation of visual function seen in eyes with larger rings.11–15,22,23 Retinal sensitivity has been found to be relatively well preserved within the ring and conversely low or absent in retinal locations outside the ring.12,19,21,22 Thus, FAF imaging in RP has been demonstrated to be related to visual function and can thereby indirectly provide information regarding macular function. Importantly, this high-signal ring has structural correlates with the inner border of the ring delineating the limits of a relatively intact ellipsoid zone on spectral domain optical coherence tomography.15–17,19–22
The lack of RPGR-associated retinopathy-specific natural history data hampers current efforts to predict factors that may guide both recruitment of suitable candidates for upcoming gene therapy trials and defining which modalities are most suitable for assessing structural measures of success in these trials. Most aforementioned data were derived from RP patients without an established genotype and thereby inherently limit the generalizability of such results. We herein investigate the suitability of FAF-derived metrics in determining baseline characteristics and disease progression in a cohort of molecularly proven RPGR subjects. We have explored and quantified the following: 1) incidence of FAF rings; 2) baseline measurements of FAF rings; 3) suitability and reliability of a broad range of FAF-derived ring metrics in ring quantification; 4) change in ring metrics over time; 5) interocular symmetry of baseline measurements and progression rates; 6) association between baseline ring size and age; 7) associations between progression rates and a) age, b) baseline ring metrics, and c) genotype.
Patients, Methods, and Statistical Analysis
Ethical approval was granted by the ethics committee at Moorfields Eye Hospital for this prospective observational study that is supplemented with FAF images collected prospectively during routine clinical care. Adherence to the Declaration of Helsinki was observed throughout the study. In addition to 33 subjects with bilateral rings who are participants in our on-going RPGR prospective natural history study, an additional 13 subjects were identified through searching the Moorfields Inherited Eye Disease Database. All subjects were affected males with RP associated with likely disease-causing variants in RPGR. Detailed inclusion and exclusion criteria are provided in Figure 1.
Fig. 1.

Flowchart illustrating recruitment of subjects based on the inclusion and exclusion criteria.
All images were acquired by dedicated ophthalmic photographers with either the Spectralis Heidelberg Retina Angiograph (HRA) +OCT device (Heidelberg Engineering, Heidelberg, Germany) or Spectralis HRA2 device (Heidelberg Engineering). A 488-nm excitational wavelength laser and a barrier filter of 500 nm were used for imaging. Images were acquired in either 30°, 35°, or 55° field of view as deemed appropriate at time of imaging. Image analysis with vendor software (Heidelberg Eye Explorer Region Finder version 2.4.3.0) was subsequently performed for each FAF image with the following methods:
1) The outer ring border was first delineated in an ellipsoid shape and ring area obtained from the software, as shown in Figure 2. 2) The Early Treatment Diabetic Retinopathy Study grid was next placed onto the foveal center of the image, as defined by the darkest central spot within the hypofluorescent foveal center. The grid was then adjusted clockwise or anticlockwise to compensate for image rotation, so that its horizontal meridian corresponded to the true horizontal meridian of the fundus image (as determined by the extrapolation of a straight line running from the middle of the optic disk to the foveal center). After adjustment for image rotation, the outer border horizontal diameter was measured—taken from bisecting points of the temporal outer ring border and horizontal grid meridian from one end, passing through the foveal center, and terminating at the bisecting points nasally (Figure 2). The outer border vertical diameter measurement was then taken, from superior to inferior bisecting points (Figure 2). 3) This method was subsequently repeated for inner border–derived measurements, by delineating the inner ring border to obtain inner ring area. 4) Horizontal and vertical diameter measurements running from the inner border through the foveal center were then made based on the same technique as described above for outer border metrics.
Fig. 2.
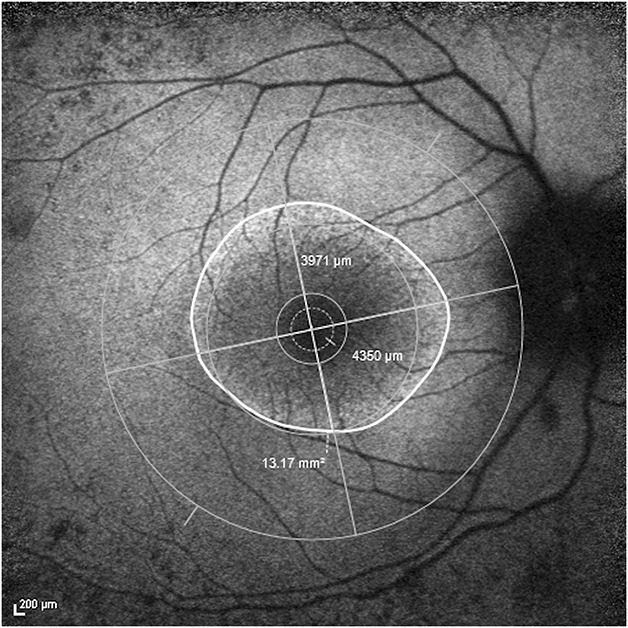
FAF image of the right eye of a subject with superimposed Early Treatment Diabetic Retinopathy Study grid centered on the fovea with anticlockwise adjustment of the vertical and horizontal meridians. Ring area was 13.17 mm2, horizontal diameter was 4,350 μm, and vertical diameter was 3,971 μm. All measurements in this example were obtained from the outer border.
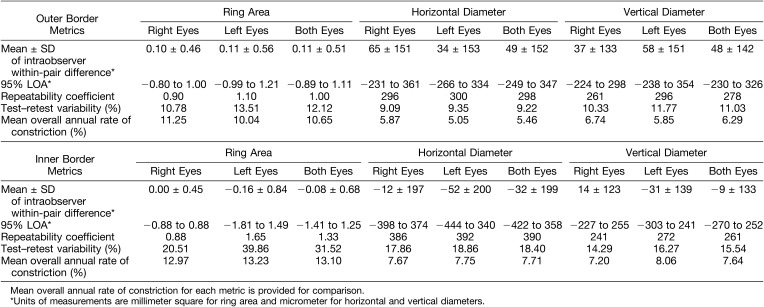
The most recent image for each eye of all subjects was measured twice by a single observer, a minimum of 1 week apart and in random order of the images, to assess the level of intraobserver repeatability. Measurements were kept apart by laterality and only one image per eye per subject was used to maintain the “independence-of-scores” and to avoid inducing systematic bias. Calculation of mean ± SD of within-pair differences and 95% limits of agreement (LOA) were performed with the Bland–Altman method. Repeatability coefficients and test–retest variability for all ring metrics were calculated and these are provided in Table 1, together with corresponding mean overall annual constriction rates for each metric that were calculated from rates of individual subjects as described: all ring metrics measurements (outer and inner border–derived ring area, horizontal and vertical diameters) were plotted on scatter plots as a function of age for each subject, with right eyes kept separate from left eyes. Rates of constriction for each metric for each eye of each subject were obtained from gradients of individual trendlines fitted to data points using a least squares method (Microsoft Excel for Mac version 15.24). Figure 3 provides an example of trendlines for individual subjects fitted to data from outer border–derived ring area measurements of right eyes.
Table 1.
Repeatability Indices Derived From Repeated Measurements of Most Recent FAF Images for Each Subject
Fig. 3.
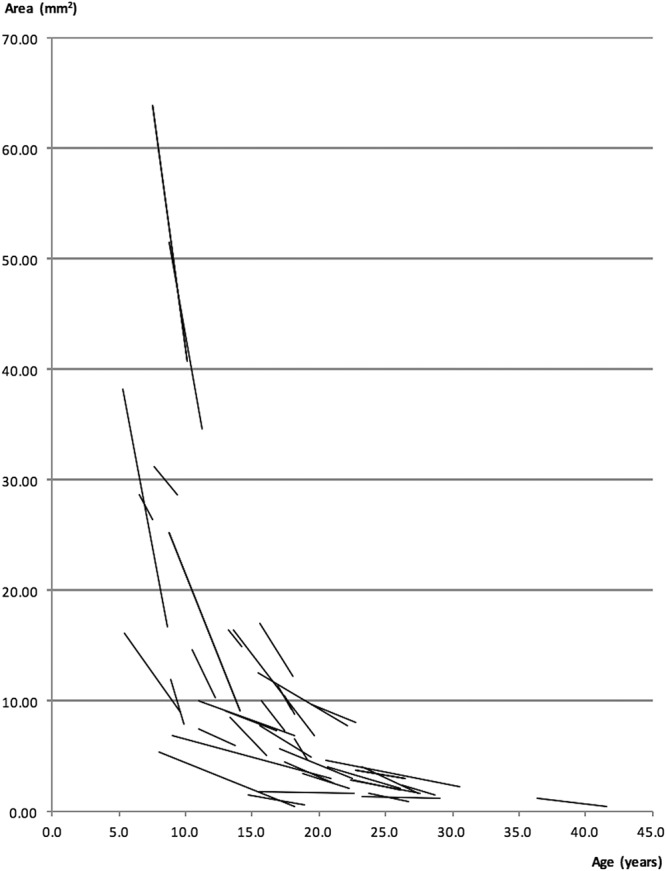
Linear trendlines illustrating the progression rates of individual subjects. In this example, the metric used was ring area measurements, derived from the outer borders of subjects' right eyes.
Statistical analysis was performed with XLSTAT version 18.07 software (Addinsoft, New York, NY). Data are expressed as mean values, with SD and 95% confidence intervals provided were stated. Data were inspected for normality with log10 transformation performed before conducting tests of statistical analyses.
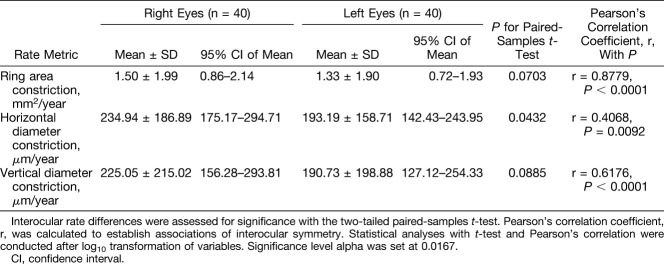
Interocular differences in baseline ring size quantified with outer border metrics were assessed for significance with the two-tailed paired-samples t-test. Pearson's correlation coefficient was calculated to investigate interocular associations of symmetry. Interocular differences in constriction rates derived from outer border metrics were also investigated with the two-tailed paired-samples t-test and Pearson's correlation coefficient.
After this, data from right and left eyes were combined for further analyses. Associations between constriction rates about with respect to baseline measurements and age were investigated with Pearson's correlation coefficient.
A two-way analysis of variance (ANOVA) was performed to investigate the effects of age, genotype, and the interaction of both factors on constriction rates. Genotype was divided into 2 categories depending on RPGR sequence variant position: Exon 1 to 14 or Open Reading Frame 15 (ORF15) variants. Age was divided into 5 categories: Category 1 = <10 years of age, Category 2 = 10 to <15 years, Category 3 = 15 to <20 years, Category 4 = 20 to <25 years, and Category 5 = 25 years of age and above. Post hoc multiple pairwise comparisons were performed with Tukey's test in instances of a significant ANOVA result. Significance level alpha for statistical tests was set at 0.0167 after Bonferroni correction, as tests were simultaneously conducted on 3 ring metrics.
Results
Cohort Characteristics
Ninety-six subjects with FAF imaging were identified in total, of which 46 possessed bilateral rings, as shown in Figure 1. In addition, 38 subjects had a central hyperautofluorescence pattern in the absence of rings in one or both eyes, and 12 subjects had a central hypoautofluorescence pattern in the absence of rings in one or both eyes. The age of subjects (mean ± SD, given in years) in the 3 aforementioned FAF groups are 16.3 ± 7.9 for the bilateral rings group, 35.1 ± 8.8 for the central hyperautofluorescence group, and 53.7 ± 12.2 for the central hypoautofluorescence group. Subject age was calculated from birth to time of baseline FAF image acquisition. The proportion of subjects with bilateral rings distributed in respective age categories are as follows: 19.6% in age Category 1; 17.4% in age Category 2; 30.4% in age Category 3; 13.0% in age Category 4; and 19.6% in age Category 5. A total of 19 of the 46 subjects with bilateral rings harbored mutations in RPGR exons 1 to 14 and 27 in ORF15.
Forty of the 46 subjects had follow-up imaging performed. Mean follow-up period was 49.1 ± 31.2 months (range from 9.1 to 141.6 months). Subjects were followed at variable time intervals. Thirty-four subjects had ≥20 months of FAF follow-up, 5 subjects with 12 months' follow-up, and 1 with follow-up of 9 months. Most subjects (33/40) underwent three or more FAF observations during their follow-up period. Of the 40 subjects with follow-up, a median of 4 FAF observations per subject (range from 2 to 8 observations) giving rise to a total of 168 FAF observations overall were completed.
Metric Repeatability
The results of intraobserver variability assessment and mean annual rates of constriction for each metric are provided in Table 1. It can be seen that variability is least for outer border metrics. Hence, baseline measurements and constriction rates described henceforth are those derived from the outer border.
Baseline Outer Border Ring Metrics and Constriction Rates
Baseline outer border ring measurements for both eyes of all 46 subjects with corresponding P values from interocular comparisons are provided in Table 2. Differences in mean of right and left eyes for all outer border metrics were not statistically significant, and all three metrics were very strongly correlated at baseline with r ≥ 0.9310 and P < 0.0001.
Table 2.
Baseline Measurements Obtained With Outer Border Ring Metrics for Right and Left Eyes of All Subjects
Constriction rates of all ring metrics for each eye of individual subjects were obtained from gradients of linear trendlines as described in the Methods section. In general, linear equations provided the best fit. Figure 3 provides an example of trendlines fitted for each subject. By contrast, Figure 4 shows ring area measurements of all subjects collectively plotted against age. When viewed jointly, the change in area approximates an exponential decline, as confirmed by an exponential equation being the best fit in this instance with an R2 of 0.6867 and 0.6235 for right eyes and left eyes, respectively. The equation for right eyes is given by y = 50.339 e−0.116t and for left eyes, y = 43.742 e−0.110t, where y represents ring area in millimeter square and t represents age in years. The rate constant, k, for right eyes is 0.116 and 0.110 for left eyes. Half-lives calculated for right eyes and left eyes are 5.98 and 6.30 years, respectively.
Fig. 4.
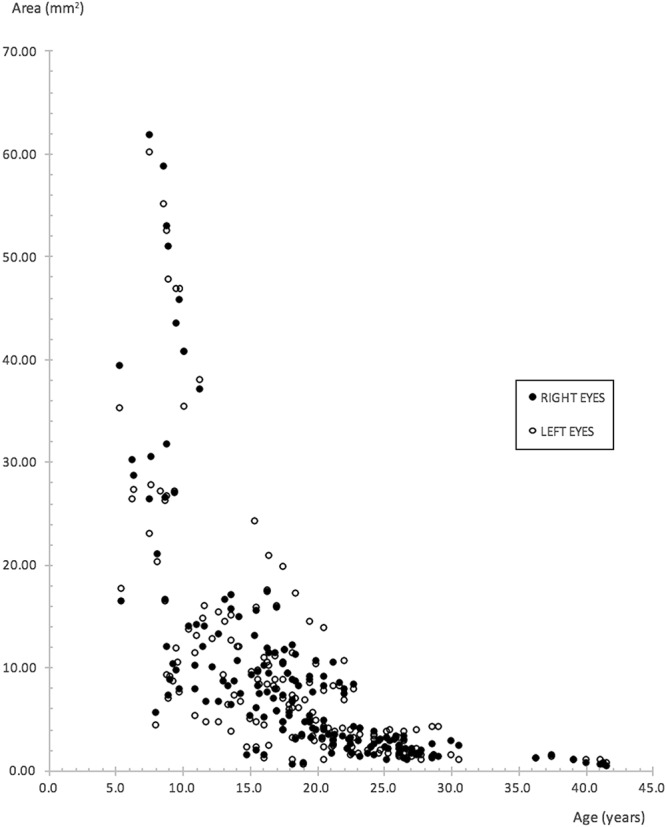
Scatter plot of ring area measurements derived from the outer border for right and left eyes of all subjects, plotted collectively against age. An exponential decline is evident.
Mean constriction rates, together with results from investigations of interocular differences are provided in Table 3. Differences in constriction rates were insignificant for all three ring metrics. Correlation between constriction rates for right and left eyes was strong and significant for rates derived from vertical diameter measurements (r = 0.6176, P < 0.0001) and stronger for rates derived from ring area measurements (r = 0.8779, P < 0.0001). Figure 5 illustrates mean constriction rates of right and left eyes of subjects in the various age categories. Constriction rates across all three ring metrics were greatest for the youngest age category.
Table 3.
Constriction Rates of Each Outer Border Ring Metric for Right and Left Eyes of Subjects
Fig. 5.
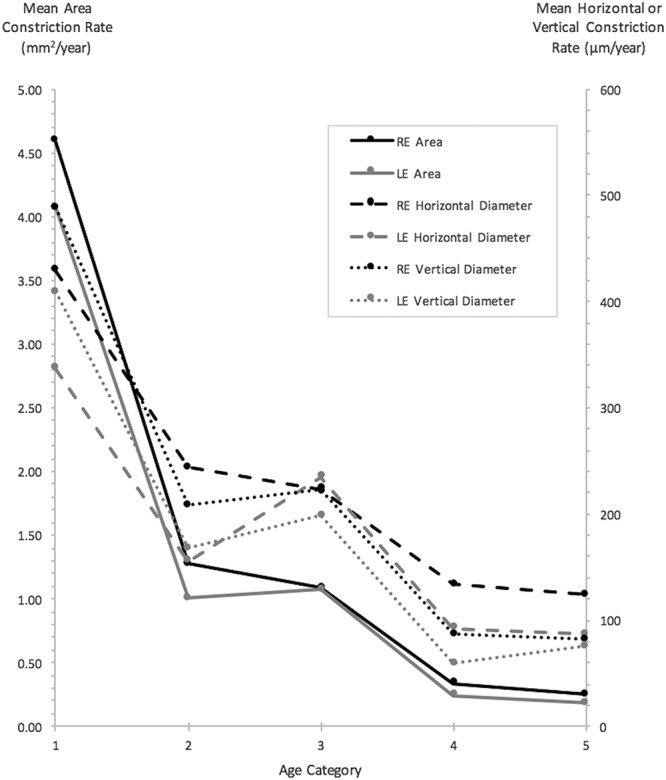
Mean constriction rates for ring area, horizontal, and vertical diameter metrics, for right and left eyes, of subjects grouped within respective age categories. All measurements were obtained from outer borders (age categories: 1 = <10 years of age, 2 = 10 to <15 years of age, 3 = 15 to <20 years of age, 4 = 20 to <25 years of age, and 5 = 25 years of age and above).
Baseline and Constriction Rate Associations
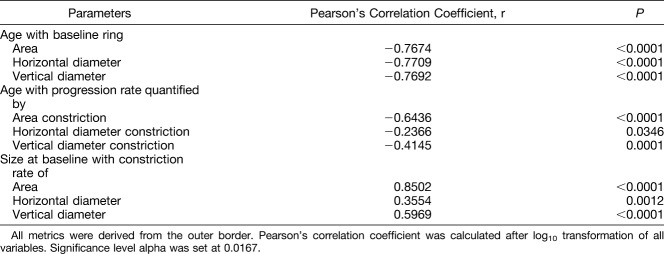
After these aforementioned evaluations, data from right and left eyes were combined for further analyses. The association between constriction rates with baseline measurements and age is shown in Table 4. Ring size at baseline as quantified with all three outer border metrics correlated negatively and strongly with age (r ≥ −0.7674, P < 0.0001 for all 3). Correlation between constriction rates and baseline size for each of the three metrics was found to be strongest for the area-derived (r = 0.8502, P < 0.0001) and vertical diameter–derived metrics (r = 0.5969, P < 0.0001). Correlation for the horizontal diameter–derived metric was also significant, albeit weaker (r = 0.3554, P = 0.0012). In addition, area-derived constriction rates showed the strongest negative correlation with age (r = −0.6436, P < 0.0001), whereas that of vertical diameter rates were moderate in strength (r = −0.4145, P = 0.0001).
Table 4.
Associations Between Age With Baseline Measurements, Progression Rates, and Baseline Size With Progression Rates
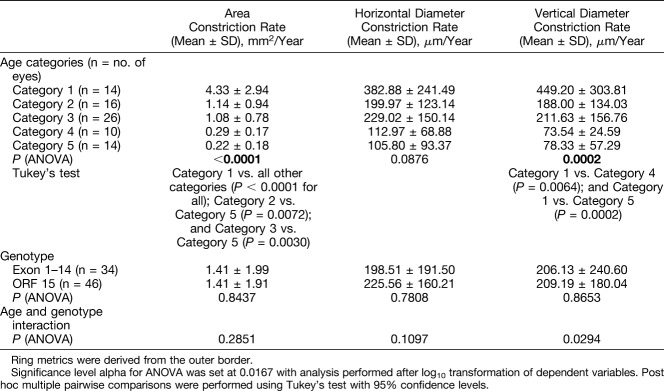
A two-way ANOVA was performed to investigate the effects of age, genotype, and interaction between age and genotype on constriction rates. Analysis of variance results together with mean ± SD values for constriction rates in each category are given in Table 5. The effect of age was significant for constriction rates derived from ring area (P < 0.0001) and vertical diameter (P = 0.0002). Post hoc pairwise comparisons between age categories for area-derived constriction rates disclosed significant differences between younger and older subjects, that is, age Category 1 (youngest) versus all other age categories (P < 0.0001); Category 2 versus Category 5 (P = 0.0072); and Category 3 versus Category 5 (P = 0.0030). Similar findings were made with post hoc pairwise comparisons for vertical diameter–derived constriction rates, in that differences between Category 1 versus Category 5 (P = 0.0002) and Category 1 versus Category 4 (P = 0.0064) reached statistical significance. The effect of genotype on constriction rates, by contrast, was insignificant.
Table 5.
Results of a Two-Way ANOVA
Discussion
In this article, we present the first comprehensive FAF study to describe bilateral progression of disease in a cohort comprising entirely of molecularly proven subjects with RPGR-associated RP. Forty-eight percent of subjects in our study had rings, in comparison with 55% to 69% described in other RP cohorts.15,19,23,24,29 Our subjects with rings are younger in age (16.3 ± 7.9 years of age at time of baseline imaging) in comparison with mean ages of 35 to 49 years described in previous studies.12,18,22,23,29 However, these studies were composed of subjects with both ADRP and ARRP and thereby are genetically diverse, with the possible exception of a study investigating Usher syndrome Type I and II—although these are also genetically heterogeneous.19 Only one study included subjects with molecularly confirmed XLRP—even then comprising only 6% of the entire cohort.24 It is therefore unsurprising that ring findings (including lack/loss of an FAF ring in older subjects) and other FAF observations that signify more advanced disease at a younger age have been identified in our cohort of molecularly proven RPGR RP subjects, as it is relatively more severe with faster progression compared with other genotypes.
Correlation Between Age and Baseline Measurements
We found strong and significant negative correlations between age and baseline measurements for all three outer border ring metrics (r ≥ −0.7674, P < 0.0001 for all 3 metrics). Our findings substantiate weaker associations previously reported between age and ring size in cohorts of mixed inheritance.12,17,30 In addition, numerical age can arguably serve as a good approximation for disease duration in RPGR RP given the early onset of disease in childhood typical for the condition.9
Progression Rates
The progression rates described in our study reflect our cohort of molecularly proven RPGR subjects, which overall renders a greater disease severity. This is in contrast with previous studies where cohorts compose of subjects with mixed inheritance and RP of lesser severities. Thus, our mean annual area of autofluorescence constriction rate of 1.42 mm2 (10.7%), mean annual horizontal and vertical diameter constriction rates of 214.1 μm (5.5%) and 207.9 μm (6.3%), respectively, are greater than previously reported.17–19,24 One recent study of 71 subjects where two-thirds had ARRP, 27% with ADRP, and only 6% with XLRP found mean annual constriction rates of 147 μm (4.1%) and 121 μm (4.0%) for horizontal and vertical diameter outer border ring metrics, respectively.24 A study comprising 8 eyes with ADRP and 6 with ARRP (with no XLRP subjects) reported lower annual outer ring rates of constriction of 2.5% and 2.1% for horizontal and vertical diameters, respectively.18 A mean annual ring constriction rate of 60 μm (3.0%) calculated from outer border ring radius measurements (4.0% with inner border ring radius) was found in 13 patients with Usher syndrome.19 Robson et al described 30 RP subjects with a mixed mode of inheritance who underwent serial FAF imaging with a mean follow-up of 4 years from baseline. Progression was seen in 17 subjects, 16 of these had ARRP including Usher syndrome, with a mean annual inner border ring radius constriction rate of 5.6%.17
Overall Exponential Rate of Decline
To the best of our knowledge, this is the first study to demonstrate an exponential rate of decline in RP on the basis of serial FAF imaging, with the implication that the rate of progression decreases with time (Figure 4). Half-lives of outer border–derived ring area calculated separately for right and left eyes are similar at 6 years. Phenotypic heterogeneity in XLRP-RPGR, however, necessitates individual observations.9 An exponential decline has previously been demonstrated in functional studies,31–33 which were genetically heterogenous with the exception of Iannaccone et al32 who studied subjects with Usher syndrome Type II (which nevertheless was also genetically heterogenous, as subjects were not genetically confirmed). Massof et al observed that the visual field loss occurred exponentially with a similar level of decline across all forms of RP, and this was believed to occur secondary to a common and final process of retinal degeneration. They extrapolated data to estimate the age at which visual field loss began and hypothesized that any difference was due to the earlier onset in XLRP.31
We did not set out to directly compare progression between XLRP-RPGR and other forms of RP in our study; however, we note that others have found a greater rate of progression in XLRP. For instance, Birch et al34 found that the inheritance pattern in RP had a significant effect on progression rates, with annual rod electroretinogram threshold elevation being highest in XLRP and lowest in ADRP. Sandberg et al35 observed a greater annual decline in visual field area in subjects with RPGR-associated RP, compared with subjects with RHO-associated autosomal dominant RP. A 4.7% mean annual exponential rate of decline was observed for RPGR-associated RP, compared with 2.9% for RHO-associated RP. Using structural optical coherence tomography measurements of ellipzoid zone width, Cai et al36 found a significantly greater rate of progression in subjects with XLRP (9.6%/year) compared with ADRP (3.4%/year).
Correlation Between Age and Progression
We found a strong and significant negative correlation between age and rate of area constriction (r = −0.6436, P < 0.0001). Correlation between age and rate of vertical diameter constriction was moderate (r = −0.4145, P = 0.0001), whereas correlation between age and horizontal diameter constriction was weak and insignificant after Bonferroni correction (r = −0.2366, P = 0.0346). By contrast, Robson et al17 did not find correlation between age and constriction rates, nor did they find correlation between constriction rates and baseline ring size. Sujirakul et al24 also did not find differences in constriction rates with age. Both studies comprised a heterogenous mix of RP subjects with various forms of inheritance patterns. This was alluded to as a reason for noncorrelation by Robson et al.17 It is thus possible that potential correlation with age may have been affected by the averaging of results secondary to the inclusion of subjects with different forms of RP, given the wide age range of disease onset and progression rates between different forms.2
Correlation Between Baseline Ring Metrics and Progression
Correlation between baseline size with respective constriction rates was all significant and positive. Area constriction rate correlated very strongly with baseline area (r = 0.8502, P < 0.0001), whereas vertical diameter rate constriction demonstrated a strong correlation with vertical diameter at baseline (r = 0.5969, P < 0.0001). Correlation was weakest for horizontal diameter (r = 0.3554, P = 0.0012). This finding of a significant association between larger baseline measurements and faster progression rates was also reported by Sujirakul et al24 when the cohort was divided into subjects with greater or lesser than a baseline vertical diameter of 3,000 μm. Interestingly, the association between horizontal diameter constriction and baseline metrics in their study was not significant, in keeping with our finding of ring horizontal diameter having the weakest correlation of the three metrics.
Effects of Age and Genotype on Progression
The effects of age were significant on both ring area and vertical diameter constriction rates. Post hoc comparisons showed significant differences between younger subjects, in particular those in age Category 1 compared with older age categories, indicating that progression is maximal in the youngest subjects. There was no effect of genotype on constriction rates.
Although speculative in nature, the effects of age could perhaps be explained by a biochemical model hypothesized by Clarke et al37 whereby each photoreceptor has a risk of death that is constant over time and occurring at random. In the case of younger subjects with larger rings, these large rings represent greater numbers of surviving photoreceptors. It is conceivable that more photoreceptors will die off at the early stages because of the greater numbers of photoreceptors present. This would give rise to a greater initial rate of decline. With age, as the numbers of surviving photoreceptors decrease, so will there be a concomitant decrease in the numbers of photoreceptors dying. Thus, the rate of decline slows in later age. This model can account for the exponential graph shown in Figure 4.
Interocular Symmetry
A high level of interocular symmetry at baseline and for overall rates of progression has been demonstrated in our study. Interocular symmetry at baseline has also been reported by others, for example by Robson et al11 who described a strong interocular correlation (r = 0.94) between internal radii of the FAF rings, as well as symmetry in electrophysiological testing (r = 0.94). More recently, Sujirakul et al30 also reported good overall interocular symmetry of vertical and horizontal diameter ring measures (r = 0.99 and 0.98, respectively). In addition, they did not find a difference in progression rates between eyes.24
Measurement Variability
Wakabayashi et al assessed interobserver variability for horizontal and vertical ring diameter metrics (not stated whether these were inner or outer ring measurements) and their coefficient of repeatability was 240 μm for horizontal and 250 μm for vertical diameter. The 95% LOA was −230 μm to 270 μm and −230 μm to 280 μm. Test–retest variability was 14.0% for horizontal diameter and 20.3% for vertical diameter.16 Three observers in Sujirakul et al measured both horizontal and vertical outer ring diameters. Limits of agreement pairs were calculated for each metric by comparing two observers at a time. The greatest value from the LOA pairs was used as a cutoff for measurement error, that is, measurements exceeding this cutoff were deemed clinically significant. Here, 421 μm and 412 μm were the cutoffs for vertical and horizontal diameter measurements, respectively.30
Sujirakul et al24 also assessed intraobserver variability—arguably more important for planned Phase I/II RP clinical trials. Test–retest variability was 9.5% for horizontal and 9.6% for vertical outer ring diameter metric. Annual rate of constriction in their study was 4.1% (147 μm/year) and 4.0% (121 μm/year) for horizontal and vertical diameter ring metrics, respectively. The 95% LOA calculated from published data was −137 μm to 336 μm for horizontal diameter and −142 μm to 316 μm for vertical diameter metrics. Our intraobserver variability is comparable, with our test–retest variability of 9.2% for horizontal diameter and 11.0% for vertical diameter metrics, and 95% LOA of −249 μm to 347 μm and −230 μm to 326 μm, respectively.
These studies solely used ring diameter metrics for which test–retest variabilities were twice the constriction rate.16,24,30 We have identified ring area (derived from outer border) to be a robust metric—as despite a marginally higher test–retest variability when compared with the diameter metrics, annual rate of constriction is greatest when quantified with the area metric, and approximately of the same magnitude as its corresponding test–retest variability (Table 1). We are confident that constriction rates obtained in our study are robust and real, as multiple observations with relatively long follow-up were obtained on our subjects, in addition to the robust method used to derive constriction rates.
Assessing Suitability by Comparing Annual Mean Constriction Rates With Largest 95% Limits of Agreement Value
Mean rate of area constriction for our entire cohort was 1.42 mm2/year, which is greater than the larger 95% LOA value of 1.11 mm2. In direct contrast, the mean rate of outer border horizontal diameter constriction was 214.1 μm/year that is smaller than the larger LOA value of 347 μm. Likewise, vertical diameter constriction was 207.9 μm/year, which again is smaller than the larger LOA value of 326 μm. As shown in Table 5 and Figure 5, constriction rates are greatest in younger subjects with those in age Category 1 having a mean area constriction rate of 4.33 mm2/year. Thus, our findings of ring area as being the metric of choice to quantify progression may arguably be even more sensitive and robust in younger patients with inherently faster rates of progression, who moreover will likely constitute the target group for intervention.
Choice of Ring Metrics
Previous groups have used various FAF metrics for analysis with no apparent consensus. These include measurements of ring area,15,23 ring horizontal diameter,15,16,18,24 ring vertical diameter,16,18,24,29 and ring radius.11,12,17,19,22 Others have preferred either measurements taken from the inner borders of the rings15 or from the outer borders,18,24,30 with the rationale that one border can be more accurately demarcated over the other. It is of note that none of these studies have provided results from objective investigations of measurement repeatability to substantiate their preferences. We have undertaken such assessments for ring and diameter metrics derived from both borders in our study. Furthermore, none of the studies that measure diameters on sequential images have corrected for image rotation, which represents a significant limitation.
Conclusion
Our study with a relatively long period of follow-up has allowed us to obtain sufficient data points to be the first FAF study to demonstrate an overall exponential decline in progression rate with age. Future studies will likely require longer periods of follow-up that is, 20 years or more to plot individual exponential decline.
Fundus autofluorescence imaging is reproducible and widely available in retinal clinics worldwide; hence, we advocate its regular use in monitoring progression in RP. Our finding of outer border–derived ring area as the most sensitive and valid metric to detect change will guide metric choice for interventional trials when assessing disease progression.
In addition, we have presented longitudinal data using FAF ring metrics to characterize baseline values and progression rates in RPGR-associated RP. The rate of progression is dependent on age and baseline ring size. In general, there is good overall interocular symmetry. These findings will be useful in informing patient selection and outcome measures in future treatment trials, as well as clinicians providing prognostic information to patients with RPGR-associated RP.
Footnotes
Supported by grants from the National Institute for Health Research Biomedical Research Centre at Moorfields Eye Hospital National Health Service Foundation Trust and UCL Institute of Ophthalmology (United Kingdom), Fight For Sight (United Kingdom), Moorfields Eye Hospital Special Trustees (United Kingdom), Moorfields Eye Charity (United Kingdom), the Foundation Fighting Blindness (USA), Retinitis Pigmentosa Fighting Blindness (United Kingdom), and the Wellcome Trust (099173/Z/12/Z). M. Michaelides is supported by an FFB Career Development Award.
M. Michaelides consults for MeiraGTx and Astellas. The remaining authors have no conflicts of interest to disclose.
References
- 1.Hartong DT, Berson EL, Dryja TP. Retinitis pigmentosa. Lancet 2006;368:1795–1809. [DOI] [PubMed] [Google Scholar]
- 2.Hamel C. Retinitis pigmentosa. Orphanet J Rare Dis 2006;1:40. [DOI] [PMC free article] [PubMed] [Google Scholar]
- 3.Xu Y, Guan L, Shen T, et al. Mutations of 60 known causative genes in 157 families with retinitis pigmentosa based on exome sequencing. Hum Genet 2014;133:1255–1271. [DOI] [PubMed] [Google Scholar]
- 4.You QS, Xu L, Wang YX, et al. Prevalence of retinitis pigmentosa in North China: the Beijing eye public health care project. Acta Ophthalmol 2013;91:e499–e500. [DOI] [PubMed] [Google Scholar]
- 5.Haim M. Epidemiology of retinitis pigmentosa in Denmark. Acta Ophthalmol Scand Suppl 2002;233:1–34. [DOI] [PubMed] [Google Scholar]
- 6.Pelletier V, Jambou M, Delphin N, et al. Comprehensive survey of mutations in RP2 and RPGR in patients affected with distinct retinal dystrophies: genotype-phenotype correlations and impact on genetic counseling. Hum Mutat 2007;28:81–91. [DOI] [PubMed] [Google Scholar]
- 7.Shu X, Black GC, Rice JM, et al. RPGR mutation analysis and disease: an update. Hum Mutat 2007;28:322–328. [DOI] [PubMed] [Google Scholar]
- 8.Sharon D, Sandberg MA, Rabe VW, et al. RP2 and RPGR mutations and clinical correlations in patients with X-linked retinitis pigmentosa. Am J Hum Genet 2003;73:1131–1146. [DOI] [PMC free article] [PubMed] [Google Scholar]
- 9.Tee JJ, Smith AJ, Hardcastle AJ, Michaelides M. RPGR-associated retinopathy: clinical features, molecular genetics, animal models and therapeutic options. Br J Ophthalmol 2016;100:1022–1027. [DOI] [PubMed] [Google Scholar]
- 10.von Ruckmann A, Fitzke FW, Bird AC. Distribution of pigment epithelium autofluorescence in retinal disease state recorded in vivo and its change over time. Graefes Arch Clin Exp Ophthalmol 1999;237:1–9. [DOI] [PubMed] [Google Scholar]
- 11.Robson AG, El-Amir A, Bailey C, et al. Pattern ERG correlates of abnormal fundus autofluorescence in patients with retinitis pigmentosa and normal visual acuity. Invest Ophthalmol Vis Sci 2003;44:3544–3550. [DOI] [PubMed] [Google Scholar]
- 12.Popovic P, Jarc-Vidmar M, Hawlina M. Abnormal fundus autofluorescence in relation to retinal function in patients with retinitis pigmentosa. Graefes Arch Clin Exp Ophthalmol 2005;243:1018–1027. [DOI] [PubMed] [Google Scholar]
- 13.Robson AG, Saihan Z, Jenkins SA, et al. Functional characterisation and serial imaging of abnormal fundus autofluorescence in patients with retinitis pigmentosa and normal visual acuity. Br J Ophthalmol 2006;90:472–479. [DOI] [PMC free article] [PubMed] [Google Scholar]
- 14.Robson AG, Michaelides M, Saihan Z, et al. Functional characteristics of patients with retinal dystrophy that manifest abnormal parafoveal annuli of high density fundus autofluorescence; a review and update. Doc Ophthalmol 2008;116:79–89. [DOI] [PMC free article] [PubMed] [Google Scholar]
- 15.Aizawa S, Mitamura Y, Hagiwara A, et al. Changes of fundus autofluorescence, photoreceptor inner and outer segment junction line, and visual function in patients with retinitis pigmentosa. Clin Exp Ophthalmol 2010;38:597–604. [DOI] [PubMed] [Google Scholar]
- 16.Wakabayashi T, Sawa M, Gomi F, Tsujikawa M. Correlation of fundus autofluorescence with photoreceptor morphology and functional changes in eyes with retinitis pigmentosa. Acta Ophthalmol 2010;88:e177–e183. [DOI] [PubMed] [Google Scholar]
- 17.Robson AG, Tufail A, Fitzke F, et al. Serial imaging and structure-function correlates of high-density rings of fundus autofluorescence in retinitis pigmentosa. Retina 2011;31:1670–1679. [DOI] [PubMed] [Google Scholar]
- 18.Lima LH, Burke T, Greenstein VC, et al. Progressive constriction of the hyperautofluorescent ring in retinitis pigmentosa. Am J Ophthalmol 2012;153:718–727. 727.e711–e712. [DOI] [PMC free article] [PubMed] [Google Scholar]
- 19.Fakin A, Jarc-Vidmar M, Glavac D, et al. Fundus autofluorescence and optical coherence tomography in relation to visual function in Usher syndrome type 1 and 2. Vis Res 2012;75:60–70. [DOI] [PubMed] [Google Scholar]
- 20.Robson AG, Lenassi E, Saihan Z, et al. Comparison of fundus autofluorescence with photopic and scotopic fine matrix mapping in patients with retinitis pigmentosa: 4- to 8-year follow-up. Invest Ophthalmol Vis Sci 2012;53:6187–6195. [DOI] [PubMed] [Google Scholar]
- 21.Lenassi E, Troeger E, Wilke R, Hawlina M. Correlation between macular morphology and sensitivity in patients with retinitis pigmentosa and hyperautofluorescent ring. Invest Ophthalmol Vis Sci 2012;53:47–52. [DOI] [PubMed] [Google Scholar]
- 22.Greenstein VC, Duncker T, Holopigian K, et al. Structural and functional changes associated with normal and abnormal fundus autofluorescence in patients with retinitis pigmentosa. Retina 2012;32:349–357. [DOI] [PMC free article] [PubMed] [Google Scholar]
- 23.Iriyama A, Yanagi Y. Fundus autofluorescence and retinal structure as determined by spectral domain optical coherence tomography, and retinal function in retinitis pigmentosa. Graefes Arch Clin Exp Ophthalmol 2012;250:333–339. [DOI] [PubMed] [Google Scholar]
- 24.Sujirakul T, Lin MK, Duong J, et al. Multimodal imaging of central retinal disease progression in a 2-year mean follow-up of retinitis pigmentosa. Am J Ophthalmol 2015;160:786–798 e784. [DOI] [PMC free article] [PubMed] [Google Scholar]
- 25.Delori FC, Dorey CK, Staurenghi G, et al. In vivo fluorescence of the ocular fundus exhibits retinal pigment epithelium lipofuscin characteristics. Invest Ophthalmol Vis Sci 1995;36:718–729. [PubMed] [Google Scholar]
- 26.Feeney-Burns L, Berman ER, Rothman H. Lipofuscin of human retinal pigment epithelium. Am J Ophthalmol 1980;90:783–791. [DOI] [PubMed] [Google Scholar]
- 27.Dorey CK, Wu G, Ebenstein D, et al. Cell loss in the ageing retina: relationship to lipofuscin accumulation and macular degeneration. Invest Ophthalmol Vis Sci 1989;30:1691. [PubMed] [Google Scholar]
- 28.von Ruckmann A, Fitzke FW, Bird AC. Distribution of fundus autofluorescence with a scanning laser ophthalmoscope. Br J Ophthalmol 1995;79:407–412. [DOI] [PMC free article] [PubMed] [Google Scholar]
- 29.Murakami T, Akimoto M, Ooto S, et al. Association between abnormal autofluorescence and photoreceptor disorganization in retinitis pigmentosa. Am J Ophthalmol 2008;145:687–694. [DOI] [PubMed] [Google Scholar]
- 30.Sujirakul T, Davis R, Erol D, et al. Bilateral concordance of the fundus hyperautofluorescent ring in typical retinitis pigmentosa patients. Ophthalmic Genet 2015;36:113–122. [DOI] [PMC free article] [PubMed] [Google Scholar]
- 31.Massof RW, Dagnelie G, Benzschawel T. First order dynamics of visual field loss in retinitis pigmentosa. Clin Vis Sci 1990;5:1–26. [Google Scholar]
- 32.Iannaccone A, Kritchevsky SB, Ciccarelli ML, et al. Kinetics of visual field loss in Usher syndrome type II. Invest Ophthalmol Vis Sci 2004;45:784–792. [DOI] [PubMed] [Google Scholar]
- 33.Berson EL. Long-term visual prognoses in patients with retinitis pigmentosa: the Ludwig von Sallmann lecture. Exp Eye Res 2007;85:7–14. [DOI] [PMC free article] [PubMed] [Google Scholar]
- 34.Birch DG, Anderson JL, Fish GE. Yearly rates of rod and cone functional loss in retinitis pigmentosa and cone-rod dystrophy. Ophthalmology 1999;106:258–268. [DOI] [PubMed] [Google Scholar]
- 35.Sandberg MA, Rosner B, Weigel-DiFranco C, et al. Disease course of patients with X-linked retinitis pigmentosa due to RPGR gene mutations. Invest Ophthalmol Vis Sci 2007;48:1298–1304. [DOI] [PubMed] [Google Scholar]
- 36.Cai CX, Locke KG, Ramachandran R, et al. A comparison of progressive loss of the ellipsoid zone (EZ) band in autosomal dominant and x-linked retinitis pigmentosa. Invest Ophthalmol Vis Sci 2014;55:7417–7422. [DOI] [PMC free article] [PubMed] [Google Scholar]
- 37.Clarke G, Collins RA, Leavitt BR, et al. A one-hit model of cell death in inherited neuronal degenerations. Nature 2000;406:195–199. [DOI] [PubMed] [Google Scholar]


