

Abstract
Seminoma is the most common testicular germ cell tumor worldwide and mainly occurs in 15‐35‐year‐old young men. Early studies have indicated that testicular nuclear receptor 4 (TR4) first cloned from testis is involved in the invasion and metastasis of several human tumors; however, little attention is paid to the function of TR4 in seminoma. Our immunohistochemical (IHC) staining results showed that patients with advanced stage tumors tended to have higher expression of TR4. Importantly, there was a significant association between elevated TR4 expression and reduced overall survival in seminoma patients. In vitro MTS, western blot and transwell assays, after manipulating TR4 expression in Tcam‐2 cells, revealed that TR4 induced epithelial‐to‐mesenchymal transition (EMT) and promoted Tcam‐2 cell proliferation and invasion. Mechanism dissection demonstrated that AKT3, a critical component in the signaling pathway, played a crucial role in mediating TR4‐promoted Tcam‐2 cell proliferation and invasion. We further revealed that TR4 modulated AKT3 at the transcriptional level via chromatin immunoprecipitation and luciferase assays. Meanwhile, addition of the AKT3 siRNA blocked the function of TR4. Overall, these findings first elucidate that TR4 is a novel prognostic marker and plays a critical role in the metastatic capacity of Tcam‐2 cells by EMT regulation and, consequently, targeting TR4‐AKT3 pathway may serve as a potential therapeutic approach for seminoma.
Keywords: AKT3, clinical outcome, metastasis, seminoma, TR4
1. INTRODUCTION
Testicular cancer is the most common cancer diagnosed for men from 15 to 35 years old, with seminoma accounting for 40%‐60% of cases.1, 2 Although the 5‐year survival rate for testicular cancer confined to the testis is approximately 99.2%, the rate drops to 73.1% for those who suffer from distant metastasis.3, 4, 5 However, the precise molecular pathogenesis and the progression mechanisms of seminoma remain uncertain.6, 7 To date, no reliable biological parameter is available to differentiate metastasized stages from non‐metastasized seminoma.8
The testicular nuclear receptor 4 (TR4), an alias for the nuclear receptor subfamily 2 group C member 2 (NR2C2) gene, is a transcriptional regulator that belongs to the nuclear receptor superfamily, which can regulate gene expression at transcription level by binding to the AGGTCA direct repeat separated by a variable length of DNA.9 In vivo studies of TR4 knockout mice (TR4−/−) suggested that TR4 might play important roles in modulating the physiological process, including glucose, lipid and bone metabolism, fertility and aging.10 Recently, the impacts of TR4 on development and therapy resistance of various cancers have also been investigated. The results revealed that TR4 could promote progression of prostate cancer, renal cell carcinoma and non‐small cell lung cancer as well as boost radio/chemo‐therapy resistance of prostate cancer.11, 12 The influence of TR4 on seminoma progression, however, remains unclear. AKT is known to be the central protein of signaling pathway involved in cell survival, tumor metastasis, drug resistance, metabolism and radiation resistance.13 There are three different AKT isoforms, AKT1, AKT2 and AKT3. Although former studies have focused on the role of Akt1 and Akt2 in cancer progression, little is known about AKT3.
In the current work, we aimed to explore the contribution of TR4 in seminoma progression and found that TR4 might be able to function through activation of the AKT3 expression to drive the EMT phenotype and enhance the seminoma cell proliferation and invasion. Overall, these results suggested a novel biological parameter to distinguish metastasized stages and a potential therapeutic target for seminoma.
2. MATERIALS AND METHODS
2.1. Cell culture
Testicular seminoma TCam‐2 cells were obtained from Professor Remko Hersmus (Department of Pathology, LEPO laboratory, Rotterdam, the Netherlands) and were maintained in DMEM medium at 37°C in a humidified 5% CO2 atmosphere. 293T and Cos‐7 obtained from American Type Culture Collection (ATCC, Manassas, VA, USA) were cultured in the same condition.
2.2. Antibodies and reagents
Anti‐TR4 antibody (ab109301) was purchased from Abcam. Anti‐GAPDH (6c5) antibody (sc‐202525) were purchased from Santa Cruz Biotechnology (Santa Cruz, CA, USA). Anti‐AKT1 (ab81283), Anti‐AKT2 (ab38513) and Anti‐AKT3 (ab152157) antibodies were purchased from Abcam. Anti‐snail (ab53519), Anti‐E‐cadherin (ab1416), Anti‐N‐cadherin (ab18203) and Anti‐vimentin (ab8978) antibodies were purchased from Abcam.
2.3. Plasmids
To construct the pWPI‐TR4 plasmid, full‐length TR4 cDNA was ligated into the PmeI site of the pWPI vector. The short hairpin TR4 (shTR4) sequence (5′‐cgggagaaaccaagcaattg‐3′) was cloned into the AgeI and EcoRI sites of pLKO.1 vector. pcDNA3.1/TR4 eukaryotic expressing plasmid containing human TR4 cDNA full length fragment (1847 bp) and neo resistance‐gene was cloned in between Not I and Xho I. pcDNA3.1/vector is empty carrier as control. For the construction of the AKT3 promoter luciferase (Luc) reporter, a total 1‐kb human AKT3 promoter sequence was amplified by PCR from human genomic DNA using KOD‐Plus‐Neo DNA polymerase (TOYOBO, Osaka, Japan) and then inserted into the pGL3 basic plasmid between the Mlu1 and Xho1 sites.
2.4. Lentiviral infection
For the infection of lentivirus, 293T cells were transfected with a mixture of DNA consisting of vector control (pWPI‐vector) or TR4 (pWPI‐TR4) plasmids with a mixture of pWPI, PAX2 (virus packaging plasmid) and pMD2G (envelope plasmid) (4:3:2 ratio) using Lipofectamine 3000 (Invitrogen, Hangzhou, China). Lentiviral supernants were then collected to infect Tcam‐2 cells. After viral infection, the media was replaced with normal culture media. The stable cells were selected by puromycin and confirmed by quantitative real‐time PCR (qPCR) and western blot.
2.5. RT‐quantitative PCR
Total RNAs were isolated from Tcam‐2 cells using TRIzolVR Reagent (Invitrogen). RNA (2 μg) was used as a template for the first‐strand cDNA synthesized by Transcriptor First Strand cDNA Synthesis Kit (Roche, Hangzhou, China). The TR4 primer: forward: 5′‐GGCTCTGAACCTGCCTCTG‐3′; reverse: 5′‐AGGATGAACTGCTGTTTGGG‐3. GAPDH: forward: 5′‐GGAGTCAACGGATTTGGT‐3′; reverse: 5′‐GTGATGGGATTTCCATTGAT‐3′. AKT3: forward: 5′‐GGAGTCATCATGAGCGATGTT‐3′; reverse: 5′‐AAGGAAGTATCTTGGCCTCCA‐3′. E‐cadherin: forward: 5′‐CGAGAGCTACACGTTCACGG‐3′; reverse: 5′‐GGGTGTCGAGGGAAAAATAGG‐3′ N‐cadherin: forward: 5′‐AGCCAACCTTAACTGAGGAGT‐3′; reverse: 5′‐GGCAAGTTGATTGGAGGGATG‐3′. Vimentin: forward: 5′‐GACGCCATCAACACCGAGTT‐3′; reverse: 5′‐CTTTGTCGTTGGTTAGCTGGT‐3′. Snali: forward: ACTGCAACAAGGAATACCTCAG; reverse: GCACTGGTACTTCTTGACATCTG. The resultant cDNA was then used to carry out real‐time quantitative RT‐PCR, using ROCHE Real Master Mix (SYBR) Green and ROCHE PCR480 reaction apparatuses (USA). The results were analyzed using the 2−▵▵Ct method.
2.6. MTS assay
The Tcam‐2 cells were plated on 96‐well plates at a density of 5 × 10³ per well. We added MTS (CellTiter 96‐cell proliferation assay kit; Promega, Madison, WI, USA) into each well after 0, 1, 2, 3 and 4 days in culture. We read the absorbance at 490 nm to determine the cells’ viability in each well.
2.7. Colony formation assay
Approximately 1000 transfected Tcam‐2 cells were replated into 6‐well dishes. Two weeks later, visible colonies were fixed and stained with crystal violet, and the colony formation ratio was calculated with the following formula: (visible colony numbers/original number of cells) × 100%. Data are presented as the mean ± SD and experiments were performed in triplicate.
2.8. Western blotting
Cells were harvested and washed twice with cold PBS, then resuspended and lysed in RIPA buffer (1% NP‐40, 0.5% sodium deoxycholate, 0.1% SDS, 10 ng/mL PMSF, 0.03% aprotinin, 1 μ mol L−1 sodium orthovanadate) at 4°C for 30 minutes. Lysates were centrifuged for 20 minutes at 14 000 g and supernatants were stored at −80°C as whole cell extracts. Total protein concentrations were determined by bicinchoninic acid protein assay kit. Proteins (20 μg) were separated on 10% SDS‐PAGE gels and transferred to polyvinylidene difluoride membranes. After blocking membranes with 5% BSA, they were incubated with appropriate dilutions of specific primary antibodies. Corresponding HRP‐conjugated secondary antibodies were used against each primary antibody. Proteins were detected using the chemiluminescent detection reagents.
2.9. siRNA transfection
We planted Tcam‐2 cells at a density of 8 × 10⁴ per well in a 6‐well culture plate. At the same time, the cells were transfected with AKT3 siRNA using Lipofectamine RNAiMAX Reagent (Invitrogen) according to the manufacturer instructions. At 48 hours after transfection, the cells were harvested for further evaluation. AKT3 siRNA and negative control siRNA were purchased from Ribobio (Guangzhou, China).
2.10. Immunofluorescence staining
Stable transfected cells were cultured in 60‐mm culture plates and trypsinized then plated in chamber slides (Millicell EZ Slides, EMD Millipore, Billerica, MA, USA). Cells were then fixed with 4.0% paraformaldehyde in PBS for 30 minutes and then permeabilized with 0.2% Triton X‐100 for 15 minutes at room temperature. After rinsing twice with PBS, cells were incubated for 1‐2 hours with N‐cadherin (1:200), anti‐E‐cadherin (1:200) or anti‐AKT3 (1:200). Cells were then washed with PBS and incubated with secondary antibody (Rhodamine TRITC‐Conjugated Affinity Pure Goat Anti‐Rabbit IgG, ZSBIO, Beijing, China) for 45 minutes. Nuclei were counterstained with DAPI for 10 minutes at room temperature. The cells were then observed under a TCS‐SP5 confocal laser scanning microscope (LEICA, Wetzlar, Germany).
2.11. Immunohistochemical staining
Tissues were fixed in 10% (v/v) formaldehyde in PBS, embedded in paraffin and cut into 4‐mm sections and used for IHC staining with human TR4 antibodies. To enhance antigen exposure, the slides were treated with 1X EDTA at 98°C for 10 minutes for antigen retrieval. The slides were incubated with endogenous peroxidase blocking solution to inhibit endogenous peroxidase and were then incubated with the primary antibody at room temperature for 60 minutes. After rinsing with Tris‐buffered saline, the slides were incubated for 45 minutes with biotin‐conjugated secondary antibody, washed, and then incubated with enzyme conjugate HRP‐streptavidin. Freshly prepared DAB (Zymed, South San Francisco, CA, USA) was used as a substrate to detect HRP. Finally, slides were counterstained with hematoxylin and mounted with aqueous mounting media. German immunoreactive score (IRS) was applied to testify the protein levels. First, the IRS assigns subscores for the percentage of immunoreactive cells (0‐4) and immunoreactive intensity (0‐3), then multiplies them to yield the IRS score, which ranged from 0 to 12. The percent positivity was scored as “0” (<1%), “1” (1%‐10%), “2” (11%‐50%), “3” (51%‐80%) and “4” (>80%). The staining intensity was scored as “0” (negative), “1” (weak), “2” (moderate) and “3” (strong). Scores were considered negative (0‐1), weakly positive (2‐4), moderately positive (6‐8) and strongly positive (9‐12). Studies on human tissue samples were conducted with approval from the Ethics Committee of the Sir Run Run Shaw Hospital, Zhejiang University.
2.12. Cell migration and invasion assays
Briefly, cells were seeded in top chambers of the transwell plates (BD Biosciences, San Jose, CA, USA) in 5% serum media with membrane inserts coated either with or without Matrigel (8%) for invasion and migration tests, respectively. Bottom chambers were filled with DMEM medium with 10% FBS. After 12‐18 hours (for migration) or 36‐48 hours (for invasion) incubation, cells that migrated/invaded to the lower surface of the membrane were fixed and stained, and the cell numbers in six random fields were counted under the light microscope.
2.13. ChIP assay
Tcam‐2 cells (1.5 × 10⁷) were fixed with 1% formaldehyde, pelleted, washed and resuspended in 400 μL SDS lysis buffer. After 10 minutes incubation on ice, 600 μL ChIP dilution buffer was added and genomic DNA was sheared by sonication to an average size of 500 bp. After removing 5% of the solution for evaluation of the input complex, the lysates were divided into two equal parts and immunoprecipitated overnight at 4°C using 4 μg TR4 antibody (or control IgG). The immunocomplexes were collected using 30‐μL salmon sperm DNA‐protein A agarose beads, washed sequentially with ChIP wash buffer 1, buffer 2 and buffer 3 and twice with 10 m mol L−1 Tris‐HCl/pH 8.0 and 1 m mol L−1 EDTA/pH 8.0. DNA‐protein complexes were collected in ChIP elution buffer and disrupted by incubation at 65°C for 5 hours in the presence of 312 m mol L−1 NaCl and 0.06 μg ribonuclease A/mL. Proteins were removed by digestion with proteinase K at 65°C for 2 hours. Specific primer was designed to amplify a target sequence within human AKT3 promoter, F: GCAGCAGAGAATCCAAACCC . R: CCCTCTTCTGAACCCAACCT PCR products were identified by agarose gel electrophoresis.
2.14. Luciferase reporter gene assays
The human promoter region of AKT3 was inserted into pGL3‐basic vector (Promega). Cells were plated in 24‐well plates and transfected with pGL3‐reporter constructs, 1 ng pRL‐cmv vector and pcDNA3.1 vector/TR4 using X‐tremeGENE HP DNA Transfection Reagent (Roche). Cell lysates were prepared with Passive Lysis Buffer (Promega) 48 hours after transfection and luciferase activities were measured using the Dual Luciferase Reporter Assay (Promega). pRL‐cmv was used as an internal control that served as the baseline control response.
2.15. Statistical analysis
Data are shown as the mean ± SEM. In each experiment, all determinations were performed at least in triplicate. Statistical significance between two measurements was determined by the two‐tailed unpaired Student's t‐test and data were analyzed with the Prism 4.0 statistical program (GraphPad Software, San Diego, CA, USA). P < .05 was considered statistically significant.
3. RESULTS
3.1. TR4 was a positive regulator of progression and poor outcome in seminoma
In order to determine the clinical significance of TR4 in seminoma progression, we first investigated the TR4 expression between lower clinical stage (stage I) and higher clinical stage (stage III). Interestingly, the IHC data revealed elevated TR4 expression in patients with higher clinical tumor stage (Figure 1A). The characteristics of 25 seminoma patients are shown in Table 1. Moreover, TR4 positive frequency was also higher in those patients with higher clinical stage (Figure 1B). Consistently, the mRNA expression of TR4 is positively related with clinical tumor stage in The Cancer Genome Atlas (TCGA) database (Figure 1C). In addition, we found that seminoma patients with higher expression of TR4 tended to have a poorer outcome. As is shown in Figure 1D, increased TR4 expression was associated with shorter overall survival. In summary, these findings suggested that TR4 expression might be positively correlated with seminoma progression and poor survival.
Figure 1.
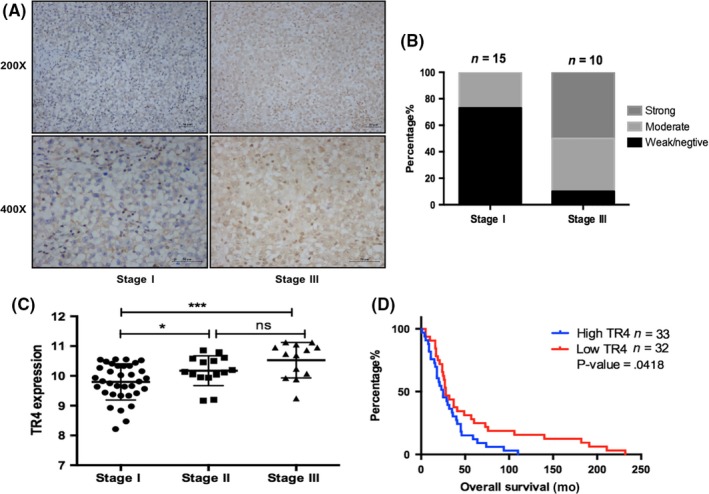
TR4 expression is positively related with higher clinical stage and shorter disease‐free survival. (A,B) Clinical tumor tissues of different stages were obtained from Sir Run Run Shaw Hospital, Zhejiang University School of Medicine, Hangzhou, China. The left panels show imaging and quantification is shown on the right. Magnification, 200 × (upper) and 400 × (lower). (C) Analysis of TR4 mRNA expression with seminoma clinical stage. (D) Overall survival analysis of TR4 expression in the TCGA seminoma database (N = 65). The samples were divided into two groups according to the expression of TR4. ns, no significance
Table 1.
Patient characteristics of 25 seminoma patients
| Variables | Case number (N = 25) N (%) or mean (range) |
|---|---|
| Gender | |
| Male (%) | 25 (100) |
| Age (y) | 32 (23‐58) |
| Histology | |
| Seminoma (%) | 25 (100) |
| Tumor size (cm) | 7.93 (4.8‐20) |
| TNM stage | |
| I (%) | 15 (60) |
| II | |
| III (%) | 10 (40) |
| Treatment (%) | |
| Surgery + Surveillance | 3 (12) |
| Surgery + Chemotherapy | 8 (32) |
| Surgery + Radiotherapy | 10 (40) |
| Surgery + Radiotherapy + Chemotherapy | 4 (16) |
3.2. TR4 enhanced the proliferation ability in seminoma cells
Because TR4 expression was increased in advanced clinical tumor samples, we first tested whether TR4 had an influence on the proliferation of seminoma cells. Elevated or reduced levels of TR4 in the Tcam‐2 cells were confirmed by QPCR and western blot assays, respectively (Figure 2A). Using an MTS growth assay, we found that overexpression of TR4 accelerated seminoma cell proliferation as compared to the vector group. Meanwhile, decreased expression of TR4 inhibited Tcam‐2 cell proliferation (Figure 2B). In addition, colony formation analysis showed that upregulation of TR4 significantly enhanced the colony formation rates of Tcam‐2 cells, whereas knocking down of TR4 significantly diminished the colony formation rates (Figure 2C).
Figure 2.
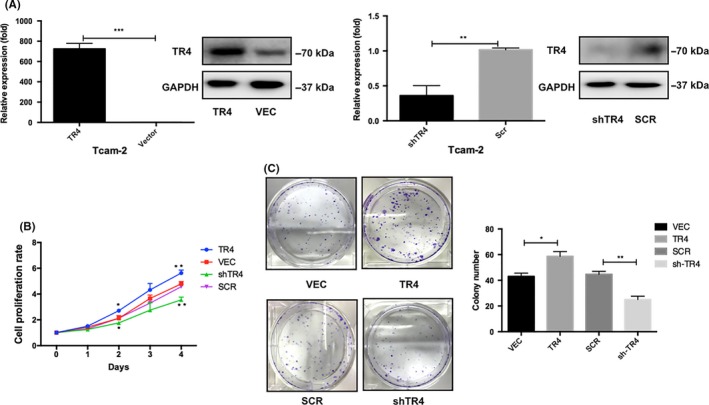
TR4 enhances the proliferation ability in seminoma Cells. (A) Overexpression of TR4 and knockdown of TR4 are verified by quantitative PCR and western blotting in Tcam‐2 cells. (B) Cell proliferation after TR4 overexpression and knockdown in Tcam‐2 cells is measured by using MTS assays. (C) Colony‐formation assays are conducted to determine the effect of TR4 on Tcam‐2 cells proliferation. Data are mean ± SD values from three experiments, each performed in triplicate. SCR, scramble; VEC, vector
3.3. TR4 enhanced cell migratory and invasive ability in seminoma cell lines
Subsequently, the role of TR4 in seminoma cell migration and invasion was assessed with Tcam‐2‐TR4 cells, Tcam‐2‐shTR4 cells and their control cells by transwell migration/invasion assays. The results from the migration assay showed that TR4 overexpression markedly promoted the capacity for cell migration (Figure 3A), while reduction of TR4 suppressed cell migratory speed (Figure 3B). To further verify the function of TR4 in tumor progression, we carried out the transwell invasion assays. In Figure 3C, a significantly higher number of migrating cells were seen in TR4‐overexpressing Tcam‐2 cells compared with the control cells. In contrast, knocking down TR4 attenuated the invasive capability of Tcam‐2 cells (Figure 3D). Together, these results were in accordance with our clinical specimen analysis, indicating that TR4 might be bound up with the metastatic potential of Tcam‐2 cells.
Figure 3.
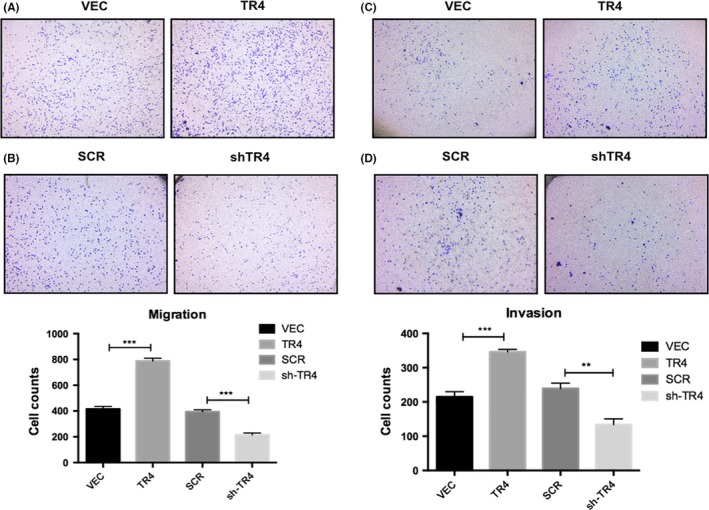
TR4 increases Tcam‐2 cells migration/invasion. (A and B) Migration assays are used to assess the effects of TR4 on cellular motility. (C and D) Invasion assays are used to investigate the effect of TR4 on the invasive abilities of Tcam‐2 cells. All experiments were performed in triplicate independently. SCR, scramble; VEC, vector
3.4. TR4 induced epithelial‐to‐mesenchymal transition in seminoma cells
The TR4‐overexpressing Tcam‐2 cells displayed a slender, irregular fibroblastoid morphology. In contrast, the related control cells showed a rounded shape which is a typical appearance of epithelial cobblestone (Figure 4A). These phenotypic changes elucidated that TR4‐overexpressing Tcam‐2 cells have undergone EMT about 3 months culture. Thus, we examined the expression of several crucial EMT‐related factors in seminoma cells, including E‐cadherin, N‐cadherin, vimentin and snail through QPCR and western blotting analysis to reveal the potential mechanisms related to increased metastasis. As indicated in Figure 4B,C, overexpressing TR4 decreased mRNA and protein levels of E‐cadherin, but raised the mRNA and protein levels of snail and mesenchymal markers, such as N‐cadherin and Vimentin. However, after silencing TR4 in Tcam‐2 cells, upregulation of E‐cadherin and reduced N‐cadherin, vimentin and snail were observed in mRNA (Figure 4D) as well as increased protein levels (Figure 4E). Immunofluorescence analysis for EMT markers E‐cadherin and N‐cadherin in Tcam‐2‐TR4, Tcam‐2‐shTR4 and their control cells confirmed the effects of TR4 on the EMT phenotype (Figure 4G,F). Together, the results from Figure 4A‐F suggested that TR4 had a positive effect on the EMT phenotype in seminoma cells, indicating that TR4 might modulate seminoma progression through induction of EMT.
Figure 4.
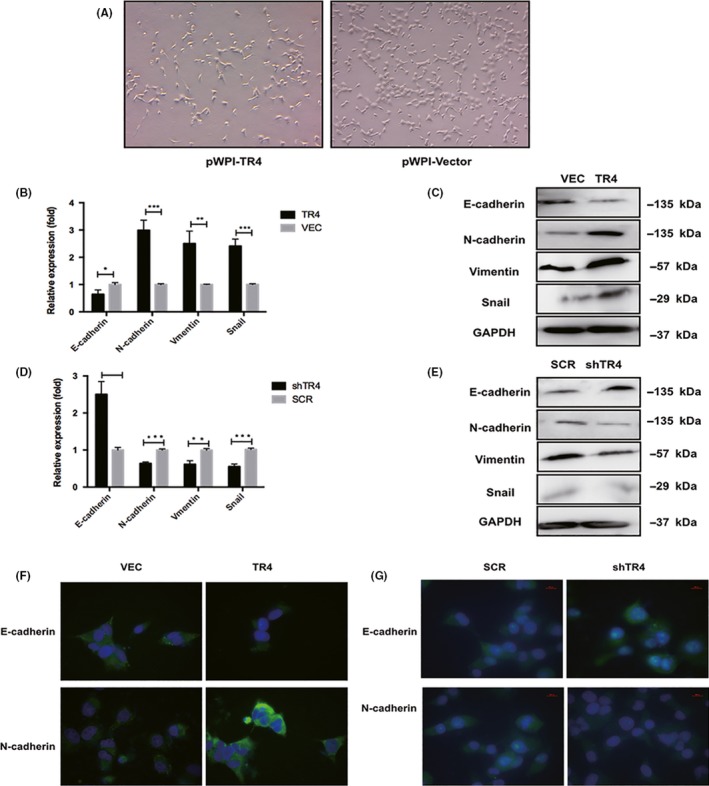
TR4 promotes the epithelial‐to‐mesenchymal (EMT) phenotype in seminoma cells. (A) Morphology of Tcam‐2‐TR4 cells and related control cells. (B) Analysis of E‐cadherin, N‐cadherin, Vimentin and snail mRNA expression in TR4‐overexpressing and related control Tcam‐2 cells by quantitative PCR. (C) Analysis of E‐cadherin, Vimentin N‐cadherin and snail expression in TR4‐overexpressing and related control Tcam‐2 cells by western blot. (D) Analysis of E‐cadherin, N‐cadherin, Vimentin and snail expression in Tcam‐2 cells treated with shTR4 by quantitative PCR. (E) Analysis of E‐cadherin, Vimentin N‐cadherin and snail expression in Tcam‐2 cells treated with shTR4 by western blot. (F,G) Analysis of E‐cadherin and N‐cadherin expression in TR4‐overexpressing, TR4‐knocking down and their control Tcam‐2 cells by immunofluorescence assays. All experiments were performed in triplicate independently. SCR, scramble; VEC, vector
3.5. Mechanism dissection how TR4 modulate seminoma proliferation and metastasis: Through altering the AKT3 expression
To investigate the molecular mechanism by which TR4 mediates Tcam‐2 cell proliferation and migration/invasion, we assessed the co‐expression relationships between metastasis‐associated genes and TR4 using the TCGA database. Interestingly, we found that AKT3, a central protein of signaling pathways involved in cell survival, metastasis, drug resistance, metabolism and radiation resistance, was positively correlated with the expression of TR4 (Figure 5A). In Tcam‐2 cells, we detected a significant increase of AKT3 in Tcam‐2‐TR4 cells compared with Tcam‐2‐vec cells at both the mRNA and protein levels, while the expression of AKT1 and AKT2 was not different (Figure 5B). Meanwhile, the results from immunofluorescence assay were consistent with the immunoblotting results, which again confirmed the modulation of AKT3 by TR4 at the protein level (Figure 5C). Interestingly, using the TCGA database, we found that the expression of AKT3 is also related to clinical tumor stage (Figure 5D), which was consistent with the result for TR4.
Figure 5.
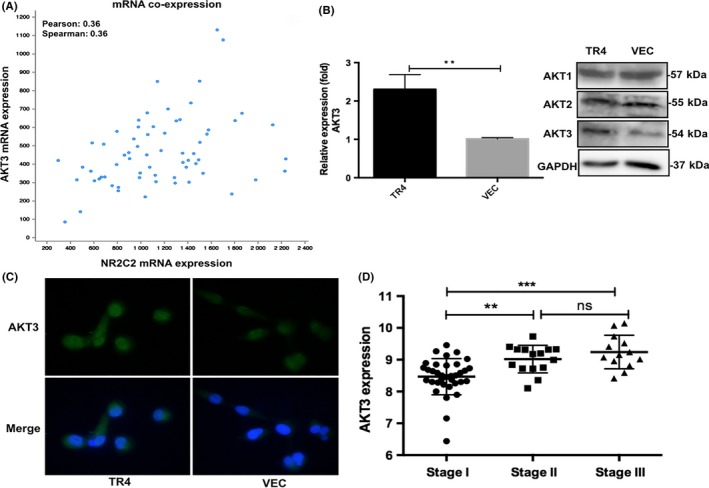
TR4 modulates seminoma proliferation and metastasis through altering the AKT3 expression. (A) analysis of mRNA co‐expression: TR4 and AKT3 by cBio Cancer Genomics Portal (N = 65). (B) The AKT3 mRNA and protein level in Tcam‐2‐TR4 and control cells are detected by quantitative RT‐PCR and western blot assays. (C) AKT3 immunofluorescence assay results. Tcam‐2‐TR4 and control cells are analyzed. (D) Analysis of AKT3 mRNA expression with different clinical tumor stage. ns, no significance
To further determine whether AKT3 is a crucial molecule in mediating TR4 function in Tcam‐2 cell proliferation and invasion, we performed neutralization/interruption experiments. AKT3 siRNA was added into the TR4 overexpression cells to see whether interfering with the AKT pathway could block the TR4‐enhanced Tcam‐2 cell proliferation and invasion. Results of qPCR and western blot confirmed the efficiency of AKT3 siRNA (Figure 6A). The subsequent MTS and transwell assays showed that the TR4‐enhanced proliferation (Figure 6B) and migration/invasion (Figure 6C,D) were attenuated with the addition of the AKT3 siRNA. Moreover, the results from western blot analysis (Figure 6E) and immunofluorescence (Figure 6F) of the EMT‐related factors demonstrated downregulation of N‐cadherin and upregulation of E‐cadherin when AKT3 siRNA were transfected into Tcam‐2‐TR4 cells, indicating that interrupting AKT3 could reverse TR4‐induced EMT. Taken together, the results from Figure 6A‐F showed significant suppression of the TR4 function by knocking down AKT3 in Tcam‐2 cells.
Figure 6.
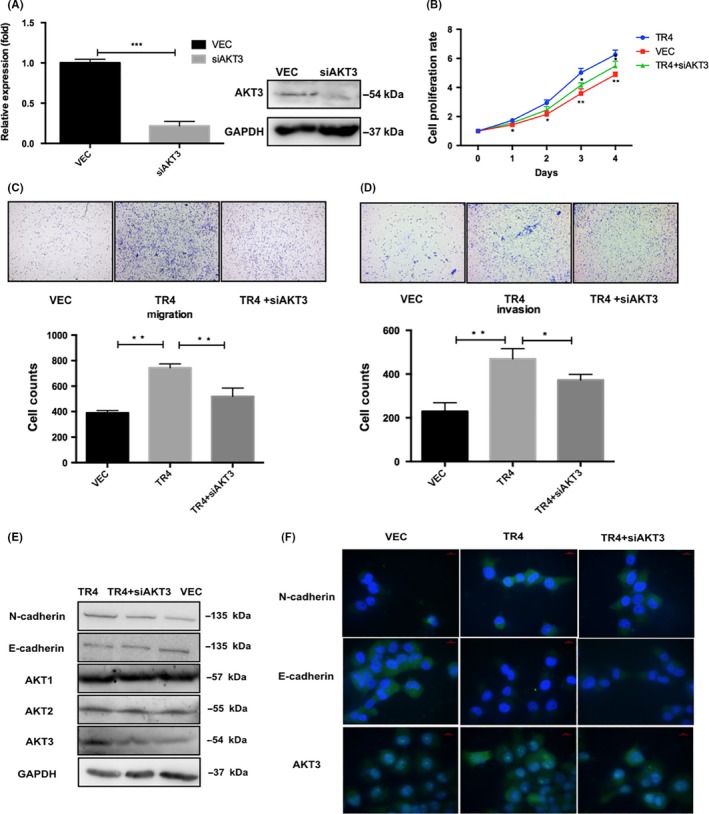
Blocking of AKT3 with siRNA reverses the TR4‐induced seminoma cell proliferation and invasion. (A) The efficiency of AKT3 siRNA is confirmed by qPCR and western blot. (B) Cell proliferation data. (C) The results of migration (left panel) and (D) invasion (right panel) assays are shown. (E) The western blot data of AKT3, N‐cadherin and E‐cadherin. (F) The immunofluorescence assay results of AKT3, N‐cadherin and E‐cadherin. Tcam‐2‐TR4 cells with either siAKT3 or vehicle control and Tcam‐2 control vector cells are treated for the above proliferation, WB, IF and migration/invasion assays. Experiments are repeated at least three times and mean ± SEM values are shown in quantification
3.6. TR4 promotes the AKT3 expression through transcriptional regulation
TR4, known as a member of the nuclear receptor superfamily, can regulate the expression of its target gene through binding to its 5′ promoter. Therefore, the JASPER database was used to search for potential TR4 response elements (TR4RE) on the promoter region of AKT3 (Figure 7A). Subsequently, ChIP assays were applied and the results demonstrated that TR4 could bind to the promoter region of AKT3 in Tcam‐2 cells (Figure 7B). To further dissect molecular mechanisms at the transcriptional level, we constructed a reporter gene with the 1‐kb 5′ promoter region of AKT3 containing TR4 response elements (TR4RE) into luciferase reporter of pGL3‐basic. The results indicated that overexpression of TR4 significantly increased the luciferase activity in Tcam‐2 cells and Cos‐7 cells (these cells rarely contain endogenous TR4 to exclude the influence of the endogenous TR4), but no difference was observed in cells co‐transfected with luciferase plasmid containing mutated TR4RE (Figure 7C,D). Together, results from Figure 7A‐D demonstrated that TR4 promoted AKT3 expression at the transcriptional level through binding to its promoter.
Figure 7.
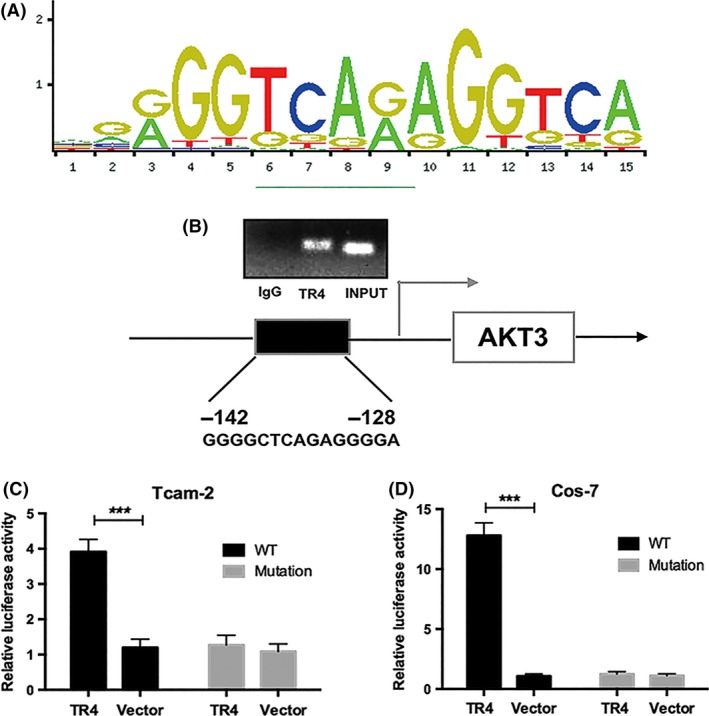
TR4 regulates the AKT3 expression through transcriptional regulation. (A) TR4RE motif sequence predicted by JASPAR. (B) ChIP assay results. (C and D) Luciferase assay in Tcam‐2 and Cos‐7 cells using pGL3‐AKT3 promoter containing TR4 binding element sequence
4. DISCUSSION
The alarming decline in male reproductive health over the past century has been associated with reduced semen quality, rising rates of developmental abnormalities and increased prevalence of testicular germ cell tumors.14 In the United States, 1 out of every 250 men will be diagnosed with testicular cancer in their lifetime15, 16 and for unknown reasons this rate has been increasing over the past decades in the United States and other western countries.17 Seminoma is the most common type of testicular germ cell tumor (TGCT); however, the detailed mechanisms of its pathogenesis and metastatic processes remain unclear. Discovery of reliable molecule biomarkers and effective therapeutic approaches to better monitor and cure metastatic seminoma is urgently needed.
In the present study, we demonstrated that patients who undergo advanced stage tend to have higher expression of TR4 with IHC. In vitro experiments revealed that overexpression of TR4 promoted the proliferation, migration and invasion by driving the EMT phenotype in seminoma cells. Mechanistically, TR4 may exert its function through upregulation of AKT3 at the transcriptional level. It is a pity that we only used Tcam‐2 cell line in our cell line studies for lacking of the other pure seminoma cell line in the world now.18, 19 In our future research, we will continue to explore the role of TR4 and AKT3 in the other testicular germ cell cancer, such as teratoma and choriocarcinoma, to obtain a comprehensive understanding of TR4 function in testicular tumors.
A large amount of published studies have examined hyperactivated AKT signaling, which involves upstream phosphatidylinositol 3‐kinase (PI3K) and PTEN (phosphatase and tensin homolog deleted on chromosome 10), and downstream tuberous sclerosis complex 2 (TSC2), forkhead boxO (FOXO) and eukaryotic translation initiation factor 4E (eIF4E) in human solid tumors and hematological malignancies.13, 20 Different AKT isoforms, encoded by three separate genes, are believed to have different functions depending on the cell types and cancer types.21, 22 In our research, we found that TR4 can specifically modulate AKT3 but not AKT1 and AKT2.
A growing number of publications have been highlighting the importance of AKT3 expression in various cancers.23, 24, 25 Several studies have documented that elevated AKT3 was involved in the regulation of proliferation and invasion in thyroid cancer, malignant melanoma cells and hepatocellular carcinoma.26, 27, 28 As an oncogene, the activation of Akt3 contributes significantly to increased invasion abilities through upregulation of MYC proto‐oncogene (C‐myc) and vascular endothelial growth factor precursor (VEGF), which are known to trigger tumorigenesis and angiogenesis, respectively. The protein expression of p27, p53, p21 and caspase‐3 could be inhibited by Akt3 overexpression, whereas the expression of B‐cell lymphoma‐2 (Bcl2), Cyclin D1 and X‐linked inhibitor of apoptosis (XIAP) were elevated, elucidating that Akt3 could inhibit the apoptosis and promote the proliferation abilities of tumor cells.29, 30 However, interestingly, the role of AKT3 in tumor progression may be controversial. Recently a study indicated that AKT3 delayed tumor progression in glioblastoma,31 showing that a gene may play different roles in different cancers due to a distinct tumor microenvironment. Here, in mechanism dissection studies, we screened several genes that were associated with seminoma progression and the results showed that AKT3 was the most significantly changed molecule after TR4 manipulation, which promoted tumor progression through induction of EMT. All in all, we found that TR4/AKT3 might play a positive role in seminoma metastasis, suggesting that a molecule may have differential effects in different tumors at the same time. In summary, we demonstrated, for the first time, the functional role of TR4/AKT3 signaling in the proliferation and EMT in seminoma cells. Therefore, TR4/AKT3 pathway may serve as a new biomarker and/or potential therapeutic target in seminoma.
CONFLICT OF INTEREST
The authors have no conflict of interest to declare.
ACKNOWLEDGMENTS
We gratefully acknowledge Professor Remko Hersmus for providing the Tcam‐2 cells used in our experiment (Department of Pathology, LEPO laboratory, Rotterdam, the Netherlands).
Chen Y, Lu J, Xia L, et al. Testicular orphan receptor 4 promotes tumor progression and implies poor survival through AKT3 regulation in seminoma. Cancer Sci. 2018;109:384–394. https://doi.org/10.1111/cas.13461
Funding information
National Natural Science Foundation of China (grant numbers: 21402173, 81672520, 81773389, 30973001); Zhejiang Provincial Natural Science Foundation of China (grant numbers: LY17H160020, LY17H050003); Zhejiang Province Medical program (2014ZDA011, 2014KYB134); National Basic Research 973 Program of China (2012CB518304).
Yuanlei Chen, Jieyang Lu and Liqun Xia are contributed equally to the present study.
REFERENCES
- 1. Wymer KM, Pearce SM, Harris KT, Pierorazio PM, Daneshmand S, Eggener SE. Adherence to National Comprehensive Cancer Network(R) guidelines for testicular cancer. J Urol. 2017;197:684‐689. [DOI] [PubMed] [Google Scholar]
- 2. Chia VM, Li Y, Quraishi SM, et al. Effect modification of endocrine disruptors and testicular germ cell tumour risk by hormone‐metabolizing genes. Int J Androl. 2010;33:588‐596. [DOI] [PMC free article] [PubMed] [Google Scholar]
- 3. Kamel MH, Elfaramawi M, Jadhav S, Saafan A, Raheem OA, Davis R. Insurance status and differences in treatment and survival of testicular cancer patients. Urol. 2016;87:140‐145. [DOI] [PubMed] [Google Scholar]
- 4. Ruf CG, Linbecker M, Port M, et al. Predicting metastasized seminoma using gene expression. BJU Int. 2012;110:E14‐E20. [DOI] [PubMed] [Google Scholar]
- 5. Wudhikarn K, Colling CW, Robinson RA, Vaena DA. Solitary bony metastasis in seminoma. J Clin Oncol. 2013;31:259‐261. [DOI] [PubMed] [Google Scholar]
- 6. Crockford GP, Linger R, Hockley S, et al. Genome‐wide linkage screen for testicular germ cell tumour susceptibility loci. Hum Mol Genet. 2006;15:443‐451. [DOI] [PubMed] [Google Scholar]
- 7. Jones DA, Ester EC, Leavitt D, et al. Adjuvant radiotherapy for synchronous bilateral testicular seminoma: a case report and a review of the pertinent literature. Case Rep Urol. 2013;2013:241073. [DOI] [PMC free article] [PubMed] [Google Scholar]
- 8. Ruf CG, Port M, Schmelz HU, et al. Clinically apparent and occult metastasized seminoma: almost indistinguishable on the transcriptional level. PLoS ONE. 2014;9:e95009. [DOI] [PMC free article] [PubMed] [Google Scholar]
- 9. Chang C, Silva SLD, Ideta R, Lee Y, Yeh S, Burbach JPH. Human and rat TR4 orphan receptors specify a subclass of the steroid receptor superfamily. Proc Nat Acad Sci USA. 1994;91:6040‐6044. [DOI] [PMC free article] [PubMed] [Google Scholar]
- 10. Xie S, Lee Y‐F, Kim E, et al. TR4 nuclear receptor functions as a fatty acid sensor to modulate CD36 expression and foam cell formation. PNAS. 2009;106:13353‐13358. [DOI] [PMC free article] [PubMed] [Google Scholar]
- 11. Zhang L, Zhang J, Ma Y, et al. Testicular orphan receptor 4 (TR4) is a marker for metastasis and poor prognosis in non‐small cell lung cancer that drives the EMT phenotype. Lung Cancer. 2015;89:320‐328. [DOI] [PubMed] [Google Scholar]
- 12. Ding X, Yang DR, Lee SO, et al. TR4 nuclear receptor promotes prostate cancer metastasis via upregulation of CCL2/CCR2 signaling. Int J Cancer. 2015;136:955‐964. [DOI] [PubMed] [Google Scholar]
- 13. Cheung M, Testa JR. Diverse mechanisms of AKT pathway activation in human malignancy. Curr Cancer Drug Targets. 2013;13:234‐244. [DOI] [PMC free article] [PubMed] [Google Scholar]
- 14. Rajpert‐De ME. Developmental model for the pathogenesis of testicular carcinoma in situ: genetic and environmental aspects. Hum Reprod Update. 2006;12:303‐323. [DOI] [PubMed] [Google Scholar]
- 15. Siegel R, Ma J, Zou Z, Jemal A. Cancer statistics, 2014. CA Cancer J Clin. 2014;64:9‐29. [DOI] [PubMed] [Google Scholar]
- 16. DeSantis CE, Lin CC, Mariotto AB, et al. Cancer treatment and survivorship statistics, 2014. CA Cancer J Clin. 2014;64:252‐271. [DOI] [PubMed] [Google Scholar]
- 17. Albers P, Albrecht W, Algaba F, et al. EAU guidelines on testicular cancer: 2011 update. Eur Urol. 2011;60:304‐319. [DOI] [PubMed] [Google Scholar]
- 18. Russell SM, Lechner MG, Mokashi A, et al. Establishment and characterization of a new human extragonadal germ cell line, SEM‐1, and its comparison with TCam‐2 and JKT‐1. Urol. 2013;81:464. e1‐9. [DOI] [PMC free article] [PubMed] [Google Scholar]
- 19. Eckert D, Nettersheim D, Heukamp LC, Kitazawa S, Biermann K, Schorle H. TCam‐2 but not JKT‐1 cells resemble seminoma in cell culture. Cell Tissue Res. 2008;331:529‐538. [DOI] [PubMed] [Google Scholar]
- 20. Bellacosa A, Kumar CC, Di Cristofano A, Testa JR. Activation of AKT kinases in cancer‐ implications for therapeutic targeting. Adv Cancer Res. 2005;94:29‐86. [DOI] [PubMed] [Google Scholar]
- 21. Virtakoivu R, Pellinena T, Rantalaa JK, Peräläa M, Ivaska J. Distinct roles of AKT isoforms in regulating β1‐integrin activity migration and invasion in prostate cancer. Mol Biol Cell. 2012;23:3357‐3369. [DOI] [PMC free article] [PubMed] [Google Scholar]
- 22. Haggblad Sahlberg S, Mortensen AC, Haglof J, et al. Different functions of AKT1 and AKT2 in molecular pathways, cell migration and metabolism in colon cancer cells. Int J Oncol. 2017;50:5‐14. [DOI] [PMC free article] [PubMed] [Google Scholar]
- 23. Ichimura K, Vogazianou AP, Liu L, et al. 1p36 is a preferential target of chromosome 1 deletions in astrocytic tumours and homozygously deleted in a subset of glioblastomas. Oncogene. 2008;27:2097‐2108. [DOI] [PMC free article] [PubMed] [Google Scholar]
- 24. Cancer Genome Atlas Research Network . Comprehensive genomic characterization defines human glioblastoma genes and core pathways. Nature. 2008;455:1061‐1068. [DOI] [PMC free article] [PubMed] [Google Scholar]
- 25. Zhang F, Wu Z. Significantly altered expression of miR‐511‐3p and its target AKT3 has negative prognostic value in human prostate cancer. Biochimie. 2017;140:66‐72. [DOI] [PubMed] [Google Scholar]
- 26. Ma Y, She XG, Ming YZ, Wan QQ, Ye QF. MicroRNA144 suppresses tumorigenesis of hepatocellular carcinoma by targeting AKT3. Mol Med Rep. 2015;11:1378‐1383. [DOI] [PubMed] [Google Scholar]
- 27. Sui G‐Q, Fei D, Guo F, et al. MicroRNA‐338‐3p inhibits thyroid cancer progression through targeting AKT3. Am J Cancer Res. 2017;7:1177‐1187. [PMC free article] [PubMed] [Google Scholar]
- 28. Morishita A, Gong J, Nomura T, et al. The use of protein array to identify targetable receptor tyrosine kinases for treatment of human colon cancer. Int J Oncol. 2010;37:829‐835. [DOI] [PubMed] [Google Scholar]
- 29. Li Y, Cai B, Shen L, et al. MiRNA‐29b suppresses tumor growth through simultaneously inhibiting angiogenesis and tumorigenesis by targeting Akt3. Cancer Lett. 2017;397:111‐119. [DOI] [PubMed] [Google Scholar]
- 30. Wang L, Huang D, Jiang Z, et al. Akt3 is responsible for the survival and proliferation of embryonic stem cells. Biol Open. 2017;6:850‐861. [DOI] [PMC free article] [PubMed] [Google Scholar]
- 31. Joy A, Kapoor M, Georges J, et al. The role of AKT isoforms in glioblastoma: AKT3 delays tumor progression. J Neurooncol. 2016;130:43‐52. [DOI] [PMC free article] [PubMed] [Google Scholar]