

Abstract
The possible role of dietary fiber in the etiology of head and neck cancers (HNCs) is unclear. We used individual-level pooled data from 10 case-control studies (5959 cases and 12,248 controls) participating in the International Head and Neck Cancer Epidemiology (INHANCE) consortium, to examine the association between fiber intake and cancer of the oral cavity/pharynx and larynx. Odds Ratios (ORs) and their 95% Confidence Intervals (CIs) were estimated using unconditional multiple logistic regression applied to quintile categories of non-alcohol energy-adjusted fiber intake and adjusted for tobacco and alcohol use and other known or putative confounders.
Fiber intake was inversely associated with oral and pharyngeal cancer combined (OR for 5th vs. 1st quintile category = 0.49, 95% CI: 0.40-0.59; p for trend <0.001) and with laryngeal cancer (OR = 0.66, 95% CI: 0.54-0.82, p for trend <0.001). There was, however, appreciable heterogeneity of the estimated effect across studies for oral and pharyngeal cancer combined. Nonetheless, inverse associations were consistently observed for the subsites of oral and pharyngeal cancers and within most strata of the considered covariates, for both cancer sites.
Our findings from a multicenter large-scale pooled analysis suggest that, although in the presence of between-study heterogeneity, a greater intake of fiber may lower HNC risk.
Keywords: dietary fiber intake, INHANCE, head and neck cancer, laryngeal cancer, oral cavity and pharyngeal cancer
Introduction
There are more than 500,000 new cases of head and neck cancers (HNCs) diagnosed worldwide every year1. Approximately 60% of patients are diagnosed with advanced disease, for which prognosis is poor even with a multimodal treatment approach2, 3. This situation emphasizes the importance of primary prevention of HNCs.
Although the combination of tobacco smoking and alcohol drinking accounts for approximately 80% of HNC risk4, 5, a role of dietary factors in HNCs has been reported6–8. Higher intakes of non-starchy vegetables, foods containing carotenoids, and fruit in general are thought to probably protect against HNC8.
Fruit and vegetables are rich sources of compounds that have anti-carcinogenic properties, including vitamins, minerals, fiber, and phytochemicals9–12. Among them, dietary fiber could protect against cancer13–17. However, the association of dietary fiber with HNC has been sparingly assessed and, to date, the evidence is still limited18–28, although most18–23, 25–28, but not all studies24 indicated an inverse association with HNC risk.
The International Head and Neck Cancer Epidemiology (INHANCE) consortium was established in 2004 to elucidate the aetiology of HNCs through pooled analyses of individual-level data on HNCs on a large scale29, 30. To date, it includes 35 case-control studies, for a total of 25,478 cases and 37,111 controls31. Selected aspects of diet have been investigated within the consortium. Among relevant foods and food groups, an inverse association with HNC risk was found for higher intakes of fruit and vegetables, while no association was observed for some cereal and grain products32. In addition, higher intakes of selected micronutrients and food components from natural sources, like vitamin E, vitamin C, folate and carotenoids, have been previously found to reduce HNCs risk33–36.
The main objective of the current paper is to assess the association between fiber intake and the risk of 2 HNC outcomes - oral and pharyngeal cancer combined and laryngeal cancer – adjusting for several confounders, including tobacco and alcohol use. Moreover, we evaluate whether the effect estimates differ by tumor subsite or in strata of selected factors, and explore the potential interaction of fiber intake with smoking and alcohol on the 2 HNC outcomes of interest.
Materials and methods
Design and subjects
Within version 1.5 of the INHANCE consortium pooled data set, 10 case-control studies collected information on total dietary fiber at the individual level6, 37–46. Details on the individual studies, harmonization of data and data pooling methods have been previously described for the consortium30 and are summarized in Supplemental Table 1 (Online Resource). Informed consent was obtained from study subjects. The investigations were approved by the relevant institutional review boards, according to the rules adopted in each country at the time of data collection.
Selection of subjects
Cases were included if their cancer had been originally classified as an invasive cancer of oral cavity, oropharynx, hypopharynx, oral cavity or pharynx not otherwise specified, larynx, or HNC unspecified. Cases with cancers of the salivary glands or of the nasal cavity/ear/paranasal sinuses were excluded. The International Classification of Diseases coding used for the classification into subsites was previously specified29.
We removed from our analysis: 1. cases with missing information on the site of origin of their cancer; 2. subjects with missing information on dietary fiber intake; and 3. subjects with implausible (<500 or >5500 kcal) or missing values on daily non-alcohol energy intake. Thus, the present analysis was based on a total of 18,207 subjects, with 5959 HNC cases and 12,248 controls. There was a total of 1385 oral cavity cancer cases, 1653 oropharyngeal and 571 hypopharyngeal cancer cases (2224 pharyngeal cancer cases), 805 unspecified oral cavity/pharynx cases (giving a total of 4414 oral and pharyngeal cancer cases combined), and 1545 laryngeal cancer cases.
Definition of the exposure variable
Intakes of total energy, several nutrients and food components, including fiber, were derived by combining information from study-specific food-frequency questionnaires (FFQs) - assessing subject’s usual diet during a reference period preceding cancer diagnosis for cases or interview for controls – with that from country-specific food composition databases47–50. In detail, the current analysis considered total dietary fiber, which is fiber from foods only, and expressed its intake in grams/day. Comparability of total dietary fiber intakes was also improved by selecting intakes of fiber obtained with the enzymatic gravimetric methods [AOAC (Association of Official Analytical Chemist) 1980 or equivalents), rather than with the Englyst or Southgate ones51, when more estimates of total fiber intakes were simultaneously available in the single studies.
Finally, to adjust for the (study-specific) effect of daily energy intake excluding alcohol, we computed ’non-alcohol energy-adjusted’ fiber intake within each study, on both cases and controls, based on the residual method52.
Statistical analysis
We estimated the odds ratios (ORs) and the corresponding 95% confidence intervals (CIs) of oral and pharyngeal cancer combined (including oral cavity, oropharyngeal, hypopharyngeal, unspecified oral cavity/pharyngeal cancer) and laryngeal cancer for quintile categories of ‘non-alcohol energy-adjusted’ fiber intake (calculated on both cases and controls from all studies combined) using unconditional multiple logistic regression models53. Models included adjustment for age, sex, race, study center, education, cigarette smoking status, cigarette smoking intensity (number of cigarettes per day), cigarette smoking duration, cigar smoking status, pipe smoking status, alcohol drinking intensity (number of drinks per day), and the product (interaction) term for cigarette intensity and alcohol drinking (see Table 1 for a complete list of the covariate categories used). Tests for linear trend were computed referring to the median values of ‘non-alcohol energy-adjusted’ fiber intake within the selected quintile categories.
Table 1.
Distribution of cases of oral and pharyngeal cancer combined, laryngeal cancer and controls according to selected variables. International Head and Neck Cancer Epidemiology (INHANCE) consortium.
| Oral and pharyngeal cases | (%) | Laryngeal cases | (%) | Controls | (%) | |
|---|---|---|---|---|---|---|
| Age (years) | ||||||
| <40 | 208 | 4.7 | 26 | 1.7 | 681 | 5.6 |
| >=40to<=44 | 194 | 4.4 | 45 | 2.9 | 563 | 4.6 |
| >=45to<=49 | 446 | 10.1 | 123 | 8.0 | 949 | 7.7 |
| >=50to<=54 | 645 | 14.6 | 188 | 12.2 | 1731 | 14.1 |
| >=55to<=59 | 816 | 18.5 | 271 | 17.5 | 2079 | 17.0 |
| >=60to<=64 | 713 | 16.2 | 290 | 18.8 | 2029 | 16.6 |
| >=65to<=69 | 658 | 14.9 | 279 | 18.1 | 1931 | 15.8 |
| >=70to<=74 | 474 | 10.7 | 227 | 14.7 | 1540 | 12.6 |
| >=75 | 260 | 5.9 | 96 | 6.2 | 743 | 6.1 |
| Missing | 0 | 0.0 | 0 | 0.0 | 2 | 0.0 |
| Sex | ||||||
| Female | 1187 | 26.9 | 244 | 15.8 | 3541 | 28.9 |
| Male | 3223 | 73.0 | 1300 | 84.1 | 8702 | 71.0 |
| Missing | 4 | 0.1 | 1 | 0.1 | 5 | 0.0 |
| Race | ||||||
| Black | 387 | 8.8 | 116 | 7.5 | 535 | 4.4 |
| Others (with Asians) | 463 | 10.5 | 101 | 6.5 | 3089 | 25.2 |
| White (with Hispanics) | 3555 | 80.5 | 1324 | 85.7 | 8596 | 70.2 |
| Missing | 9 | 0.2 | 4 | 0.3 | 28 | 0.2 |
| Study center | ||||||
| Boston | 313 | 7.1 | 71 | 4.6 | 611 | 5.0 |
| Buffalo | 396 | 9.0 | 168 | 10.9 | 1190 | 9.7 |
| Italy Multicenter | ||||||
| Milan | 169 | 3.8 | 24 | 1.6 | 621 | 5.1 |
| Pordenone | 471 | 10.7 | 409 | 26.5 | 1528 | 12.5 |
| Latina | 95 | 2.2 | 0 | 0.0 | 425 | 3.5 |
| Japan (2001–2005) | 407 | 9.2 | 86 | 5.6 | 3002 | 24.5 |
| Los Angeles | 246 | 5.6 | 60 | 3.9 | 828 | 6.8 |
| Milan (2006–2009) | 131 | 3.0 | 200 | 12.9 | 691 | 5.6 |
| MSKCC | 74 | 1.7 | 32 | 2.1 | 123 | 1.0 |
| North Carolina (2002–2006) | 687 | 15.6 | 374 | 24.2 | 1120 | 9.1 |
| Switzerland | 367 | 8.3 | 121 | 7.8 | 877 | 7.2 |
| US Multicenter | ||||||
| Atlanta | 129 | 2.9 | 0 | 0.0 | 134 | 1.1 |
| New Jersey | 467 | 10.6 | 0 | 0.0 | 459 | 3.7 |
| Los Angeles | 398 | 9.0 | 0 | 0.0 | 501 | 4.1 |
| San Francisco | 64 | 1.4 | 0 | 0.0 | 138 | 1.1 |
| Education | ||||||
| <= Junior high school | 863 | 19.6 | 603 | 39.0 | 2723 | 22.2 |
| Some high school | 885 | 20.0 | 258 | 16.7 | 1240 | 10.1 |
| High school graduate | 588 | 13.3 | 237 | 15.3 | 1267 | 10.3 |
| Technical school, some college | 1174 | 26.6 | 214 | 13.9 | 2305 | 18.8 |
| >= college graduate | 491 | 11.1 | 145 | 9.4 | 1703 | 13.9 |
| Missing | 413 | 9.4 | 88 | 5.7 | 3010 | 24.6 |
| Cigarette smoking status | ||||||
| Never | 806 | 18.3 | 91 | 5.8 | 4868 | 39.7 |
| Former | 1387 | 31.4 | 707 | 45.8 | 4330 | 35.4 |
| Current | 2210 | 50.1 | 735 | 47.6 | 2986 | 24.4 |
| Missing | 11 | 0.2 | 12 | 0.8 | 64 | 0.5 |
| Cigarette smoking intensity (number of cigarettes/day) | ||||||
| Never smoker | 806 | 18.3 | 91 | 5.9 | 4868 | 39.7 |
| >0to<=10 | 471 | 10.7 | 149 | 9.6 | 1949 | 15.9 |
| >10to<=20 | 1466 | 33.2 | 628 | 40.6 | 3169 | 25.9 |
| >20 | 1633 | 37.0 | 661 | 42.8 | 2137 | 17.4 |
| Missing | 38 | 0.9 | 16 | 1.0 | 125 | 1.0 |
| Cigarette smoking duration (years) | ||||||
| Never smoker | 806 | 18.3 | 91 | 5.9 | 4868 | 39.7 |
| >0to<=20 | 443 | 10.0 | 102 | 6.6 | 2166 | 17.7 |
| >20 | 3132 | 71.0 | 1343 | 86.9 | 5123 | 41.8 |
| Missing | 33 | 0.7 | 9 | 0.6 | 91 | 0.7 |
| Cigar smoking status | ||||||
| Never cigar user | 3583 | 81.2 | 1323 | 85.6 | 8545 | 69.8 |
| Ever smoked >=100 cigars in a lifetime | 394 | 8.9 | 118 | 7.6 | 636 | 5.2 |
| Missing | 437 | 9.9 | 104 | 6.7 | 3067 | 25.0 |
| Pipe smoking status | ||||||
| Never pipe user | 3579 | 81.1 | 1325 | 85.8 | 8327 | 68.0 |
| Ever smoked>=100 pipes in a lifetime | 399 | 9.0 | 115 | 7.4 | 864 | 7.1 |
| Missing | 436 | 9.9 | 105 | 6.8 | 3057 | 25.0 |
| Alcohol drinking intensity (number of drinks/day) | ||||||
| Never drinker | 548 | 12.4 | 187 | 12.1 | 3156 | 25.8 |
| <1 | 1030 | 23.3 | 250 | 16.2 | 4022 | 32.8 |
| >=1to3 | 973 | 22.0 | 344 | 22.3 | 2934 | 24.0 |
| >=3to5 | 647 | 14.7 | 250 | 16.2 | 1215 | 9.9 |
| >=5 | 1216 | 27.5 | 514 | 33.3 | 921 | 7.5 |
ABBREVIATIONS: MSKCC: Memorial Sloan Kettering Cancer Center.
For oral and pharyngeal cancer combined, separate analyses were conducted by anatomical subsite (oral cavity, oro-/hypo-pharynx, and oral cavity or pharynx not otherwise specified). For both cancer sites, we carried out stratified analyses by age, sex, education, geographic region, body mass index (BMI), tobacco (cigarettes, cigars, pipes, snuff or chewing products) smoking status, alcohol consumption (see Tables 3 and 4 for categories used), and heterogeneity between/among strata (possible effect modification) was tested using likelihood ratio tests53.
Table 3.
Odds ratios (ORs)a,b of oral and pharyngeal cancer combined and corresponding 95% confidence intervals (CIs) on fiber intake quintile categories, in strata of selected covariates. International Head and Neck Cancer Epidemiology (INHANCE) consortium.
| OR (95% CI) | |||||
|---|---|---|---|---|---|
|
| |||||
| II Quintile | III Quintile | IV Quintile | V Quintile | pstudiesc | |
| Age (years) | |||||
| <55 | 0.66 (0.50–0.87) | 0.57 (0.45–0.72) | 0.57 (0.44–0.76) | 0.60 (0.48–0.77) | <0.001 |
| ≥ 55 | 0.72 (0.61–0.85) | 0.70 (0.59–0.82) | 0.54 (0.45–0.66) | 0.46 (0.35–0.59) | 0.007 |
| pstratad | 0.073 | ||||
| Sex | |||||
| Female | 0.88 (0.68–1.14) | 0.80 (0.60–1.06) | 0.67 (0.52–0.87) | 0.57 (0.43–0.75) | 0.617 |
| Male | 0.67 (0.56–0.80) | 0.63 (0.54–0.73) | 0.53 (0.43–0.66) | 0.48 (0.39–0.59) | <0.001 |
| pstratad | 0.635 | ||||
| Education | |||||
| ≤high school graduate | 0.64 (0.54–0.76) | 0.66 (0.54–0.79) | 0.55 (0.45–0.68) | 0.49 (0.39–0.61) | 0.009 |
| ≥some college | 0.80 (0.65–0.97) | 0.66 (0.54–0.81) | 0.59 (0.47–0.73) | 0.54 (0.43–0.69) | 0.174 |
| pstratad | 0.640 | ||||
| Geographic regione | |||||
| Europe | 0.56 (0.44–0.71) | 0.59 (0.47–0.74) | 0.48 (0.38–0.61) | 0.45 (0.34–0.61) | 0.017 |
| America | 0.79 (0.67–0.93) | 0.69 (0.57–0.83) | 0.60 (0.47–0.77) | 0.50 (0.39–0.66) | <0.001 |
| Asia | 0.94 (0.69–1.27) | 0.62 (0.44–0.86) | 0.42 (0.29–0.61) | 0.38 (0.26–0.56) | NE |
| pstratad | 0.178 | ||||
| Body mass index | |||||
| <25 kg/m2 | 0.75 (0.62–0.92) | 0.63 (0.52–0.76) | 0.55 (0.45–0.67) | 0.45 (0.35–0.57) | 0.264 |
| ≥25 kg/m2 | 0.69 (0.54–0.88) | 0.69 (0.57–0.83) | 0.58 (0.46–0.73) | 0.58 (0.46–0.71) | <0.001 |
| pstratad | 0.117 | ||||
| Tobacco smoking status | |||||
| Never user | 0.75 (0.55–1.03) | 0.87 (0.65–1.16) | 0.67 (0.48–0.93) | 0.63 (0.44–0.89) | 0.095 |
| Former user | 0.90 (0.69–1.17) | 0.65 (0.48–0.88) | 0.69 (0.49–0.98) | 0.65 (0.49–0.86) | 0.012 |
| Current user | 0.66 (0.54–0.82) | 0.57 (0.46–0.70) | 0.53 (0.42–0.65) | 0.51 (0.40–0.66) | 0.169 |
| pstratad | 0.188 | ||||
| Alcohol drinking intensityf | |||||
| Never/light drinker | 0.86 (0.71–1.05) | 0.83 (0.68–1.01) | 0.71 (0.56–0.88) | 0.59 (0.44–0.78) | 0.003 |
| Moderate drinker | 0.67 (0.52–0.87) | 0.56 (0.44–0.72) | 0.49 (0.39–0.62) | 0.42 (0.34–0.54) | 0.007 |
| Heavy drinker | 0.49 (0.33–0.72) | 0.46 (0.33–0.66) | 0.45 (0.32–0.63) | 0.43 (0.31–0.60) | 0.009 |
| pstratad | 0.085 | ||||
ABBREVIATIONS: NE: Not estimable.
Estimated from multiple logistic regression models adjusted for age, sex, race, study center, education, cigarette smoking status, cigarette smoking intensity (number of cigarettes per day), cigarette smoking duration, cigar smoking status, pipe smoking status, alcohol drinking intensity (number of drinks per day), and the product (interaction) term for cigarette intensity and alcohol drinking, when appropriate.
The I Quintile category was considered as the reference one.
P for heterogeneity between studies. When the p-value was less than 0.1 within strata, we reported mixed-effects estimates derived from the corresponding generalized linear mixed model.
P for heterogeneity across strata. When fixed- and mixed-effects models were estimated for different categories of the same stratification variable, likelihood ratio tests for heterogeneity across strata had to be based on comparable mixed-effects models and therefore we re-fitted one or more mixed-effects models to replace the original fixed-effects ones. We consistently reported the corresponding stratum-specific mixed-effects models instead of the fixed-effects ones.
Europe included Italy Multicenter, Switzerland and Milan (2006–2009) studies. North America included Boston, Buffalo, Los Angeles, Memorial Sloan Kettering Cancer Center, North Carolina (2002–2006), and US Multicenter studies. Asia included Japan study only. As Asia included Japan study only, there was no possibility to assess heterogeneity between studies in the Asia stratum.
The never/light drinker category included never drinkers and subjects who drink less than 1 drink per day; the moderate drinker category included subjects drinking between 1 (included) and 5 drinks per day; the heavy drinker category included subjects drinking 5 drinks per day or more.
Table 4.
Odds ratios (ORs)a,b of laryngeal cancer and corresponding 95% confidence intervals (CIs) on fiber intake quintile categories, in strata of selected covariates. International Head and Neck Cancer Epidemiology (INHANCE) consortium.
| OR (95% CI) | |||||
|---|---|---|---|---|---|
|
| |||||
| II Quintile | III Quintile | IV Quintile | V Quintile | pstudiesc | |
| Age (years) | |||||
| <55 | 0.98 (0.64–1.50) | 0.76 (0.46–1.23) | 0.65 (0.40–1.04) | 0.66 (0.44–1.01) | 0.131 |
| ≥ 55 | 0.70 (0.52–0.93) | 0.67 (0.53–0.86) | 0.69 (0.50–0.93) | 0.60 (0.48–0.76) | 0.075 |
| pstratad | 0.534 | ||||
| Sex | |||||
| Female | 0.79 (0.46–1.33) | 0.81 (0.50–1.31) | 0.63 (0.38–1.04) | 0.68 (0.41–1.13) | 0.243 |
| Male | 0.81 (0.59–1.11) | 0.66 (0.51–0.87) | 0.68 (0.48–0.96) | 0.64 (0.48–0.86) | 0.002 |
| pstratad | 0.721 | ||||
| Education | |||||
| ≤high school graduate | 0.63 (0.48–0.82) | 0.67 (0.53–0.85) | 0.61 (0.45–0.85) | 0.65 (0.48–0.88) | 0.050 |
| ≥some college | 1.18 (0.79–1.77) | 0.58 (0.32–1.04) | 0.90 (0.60–1.34) | 0.59 (0.39–0.89) | 0.056 |
| pstratad | 0.050 | ||||
| Geographic regione | |||||
| Europe | 0.55 (0.41–0.74) | 0.54 (0.39–0.73) | 0.52 (0.33–0.80) | 0.45 (0.34–0.60) | 0.002 |
| America | 1.19 (0.76–1.87) | 0.92 (0.63–1.36) | 1.08 (0.80–1.48) | 1.00 (0.74–1.37) | 0.238 |
| Asia | 1.33 (0.68–2.61) | 1.50 (0.78–2.91) | 0.33 (0.12–0.85) | 0.85 (0.40–1.83) | NE |
| pstratad | 0.015 | ||||
| Body mass index | |||||
| <25 kg/m2 | 0.81 (0.59–1.12) | 0.61 (0.44–0.84) | 0.70 (0.45–1.07) | 0.56 (0.37–0.85) | 0.335 |
| ≥25 kg/m2 | 0.78 (0.52–1.17) | 0.70 (0.49–1.00) | 0.67 (0.47–0.96) | 0.66 (0.50–0.86) | 0.004 |
| pstratad | 0.560 | ||||
| Tobacco smoking status | |||||
| Never user | 0.57 (0.24–1.38) | 0.65 (0.27–1.56) | 0.73 (0.33–1.63) | 0.87 (0.39–1.94) | 0.399 |
| Former user | 0.83 (0.58–1.19) | 0.73 (0.51–1.05) | 0.64 (0.40–1.03) | 0.81 (0.58–1.14) | 0.375 |
| Current user | 0.81 (0.54–1.20) | 0.68 (0.47–0.99) | 0.57 (0.41–0.78) | 0.60 (0.42–0.85) | <0.001 |
| pstratad | 0.669 | ||||
| Alcohol drinking intensityf | |||||
| Never/light drinker | 0.99 (0.64–1.53) | 0.69 (0.39–1.23) | 0.99 (0.70–1.40) | 0.87 (0.60–1.25) | 0.030 |
| Moderate drin | 0.73 (0.53–1.00) | 0.74 (0.54–1.02) | 0.66 (0.43–1.01) | 0.53 (0.38–0.74) | 0.130 |
| Heavy drinker | 0.73 (0.37–1.41) | 0.53 (0.35–0.81) | 0.43 (0.28–0.66) | 0.49 (0.33–0.73) | 0.236 |
| pstratad | 0.383 | ||||
ABBREVIATIONS: NE: Not estimable.
Estimated from multiple logistic regression models adjusted for age, sex, race, study center, education, cigarette smoking status, cigarette smoking intensity (number of cigarettes per day), cigarette smoking duration, cigar smoking status, pipe smoking status, alcohol drinking intensity (number of drinks per day), and the product (interaction) term for cigarette intensity and alcohol drinking, when appropriate.
The I Quintile category was considered as the reference one.
P for heterogeneity between studies. When the p-value was less than 0.1 within strata, we reported mixed-effects estimates derived from the corresponding generalized linear mixed model.
P for heterogeneity across strata. When fixed- and mixed-effects models were estimated for different categories of the same stratification variable, likelihood ratio tests for heterogeneity across strata had to be based on comparable mixed-effects models and therefore we re-fitted one or more mixed-effects models to replace the original fixed-effects ones. We consistently reported the corresponding stratum-specific mixed-effects models instead of the fixed-effects ones.
Europe included Italy Multicenter, Switzerland and Milan (2006–2009) studies. North America included Boston, Buffalo, Los Angeles, Memorial Sloan Kettering Cancer Center, North Carolina (2002–2006), and US Multicenter studies. Asia included Japan study only. As Asia included Japan study only, there was no possibility to assess heterogeneity between studies in the Asia stratum.
The never/light drinker category included never drinkers and subjects who drink less than 1 drink per day; the moderate drinker category included subjects drinking between 1 (included) and 5 drinks per day; the heavy drinker category included subjects drinking 5 drinks per day or more.
In addition, we investigated potential confounding by other dietary factors, including some nutrients [total carotenoids, vitamin C, vitamin E, and iron (for the last nutrient, information was not available in the Buffalo study)], total fruits, and total vegetables.
We also carried out a sensitivity analysis, excluding each study one at a time to ensure that the magnitude of the overall estimates were not dependent on any specific study54. In all the analyses described, when the p-value for heterogeneity between studies was less than 0.1, we estimated the corresponding ORs and CIs specifying a random intercept-random slope generalized linear mixed model with a logit link function and binomial family55. We also adopted a complete-case approach to the analysis, where subjects with no missing information on the final database (including information on cancer sites, exposure and confounding variables) were considered for the analysis. However, as the Japan study did not provide information on education (3495 subjects), we defined an extra category of education with all missing values, to avoid the exclusion of the study from the analysis.
All statistical tests were two-sided. Calculations were carried out using the open-source statistical computing environment R56, with its libraries “lme4”57 and “nnet”58.
Results
Table 1 shows selected characteristics of HNC cases (separately for oral and pharyngeal cancer combined and for laryngeal cancer) and controls under investigation. Over 70% of the included subjects were white. The US Multicenter study provided cases of oral and pharyngeal cancer only. Cases were less educated, more often smokers and alcohol drinkers than controls.
Supplemental Table 2 describes the distribution of raw values of fiber intake across studies and in all the studies combined. Study-specific distributions were skewed to the right. The reported summary statistics showed different values across studies, with the Buffalo, Italy Multicenter, and Milan studies showing the highest values and the Los Angeles study the lowest values of fiber intake.
Table 2 provides the ORs, and the corresponding 95% CIs, for oral and pharyngeal cancer combined and for laryngeal cancer by quintile categories of fiber intake. For oral and pharyngeal cancer combined, we reported mixed-effects estimates with appreciable heterogeneity of the effect estimates across studies (p-value for heterogeneity <0.001); for laryngeal cancer, however, there was less heterogeneity across studies (p-value = 0.633), so fixed effects are reported. Fiber intake was inversely associated with oral and pharyngeal cancer risk: the OR for the highest quintile category of fiber intake compared to the lowest one was 0.49 (95% CI: 0.40–0.59) (p-value for linear trend <0.001). For laryngeal cancer, the OR for the highest vs lowest quintile category was 0.66 (95% CI: 0.54–0.82; p-value for linear trend <0.001). In the influence analyses, the point estimates of the ORs of oral and pharyngeal cancer combined did not materially change after the exclusion of any study; the detected heterogeneity between studies was similar to that of the main analysis when excluding any study at a time from the analysis. However, after excluding the Italy Multicenter study from the main analysis, the OR of laryngeal cancer was closer to unity (OR=0.96, 95% CI: 0.74–1.24 for the last quintile category) and the corresponding heterogeneity between studies was reduced.
Table 2.
Odds ratios (ORs)a of oral and pharyngeal cancer combined, and laryngeal cancer and corresponding 95% confidence intervals (CIs) on fiber intake quintile categories. International Head and Neck Cancer Epidemiology (INHANCE) consortium.
| Oral and pharyngeal cases | Controls | OR (95% CI)c | pstudiesd | Laryngeal cases | Controls | OR (95% CI)c | pstudiesd | |
|---|---|---|---|---|---|---|---|---|
| I Quintileb | 1062 | 1430 | 1 (reference) | <0.001 | 373 | 1430 | 1 (reference) | 0.633 |
| II Quintileb | 793 | 1751 | 0.71 (0.61–0.82) | 262 | 1751 | 0.74 (0.60–0.90) | ||
| III Quintileb | 721 | 1889 | 0.65 (0.57–0.75) | 252 | 1889 | 0.72 (0.58–0.88) | ||
| IV Quintileb | 677 | 1986 | 0.55 (0.46–0.66) | 251 | 1986 | 0.71 (0.57–0.87) | ||
| V Quintileb | 641 | 1940 | 0.49 (0.40–0.59) | 265 | 1940 | 0.66 (0.54–0.82) | ||
| pfor linear trend | <0.001 | <0.001 |
Estimated from multiple logistic regression models adjusted for age, sex, race, study center, education, cigarette smoking status, cigarette smoking intensity (number of cigarettes per day), cigarette smoking duration, cigar smoking status, pipe smoking status, alcohol drinking intensity (number of drinks per day), and the product (interaction) term for cigarette intensity and alcohol drinking.
The cut-offs for the quintile categories of fiber intake were: −0.786, −0.322, 0.129, and 0.729, respectively.
For the oral and pharyngeal cancer, heterogeneity between studies was appreciable and we reported the mixed-effects estimates derived from the corresponding generalized linear mixed model; for laryngeal cancer, there was less heterogeneity between studies and we reported the fixed-effects estimates.
P for heterogeneity between studies.
Decreasing ORs with higher fiber intakes were also observed across oral cavity and pharyngeal cancer subsites: the OR for the highest vs lowest quintile category was 0.39 (95% CI: 0.29–0.52) for oral cavity, 0.54 (95% CI: 0.45–0.64) for oropharynx and hypopharynx combined, and 0.46 (95% CI: 0.33–0.65) for oral cavity or pharynx not otherwise specified (Supplemental Table 3 – Online Resource). In addition, the ORs for the oropharynx were similar to those of the hypopharynx site (e.g. for the highest vs lowest quintile category, OR=0.58, 95% CI: 0.48–0.70 and OR=0.55, 95% CI: 0.41–0.74, respectively) (data not shown) but, given the limited number of hypopharyngeal cancer cases, we combined the results of these subsites.
Tables 3 and 4 show the ORs of oral and pharyngeal cancer combined and laryngeal cancer by strata of selected variables. An inverse association between fiber intake and risk of either cancer site was present in most of the strata, in accordance with the main findings from Table 2. However, there was appreciable heterogeneity in risk for laryngeal cancer across strata of geographic region, with only the 3 European studies showing a moderate inverse association (OR for the 5th vs. 1st quintile category = 0.45; 95% CI: 0.34–0.60; p for heterogeneity = 0.015). An appreciable heterogeneity between studies was present for several strata in Table 3, but not for most strata in Table 4.
Figure 1 shows the combined effect of fiber intake and alcohol or tobacco consumption on oral and pharyngeal cancer combined and laryngeal cancer. No deviation from multiplicative interaction was found for either cancer site (p-value for interaction - Panel A: 0.123; Panel B: 0.084; Panel C: 0.612; Panel D: 0.430). In addition, when comparing never/light drinkers with a higher than median consumption of fiber, the ORs for subjects with a lower than median consumption and ≥5 drinks/day of alcohol were 11.45 (95% CI 9.61–13.65) for oral and pharyngeal cancer combined (Panel A), and 5.36 (95% CI 3.30–8.71) for laryngeal cancer (Panel B). Compared to never smokers with a higher than median consumption of fiber, the ORs for subjects consuming a lower than median amount of fiber and being smokers of >20 cigarettes/day were 6.33 (95% CI 5.30–7.55) for oral and pharyngeal cancer combined (Panel C), and 26.34 (95% CI 18.28–37.95) for laryngeal cancer (Panel D).
Fig 1.
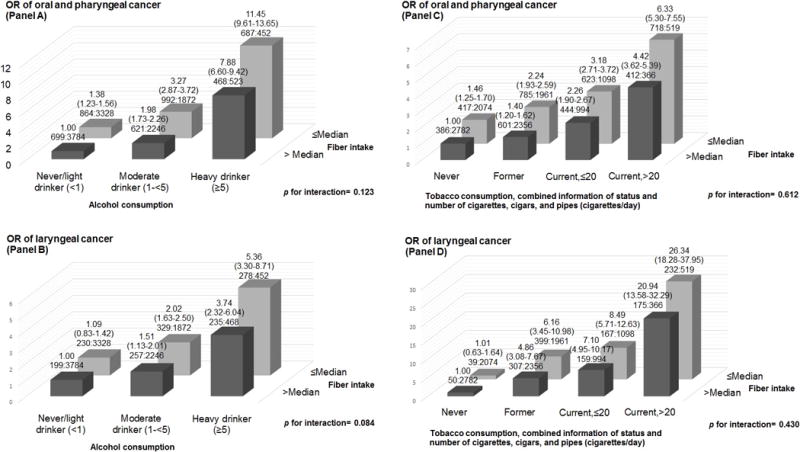
Odds ratios (ORs) of oral and pharyngeal, and laryngeal cancer, and corresponding 95% confidence intervals (CIs), according to alcohol or tobacco consumption and “non-alcohol energy-adjusted” fiber intake. International Head and Neck Cancer Epidemiology (INHANCE) consortium.
(a) The odds ratios were derived from mixed-effects logistic regression models adjusted for age, sex, education, race/ethnicity, study center, combined smoking habits of cigarettes, cigars and pipes, and alcohol drinking, when appropriate.
(b) The number of cases and controls within each category was indicated below the corresponding OR as: “number of cases: number of controls.”
In the sensitivity analyses considering additional adjustment for one extra nutrient at a time, the point estimates for quintiles of fiber intake were generally in line with the ones from the main analysis, although the ORs were higher for both cancer sites. The only exception was the adjustment by iron intake, which modified the OR of laryngeal cancer for the highest quintile category of fiber intake to 0.52 (95% CI: 0.44–0.62). With the additional adjustment by total fruit or total vegetable intake, the inverse association between dietary fiber intake and either tumor site was consistent, although the associations were less strong than in the main analysis for oral cavity and pharyngeal cancer combined.
Discussion
In this pooled analysis of 10 case–control studies providing information on dietary fiber within the INHANCE consortium – the largest dataset to date on the issue - we found inverse associations between dietary fiber intake and the risk of oral and pharyngeal cancer, as well as of laryngeal cancer. Similar results were observed across oral and pharyngeal cancer subsites and in most of the strata considered.
Several plausible mechanisms have been reported for such a favorable effect of dietary fiber13–16. First, dietary fiber may reduce glycaemic load59 and improve insulin sensitivity, favourably influencing insulin-like growth factor I (IGF-1), which is a promoter of the process of carcinogenesis at various sites60. Second, dietary fiber appears to have an anti-inflammatory role, via the production of short-chain fatty acids by gut bacteria with anti-proliferative and pro-apoptosis properties14, 16. Third, dietary fiber may also bind carcinogens and thereby limit their contact with upper digestive tract epithelia14, 17. Finally, fiber-rich foods generally tend to have a higher content of antioxidants17. However, a higher fiber intake may simply be an indicator of a diet rich in fruit, vegetables and pulses, and whole gains, and, on this way, poorer in refined cereals, meat and animal fats, which have been positively associated with a higher HNC risk11, 61, 62. Still, adjustment by fruit and vegetables, as well as selected micronutrients, only marginally affected the main results on fiber intake. Similarly, dietary fiber may simply be an indicator of a better general life-style pattern.
Some of the studies contributing data to our pooled analysis have already published separate reports on dietary fiber and HNC cancer risk18, 19, 25, 27. Besides them, at least 2 other cohorts26, 28 and 5 case-control studies20–24, most of which conducted before the 2000s, provided results on the issue. Among the most recent and largest studies, the National Institutes of Health (NIH)-AARP Diet and Health Study, a US cohort of ~500,000 elderly participants including 1867 HNC cases developed during ~11 years of follow-up, found an inverse association with fiber intake among women (OR 0.61, 95% CI: 0.42–0.89 for the upper quintile), consistent across subsites, and a weaker one among men (OR 0.88, 95% CI: 0.73–1.05)28. Similarly, in a cohort of over 34,000 postmenopausal women and 169 incident cases from the Iowa Women’s Health Study, an inverse association for fiber intake was observed for cancers of the upper aerodigestive tract combined (OR 0.57, 95% CI: 0.36–0.92 for the upper tertile). In detail, a higher fiber intake decreased oral and pharyngeal cancer (53 cases, OR 0.49), but not laryngeal cancer risk (21 cases, OR 1.82)26. Among the earlier investigations, a Chinese case-control study including 404 matched cases of oral cancer showed a strong inverse association for total dietary fiber (OR 0.38, 95% CI: 0.19–0.74 for the upper quartile), and for dietary fiber from vegetables and fruits, but no relation with fiber from other sources23. Reduced risks of oral and pharyngeal cancer for higher intakes of fibers were also observed in an Australian case-control study on 41 male cases (OR 0.14, 95% CI: 0.1–0.4 for the upper tertile)22, and in a US case-control study on 290 matched cases (OR 0.6, 95% CI: 0.4–0.9 for 1-standard deviation increase in intake)21. In addition, an inverse association with laryngeal cancer was found for energy-adjusted fiber intake in a US case-control study including 250 male cases20. The only study reporting little or no association with fiber intake was conducted in Uruguay, had a case-control design and included 133 cases of cancer of the upper aerodigestive tract, among which 33 were oral/pharyngeal cancers and 34 were laryngeal cancers24.
In interpreting our findings, there were some limitations. Concerning fiber intake, we were unable to assess the separate effect of different subtypes of fiber on HNC risk. Indeed, separate information on dietary fiber from vegetables, fruits or cereal grains was available in 4 studies and that on total soluble and insoluble fiber in 5 studies only. In addition, pooling dietary data is challenging34 and the various populations included in the analysis differ in many respects, including exposure to alcohol and tobacco. For these and other reasons, some heterogeneity among studies is to be expected. In our analysis, we identified heterogeneity among studies for oral and pharyngeal cancer combined and in several strata of interest, including subsites of oral and pharyngeal cancer. Our inspection of study-specific distributions, stratified and influence analyses showed also heterogeneity between European and American studies in the case of laryngeal cancer. However, it is difficult to isolate the effect of control sources (hospital- versus population-based) from that of geographic region (the 3 studies from Europe were all hospital-based and 4/6 American studies were population-based). The identified heterogeneity cannot, therefore, be attributed to selection bias and to different types of controls. In addition, our results may be biased by a non-differential misclassification of individual intakes (i.e. due to measurement error), and by differential misclassification derived from recall bias.
Our analysis also had several strengths. The large sample size provides the opportunity to consider cancer subsites and subgroups of interest with adequate statistical power. We could control for the potential confounding effect of tobacco smoking, alcohol drinking and their interaction, using information on status, duration and intensity for smoking and intensity for alcohol. Moreover, the inverse association with fiber intake was consistent across strata of tobacco smoking and alcohol drinking. We also assessed the presence of a potential bias related to the assumption of a single unknown education level in the Japan study, by comparing fiber effect estimates in the non-Japanese study population, adjusting versus not adjusting for education (but adjusting for other covariates). This sensitivity analysis provided reassuring results, with very similar ORs for both cancer sites (e.g. for the last quintile category, OR of oral cavity and pharyngeal cancer combined = 0.49, 95% CI: 0.40–0.59 and 0.49, 95% CI: 0.40–0.59, with and without the adjustment for education level, respectively; OR of laryngeal cancer = 0.57, 95% CI: 0.48–0.68 and 0.57, 95% CI: 0.48–0.69, with and without the adjustment for education level, respectively). In addition, we applied uniform criteria to define our exposure of interest. Finally, we found that effect estimates were similar in the different tumor subsites, suggesting that the action of dietary fiber represents a general mechanism, rather than a site-specific one.
In conclusion, findings from this large-scale pooled analysis indicated that a relatively high intake of fiber may play a protective role against HNC. Future studies that examine country-specific sources of dietary fiber - including fruits, vegetables, beans, nuts, brown rice, whole-grain breads, biscuits, and pasta - are warranted to further elucidate which foods are the main determinants of the inverse association observed between fiber intake and the incidence of HNCs.
Supplementary Material
Novelty and Impact.
We investigated the association between dietary fiber intake and cancers of the oral cavity/pharynx and larynx, using individual-level pooled data from the INHANCE consortium. Significant inverse associations were observed overall, across subsites, and strata, although in the presence of heterogeneity among studies. These conclusions were derived from a re-analysis of studies, which used standardized definitions of outcomes, exposure and confounders, a standardized statistical approach, and had enough power to inspect disease-exposure associations within strata.
Acknowledgments
Acknowledgements: MH, MF, CLV, PB, AD, and VE designed research; KM, DS, CLV, AO, JPZ, DMW, VJ, KM, ZFZ, HM, FL, VE, CB, WG, KK, MM, SS, and GPY conducted research and provided single-study databases; SCC and YAL prepared the pooled dataset for the analysis; MP provided advice on nutritional issues; VE performed all statistical analyses; FT collected and discussed the existing literature on this topic; VE and DK wrote the paper; VE had primary responsibility for final content. All authors read and approved the final manuscript.
Abbreviations
- BMI
Body Mass Index
- CI
Confidence Interval
- DMV
Department of Motor Vehicles
- FFQ
Food-Frequency Questionnaire
- HNC
head and neck cancer
- INHANCE
International Head and Neck Cancer Epidemiology consortium
- L
large
- M
medium
- MSKCC
Memorial Sloan Kettering Cancer Center
- NCI
National Cancer Institute
- NA
not available
- NE
Not estimable
- NIH
National Institutes of Health
- OR
Odds Ratio
- S
small
Footnotes
Funding: The INHANCE Pooled Data Project was supported by grants from the National Institutes of Health (NIH), National Cancer Institute, (NCI) R03CA113157 and NIDCR R03DE016611. Individual studies were funded by the following grants: 1. Italy Multicenter study: Italian Association for Research on Cancer (AIRC), Italian League Against Cancer, and Italian Ministry of Research; 2. Swiss study: the Swiss Research against Cancer/Oncosuisse [KFS-700 and OCS-1633]; 3. Los Angeles study: NIH [P50CA090388, R01DA011386, R03CA077954, T32CA009142, U01CA096134, R21ES011667] and the Alper Research Program for Environmental Genomics of the UCLA Jonsson Comprehensive Cancer Center; 4. Boston study: NIH [R01CA078609, R01CA100679]; 5. US multicenter study: The Intramural Program of the NCI, NIH, United States; 6. MSKCC study: NIH [R01CA051845]; 7. Japan study (2001–2005): Scientific Research grant from the Ministry of Education, Science, Sports, Culture and Technology of Japan (17015052) and grant for the Third-Term Comprehensive 10-Year Strategy for Cancer Control from the Ministry of Health, Labor and Welfare of Japan (H20-002); 8. North Carolina (2002–2006) study: NCI R01CA90731-01 and NIEHS P30ES010126; 9. Buffalo study: -; 10. Milan study (2006–2009): Italian Association for Research on Cancer (AIRC Grant Number 10068), Italian Foundation for Cancer Research (FIRC), and Italian Ministry of Education (PRIN 2009 X8YCBN) DK was supported by JSPS Grant-in-Aid for Young Scientists (B) (No.15K21283).
Conflict of interest: All the authors declare that they have no conflict of interest on the topic of the current paper.
References
- 1.Ferlay J, Shin HR, Bray F, Forman D, Mathers C, Parkin DM. Estimates of worldwide burden of cancer in 2008: GLOBOCAN 2008. International journal of cancer. 2010;127:2893–917. doi: 10.1002/ijc.25516. [DOI] [PubMed] [Google Scholar]
- 2.Seiwert TY, Cohen EE. State-of-the-art management of locally advanced head and neck cancer. British journal of cancer. 2005;92:1341–8. doi: 10.1038/sj.bjc.6602510. [DOI] [PMC free article] [PubMed] [Google Scholar]
- 3.Garavello W, Bertuccio P, Levi F, Lucchini F, Bosetti C, Malvezzi M, Negri E, La Vecchia C. The oral cancer epidemic in central and eastern Europe. International journal of cancer. 2010;127:160–71. doi: 10.1002/ijc.25019. [DOI] [PubMed] [Google Scholar]
- 4.Zeka A, Gore R, Kriebel D. Effects of alcohol and tobacco on aerodigestive cancer risks: a meta-regression analysis. Cancer causes & control: CCC. 2003;14:897–906. doi: 10.1023/b:caco.0000003854.34221.a8. [DOI] [PubMed] [Google Scholar]
- 5.Hashibe M, Brennan P, Chuang SC, Boccia S, Castellsague X, Chen C, Curado MP, Dal Maso L, Daudt AW, Fabianova E, Fernandez L, Wunsch-Filho V, et al. Interaction between tobacco and alcohol use and the risk of head and neck cancer: pooled analysis in the International Head and Neck Cancer Epidemiology Consortium. Cancer epidemiology, biomarkers & prevention: a publication of the American Association for Cancer Research, cosponsored by the American Society of Preventive Oncology. 2009;18:541–50. doi: 10.1158/1055-9965.EPI-08-0347. [DOI] [PMC free article] [PubMed] [Google Scholar]
- 6.Bravi F, Bosetti C, Filomeno M, Levi F, Garavello W, Galimberti S, Negri E, La Vecchia C. Foods, nutrients and the risk of oral and pharyngeal cancer. British journal of cancer. 2013;109:2904–10. doi: 10.1038/bjc.2013.667. [DOI] [PMC free article] [PubMed] [Google Scholar]
- 7.Edefonti V, Bravi F, La Vecchia C, Randi G, Ferraroni M, Garavello W, Franceschi S, Talamini R, Boffetta P, Decarli A. Nutrient-based dietary patterns and the risk of oral and pharyngeal cancer. Oral oncology. 2010;46:343–8. doi: 10.1016/j.oraloncology.2009.11.017. [DOI] [PubMed] [Google Scholar]
- 8.World Cancer Research Fund/American Institute for Cancer Research. Food, Nutrition, Physical Activity and the Prevention of Cancer: A Global Perspective. AICR; Washington, DC: 2007. [Google Scholar]
- 9.Pavia M, Pileggi C, Nobile CG, Angelillo IF. Association between fruit and vegetable consumption and oral cancer: a meta-analysis of observational studies. The American journal of clinical nutrition. 2006;83:1126–34. doi: 10.1093/ajcn/83.5.1126. [DOI] [PubMed] [Google Scholar]
- 10.Riboli E, Norat T. Epidemiologic evidence of the protective effect of fruit and vegetables on cancer risk. The American journal of clinical nutrition. 2003;78:559S–69S. doi: 10.1093/ajcn/78.3.559S. [DOI] [PubMed] [Google Scholar]
- 11.Lucenteforte E, Garavello W, Bosetti C, La Vecchia C. Dietary factors and oral and pharyngeal cancer risk. Oral oncology. 2009;45:461–7. doi: 10.1016/j.oraloncology.2008.09.002. [DOI] [PubMed] [Google Scholar]
- 12.Freedman ND, Park Y, Subar AF, Hollenbeck AR, Leitzmann MF, Schatzkin A, Abnet CC. Fruit and vegetable intake and head and neck cancer risk in a large United States prospective cohort study. International journal of cancer. 2008;122:2330–6. doi: 10.1002/ijc.23319. [DOI] [PubMed] [Google Scholar]
- 13.Ferguson LR, Chavan RR, Harris PJ. Changing concepts of dietary fiber: implications for carcinogenesis. Nutrition and cancer. 2001;39:155–69. doi: 10.1207/S15327914nc392_1. [DOI] [PubMed] [Google Scholar]
- 14.Kaczmarczyk MM, Miller MJ, Freund GG. The health benefits of dietary fiber: beyond the usual suspects of type 2 diabetes mellitus, cardiovascular disease and colon cancer. Metabolism: clinical and experimental. 2012;61:1058–66. doi: 10.1016/j.metabol.2012.01.017. [DOI] [PMC free article] [PubMed] [Google Scholar]
- 15.Latino-Martel P, Cottet V, Druesne-Pecollo N, Pierre FH, Touillaud M, Touvier M, Vasson MP, Deschasaux M, Le Merdy J, Barrandon E, Ancellin R. Alcoholic beverages, obesity, physical activity and other nutritional factors, and cancer risk: A review of the evidence. Critical reviews in oncology/hematology. 2016;99:308–23. doi: 10.1016/j.critrevonc.2016.01.002. [DOI] [PubMed] [Google Scholar]
- 16.Moore MA, Park CB, Tsuda H. Soluble and insoluble fiber influences on cancer development. Critical reviews in oncology/hematology. 1998;27:229–42. doi: 10.1016/s1040-8428(98)00006-7. [DOI] [PubMed] [Google Scholar]
- 17.Slavin J, Jacobs D, Marquart L. Whole-grain consumption and chronic disease: protective mechanisms. Nutrition and cancer. 1997;27:14–21. doi: 10.1080/01635589709514495. [DOI] [PubMed] [Google Scholar]
- 18.McLaughlin JK, Gridley G, Block G, Winn DM, Preston-Martin S, Schoenberg JB, Greenberg RS, Stemhagen A, Austin DF, Ershow AG, et al. Dietary factors in oral and pharyngeal cancer. Journal of the National Cancer Institute. 1988;80:1237–43. doi: 10.1093/jnci/80.15.1237. [DOI] [PubMed] [Google Scholar]
- 19.Gridley G, McLaughlin JK, Block G, Blot WJ, Winn DM, Greenberg RS, Schoenberg JB, Preston-Martin S, Austin DF, Fraumeni JF., Jr Diet and oral and pharyngeal cancer among blacks. Nutrition and cancer. 1990;14:219–25. doi: 10.1080/01635589009514096. [DOI] [PubMed] [Google Scholar]
- 20.Freudenheim JL, Graham S, Byers TE, Marshall JR, Haughey BP, Swanson MK, Wilkinson G. Diet, smoking, and alcohol in cancer of the larynx: a case-control study. Nutrition and cancer. 1992;17:33–45. doi: 10.1080/01635589209514171. [DOI] [PubMed] [Google Scholar]
- 21.Marshall JR, Graham S, Haughey BP, Shedd D, O’Shea R, Brasure J, Wilkinson GS, West D. Smoking, alcohol, dentition and diet in the epidemiology of oral cancer. European journal of cancer Part B, Oral oncology. 1992;28B:9–15. doi: 10.1016/0964-1955(92)90005-l. [DOI] [PubMed] [Google Scholar]
- 22.Kune GA, Kune S, Field B, Watson LF, Cleland H, Merenstein D, Vitetta L. Oral and pharyngeal cancer, diet, smoking, alcohol, and serum vitamin A and beta-carotene levels: a case-control study in men. Nutrition and cancer. 1993;20:61–70. doi: 10.1080/01635589309514271. [DOI] [PubMed] [Google Scholar]
- 23.Zheng T, Boyle P, Willett WC, Hu H, Dan J, Evstifeeva TV, Niu S, MacMahon B. A case-control study of oral cancer in Beijing, People’s Republic of China. Associations with nutrient intakes, foods and food groups. European journal of cancer Part B, Oral oncology. 1993;29B:45–55. doi: 10.1016/0964-1955(93)90010-c. [DOI] [PubMed] [Google Scholar]
- 24.De Stefani E, Ronco A, Mendilaharsu M, Deneo-Pellegrini H. Diet and risk of cancer of the upper aerodigestive tract-II. Nutrients Oral oncology. 1999;35:22–6. doi: 10.1016/s1368-8375(98)00061-x. [DOI] [PubMed] [Google Scholar]
- 25.Soler M, Bosetti C, Franceschi S, Negri E, Zambon P, Talamini R, Conti E, La Vecchia C. Fiber intake and the risk of oral, pharyngeal and esophageal cancer. International journal of cancer. 2001;91:283–7. doi: 10.1002/1097-0215(200002)9999:9999<::aid-ijc1047>3.0.co;2-i. [DOI] [PubMed] [Google Scholar]
- 26.Kasum CM, Jacobs DR, Jr, Nicodemus K, Folsom AR. Dietary risk factors for upper aerodigestive tract cancers. International journal of cancer. 2002;99:267–72. doi: 10.1002/ijc.10341. [DOI] [PubMed] [Google Scholar]
- 27.Pelucchi C, Talamini R, Levi F, Bosetti C, La Vecchia C, Negri E, Parpinel M, Franceschi S. Fibre intake and laryngeal cancer risk. Annals of oncology: official journal of the European Society for Medical Oncology/ESMO. 2003;14:162–7. doi: 10.1093/annonc/mdg032. [DOI] [PubMed] [Google Scholar]
- 28.Lam TK, Cross AJ, Freedman N, Park Y, Hollenbeck AR, Schatzkin A, Abnet C. Dietary fiber and grain consumption in relation to head and neck cancer in the NIH-AARP Diet and Health Study. Cancer causes & control: CCC. 2011;22:1405–14. doi: 10.1007/s10552-011-9813-9. [DOI] [PMC free article] [PubMed] [Google Scholar]
- 29.Hashibe M, Brennan P, Benhamou S, Castellsague X, Chen C, Curado MP, Dal Maso L, Daudt AW, Fabianova E, Fernandez L, Wunsch-Filho V, Franceschi S, et al. Alcohol drinking in never users of tobacco, cigarette smoking in never drinkers, and the risk of head and neck cancer: pooled analysis in the International Head and Neck Cancer Epidemiology Consortium. Journal of the National Cancer Institute. 2007;99:777–89. doi: 10.1093/jnci/djk179. [DOI] [PubMed] [Google Scholar]
- 30.Conway DI, Hashibe M, Boffetta P, consortium I. Wunsch-Filho V, Muscat J, La Vecchia C, Winn DM. Enhancing epidemiologic research on head and neck cancer: INHANCE - The international head and neck cancer epidemiology consortium. Oral oncology. 2009;45:743–6. doi: 10.1016/j.oraloncology.2009.02.007. [DOI] [PubMed] [Google Scholar]
- 31.Winn DM, Lee YC, Hashibe M, Boffetta P. The INHANCE consortium: toward a better understanding of the causes and mechanisms of head and neck cancer. Oral diseases. 2015;21:685–93. doi: 10.1111/odi.12342. [DOI] [PubMed] [Google Scholar]
- 32.Chuang SC, Jenab M, Heck JE, Bosetti C, Talamini R, Matsuo K, Castellsague X, Franceschi S, Herrero R, Winn DM, La Vecchia C, Morgenstern H, et al. Diet and the risk of head and neck cancer: a pooled analysis in the INHANCE consortium. Cancer causes & control: CCC. 2012;23:69–88. doi: 10.1007/s10552-011-9857-x. [DOI] [PMC free article] [PubMed] [Google Scholar]
- 33.Edefonti V, Hashibe M, Parpinel M, Ferraroni M, Turati F, Serraino D, Matsuo K, Olshan AF, Zevallos JP, Winn DM, Moysich K, Zhang ZF, et al. Vitamin E intake from natural sources and head and neck cancer risk: a pooled analysis in the International Head and Neck Cancer Epidemiology consortium. British journal of cancer. 2015;113:182–92. doi: 10.1038/bjc.2015.149. [DOI] [PMC free article] [PubMed] [Google Scholar]
- 34.Edefonti V, Hashibe M, Parpinel M, Turati F, Serraino D, Matsuo K, Olshan AF, Zevallos JP, Winn DM, Moysich K, Zhang ZF, Morgenstern H, et al. Natural vitamin C intake and the risk of head and neck cancer: A pooled analysis in the International Head and Neck Cancer Epidemiology Consortium. International journal of cancer. 2015;137:448–62. doi: 10.1002/ijc.29388. [DOI] [PMC free article] [PubMed] [Google Scholar]
- 35.Galeone C, Edefonti V, Parpinel M, Leoncini E, Matsuo K, Talamini R, Olshan AF, Zevallos JP, Winn DM, Jayaprakash V, Moysich K, Zhang ZF, et al. Folate intake and the risk of oral cavity and pharyngeal cancer: a pooled analysis within the International Head and Neck Cancer Epidemiology Consortium. International journal of cancer. 2015;136:904–14. doi: 10.1002/ijc.29044. [DOI] [PMC free article] [PubMed] [Google Scholar]
- 36.Leoncini E, Edefonti V, Hashibe M, Parpinel M, Cadoni G, Ferraroni M, Serraino D, Matsuo K, Olshan AF, Zevallos JP, Winn DM, Moysich K, et al. Carotenoid intake and head and neck cancer: a pooled analysis in the International Head and Neck Cancer Epidemiology Consortium. European journal of epidemiology. 2015 doi: 10.1007/s10654-015-0036-3. [DOI] [PMC free article] [PubMed] [Google Scholar]
- 37.Blot WJ, McLaughlin JK, Winn DM, Austin DF, Greenberg RS, Preston-Martin S, Bernstein L, Schoenberg JB, Stemhagen A, Fraumeni JF., Jr Smoking and drinking in relation to oral and pharyngeal cancer. Cancer research. 1988;48:3282–7. [PubMed] [Google Scholar]
- 38.Schantz SP, Zhang ZF, Spitz MS, Sun M, Hsu TC. Genetic susceptibility to head and neck cancer: interaction between nutrition and mutagen sensitivity. The Laryngoscope. 1997;107:765–81. doi: 10.1097/00005537-199706000-00011. [DOI] [PubMed] [Google Scholar]
- 39.Levi F, Pasche C, La Vecchia C, Lucchini F, Franceschi S, Monnier P. Food groups and risk of oral and pharyngeal cancer. International journal of cancer. 1998;77:705–9. doi: 10.1002/(sici)1097-0215(19980831)77:5<705::aid-ijc8>3.0.co;2-z. [DOI] [PubMed] [Google Scholar]
- 40.Bosetti C, Gallus S, Trichopoulou A, Talamini R, Franceschi S, Negri E, La Vecchia C. Influence of the Mediterranean diet on the risk of cancers of the upper aerodigestive tract. Cancer epidemiology, biomarkers & prevention: a publication of the American Association for Cancer Research, cosponsored by the American Society of Preventive Oncology. 2003;12:1091–4. [PubMed] [Google Scholar]
- 41.Peters ES, McClean MD, Liu M, Eisen EA, Mueller N, Kelsey KT. The ADH1C polymorphism modifies the risk of squamous cell carcinoma of the head and neck associated with alcohol and tobacco use. Cancer epidemiology, biomarkers & prevention: a publication of the American Association for Cancer Research, cosponsored by the American Society of Preventive Oncology. 2005;14:476–82. doi: 10.1158/1055-9965.EPI-04-0431. [DOI] [PubMed] [Google Scholar]
- 42.Cui Y, Morgenstern H, Greenland S, Tashkin DP, Mao J, Cao W, Cozen W, Mack TM, Zhang ZF. Polymorphism of Xeroderma Pigmentosum group G and the risk of lung cancer and squamous cell carcinomas of the oropharynx, larynx and esophagus. International journal of cancer. 2006;118:714–20. doi: 10.1002/ijc.21413. [DOI] [PubMed] [Google Scholar]
- 43.Hashibe M, Morgenstern H, Cui Y, Tashkin DP, Zhang ZF, Cozen W, Mack TM, Greenland S. Marijuana use and the risk of lung and upper aerodigestive tract cancers: results of a population-based case-control study. Cancer epidemiology, biomarkers & prevention: a publication of the American Association for Cancer Research, cosponsored by the American Society of Preventive Oncology. 2006;15:1829–34. doi: 10.1158/1055-9965.EPI-06-0330. [DOI] [PubMed] [Google Scholar]
- 44.Jayaprakash V, Rigual NR, Moysich KB, Loree TR, Nasca MA, Menezes RJ, Reid ME. Chemoprevention of head and neck cancer with aspirin: a case-control study. Archives of otolaryngology-head & neck surgery. 2006;132:1231–6. doi: 10.1001/archotol.132.11.1231. [DOI] [PubMed] [Google Scholar]
- 45.Suzuki T, Wakai K, Matsuo K, Hirose K, Ito H, Kuriki K, Sato S, Ueda R, Hasegawa Y, Tajima K. Effect of dietary antioxidants and risk of oral, pharyngeal and laryngeal squamous cell carcinoma according to smoking and drinking habits. Cancer science. 2006;97:760–7. doi: 10.1111/j.1349-7006.2006.00232.x. [DOI] [PMC free article] [PubMed] [Google Scholar]
- 46.Divaris K, Olshan AF, Smith J, Bell ME, Weissler MC, Funkhouser WK, Bradshaw PT. Oral health and risk for head and neck squamous cell carcinoma: the Carolina Head and Neck Cancer Study. Cancer causes & control: CCC. 2010;21:567–75. doi: 10.1007/s10552-009-9486-9. [DOI] [PMC free article] [PubMed] [Google Scholar]
- 47.Dresser CM. From nutrient data to a data base for a health and nutrition examination survey. Organization, coding and values-real or imputed. Proceeding of the 8th National Nutrient Data Base Conference Minneapolis; MN, USA. 1983; pp. 92–104. [Google Scholar]
- 48.US Department of Agriculture (USDA), Agricultural Research Service. USDA National Nutrient Database for Standard Reference, Release 26 and previous versions. Nutrient Data Laboratory Home Page. http://www.ars.usda.gov/Services/docs.htm?docid=8964.
- 49.Resource Council, Science and Technology Agency, the Government of Japan. Standard Tables of Food Composition in Japan, 5th Revised Version (in Japanese with English translation) Ministry of Finance Printing Bureau; Tokyo, Japan: 2000. [Google Scholar]
- 50.Gnagnarella P, Salvini S, Parpinel M. Food Composition Database for Epidemiological Studies in Italy. doi: 10.1016/s0304-3835(97)04686-7. Version 1.2015. Available online at: http://www.bda-ieo.it/ [DOI] [PubMed]
- 51.Greenfield H, Southgate DAT. Food composition data Production, Management and Use. 2nd. Rome, Italy: FAO/WHO; 2003. [Google Scholar]
- 52.Willett W, Stampfer MJ. Total energy intake: implications for epidemiologic analyses. American journal of epidemiology. 1986;124:17–27. doi: 10.1093/oxfordjournals.aje.a114366. [DOI] [PubMed] [Google Scholar]
- 53.Hosmer DW, Lemeshow S. Applied Logistic Regression. 2nd. New York, NY: John Wiley & Sons, Inc; 2000. [Google Scholar]
- 54.Chapter 9: Analysing data and undertaking meta-analyses. In: Deeks JJ, H J, Altman DG, editors; Higgins JPT, Green S, editors. Cochrane Handbook for Systematic Reviews of Interventions Version 5.1.0: The Cochrane Collaboration. 2011. [Google Scholar]
- 55.Pinheiro JC, B D. Mixed-Effects Models in S and S-PLUSed. New York, NY: Springer-Verlag; 2000. [Google Scholar]
- 56.R Development Core Team. R: A Language and Environment for Statistical Computing 2016. Vienna, Austria: R Foundation for Statistical Computing; http://www.R-project.org (27 July 2016, date last accessed) [Google Scholar]
- 57.Bates D, M M, Bolker B. Ime4: linear mixed-effects models using S4 classes. 2011 [Google Scholar]
- 58.Venables WN, R B. Modern Applied Statistics with S. 4th. New York, NY: Springer; 2002. [Google Scholar]
- 59.Augustin LS, Kendall CW, Jenkins DJ, Willett WC, Astrup A, Barclay AW, Bjorck I, Brand-Miller JC, Brighenti F, Buyken AE, Ceriello A, La Vecchia C, et al. Glycemic index, glycemic load and glycemic response: An International Scientific Consensus Summit from the International Carbohydrate Quality Consortium (ICQC) Nutr Metab Cardiovasc Dis. 2015;25:795–815. doi: 10.1016/j.numecd.2015.05.005. [DOI] [PubMed] [Google Scholar]
- 60.Yu H, Rohan T. Role of the insulin-like growth factor family in cancer development and progression. Journal of the National Cancer Institute. 2000;92:1472–89. doi: 10.1093/jnci/92.18.1472. [DOI] [PubMed] [Google Scholar]
- 61.Franceschi S, Favero A, Conti E, Talamini R, Volpe R, Negri E, Barzan L, La Vecchia C. Food groups, oils and butter, and cancer of the oral cavity and pharynx. British journal of cancer. 1999;80:614–20. doi: 10.1038/sj.bjc.6690400. [DOI] [PMC free article] [PubMed] [Google Scholar]
- 62.Bosetti C, La Vecchia C, Talamini R, Negri E, Levi F, Dal Maso L, Franceschi S. Food groups and laryngeal cancer risk: a case-control study from Italy and Switzerland. International journal of cancer. 2002;100:355–60. doi: 10.1002/ijc.10485. [DOI] [PubMed] [Google Scholar]
Associated Data
This section collects any data citations, data availability statements, or supplementary materials included in this article.