

Abstract
The permeability transition pore (PTP) is a Ca2+‐dependent mitochondrial channel whose opening causes a permeability increase in the inner membrane to ions and solutes. The most potent inhibitors are matrix protons, with channel block at pH 6.5. Inhibition is reversible, mediated by histidyl residue(s), and prevented by their carbethoxylation by diethylpyrocarbonate (DPC), but their assignment is unsolved. We show that PTP inhibition by H+ is mediated by the highly conserved histidyl residue (H112 in the human mature protein) of oligomycin sensitivity conferral protein (OSCP) subunit of mitochondrial F1FO (F)‐ATP synthase, which we also show to undergo carbethoxylation after reaction of mitochondria with DPC. Mitochondrial PTP‐dependent swelling cannot be inhibited by acidic pH in H112Q and H112Y OSCP mutants, and the corresponding megachannels (the electrophysiological counterpart of the PTP) are insensitive to inhibition by acidic pH in patch‐clamp recordings of mitoplasts. Cells harboring the H112Q and H112Y mutations are sensitized to anoxic cell death at acidic pH. These results demonstrate that PTP channel formation and its inhibition by H+ are mediated by the F‐ATP synthase.
Keywords: channel, F‐ATP synthase, mitochondria, permeability transition
Subject Categories: Autophagy & Cell Death, Membrane & Intracellular Transport
Introduction
The permeability transition (PT) is a Ca2+‐dependent permeability increase in the inner mitochondrial membrane to ions and solutes. Occurrence of the PT is favored by a variety of “inducers”, which include thiol oxidants, and opposed by a set of inhibitors, which include Mg2+, adenine nucleotides, cyclosporin (Cs) A, and acidic matrix pH 1. Occurrence of the PT in vitro is accompanied by depolarization and mitochondrial swelling 2, with cessation of ATP synthesis and maximization of ATP hydrolysis 3. The idea that a regulated pore could mediate PT‐dependent swelling was initially advanced in the 1970s 4, 5 and its regulatory features clearly defined in a set of seminal studies in 1979 6, 7, 8. Today, there is a general agreement that the PT is mediated by opening of a regulated high‐conductance channel, dubbed the PT pore (PTP). The PTP was independently identified by patch‐clamp experiments on inner membrane preparations (mitoplasts) and called mitochondrial megachannel (MMC) 9, 10, 11, 12. The PTP is causally involved in cell death in several disease paradigms, and the most documented cases include heart ischemia, muscular dystrophies, and neurodegenerative diseases 1.
In mammals, the best characterized regulatory protein component of the PTP is cyclophilin (CyP) D, a matrix peptidyl prolyl cis‐trans isomerase 13, 14, which appears to regulate the PTP through (un)binding to the channel proper 15, 16, 17. By following its interactions with other mitochondrial proteins, we detected CyPD binding to the FOF1 (F)‐ATP synthase, the rotary enzyme that synthesizes the vast majority of ATP in respiring cells 18. In mitochondria, F‐ATP synthase forms dimers, which then associate into long rows of oligomers that stabilize cristae structure 19, 20, 21. CyPD specifically interacts with subunit oligomycin sensitivity conferral protein (OSCP) on the peripheral stalk of F‐ATP synthase 22. This is the same binding site of Bz‐423, an immunomodulatory benzodiazepine 23 that like CyPD favors PTP opening 22. Following these observations, we and others could demonstrate that F‐ATP synthase forms Ca2+‐activated channels with the features of the bona fide PTP‐MMC in bovine 22, yeast 24, human 25, and Drosophila preparations 26.
The PT as well as the MMC is inhibited as matrix pH decreases below 7.0 12, 27 with complete block at pH 6.5 28. Inhibition is so strong that it offsets the inducing effect of depolarization by protonophores 29 yet it is reversible 27, being mediated by protonation of histidyl residue(s) 28 that can also be modified by singlet oxygen resulting in PTP inhibition 30. In this manuscript, we have addressed the mechanism of PTP inhibition by H+ through edited replacement of the highly conserved, unique histidyl residue of OSCP.
Results and Discussion
pH‐dependent interactions of CyPD with F‐ATP synthase and carbethoxylation of OSCP H112 by diethylpyrocarbonate
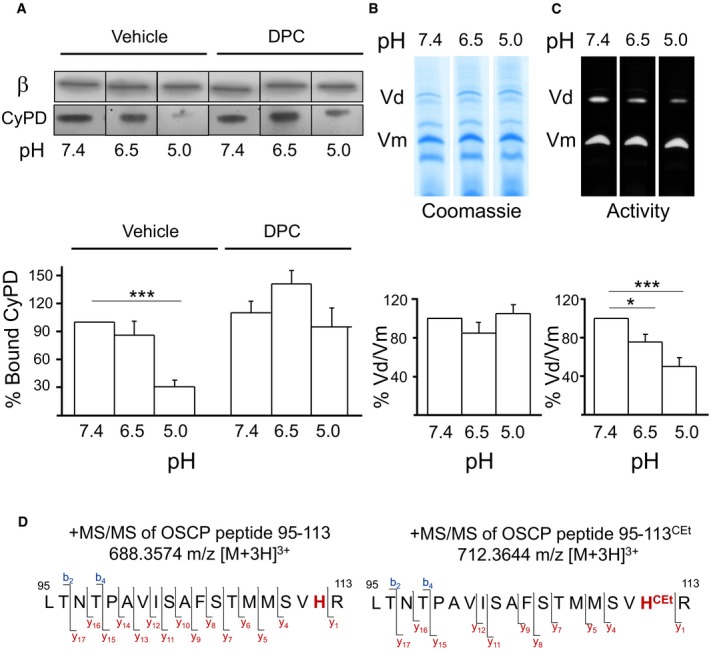
CyPD can be released from inside‐out submitochondrial particles at pH 5.0 in a process that is prevented by treatment with diethylpyrocarbonate (DPC) 17. Consistent with previous results, at pH 5.0, CyPD could be displaced from F‐ATP synthase in a process that was prevented by DPC (Fig 1A). Exposure to pH 5.0 and 6.5 caused no change in the dimer/monomer ratio revealed by Coomassie staining of blue native‐PAGE (Fig 1B), demonstrating that dimer stability is not affected by low pH. A matching inhibition of ATPase activity was observed (Fig 1C), the expected consequence of inhibitory factor 1 (IF1) binding 31. On the other hand, CyPD was not released at pH 6.5 (Fig 1A), that is, a value at which the PTP is inhibited by H+ in a DPC‐sensitive manner 28 (see also Fig 2). Treatment with DPC leads to carbethoxylation of histidyl residues with a mass increase of 72 Da 32, 33. In order to test whether the unique histidyl residue of OSCP (H112 in the human mature protein) is modified by DPC, F‐ATP synthase immunoprecipitates were subjected to SDS–PAGE analysis and the band at the molecular mass expected of the OSCP subunit was processed by in‐gel trypsin digestion. Liquid chromatography coupled to tandem mass spectrometry (LC‐MS/MS) analysis of the resulting peptide mixture and MASCOT search of the MS data lead to the identification of the OSCP subunit (UniProtKB AC P13621, Mascot score 505) with a good sequence coverage (55.4%). Signals of the OSCP tryptic peptide 95–113 were detected both for the unmodified form and for the peptide mono‐derivatized by DPC (95–113CEt, Fig EV1). Analysis of the ESI‐MS/MS spectra revealed that all the identified y ions containing the H112 residues in the carbethoxylated peptide exhibited a mass shift of 72 Da, confirming the mono‐carbethoxylation of this residue (Figs 1D and EV1). To extend these results, we replaced H112 in the endogenous OSCP gene of HEK293T cells with either Q or Y by CRISPR/Cas9 methods and tested the properties of the resulting PTP and MMC.
Figure 1. Effect of acidic pH and DPC on the interactions of CyPD with F‐ATP synthase at OSCP and carbethoxylation of OSCP H112.
-
ABovine heart mitochondria were incubated at the indicated pH in the absence or presence of 200 μM DPC, treated with 1% (w/v) digitonin, and F‐ATP synthase was immunoprecipitated with an anti‐F‐ATP synthase Ab followed by 15% SDS–PAGE. β subunit and CyPD content were detected by Western blotting. The ratio between CyPD and the corresponding β subunit is reported in the lower part of the panel, referring to pH 7.4 values as 100%. Data are an average ± s.e. of three independent experiments. The P‐values calculated with the Student's t‐test are shown, ***P ≤ 0.001.
-
B, CEDTA‐SMP were solubilized at the indicated pH values, extracted with 1% (w/v) digitonin, and subjected to BN‐PAGE in order to separate dimers (V d) and monomers (V m), which were identified by Coomassie blue (B) or in‐gel activity staining (C) and analyzed by densitometry, which is reported in the bottom part of each panel. Values report the dimer/monomer ratio, where the ratio at pH 7.4 was taken as 100%. Data are an average ± s.e. of three independent experiments. The P‐values calculated with the Student's t‐test are shown, *P ≤ 0.05 ***P ≤ 0.001.
-
DSequence of peptides 95–113 of OSCP before (left panel) and after reaction with DPC (right panel) obtained from tryptic digests of the SDS–PAGE band corresponding to the expected molecular mass of OSCP in immunoprecipitated F‐ATP synthase. Fragments of the series b and y identified in the LC‐MS/MS analysis are indicated on the sequence of the peptides. H112 and H112CeT are indicated in red boldface. Ions y4–y17 show a mass shift of +72 Da in the modified peptide.
Figure 2. The PTP cannot be inhibited by acidic pH in cells with OSCP H112Q and H112Y replacements.
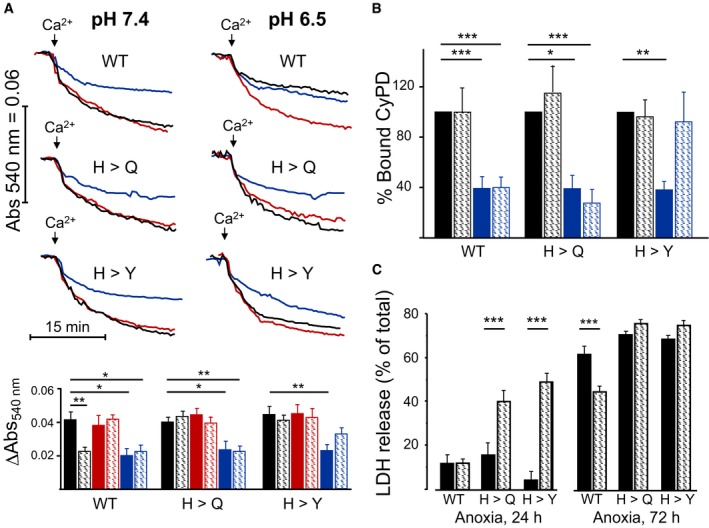
- Permeabilized HEK293T cells expressing wild‐type (WT) or edited (H112Q or H112Y) OSCP subunit were suspended in KSCN‐based media at pH 7.4 (left traces) or pH 6.5 (right traces), and PTP opening was measured as the decrease in absorbance at 540 nm. Where indicated (arrows), 0.1 mM Ca2+ in the absence of further additions (black traces) or in the presence of 0.5 mM DPC (red traces) or 2 μM CsA (blue traces) was added. The bottom panel reports the difference between the absorbance readings before the addition of Ca2+ and at the end of the swelling phase. Data are mean ± s.e. of five experiments (triplicate samples) for Ca2+ alone (black bars) and Ca2+ + DPC (red bars) and of three experiments (duplicate samples) for Ca2+ + CsA (blue bars). Solid bars, pH 7.4; hatched bars, pH 6.5.
- Mitochondria were prepared from cells, suspended in sucrose buffer at pH 7.4 (solid bars) or 6.5 (hatched bars) in the absence (black bars) or presence (blue bars) of 1.6 μM CsA, extracted with 1% (w/v) digitonin, and immunoprecipitated with an F‐ATP synthase antibody. The immunoprecipitates were subjected to 12% SDS–PAGE followed by Western blotting for CyPD and α subunit of F‐ATP synthase. Each immunodetected band was analyzed by densitometry, and the ratio between CyPD and α subunit was measured and expressed relative to the ratio obtained in the absence of CsA at pH 7.4, which was taken as 100%. Data are average ± s.e. of six independent experiments.
- HEK293T cells were incubated in a balanced salt solution containing 2‐deoxyglucose at pH 7.4 (solid bars) or 6.5 (hatched bars) and anoxia induced by incubation in a BD GasPak EZ Anaerobe Gas‐generating Pouch System (BD Biosciences). Cell death was measured based on LDH release (average ± s.e. from eight independent experiments).
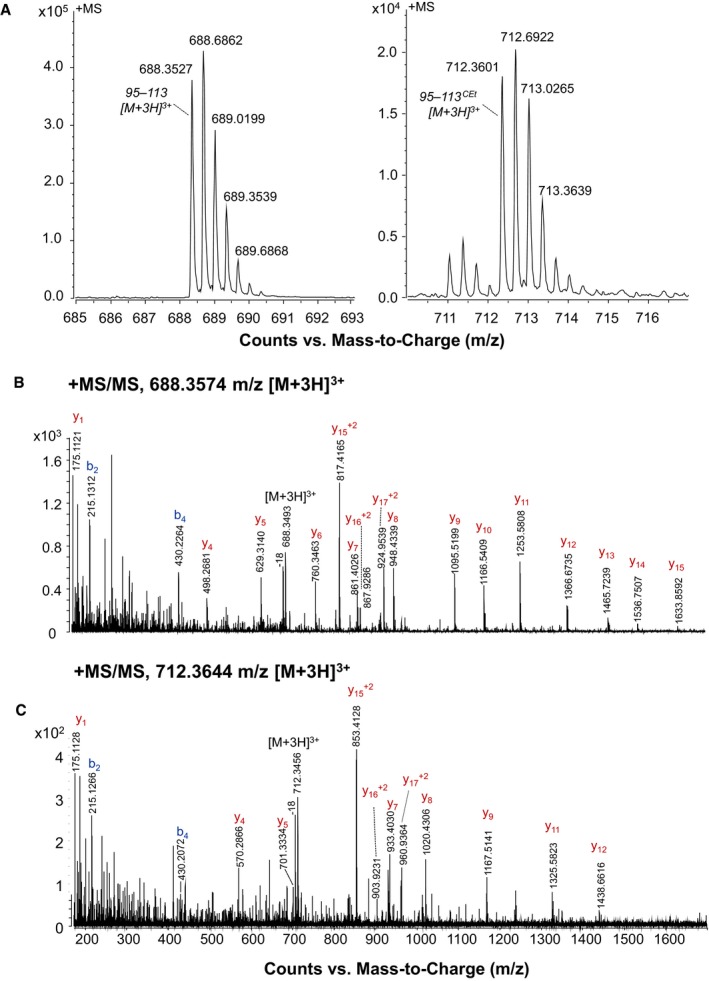
Figure EV1. Mass spectrometry analysis of the DPC‐modified OSCP subunit from bovine heart F‐ATP synthase.
-
ALC‐MS/MS data were acquired on the tryptic digest of the SDS–PAGE band corresponding to the theoretical molecular mass of OSCP separated from the immunoprecipitated ATP synthase. The m/z region of the ESI‐MS spectra acquired in the LC‐MS/MS analysis in which triply charged ions of peptide 95–113 (left panel, RT 16.8 min—experimental mass: 2,062.0504 Da, calculated mass: 2,062.034 Da) and 95–113CEt (right panel, RT 17.3 min—experimental mass: 2,134.0713 Da, calculated mass: 2,134.0551 Da) were detected is shown. The signal of the modified peptide was lower than that of the native peptide, a likely consequence of the instability of carbethoxylated His residues in peptides leading in turn to progressive loss of derivatization 17.
-
B, CIn the ESI‐MS/MS spectra of peptide 95–113 and 95–113CEt, ions assigned to fragments of the series y and b are indicated. Ions y4–y17 show a mass shift of +72 Da in the modified peptide.
The inhibitory effect of H+ on the PTP‐MMC is mediated by H112 of OSCP and confers protection from anoxia
We studied the effect of pH on the PT in permeabilized HEK293T cells incubated in a KSCN‐based medium in the presence of rotenone and without added respiratory substrates. Given the low basal permeability to K+, under these conditions added Ca2+ is taken up by mitochondria due to the diffusion potential created by the lipophilic SCN− 34. No H+ fluxes take place during Ca2+ transport, so that matrix pH remains stable at values slightly more acidic than those of extramitochondrial pH, possibly due to a Donnan effect 28. Ca2+ uptake is then followed by PTP opening and permeabilization to K+, which results in large amplitude matrix swelling that can be monitored as a decrease in apparent absorbance 28 both in isolated mitochondria and in permeabilized HEK293 cells (Fig EV2; note that, due to the PTP size, Ca2+‐induced swelling cannot be increased further by the addition of alamethicin). At pH 7.4, Ca2+ addition was followed by the expected process of absorbance decrease, which took place in wild‐type cells as well as in the H112Q and H112Y mutants (Fig 2A, black traces). In all cases, swelling could not be stimulated by DPC (red traces), while it was largely inhibited by CsA (blue traces; the residual swelling is due to the accumulation of Ca2+ SCN−). A different picture emerged when the experiment was performed at pH 6.5. As expected, PTP‐dependent swelling was inhibited in wild‐type mitochondria 28, where no additional inhibitory effect of CsA was seen and inhibition by H+ was relieved by DPC (Fig 2A). Strikingly, in the H112Q and H112Y OSCP mutants, the PTP could not be inhibited by acidic pH nor stimulated by DPC, while it was still sensitive to CsA, albeit inhibition was decreased in the H112Y mutant at pH 6.5 (Fig 2A). Quantitative analysis of the effects of pH and DPC confirmed the regulatory effect of H112 on Ca2+‐dependent PTP opening (Fig 2A, bottom panel) and supports our conclusion that protonation of H112 of OSCP mediates PTP inhibition by H+. Thus, the unique H112 residue of OSCP of F‐ATP synthase mediates inhibition of the PTP by acidic pH in swelling assays of permeabilized cells, where all pores are sampled.
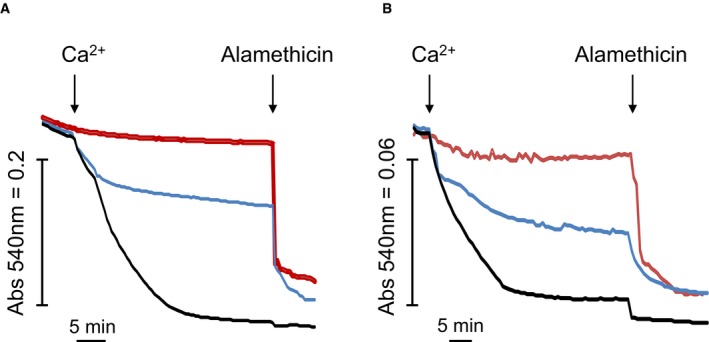
Figure EV2. Mitochondrial swelling in KSCN‐based medium in mouse liver mitochondria and permeabilized HEK293T cells.
-
A, BOne hundred micrograms of mouse liver mitochondria (A) or 1 × 10⁶ wild‐type HEK293T cells (B) was suspended in KSCN‐based medium at pH 7.4. Final volume was 0.2 ml, and swelling was assessed as the decrease in absorbance at 540 nm. Where indicated (arrows), 0.5 mM (A) or 0.1 mM (B) Ca2+ was added. Red and blue traces: The medium was supplemented with 0.2 μM ruthenium red or 2 μM CsA, respectively. Where indicated, 10 μM alamethicin was added. Traces shown are representative of quadruplicate samples from two independent experiments per condition.
CyPD was not released from F‐ATP synthase at pH 6.5 whether position 112 is occupied by H, Q, or Y (Fig 2B), indicating that the inhibitory effect of pH 6.5 (or lack thereof) is not mediated by altered CyPD binding. This is consistent with our previous finding that the PTP is inhibited by H+ in CyPD‐null mitochondria 35. It should also be noted that CyPD was substantially released by CsA except for the OSCP H112Y mutant at pH 6.5 (Fig 2B), suggesting an interaction of higher affinity between CyPD and OSCP that could explain why in this mutant inhibition of swelling by CsA was partial (Fig 2A). Importantly, the OSCP H112Q and H112Y mutations did not affect the inhibitory effect of acidic pH on the rate of ATP hydrolysis (Fig EV3A). Note that the full inhibitory effect of acidic pH required several minutes, presumably reflecting the kinetics of IF1 binding. Both the immediate inhibitory effect of acidic pH and the final, IF1‐dependent inhibited state 36 were identical (Fig EV3B), consistent with the comparable level of expression of IF1 in all cell lines (Fig EV3C). No differences were detected in basal oxygen consumption, sensitivity to oligomycin and maximal respiratory rate elicited by carbonyl cyanide‐p‐trifluoromethoxyphenyl hydrazone (FCCP) (Fig EV3D).
Figure EV3. OSCP H112Y and H112Q replacements do not affect ATPase inhibition by acidic pH and cellular oxygen consumption rate.
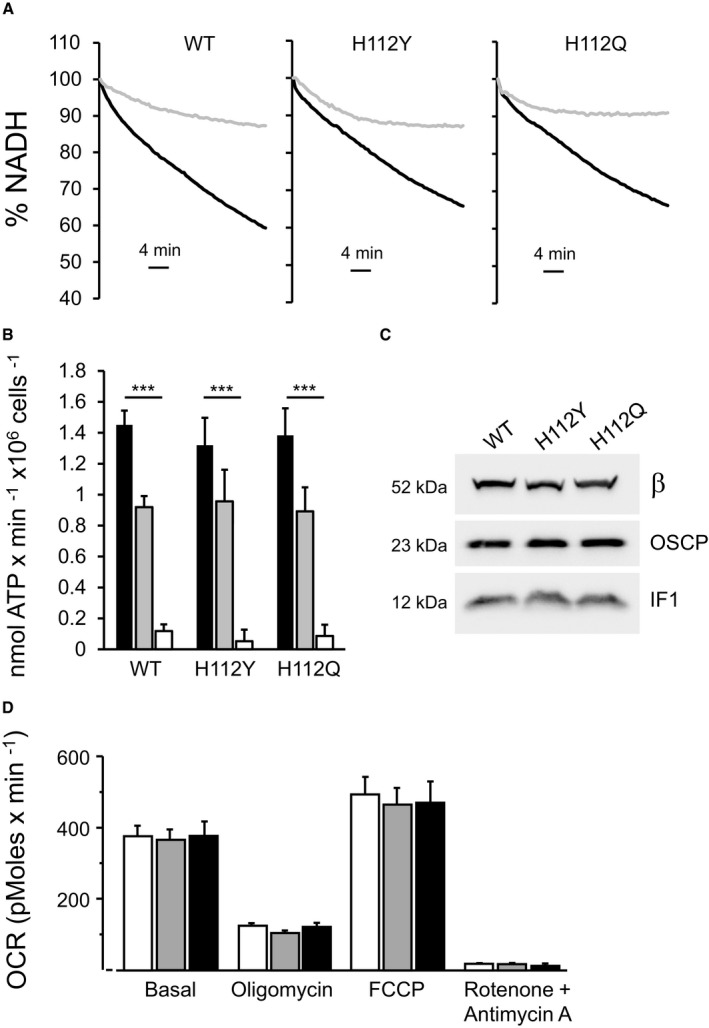
- Permeabilized HEK293T cells expressing wild‐type (WT) or edited (H112Y or H112Q) OSCP subunit were suspended as specified in Materials and Methods at pH 7.4 (closed trace) or pH 6.5 (gray trace), and ATP hydrolysis was measured as the decrease in NADH absorbance at 340 nm. One representative trace per condition (out of at least three biological replicates in triplicate) is shown as % of the initial value.
- Rate of resveratrol‐sensitive ATP hydrolysis at pH 7.4 (closed bars), pH 6.5 initial phase (gray bars), and pH 6.5 final phase (open bars). Data are average ± s.e. of four independent experiments. P‐values shown are calculated with the Student's t‐test (***P ≤ 0.001).
- Mitochondria were isolated from wild‐type, H112Y and H112Q cells and evaluated by Western blotting for β subunit (β), OSCP and IF1. Molecular size is indicated on the left.
- Respiration was assessed using a Seahorse XF24 extracellular flux analyzer. Oxygen consumption rate (OCR) was recorded without additions (Basal) followed by the addition of 1 μg/ml oligomycin, 0.1 μM FCCP, or 1 μM rotenone and 1 μM antimycin A. Open, gray and closed bars refer to wild‐type, H112Q and H112Y OSCP mutants, respectively. Data are average ± s.e.m. of six independent experiments.
Acidification protects a variety of cells from anoxic injury 37, and it has been proposed that PTP inhibition is one of the protective factors preventing tissue damage 38. In keeping with this hypothesis, wild‐type HEK293T cells were quite resistant to 24 h of anoxia at both pH 7.4 and 6.5, while cell death occurred in a large fraction of OSCP H112Q and H112Y mutants at acidic pH, suggesting that OSCP H112 protonation prevents the otherwise lethal effects of anoxia (Fig 2C). Protection by acidosis was observed also at 72 h of anoxia and was lost in the H112 mutants, suggesting that protonation of H112 is essential (Fig 2C).
Single channel block of the MMC by H+ depends on OSCP H112
We next tested the features of the MMC, the electrophysiological equivalent of the PTP 39, using the patch‐clamp technique on mitoplasts (i.e., mitochondria devoid of the outer membrane). The recorded activity was very similar in wild‐type and H112Q mutants (Fig 3A), with maximal single channel conductance values of about 1 nS. Both channel activities were characterized by numerous subconductance states, which is the typical behavior of the MMC 40, 41. In most experiments, the half‐conductance substate of about 500 pS was prevalent, and rapid closures and openings (flickering) occurred between different substates (Figs 3A and EV4). Of note, at 0.1 mM Ca2+ (a low concentration for MMC opening) activity was observed in less than 50% of wild‐type mitoplasts (n = 22) and in 100% of H112Q mutants (n = 17), suggesting that the mutation sensitizes the channel to Ca2+. Acidification of the bath to pH 6.5 caused a marked inhibition of the activity in four out of five experiments in wild‐type mitoplasts, as evident both from the current traces and the corresponding amplitude histograms obtained from continuous 120‐s‐long recordings (Fig 3B). In striking contrast, in mitoplasts harboring the OSCP H112Q mutation, a decrease in pH to 6.5 did not cause significant changes of either single channel conductance or open probability, as illustrated by current recordings and amplitude histograms (Fig 3C). Lack of inhibition by pH values ranging between 6.2 and 6.5 was observed in seven out of seven experiments with the H112Q mitoplasts, while the MMC maintained its sensitivity to Ba2+, a classical inhibitor of the MMC 12 and of the PTP 27 that completely abolished channel activity (Fig 3C). Inhibition by Ba2+ (which based on inhibitor titrations competes with the Ca2+ binding site 27) indicates that lack of inhibition by acidic pH is not due to a major structural alteration of the mutant. Of interest is the observation that the MMC recorded in mitoplasts from cells harboring the H112Q mutation of OSCP had a somewhat increased sensitivity to Ca2+. These findings suggest that the PTP may be modulated by H112 (de)protonation also at physiological matrix pH values. Lack of inhibition by acidic pH was also observed in recordings of the H112Y substitution (Fig EV4).
Figure 3. H112Q replacement in OSCP does not affect single channel features of the MMC in mitoplasts but renders it insensitive to acidification.
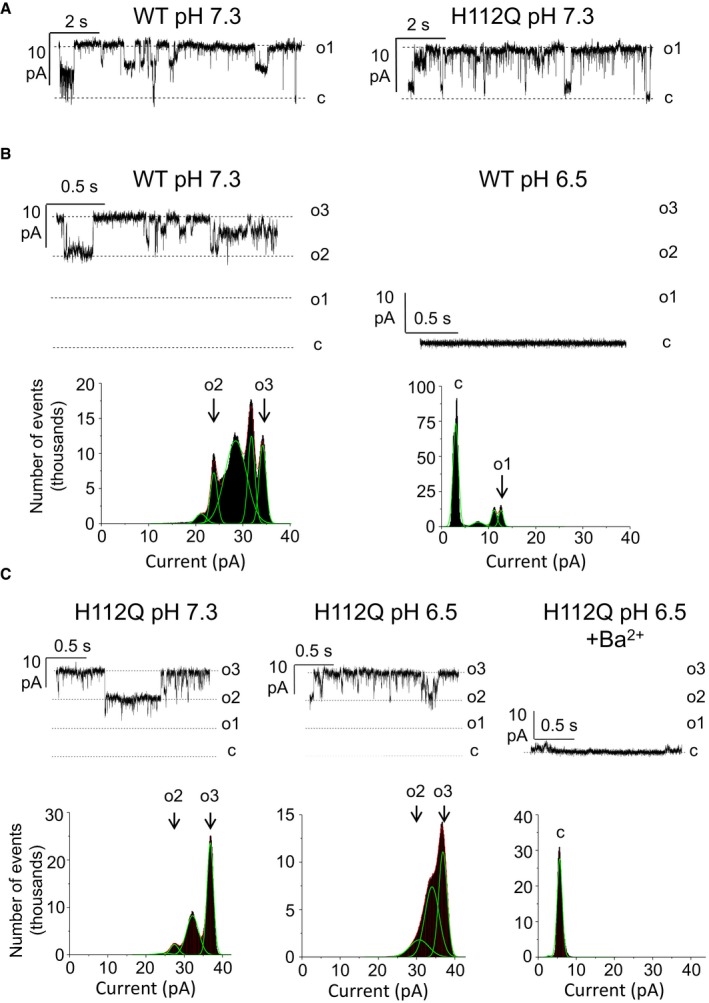
- Representative current traces recorded at V (pipette) +10 mV from mitoplasts derived from wild‐type (WT) or H112Q OSCP mutation‐harboring cells.
- Channel activity (top) and corresponding amplitude histograms (bottom) recorded in wild‐type mitochondria before (WT pH 7.3) and after acidification to pH 6.5 (WT pH 6.5). Amplitude histograms were obtained from 120‐s‐long current traces for the corresponding pH values, and the panels are from the same experiment.
- Recordings as in (B) from mitoplasts of cells harboring the OSCP H112Q replacement. Left panel, pH 7.3; middle panel, 440 s after acidification to pH 6.5; right panel, 30 s after the addition of 5 mM Ba2+ at pH 6.5. Amplitude histograms were obtained from 100‐s‐long segments, and the panels are from the same experiment.
Figure EV4. Representative current traces of patch‐clamp experiments on mitoplasts.
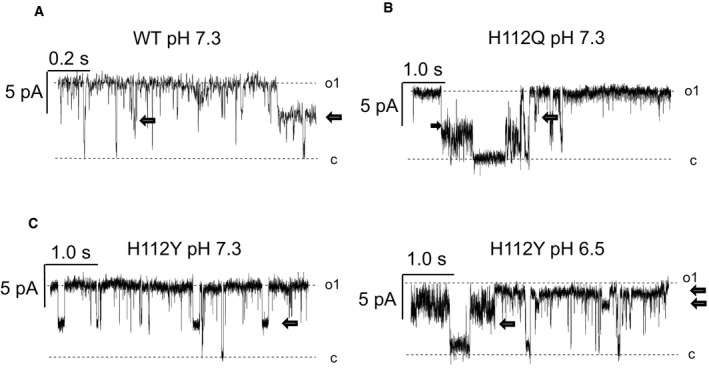
-
A–CCurrent traces were recorded at an applied pipette voltage of +10 mV in WT (A), H112Q (B), and H112Y mitoplasts (C). Note the presence of substates (arrows) typical of the mitochondrial megachannel 39. The recordings also document the half‐conductance substate that was prevalently observed. In panel (C), activity was recorded at pH 7.3 (left) followed by the addition of 0.1 M HCl to the recording chamber to obtain pH 6.5, and recording was resumed 310 s later (right).
Molecular dynamics simulation of the lateral stalk with (de)protonated H112
H112 is at a hinge position between the N‐terminal domain (which makes extensive contacts with the F1 sector) and the C‐terminal domain (which contacts subunits b and F6) and could establish interactions with the flexible C‐terminal region influencing its orientation 42, 43. To investigate this possibility, we performed molecular dynamics simulations on the neutral and protonated forms of H112. The results show (i) that the HRGE stretch 112–115 is involved in contacts with stretch 130–135, which in turn contacts subunit b, and (ii) that the contacts are more frequent for the protonated form (Fig 4, left panel). Another difference is the formation of polar interactions between sidechains of H112 and E115, which occurs much more frequently in the protonated form (Fig 4). Interestingly, HRGE residues 112–115 in OSCP are fully conserved in all Vertebrata (from Homo sapiens to Xenopus laevis, excluding most divergent sequences) (Fig 4). Conformations of the HRGE motif similar to those depicted in Fig 4 are also found in the crystal structures of 3,600 proteins in the culled PDB dataset 44, with a preference for tight turn or 3‐10‐helix or α‐helix conformations, often with a hydrogen bond or salt bridge between H and E. These data suggest that a direct interaction between the side chains of H112 and E115 in OSCP is likely and, therefore, that a pH‐dependent conformational transition controlled by protonation of H112 may be reasonably envisaged at positions 112–115. In turn, this could affect the position of the lateral stalk relative to the rest of F‐ATP synthase (Fig 4).
Figure 4. Effect of H112 protonation on OSCP molecular dynamics and sequence comparison of OSCP across species.
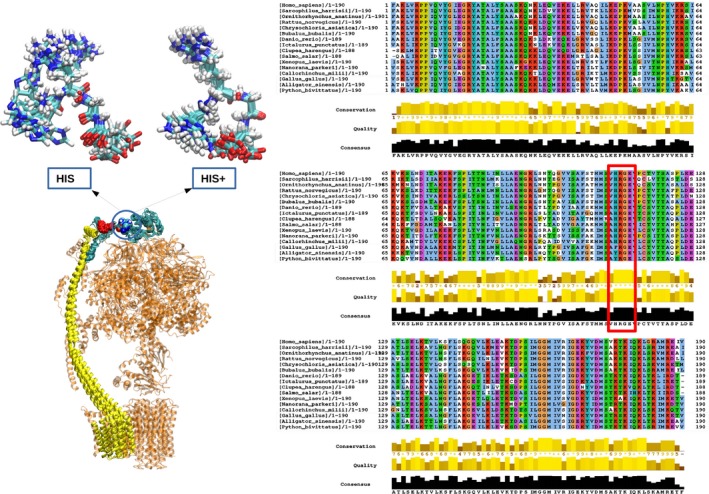
The left panel depicts a cryo‐EM based atomic model of monomeric bovine F‐ATP synthase (pdb 5ara) (excluding subunits e, f, g, DAPIT, 6.8PL, and A6L) with OSCP (cyan) and subunit b (yellow) highlighted on the structure of F‐ATP synthase in the lower part of the panel. The region H112‐E115 is shown as van der Waals spheres (inflated for better visibility). The backbone of the stretch T130‐K135 is shown in red van der Waals spheres. The top part of the panel shows the results of restrained molecular dynamics simulations of the isolated lateral stalk (OSCP and subunits b, d, F6) displaying a large number of conformations in this region. Snapshots taken at 1‐ns intervals along the last 15 ns of the trajectory are shown for the fragment 112‐HRGE‐115 for the deprotonated (HIS) and the protonated form (HIS+). Only for protonated H112, a salt bridge with a well‐defined turn or helix arrangement at H112‐E115 is found in a large number of MD conformations. The larger conformational variability of the deprotonated form can also be appreciated. The right panel reports a sequence comparison of OSCP across 16 out of 197 species (HRGE is boxed in red; Sauria sequences are in the thin black box). Conservation, quality of the alignment and consensus at each position in the alignment of all vertebrate sequences in RefSeq, excluding Sauria and most divergent sequences, are described in the documentation of the program JalView 67.
PTP opening is triggered by matrix Ca2+, which binds to the catalytic site in F1 45, while the pore must form within the inner membrane. We therefore envisage an indirect coupling mechanism whereby the conformational change induced by Ca2+ binding is transmitted to the rigid peripheral stalk causing pore formation within the membrane portions of subunits b, e, f, and/or g, probably at the interface between two dimer‐forming F‐ATP synthase monomers 22. OSCP appears ideally suited to perform this coupling function, and our current findings and mechanistic simulations provide a reasonable explanation for how the conformational change could be transmitted to the peripheral stalk in a pH‐sensitive manner. A conformational transition of OSCP controlled by protonation of H112 (increased interaction of the 112–115 with the 130–135 stretch of OSCP itself) could affect the contacts between the OSCP and b subunits preventing subsequent channel formation in the inner membrane. It is of note that cryo‐EM did reveal combined conformational changes between OSCP and the b subunit at its point of entrance into the membrane 43.
It should also be mentioned that OSCP is the site of convergence of protein regulatory interactions mediated by phosphorylation 46, S‐nitrosylation 47, and acetylation 48, 49, 50, 51 that may link the PTP to metabolic regulation. Consistent with this idea, OSCP is the binding site (i) of CyPD, which sensitizes the PTP to the effects of matrix Ca2+ and is released by CsA resulting in PTP inhibition, and (ii) of the deacetylase SIRT3, which is released (and activated) after protonation of H112 (H135 including the signal sequence) 51, that is, the same PTP‐modulating residue identified here. CyPD binding (and thus the propensity of the PTP to open) is in turn affected by (de)acetylation of OSCP K47 (K70 with the signal sequence) with decreased binding affinity when this residue is deacetylated 50. This is an interesting post‐translational regulatory mechanism, but deacetylation of OSCP K47 appears not to be relevant for PTP inhibition by H+ because this effect is also observed in CyPD‐null mitochondria 35.
Our original proposal supporting PTP formation from F‐ATP synthase was based on the use of membrane‐free, gel‐purified dimers of F‐ATP synthase preparations able to form MMC‐like channels once incorporated in lipid bilayers 22. In the present work, we have shown that single amino acid replacements at H112 in OSCP are sufficient to change the MMC/PTP activity within the native inner membrane. These findings provide strong evidence that the PTP forms from F‐ATP synthase and are the first direct indication that H112 of OSCP (and by inference the PTP) mediates cell protection from anoxia at acidic pH. While the present study directly establishes that F‐ATP synthase participates in PTP formation, the mechanism through which this transition is achieved awaits clarification. The hypothesis that the channel forms at the c ring 25, 52 has been seriously undermined by atomistic simulations 53 and by studies in HAP1‐A12 cells devoid of the c subunit 54. After submission of the present manuscript, the Walker laboratory has also reported the presence of a PT in cells where subunits OSCP or b had been genetically ablated 55. We note that the methods used to monitor occurrence of the PT (Ca2+ retention capacity, tetramethylrhodamine methyl ester accumulation, and calcein loading‐cobalt quenching) cannot detect changes of PTP channel size; and that PTP‐dependent swelling in the absence of the b or OSCP subunits was about 25 and 40% of the wild‐type rate, respectively 55. We conclude that the PTP size is affected by genetic ablation of subunits OSCP and b, and we suspect that more than one subunit contributes to full‐conductance PTP opening. This hypothesis is being tested by patch‐clamp characterization of PTP channels in yeast deletion mutants of lateral stalk subunits.
Materials and Methods
Reagents and cells
Oligomycin, rotenone, antimycin A, pyruvate, FCCP, ATP, ADP, EDTA, EGTA, digitonin, and protease inhibitors were from Sigma (Milan, Italy). CsA was purchased from Calbiochem. HEK293T were obtained from the American Tissue Culture Collection (ATCC) and cultured in Dulbecco's modified Eagle's medium (DMEM; Lonza, Basel, Switzerland) supplemented with fetal calf serum (10%), glutamine (4 mM), and penicillin and streptomycin (Thermo Fisher Scientific, Waltham, MA, USA). Cells were free of contamination with mycoplasma. Antibodies for β and OSCP subunits and for IF1 were from Abcam (Cambridge, UK), while those against CyPD were from Calbiochem.
Preparation of mitochondria and submitochondrial particles
Mitochondria from bovine heart (BHM), mouse liver, and HEK293T cells were isolated in 250 mM sucrose, 10 mM Tris–HCl, 0.1 mM EGTA‐Tris pH 7.4 as previously described 56, 57. EDTA submitochondrial particles (EDTA‐SMP) were prepared as follows. Bovine heart mitochondria suspended at 20 mg/ml in 0.25 M sucrose were supplemented with 2 mM EDTA and the pH adjusted to 8.5–8.8 with Tris base. The suspension was subjected to two 30‐sec cycles of sonication at 50 W with 30‐s intervals on ice in a UP200Ht Ultrasonic homogenizer (Hielscher, Teltow, Germany) and finally centrifuged as previously described 58.
Blue native gel electrophoresis
Freshly prepared EDTA‐SMP were suspended at 3 mg/ml in 250 mM sucrose, 10 mM MOPS, 10 mM Pi, 5 mM succinate, 20 μM EGTA at pH 7.4 or 6.5, or in 250 mM sucrose, 20 mM sodium acetate, 20 μM EGTA at pH 5.0 for 20 min at room temperature. Then, samples were centrifuged at 100,000 × g for 30 min at 4°C and pellets resuspended at 10 mg/ml in 50 mM NaCl, 30 mM Tris, and 5 mM aminocaproic acid, pH 7.4. Digitonin was added at 1 mg of detergent/mg protein, and the suspensions were immediately centrifuged at 100,000 × g for 25 min at 4°C. Fourteen microliters of each supernatant was mixed with 1 μl of sample buffer (5% Coomassie Brilliant blue G‐250 in 1 M aminocaproic acid) and loaded onto a 3–12% polyacrylamide gradient blue native gel (Invitrogen) 59. After electrophoresis, gels were stained with colloidal Coomassie or used for in‐gel activity staining 22.
Immunoprecipitation
Half milligram of freshly prepared BHM was suspended in 250 mM sucrose, 10 mM MOPS, 10 mM Pi, 5 mM succinate, 20 μM EGTA pH 7.4. MOPS was replaced with 10 mM sodium acetate pH 7.4 (acetate buffer) for treatment with 0.2 mM DPC (15 min at room temperature) followed by acidification with acetic acid buffer to reach a final value of 6.5 or 5.0 17. After centrifugation for 15 min at 20,000 × g and 4°C, the mitochondrial pellets were suspended at 10 mg/ml in MOPS buffer containing 10 mM imidazole to quench the DPC reaction, washed by centrifugation, treated with 1% (w/v) digitonin in 50 mM NaCl, 30 mM Tris and 5 mM aminocaproic acid, pH 7.4, and centrifuged at 100,000 × g for 25 min at 4°C. Supernatants were incubated overnight under wheel rotation at 4°C in the presence of anti‐ATP synthase monoclonal Ab conjugated with Sepharose G beads in a ratio of 20 μl/mg of protein. After centrifugation at 500 × g for 5 min, the beads were washed twice in a buffer containing 0.05% (w/v) dodecyl maltoside in Ca2+ and Mg2+‐free phosphate‐buffered saline. The elution was performed in SDS–PAGE loading buffer (20 mM Tris/HCl pH 6.8, 4% w/v SDS, 2% v/v β‐mercaptoethanol, 20% v/v glycerol and 0.01% w/v bromophenol blue). The collected fractions were heated at 98°C for 5 min and subjected to SDS–PAGE followed by Western blotting against CyPD and β subunit of F‐ATP synthase. For mass spectrometry analyses, the immunoprecipitation protocol included these modifications: Mitochondria were incubated in MOPS buffer without Pi (pH 7.4) and treated with 1 mM DPC. The samples were eluted in a buffer containing 2% v/v Tris(2‐carboxyl)phosphine instead of β‐mercaptoethanol, and the 15% SDS–PAGE separation was followed by Coomassie staining. Mitochondria from HEK293T cells were suspended at 1 mg/ml in MOPS buffer at pH 7.4 or 6.5 for 30 min at room temperature, and then, 1.6 μM CsA was added and the incubation carried out for 15 min at room temperature. The mitochondrial pellets were treated as described above.
In‐gel digestion of F‐ATP synthase OSCP subunit
After immunoprecipitation of F‐ATP synthase from BHM samples were separated by 15% SDS–PAGE, the OSCP band was excised and processed for in‐gel digestion 60. Briefly, protein bands were cut into 1 mm3 cubes, washed with water, water/acetonitrile (1/1, v/v), and shrunk with neat acetonitrile. The gel particles were swelled in 10 mM dithiothreitol and 0.1 M NH4HCO3 pH 8.2 and incubated for 45 min at 56°C. After cooling at room temperature, the liquid was replaced with the same volume of iodoacetamide solution (55 mM iodoacetamide in 0.1 M NH4HCO3) and the tubes were incubated for 30 min in the dark at room temperature. After removal of the iodoacetamide solution, gel pieces were washed again with water followed by water/acetonitrile (1/1, v/v) and shrunk with neat acetonitrile to remove completely the Coomassie staining. The gel particles were eventually rehydrated on ice in a solution containing 5 ng/μl of trypsin (Promega, modified sequencing grade) in 50 mM NH4HCO3. After 45 min, the remaining supernatant was removed, replaced with 50 mM NH4HCO3 without trypsin, and incubated overnight at 37°C under agitation in a Thermomixer (Eppendorf). The supernatants were then transferred to clean tubes. To extract more peptides, gel particles were incubated with 0.1% (v/v) formic acid and with the same 0.1% formic acid solution diluted by addition of an equal volume of neat acetonitrile. All the peptide‐containing supernatants were combined and dried using a Speed‐Vac system (Savant).
Mass spectrometry
LC‐MS/MS analyses were performed on the in‐gel digests of the F‐ATP synthase OSCP subunit to identify the sites of derivatization by DPC. Protein digests redissolved in 0.1% (v/v) formic acid and 3% (v/v) acetonitrile were analyzed by LC‐MS/MS with a 6520 Q‐TOF mass spectrometer (Agilent Technologies) coupled online with a 1200 series HPLC system through a Chip Cube Interface (Agilent Technologies). Samples were loaded onto a Polaris‐HR‐Chip 3C18 (enrichment column of 360 nl; separating column 75 μm × 150 mm; Polaris C18 180 Å, 3 μm; Agilent Technologies). Peptides were separated with a 5–50% gradient of solvent B over 15 min and 50–65% B for 3 min at a flow rate of 0.27 μl/min (solvent A: H20 with 0.1% formic acid; solvent B: acetonitrile with 0.1% formic acid). LC‐MS/MS analyses were performed in a data‐dependent mode for protein identification and in a targeted mode to acquire MS/MS spectra of the tryptic peptide 95–113 of OSCP and of the same peptide modified by DPC. Raw data files were converted into Mascot Generic Format files with MassHunter Qualitative Analysis Software (Agilent Technologies) for MASCOT search and manually analyzed using the same software. MS/MS data were searched using the MASCOT search engine (version 2.3.01, Matrix Science) against the Mammalia sequences of the Swiss‐Prot database (release 2013_04, 66234 sequences after taxonomy filter). The following parameters were used in the MASCOT search: trypsin specificity; maximum number of missed cleavages: 2; fixed modification: carbamidomethyl (Cys); variable modifications: oxidation (M), deamidated (NQ); peptide mass tolerance: ±10 ppm; fragment mass tolerance: ±0.05 Da; protein mass: unrestricted; mass values: monoisotopic. Two unique peptides with statistically significant scores (P < 0.05) were required for protein identification.
Altering His112 of OSCP in HEK293T cells
The CRISPR/Cas9 system was used to alter the specific codon in exon 5 of the human OSCP (hOSCP) gene specifying His112 to Gln or Tyr. This site was targeted by use of a guide RNA (gRNA; tgcaaggtacctctccgcgatgg) subcloned into the BbsI site of px330 (Addgene). Repair single‐stranded DNA (ssDNA) mediating His112 replacement by Gln was GATTTGCTTGCTGAAAATGGTCGATTAAGCAATACCCAAGGAGTCGTTTCTGCCTTTTCTACCATGATGAGTGTCTATCGCGGAGAGGTACCTTGCACAGTGACCTCTGCATCTGTAAGTAACGGGTTGTTGCTGCTGTGTTTGCCTTGATAT.
For altering His112 into Tyr, the gRNA listed above spans the V and H in the endogenous sequence, requiring change in the codon specifying V in the case of this substitution, using the following ssDNA: GATTTGCTTGCTGAAAATGGTCGATTAAGCAATACCCAAGGAGTCGTTTCTGCCTTTTCTACCATGATGAGTGTTCAACGCGGAGAGGTACCTTGCACAGTGACCTCTGCATCTGTAAGTAACGGGTTGTTGCTGCTGTGTTTGCCTTGATA.
In both cases, the underlined, bolded residues mediate amino acid changes. HEK293T cells were grown in DMEM + 10% FBS and transfected at 70% confluency in six‐well plates with 6 μl Lipofectamine 2000 with px330 hOSCP, 7 μg px330 hOSCP, 7 μg pAAV Syn‐GFP (Addgene), 20 μM Q or Y ssDNA. Following 3 days of growth, transfected cells were subjected to FAC sorting and single cells placed in individual wells of a 96‐well plate. Individual colonies were subsequently transferred to six‐well plates, DNA extracted and regions surrounding H112 sequenced to identify clones in which H112 remained or had been changed to Q or Y. Western blots of whole cell extracts demonstrate that expression of OSCP in each clone is unchanged. At least three clones containing H‐Q or H‐Y substitutions were subsequently analyzed.
Patch‐clamp analysis
Cells grown to 80% confluence from three flasks (150 ml each) were washed twice with phosphate‐buffered saline, detached using a scraper, and centrifuged for 5 min at 600 × g. The resulting pellet was resuspended in 5 ml of 250 mM sucrose, 10 mM Tris (pH 7.4), 20 μM EGTA. Then, cells were homogenized using a Teflon Potter and pelleted at 600 × g for 5 min. The resulting supernatant was centrifuged twice at 7,000 × g for 15 min, and the pellet containing intact mitochondria was resuspended in 100 μl of the above medium. Mitochondria were diluted (1:200) in 30 mM Tris–HCl (pH 7.3) and left on ice for 10 min. The suspension was then deposited in the patch‐clamp chamber and washed with the recording medium. Patch clamp was performed as previously described 61 using a solution of 150 mM KCl, 0.1 or 0.2 mM CaCl2, 10 mM Hepes pH 7.3 both in the pipette and in the bath. Acidification was obtained by addition of 100 mM HCl to the bath solution and mixing. Data were acquired and analyzed with the PClamp8.0 program set as described in 41.
Oxygen consumption rate
Oxygen consumption rate was measured using the XF24 Extracellular Flux Analyzer (Seahorse Bioscience) 62. Cells that had been grown in flasks were trypsinized and counted, and then, about 40,000 wild‐type cells per well and 50,000 OSCP H>Q and H>Y cells per well were seeded on appropriate 24‐well plates coated with 0.01% poly‐l‐lysine (Sigma). Cells were incubated at 37°C in a 5% CO2 humidified incubator for 24 h. Assay was initiated by replacing the growth medium with Seahorse medium (DMEM‐Sigma D5030—added with 25 mM glucose, 10 mM sodium pyruvate, and 2 mM glutamine) prewarmed at 37°C. Cells were incubated at 37°C for 30 min to allow temperature and pH equilibration. A titration with FCCP was performed in order to determine the optimal FCCP concentration (i.e., the concentration that stimulates respiration maximally), which was found to be 0.1 μM for all cell types. After an OCR baseline was established, 1 μg/ml oligomycin, 0.1 μM FCCP, 1 μM rotenone, and 1 μM antimycin A were sequentially added to each well.
Mitochondrial swelling
Changes of mitochondrial volume in mouse liver mitochondria and in permeabilized cells were followed in a 96‐well clear assay plate (Falcon 353072), final volume of 0.2 ml. Wild‐type, OSCP H112Q or H112Y cells were cultured for 48 h to reach 70–80% confluency, harvested by trypsinization, and permeabilized with 0.1 mM digitonin in KCl buffer (130 mM KCl, 10 mM MOPS/Tris, 0.1 mM EGTA/Tris, pH 7.4) as described 63. Cells were then washed twice to remove excess digitonin, suspended in 0.1 M KSCN, 5 mM MOPS, 10 μM EGTA adjusted to pH 7.4 or 6.5, and dispensed at 1 × 10⁶ cells/well. Absorbance was read for about 3 min at 540 nm to get the baseline value using a Multiskan EX (Thermo Scientific) plate reader. Then, 0.1 mM Ca2+ was added to induce mitochondrial swelling and the absorbance changes were followed for 30 min. When needed, the test wells contained 0.5 mM DPC or 2 μM CsA.
ATP hydrolysis assay
ATPase activity was measured in a 96‐well clear assay plate (Falcon 353072) in a final volume of 0.2 ml. Wild‐type, OSCP H112Q and H112Y cells permeabilized as in the preceding paragraph were suspended in 50 mM KCl, 50 mM Tris/HCl, 30 mM sucrose, 4 mM MgCl2, 2 mM EGTA adjusted to pH 7.4 or 6.5 and supplemented with 4 units/ml pyruvate kinase, 3 units/ml lactate dehydrogenase, 4 mM phosphoenolpyruvate, 2 mM ATP, 0.2 mM NADH, 10 μM alamethicin, 10 μM ouabain, and 10 μM sodium decavanadate. Cells were dispensed at 0.5 × 10⁶ cells/well, and absorbance was read for about 40 min at 340 nm. Inhibition of Mg2+‐ATPase activity by 0.1 mM resveratrol was 50 and 80% at pH 7.4 and 6.5, respectively. The enzyme activity of the ATP regenerating system was not different at pH 7.4 and 6.5 when tested with 5–15 μM ADP, which is the estimated concentration range during the hydrolysis assay based on the rate of oxidation of NADH at pH 7.4.
OSCP models and molecular dynamics
OSCP chain was modeled using the X‐ray structure (PDB id: 2WSS) solved by Walker and coworkers 42, which covers only part of the 190 residues of the chain, that is, residues F1 to Q146 and K169 to I 189. The structures reported by Rubinstein and coworkers 43, obtained at low resolution by cryo‐electron microscopy, entail the continuous fragment F1 to G167. The two structures cannot however be merged consistently because the helix in the fragment V147 to G167 of the X‐ray structure overlaps with the helix contained in the different fragment K169 to I189, moreover in opposite orientation. The model was thus obtained by merging the first 104 residues from the crystallographic structure with the remaining ones from the cryo‐electron microscopy structure. In order to provide limitations to the motions of the system in the absence of the other F‐ATP synthase chains, but nevertheless to probe conformational trends, the Cα carbons of residues 1–107 in the N‐terminal of OSCP were fixed and the trans‐membrane residues of subunit b were restrained to move only parallel to the membrane layer, so that the overall end‐to‐end distance of the stalk results strongly restrained. Molecular dynamics simulations (20 nS) for both the neutral (Nε protonated and Nδ protonated) and the positively charged forms of H112 were performed in implicit solvent (Amber99sb‐star‐ildn forcefield 64 with GBSA implicit solvent model 65).
Anoxia and lactate dehydrogenase release
HEK293T cells were seeded in 12‐well plates at a density of 105/well and incubated in 118 mM NaCl, 5 mM KCl, 1.2 mM KH2PO4, 1.2 mM MgSO4, 2 mM CaCl2, 25 mM MOPS pH 7.4 or 6.5 66. Anoxia was induced adding 20 mM 2‐deoxy‐d‐glucose (2‐DG) and by incubation in a BD GasPak EZ Anaerobe Gas‐generating Pouch System with an Indicator (BD Biosciences) at 37°C for a maximum of 72 h. As certified by the manufacturer, the BD GasPak EZ produces an atmosphere containing 10% carbon dioxide and 1% oxygen. The BD GasPak EZ and the cells were incubated at 37°C in a humidified atmosphere of 5% CO2. Instead for normoxic condition, HEK293T cells were incubated in the balance salt solution at pH 7.4 or 6.5 in a humidified atmosphere of 5% CO2 at 37°C for a maximum of 72 h.
Author contributions
PB and GL conceived the study, designed experiments, and wrote the manuscript; MA, MC, KJ, and SA designed and performed experiments on cells; BS performed mass spectroscopy determinations and wrote the relevant text; MA and MC performed biochemical experiments on mitochondria; FF designed and carried out the molecular modeling and wrote the relevant text; MF designed the experiments to generate OSCP mutants; FDL conceived the experiments on in situ anoxia; VG and VP designed and supervised experiments on mitochondria; IS designed and performed electrophysiological experiments and wrote the relevant text.
Conflict of interest
The authors declare that they have no conflict of interest.
Supporting information
Expanded View Figures PDF
Review Process File
Acknowledgements
This work was supported by grants from AIRC (IG17067 to P.B. and IG15544 to I.S.) and Fondation Leducq (16CVD04 to P.B., F.D.L., and M.F.).
EMBO Reports (2018) 19: 257–268
Contributor Information
Giovanna Lippe, Email: giovanna.lippe@uniud.it.
Paolo Bernardi, Email: bernardi@bio.unipd.it.
References
- 1. Bernardi P, Rasola A, Forte M, Lippe G (2015) The mitochondrial permeability transition pore: channel formation by F‐ATP synthase, integration in signal transduction, and role in pathophysiology. Physiol Rev 95: 1111–1155 [DOI] [PMC free article] [PubMed] [Google Scholar]
- 2. Raaflaub J (1953) Die schwellung isolierter leberzell mitochondrien und ihre physikalisch beeinfluβarkeit. Helv Physiol Pharmacol Acta 11: 142–156 [PubMed] [Google Scholar]
- 3. Chinopoulos C, Adam‐Vizi V (2010) Mitochondria as ATP consumers in cellular pathology. Biochem Biophys Acta 1802: 221–227 [DOI] [PubMed] [Google Scholar]
- 4. Pfeiffer DR, Kuo TH, Tchen TT (1976) Some effects of Ca2+, Mg2+, and Mn2+ on the ultrastructure, light‐scattering properties, and malic enzyme activity of adrenal cortex mitochondria. Arch Biochem Biophys 176: 556–563 [DOI] [PubMed] [Google Scholar]
- 5. Hunter DR, Haworth RA, Southard JH (1976) Relationship between configuration, function, and permeability in calcium‐treated mitochondria. J Biol Chem 251: 5069–5077 [PubMed] [Google Scholar]
- 6. Hunter DR, Haworth RA (1979) The Ca2+‐induced membrane transition in mitochondria. I. The protective mechanisms. Arch Biochem Biophys 195: 453–459 [DOI] [PubMed] [Google Scholar]
- 7. Haworth RA, Hunter DR (1979) The Ca2+‐induced membrane transition of rat liver mitochondria. II. Nature of the Ca2+ trigger site. Arch Biochem Biophys 195: 460–467 [DOI] [PubMed] [Google Scholar]
- 8. Hunter DR, Haworth RA (1979) The Ca2+‐induced membrane transition in mitochondria. III. Transitional Ca2+ release. Arch Biochem Biophys 195: 468–477 [DOI] [PubMed] [Google Scholar]
- 9. Kinnally KW, Campo ML, Tedeschi H (1989) Mitochondrial channel activity studied by patch‐clamping mitoplasts. J Bioenerg Biomembr 21: 497–506 [DOI] [PubMed] [Google Scholar]
- 10. Petronilli V, Szabó I, Zoratti M (1989) The inner mitochondrial membrane contains ion‐conducting channels similar to those found in bacteria. FEBS Lett 259: 137–143 [DOI] [PubMed] [Google Scholar]
- 11. Szabó I, Zoratti M (1991) The giant channel of the inner mitochondrial membrane is inhibited by cyclosporin A. J Biol Chem 266: 3376–3379 [PubMed] [Google Scholar]
- 12. Szabó I, Bernardi P, Zoratti M (1992) Modulation of the mitochondrial megachannel by divalent cations and protons. J Biol Chem 267: 2940–2946 [PubMed] [Google Scholar]
- 13. Fischer G, Wittmann‐Liebold B, Lang K, Kiefhaber T, Schmid FX (1989) Cyclophilin and peptidyl‐prolyl cis‐trans isomerase are probably identical proteins. Nature 337: 476–478 [DOI] [PubMed] [Google Scholar]
- 14. Takahashi N, Hayano T, Suzuki M (1989) Peptidyl‐prolyl cis‐trans isomerase is the cyclosporin A‐binding protein cyclophilin. Nature 337: 473–475 [DOI] [PubMed] [Google Scholar]
- 15. Connern CP, Halestrap AP (1994) Recruitment of mitochondrial cyclophilin to the mitochondrial inner membrane under conditions of oxidative stress that enhance the opening of a calcium‐sensitive non‐specific channel. Biochem J 302: 321–324 [DOI] [PMC free article] [PubMed] [Google Scholar]
- 16. Connern CP, Halestrap AP (1996) Chaotropic agents and increased matrix volume enhance binding of mitochondrial cyclophilin to the inner mitochondrial membrane and sensitize the mitochondrial permeability transition to [Ca2+]. Biochemistry 35: 8172–8180 [DOI] [PubMed] [Google Scholar]
- 17. Nicolli A, Basso E, Petronilli V, Wenger RM, Bernardi P (1996) Interactions of cyclophilin with the mitochondrial inner membrane and regulation of the permeability transition pore, a cyclosporin A‐sensitive channel. J Biol Chem 271: 2185–2192 [DOI] [PubMed] [Google Scholar]
- 18. Giorgio V, Bisetto E, Soriano ME, Dabbeni‐Sala F, Basso E, Petronilli V, Forte MA, Bernardi P, Lippe G (2009) Cyclophilin D modulates mitochondrial FoF1‐ATP synthase by interacting with the lateral stalk of the complex. J Biol Chem 284: 33982–33988 [DOI] [PMC free article] [PubMed] [Google Scholar]
- 19. Davies KM, Strauss M, Daum B, Kief JH, Osiewacz HD, Rycovska A, Zickermann V, Kühlbrandt W (2011) Macromolecular organization of ATP synthase and complex I in whole mitochondria. Proc Natl Acad Sci USA 108: 14121–14126 [DOI] [PMC free article] [PubMed] [Google Scholar]
- 20. Baker LA, Watt IN, Runswick MJ, Walker JE, Rubinstein JL (2012) Arrangement of subunits in intact mammalian mitochondrial ATP synthase determined by cryo‐EM. Proc Natl Acad Sci USA 109: 11675–11680 [DOI] [PMC free article] [PubMed] [Google Scholar]
- 21. Hahn A, Parey K, Bublitz M, Mills DJ, Zickermann V, Vonck J, Kuhlbrandt W, Meier T (2016) Structure of a complete ATP synthase dimer reveals the molecular basis of inner mitochondrial membrane morphology. Mol Cell 63: 445–456 [DOI] [PMC free article] [PubMed] [Google Scholar]
- 22. Giorgio V, von Stockum S, Antoniel M, Fabbro A, Fogolari F, Forte M, Glick GD, Petronilli V, Zoratti M, Szabó I et al (2013) Dimers of mitochondrial ATP synthase form the permeability transition pore. Proc Natl Acad Sci USA 110: 5887–5892 [DOI] [PMC free article] [PubMed] [Google Scholar]
- 23. Johnson KM, Chen X, Boitano A, Swenson L, Opipari AW Jr, Glick GD (2005) Identification and validation of the mitochondrial F1F0‐ATPase as the molecular target of the immunomodulatory benzodiazepine Bz‐423. Chem Biol 12: 485–496 [DOI] [PubMed] [Google Scholar]
- 24. Carraro M, Giorgio V, Šileikyte J, Sartori G, Forte M, Lippe G, Zoratti M, Szabó I, Bernardi P (2014) Channel formation by Yeast F‐ATP synthase and the role of dimerization in the mitochondrial permeability transition. J Biol Chem 289: 15980–15985 [DOI] [PMC free article] [PubMed] [Google Scholar]
- 25. Alavian KN, Beutner G, Lazrove E, Sacchetti S, Park HA, Licznerski P, Li H, Nabili P, Hockensmith K, Graham M et al (2014) An uncoupling channel within the c‐subunit ring of the F1FO ATP synthase is the mitochondrial permeability transition pore. Proc Natl Acad Sci USA 111: 10580–10585 [DOI] [PMC free article] [PubMed] [Google Scholar]
- 26. von Stockum S, Giorgio V, Trevisan E, Lippe G, Glick GD, Forte MA, Da‐Rè C, Checchetto V, Mazzotta G, Costa R et al (2015) F‐ATPase of D. melanogaster forms 53 picosiemen (53‐pS) channels responsible for mitochondrial Ca2+‐induced Ca2+ release. J Biol Chem 290: 4537–4544 [DOI] [PMC free article] [PubMed] [Google Scholar]
- 27. Bernardi P, Vassanelli S, Veronese P, Colonna R, Szabó I, Zoratti M (1992) Modulation of the mitochondrial permeability transition pore. Effect of protons and divalent cations. J Biol Chem 267: 2934–2939 [PubMed] [Google Scholar]
- 28. Nicolli A, Petronilli V, Bernardi P (1993) Modulation of the mitochondrial cyclosporin A‐sensitive permeability transition pore by matrix pH. Evidence that the pore open‐closed probability is regulated by reversible histidine protonation. Biochemistry 32: 4461–4465 [DOI] [PubMed] [Google Scholar]
- 29. Bernardi P (1992) Modulation of the mitochondrial cyclosporin A‐sensitive permeability transition pore by the proton electrochemical gradient. Evidence that the pore can be opened by membrane depolarization. J Biol Chem 267: 8834–8839 [PubMed] [Google Scholar]
- 30. Salet C, Moreno G, Ricchelli F, Bernardi P (1997) Singlet oxygen produced by photodynamic action causes inactivation of the mitochondrial permeability transition pore. J Biol Chem 272: 21938–21943 [DOI] [PubMed] [Google Scholar]
- 31. Bason JV, Montgomery MG, Leslie AG, Walker JE (2014) Pathway of binding of the intrinsically disordered mitochondrial inhibitor protein to F1‐ATPase. Proc Natl Acad Sci USA 111: 11305–11310 [DOI] [PMC free article] [PubMed] [Google Scholar]
- 32. Foti S, Saletti R (1991) Sequencing of peptides containing alanine, asparagine, histidine, isoleucine and tryptophan by partial methanolysis and fast atom bombardment mass spectrometry. Biol Mass Spectrom 20: 345–350 [DOI] [PubMed] [Google Scholar]
- 33. Hnízda A, Santrucek J, Sanda M, Strohalm M, Kodícek M (2008) Reactivity of histidine and lysine side‐chains with diethylpyrocarbonate – a method to identify surface exposed residues in proteins. J Biochem Biophys Methods 70: 1091–1097 [DOI] [PubMed] [Google Scholar]
- 34. Selwyn MJ, Dawson AP, Dunnett SJ (1970) Calcium transport in mitochondria. FEBS Lett 10: 1–5 [DOI] [PubMed] [Google Scholar]
- 35. Basso E, Fante L, Fowlkes J, Petronilli V, Forte MA, Bernardi P (2005) Properties of the permeability transition pore in mitochondria devoid of cyclophilin D. J Biol Chem 280: 18558–18561 [DOI] [PubMed] [Google Scholar]
- 36. Horstman LL, Racker E (1970) Partial resolution of the enzyme catalyzing oxidative phosphorylation. XXII. Interaction between mitochondrial adenosine triphosphatase inhibitor and mitochondrial adenosine triphosphatase. J Biol Chem 245: 1336–1344 [PubMed] [Google Scholar]
- 37. Herman B, Gores GJ, Nieminen AL, Kawanishi T, Harman A, Lemasters JJ (1990) Calcium and pH in anoxic and toxic injury. Crit Rev Toxicol 21: 127–148 [DOI] [PubMed] [Google Scholar]
- 38. Lemasters JJ (1999) The mitochondrial permeability transition and the calcium, oxygen and pH paradoxes: one paradox after another. Cardiovasc Res 44: 470–473 [DOI] [PubMed] [Google Scholar]
- 39. Szabó I, Zoratti M (2014) Mitochondrial channels: ion fluxes and more. Physiol Rev 94: 519–608 [DOI] [PubMed] [Google Scholar]
- 40. Campello S, De Marchi U, Szabó I, Tombola F, Martinou JC, Zoratti M (2005) The properties of the mitochondrial megachannel in mitoplasts from human colon carcinoma cells are not influenced by Bax. FEBS Lett 579: 3695–3700 [DOI] [PubMed] [Google Scholar]
- 41. De Marchi U, Basso E, Szabó I, Zoratti M (2006) Electrophysiological characterization of the Cyclophilin D‐deleted mitochondrial permeability transition pore. Mol Membr Biol 23: 521–530 [DOI] [PubMed] [Google Scholar]
- 42. Rees DM, Montgomery MG, Leslie AG, Walker JE (2012) Structural evidence of a new catalytic intermediate in the pathway of ATP hydrolysis by F1‐ATPase from bovine heart mitochondria. Proc Natl Acad Sci USA 109: 11139–11143 [DOI] [PMC free article] [PubMed] [Google Scholar]
- 43. Zhou A, Rohou A, Schep DG, Bason JV, Montgomery MG, Walker JE, Grigorieff N, Rubinstein JL (2015) Structure and conformational states of the bovine mitochondrial ATP synthase by cryo‐EM. Elife 4: e10180 [DOI] [PMC free article] [PubMed] [Google Scholar]
- 44. Wang G, Dunbrack RL Jr (2003) PISCES: a protein sequence culling server. Bioinformatics 19: 1589–1591 [DOI] [PubMed] [Google Scholar]
- 45. Giorgio V, Burchell V, Schiavone M, Bassot C, Minervini G, Petronilli V, Argenton F, Forte M, Tosatto S, Lippe G et al (2017) Ca2+ binding to F‐ATP synthase β subunit triggers the mitochondrial permeability transition. EMBO Rep 18: 1065–1076 [DOI] [PMC free article] [PubMed] [Google Scholar]
- 46. Rasola A, Sciacovelli M, Chiara F, Pantic B, Brusilow WS, Bernardi P (2010) Activation of mitochondrial ERK protects cancer cells from death through inhibition of the permeability transition. Proc Natl Acad Sci USA 107: 726–731 [DOI] [PMC free article] [PubMed] [Google Scholar]
- 47. Nguyen TT, Stevens MV, Kohr M, Steenbergen C, Sack MN, Murphy E (2011) Cysteine 203 of cyclophilin D is critical for cyclophilin D activation of the mitochondrial permeability transition pore. J Biol Chem 286: 40184–40192 [DOI] [PMC free article] [PubMed] [Google Scholar]
- 48. Antoniel M, Giorgio V, Fogolari F, Glick GD, Bernardi P, Lippe G (2014) The oligomycin‐sensitivity conferring protein of mitochondrial ATP synthase: emerging new roles in mitochondrial pathophysiology. Int J Mol Sci 15: 7513–7536 [DOI] [PMC free article] [PubMed] [Google Scholar]
- 49. Nguyen TT, Wong R, Menazza S, Sun J, Chen Y, Wang G, Gucek M, Steenbergen C, Sack MN, Murphy E (2013) Cyclophilin D modulates mitochondrial acetylome. Circ Res 113: 1308–1319 [DOI] [PMC free article] [PubMed] [Google Scholar]
- 50. Lee CF, Chavez JD, Garcia‐Menendez L, Choi YS, Roe ND, Chiao YA, Edgar JS, Goo YA, Goodlett DR, Bruce JE et al (2016) Normalization of NAD+ redox balance as a therapy for heart failure. Circulation 134: 883–894 [DOI] [PMC free article] [PubMed] [Google Scholar]
- 51. Yang W, Nagasawa K, Münch C, Xu Y, Satterstrom K, Jeong S, Hayes SD, Jedrychowski MP, Sejal Vyas F, Zaganjor E et al (2016) Mitochondrial sirtuin network reveals dynamic SIRT3‐dependent deacetylation in response to membrane depolarization. Cell 167: 985–1000 [DOI] [PMC free article] [PubMed] [Google Scholar]
- 52. Bonora M, Bononi A, De Marchi E, Giorgi C, Lebiedzinska M, Marchi S, Patergnani S, Rimessi A, Suski JM, Wojtala A et al (2013) Role of the c subunit of the Fo ATP synthase in mitochondrial permeability transition. Cell Cycle 12: 674–683 [DOI] [PMC free article] [PubMed] [Google Scholar]
- 53. Zhou W, Marinelli F, Nief C, Faraldo‐Gómez JD (2017) Atomistic simulations indicate the c‐subunit ring of the F1Fo ATP synthase is not the mitochondrial permeability transition pore. Elife 6: e23781 [DOI] [PMC free article] [PubMed] [Google Scholar]
- 54. He J, Ford HC, Carroll J, Ding S, Fearnley IM, Walker JE (2017) Persistence of the mitochondrial permeability transition in the absence of subunit c of human ATP synthase. Proc Natl Acad Sci USA 114: 3409–3414 [DOI] [PMC free article] [PubMed] [Google Scholar]
- 55. He J, Carroll J, Ding S, Fearnley IM, Walker JE (2017) Permeability transition in human mitochondria persists in the absence of peripheral stalk subunits of ATP synthase. Proc Natl Acad Sci USA 114: 9086–9091 [DOI] [PMC free article] [PubMed] [Google Scholar]
- 56. Costantini P, Petronilli V, Colonna R, Bernardi P (1995) On the effects of paraquat on isolated mitochondria. Evidence that paraquat causes opening of the cyclosporin A‐sensitive permeability transition pore synergistically with nitric oxide. Toxicology 99: 77–88 [DOI] [PubMed] [Google Scholar]
- 57. Frezza C, Cipolat S, Scorrano L (2007) Organelle isolation: functional mitochondria from mouse liver, muscle and cultured fibroblasts. Nat Protoc 2: 287–295 [DOI] [PubMed] [Google Scholar]
- 58. Lee C, Ernster L (1968) Studies of the energy‐transfer system of submitochondrial particles. 2. Effects of oligomycin and aurovertin. Eur J Biochem 3: 391–400 [DOI] [PubMed] [Google Scholar]
- 59. Wittig I, Braun HP, Schägger H (2006) Blue native PAGE. Nat Protoc 1: 418–428 [DOI] [PubMed] [Google Scholar]
- 60. Shevchenko A, Wilm M, Vorm O, Mann M (1996) Mass spectrometric sequencing of proteins silver‐stained polyacrylamide gels. Anal Chem 68: 850–858 [DOI] [PubMed] [Google Scholar]
- 61. Szabó I, Bock J, Jekle A, Soddemann M, Adams C, Lang F, Zoratti M, Gulbins E (2005) A novel potassium channel in lymphocyte mitochondria. J Biol Chem 280: 12790–12798 [DOI] [PubMed] [Google Scholar]
- 62. Wu M, Neilson A, Swift AL, Moran R, Tamagnine J, Parslow D, Armistead S, Lemire K, Orrell J, Teich J et al (2007) Multiparameter metabolic analysis reveals a close link between attenuated mitochondrial bioenergetic function and enhanced glycolysis dependency in human tumor cells. Am J Physiol Cell Physiol 292: C125–C136 [DOI] [PubMed] [Google Scholar]
- 63. Roy S, Šileikyte J, Schiavone M, Neuenswander B, Argenton F, Aubé J, Hedrick MP, Chung TDY, Forte MA, Bernardi P et al (2015) Discovery, synthesis, and optimization of diarylisoxazole‐3‐carboxamides as potent inhibitors of the mitochondrial permeability transition pore. ChemMedChem 10: 1655–1671 [DOI] [PMC free article] [PubMed] [Google Scholar]
- 64. Lindorff‐Larsen K, Piana S, Palmo K, Maragakis P, Klepeis JL, Dror RO, Shaw DE (2010) Improved side‐chain torsion potentials for the Amber ff99SB protein force field. Proteins 78: 1950–1958 [DOI] [PMC free article] [PubMed] [Google Scholar]
- 65. Onufriev A, Bashford D, Case DA (2004) Exploring protein native states and large‐scale conformational changes with a modified generalized born model. Proteins 55: 383–394 [DOI] [PubMed] [Google Scholar]
- 66. Bond JM, Herman B, Lemasters JJ (1991) Protection by acidotic pH against anoxia/reoxygenation injury to rat neonatal cardiac myocytes. Biochem Biophys Res Comm 179: 798–803 [DOI] [PubMed] [Google Scholar]
- 67. Waterhouse AM, Procter JB, Martin DM, Clamp M, Barton GJ (2009) Jalview Version 2–a multiple sequence alignment editor and analysis workbench. Bioinformatics 25: 1189–1191 [DOI] [PMC free article] [PubMed] [Google Scholar]
Associated Data
This section collects any data citations, data availability statements, or supplementary materials included in this article.
Supplementary Materials
Expanded View Figures PDF
Review Process File