

Abstract
The acetyltransferase TIP60 is regulated by phosphorylation, and we have previously shown that phosphorylation of TIP60 on S86 by GSK‐3 promotes p53‐mediated induction of the BCL‐2 protein PUMA. TIP60 phosphorylation by GSK‐3 requires a priming phosphorylation on S90, and here, we identify CDK9 as a TIP60S90 kinase. We demonstrate that a phosphorylation‐deficient mutant, TIP60S90A, exhibits reduced interaction with chromatin, histone 3 and RNA Pol II, while its association with the TIP60 complex subunit EPC1 is not affected. Consistently, we find a diminished association of TIP60S90A with the MYC gene. We show that cells expressing TIP60S90A, but also TIP60S86A, which retains S90 phosphorylation, exhibit reduced histone 4 acetylation and proliferation. Thus, our data indicate that, during transcription, phosphorylation of TIP60 at two sites has different regulatory effects on TIP60, whereby S90 phosphorylation controls association with the transcription machinery, and S86 phosphorylation is regulating TIP60 HAT activity.
Keywords: apoptosis, CDK9, chromatin, TIP60, transcription
Subject Categories: Chromatin, Epigenetics, Genomics & Functional Genomics; Post-translational Modifications, Proteolysis & Proteomics; Transcription
Introduction
The acetyltransferase TIP60 provides the KAT (lysine acetyltransferase) activity of the TIP60 complex (NuA4 complex in yeast), which is conserved from yeast to human. TIP60 has multiple roles, not only for the regulation of transcription, but also in the sensing and repair of DNA damage 1. Histone 2A (H2A) and histone 4 (H4) have been shown to be the major substrates of the NuA4 complex 2, while TIP60 acetylates also non‐histone substrates such as p53 3, 4. TIP60 contains a chromodomain, by which it was demonstrated to recognize methylated histone 3 (H3), and binding to the chromodomain of TIP60 was reported to promote its activation 5. TIP60 is controlled by phosphorylation: it was shown that the KAT activity of TIP60 depends on the phosphorylation of the sites serine 86 (S86) and serine 90 (S90) 6. More recently, phosphorylation of TIP60Y44 upon chromatin alteration was shown to be specifically required for the acetyltransferase activity of TIP60 targeting ATM 7. In addition, p38‐mediated phosphorylation of TIP60T158 was shown to play a role for oncogene‐induced senescence 8.
We and others have previously demonstrated that TIP60 is critically involved in the transcriptional induction of the BCL‐2 family member PUMA by p53 3, 4, 9. We found that the co‐activator function of TIP60 for the transcriptional induction of PUMA required the phosphorylation of TIP60 at the site S86. This is mediated by glycogen synthase kinase‐3 (GSK‐3), a kinase inactivated by PI3K/AKT signalling 9. In order to phosphorylate its substrates, GSK‐3 requires a pre‐existing priming phosphorylation at the +4 position of the GSK‐3 phosphorylation site, which is S90 in case of TIP60. Indeed, we found that TIP60S86 phosphorylation was absent with S90A mutant 9, which raised the question for the identity of the TIP60S90 kinase.
The positive transcription elongation factor b (P‐TEFb), consisting of the kinase CDK9 and cyclinT1, is instrumental for the regulation of transcription, namely for the release of RNA polymerase II (Pol II) from promoter‐proximal pausing, thereby allowing transcriptional elongation. CDK9 is expressed as two isoforms, due to two different transcription start sites regulated by different promoters 10. P‐TEFb is recruited by the BET (bromodomain and extra‐terminal) family protein BRD4 to the promoters of the respective target genes 11, 12. By phosphorylating the pause‐inducing factors, DRB sensitivity‐inducing factor (DSIF) and negative elongation factor (NELF), as well as serine 2 (S2) in the C‐terminal domain of RNA Pol II, CDK9 promotes the release of RNA Pol II into the gene and productive transcription 13, 14. Interestingly, TIP60 was found to be involved in transcriptional elongation and to have a similar genomewide distribution as RNA Pol II 15.
In this study, we found that CDK9 phosphorylates TIP60S90 and that this phosphorylation regulates the affinity of TIP60 to histone 3 and RNA Pol II. However, the KAT activity of TIP60 was mainly regulated by phosphorylation on S86, thereby also depending on phosphorylation of S90.
Results and Discussion
Serine 90 of TIP60 is phosphorylated by CDK9
TIP60 was shown to be phosphorylated on S86 and S90 6. These two sites are present in all TIP60 splice variants and conserved from Drosophila to human (Fig 1A). We have previously demonstrated that TIP60S86 is phosphorylated by GSK‐3. In general, GSK‐3‐mediated phosphorylation requires a priming phosphorylation on the +4 site of the respective substrate, and we found the same requirement for GSK‐3‐mediated TIP60 phosphorylation 9, 16. Thus, we aimed at identifying the kinase mediating the phosphorylation of TIP60S90.
Figure 1. CDK9 phosphorylates TIP60.
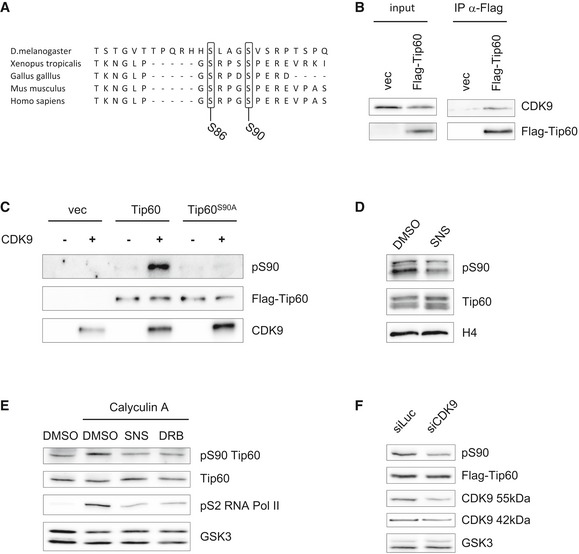
- Alignment of TIP60 sequences from different species around S90 and S86.
- U2OS cells stably expressing FLAG‐TIP60 or empty vector (vec) were subjected to FLAG immunoprecipitation from nuclear lysates and analysed by Western blotting.
- HEK293T cells were transfected with pcDNA3.1 encoding FLAG‐TIP60WT, FLAG‐TIP60S90A or empty vector (vec). The samples were subjected to FLAG affinity purification, dephosphorylated with shrimp alkaline phosphatase (rSAP) and incubated as indicated with CDK9/cyclinT1 in the presence of ATP. Phosphorylation of TIP60 was analysed by a phosphoS90‐specific TIP60 antibody, and the blot was further probed with antibodies specific for FLAG and CDK9.
- p53−/− hRasG12V MEF were treated with DMSO or 1 μM SNS‐032 (SNS) for 1 h. Nuclear lysates were analysed by Western blotting.
- p53−/− hRasG12V MEF were treated with DMSO, 1 μM SNS‐032 (SNS) or 50 μM DRB followed by addition of 100 nM Calyculin A as indicated. Nuclear lysates were analysed by Western blotting.
- U2OS cells stably expressing FLAG‐TIP60WT were transfected with a pool of four different CDK9‐targeting siRNAs or a control siRNA targeting luciferase. Nuclear lysates were analysed by Western blotting.
Source data are available online for this figure.
The TIP60 complex member TRRAP has been reported to interact with phosphorylated RNA Pol II, and ChIP‐seq analysis had revealed that TIP60 and RNA Pol II exhibit a very similar genomewide distribution profile 15. CDK9, providing the kinase activity of P‐TEFb, was shown to release RNA Pol II from promoter‐proximal pausing. This is mediated by CDK9‐mediated phosphorylation of the pause‐inducing factors NELF and DSIF, as well as RNA Pol II itself at S2, allowing productive transcription 17, 18, 19. Thus, as TIP60 was shown to be implicated in transcriptional elongation 15, which is induced by CDK9, we suspected CDK9 to be the candidate TIP60S90 kinase in the context of RNA Pol II regulation. Supporting this hypothesis, TIP60S90 has a Proline in the +1 position, which is the minimal consensus recognition site for CDKs 20. We first tested whether TIP60 and CDK9 interact. We expressed FLAG‐TIP60 in U2OS cells and detected CDK9 in the FLAG immunoprecipitate, indicating that TIP60 and CDK9 associate with each other (Figs 1B and EV1A). To test whether CDK9 is a candidate TIP60S90 kinase, we expressed FLAG‐TIP60WT or a FLAG‐TIP60S90A mutant in HEK293T cells and subjected the affinity‐purified proteins to a kinase assay in vitro with recombinant CDK9/CycT1. Using an antibody specific for S90‐phosphorylated TIP60 we had generated (Fig EV1B), we detected, in the presence of CDK9, a strong pS90 signal for FLAG‐TIP60, which was absent with the FLAG‐TIP60S90A mutant (Fig 1C). Next, we investigated the phosphorylation of endogenous TIP60 in cells, which required cells with a relatively high endogenous level of TIP60. MDM2 was shown to target TIP60 for degradation 21 and this E3 ligase is not induced in p53−/− cells. In addition, TIP60 was also shown to be targeted by p300/CBP‐associated E4‐type ubiquitin ligase activity 22. Ras‐transduced cells, which were shown to exhibit a low level of p300/CBP, had high levels of TIP60 23. Consistent with these findings, we observed that p53−/− MEF, we had generated, express the elevated levels of TIP60 after transformation with RasG12V (Fig EV1C). We treated p53−/− RasG12V MEF with the CDK9‐inhibitory molecule SNS‐032, which resulted in a decreased signal with the pS90TIP60‐specific antibody, associated with a band shift of TIP60, suggesting that CDK9 is the TIP60S90 kinase (Fig 1D). Interestingly, the phospho‐specific band reappeared at the 3‐h time point, possibly indicating that another kinase, which is not sensitive to SNS‐032, compensates for CDK9 (Fig EV1D). In a different approach, we treated the cells with the phosphatase inhibitor Calyculin A, which resulted in an elevated signal for pS90TIP60. However, the increased pS90 signal upon phosphatase inhibition was reduced upon concomitant treatment with the established pharmacological CDK9 inhibitors SNS‐032 or DRB, further suggesting that TIP60S90 is phosphorylated by CDK9 (Figs 1E and EV1E). To corroborate these results, we transfected U2OS and HEK293 cells, stably expressing TIP60, with siRNA targeting CDK9. We observed that the reduction in the pS90 signal correlated well with the decrease in the expression of both CDK9 isoforms upon siRNA‐mediated knock‐down (Figs 1F, and EV1F and G). Together, these experiments show that CDK9 phosphorylates S90 of TIP60.
Figure EV1. CDK9 phosphorylates TIP60.
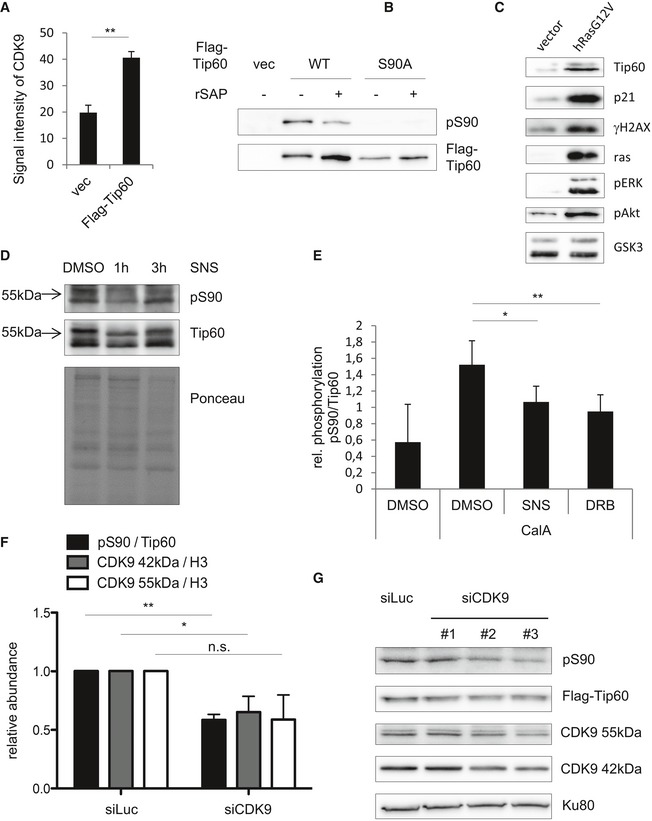
- U2OS cells stably expressing FLAG‐TIP60 or empty vector (vec) were subjected to FLAG immunoprecipitation from nuclear lysates and analysed by Western blotting, and the CDK9 signals were quantified. The graphs and error bars represent mean and standard deviation of three individual experiments [two‐tailed Student's t‐test, P = 0.00602 (**P ≤ 0.01)].
- FLAG‐TIP60WT and FLAG‐TIP60S90A were purified from U2OS cells and treated with rSAP for 30 min at 37°C as indicated in order to dephosphorylate TIP60. The blot was probed with antibodies specific for phosphoS90TIP60 and FLAG.
- Lysates of p53−/− MEF, transduced with hRasG12V or empty vector, were analysed by Western blotting and probed with antibodies specific for TIP60, p21, γH2AX, Ras, phospho‐ERK, phospho‐AKT and GSK‐3.
- p53−/− hRasG12V MEF were treated with the solvent DMSO or 1 μM SNS‐032 (SNS) for 1 or 3 h. Nuclear lysates were analysed by Western blotting. The blot was probed with antibodies specific for phosphoS90TIP60 and total TIP60. Equal loading was controlled by Ponceau staining.
- p53−/− hRasG12V MEF were treated with the solvent DMSO, 1 μM SNS‐032 (SNS) or 50 μM DRB followed by 100 nM Calyculin A as indicated. Nuclear lysates were analysed by Western blotting. The graphs and error bars represent mean and standard deviation of five individual experiments [one‐way ANOVA, Fisher's LSD test, CalA + DMSO vs. CalA + SNS P = 0.0324, CalA + DMSO vs. CalA + DRB P = 0.0096 (*P ≤ 0.05; **P ≤ 0.01)].
- U2OS cells stably expressing FLAG‐TIP60WT were transfected with a pool of four different CDK9‐targeting siRNAs (Dharmacon) or a control siRNA targeting luciferase (Dharmacon). Nuclear lysates were analysed by Western blotting and the blots were quantified. The graphs and error bars represent mean and standard deviation of three individual experiments [two‐tailed Student's t‐test, pS90/TIP60 P = 0.0072, CDK9 42 kDa/H3 P = 0.0461, CDK9 55 kDa/H3 P = 0.0758 (**P ≤ 0.01;*P ≤ 0.05; n.s. not significant, P > 0.05)].
- HEK293 cells stably expressing FLAG‐TIP60WT were transfected with three different CDK9‐targeting siRNAs or a control siRNA targeting luciferase. Nuclear lysates were analysed by Western blotting. The blot was probed with antibodies specific for KU80, CDK9, TIP60 and phosphoS90TIP60.
Source data are available online for this figure.
TIP60 S90 phosphorylation regulates TIP60 affinity to chromatin
It was previously shown that phosphorylation of TIP60 at S86 and S90 regulates its histone acetyltransferase activity in vitro 6. We investigated the possibility that S86/S90 phosphorylation does not only regulate the enzyme activity itself, but the interaction of TIP60 with chromatin and histones. To address this question, we employed a protocol to separate the nucleus into nucleoplasm and chromatin fractions (Fig EV2A). U2OS cells were infected with retrovirus encoding wild‐type TIP60, the phosphorylation‐deficient TIP60S86A and the TIP60S90A mutant, which were expressed at comparable levels (Fig EV2B). Strikingly, we found an almost complete absence of TIP60S90A, but not wild‐type TIP60 or TIP60S86A, from the chromatin fraction, and a corresponding enrichment of TIP60S90A in the nucleoplasm (Fig 2A and B). Similar results were obtained with Ba/F3 cells expressing either wild‐type TIP60 or the phosphorylation‐deficient mutants TIP60S86A or TIP60S90A (Fig EV2C). We found that the phosphorylation‐deficient mutant TIP60S90A resembled the distribution of different TIP60 chromodomain mutants, all being absent from the chromatin fraction (Fig 2C). Thus, it is possible that the phosphorylation of S90 influences the chromodomain of TIP60 and its affinity to methylated histones. However, we observed that, conversely, TIP60 chromodomain mutants were not affected in their ability to be phosphorylated on S90 (Fig EV2D). Supporting the hypothesis that the charge provided by a phosphorylation of S90 enhances the affinity of TIP60 for chromatin, the phosphomimetic mutants TIP60S90E and TIP60S90D were found to largely retain their affinity for chromatin (Fig 2D). We next treated U2OS cells, expressing TIP60WT or TIP60S90A with SNS‐032 in order to inhibit CDK9 and analysed the distribution of TIP60 between nucleoplasm and chromatin fraction. Upon CDK9 inhibition, the amount of wild‐type TIP60 on the chromatin was reduced (Fig 2E). Consistent with the data shown before, inhibition of CDK9 with SNS‐032 reduced the phosphorylation of TIP60S90 in the nucleoplasm and the presence of TIP60 on chromatin (Fig EV2E).
Figure EV2. TIP60 S90 phosphorylation regulates its affinity to chromatin.
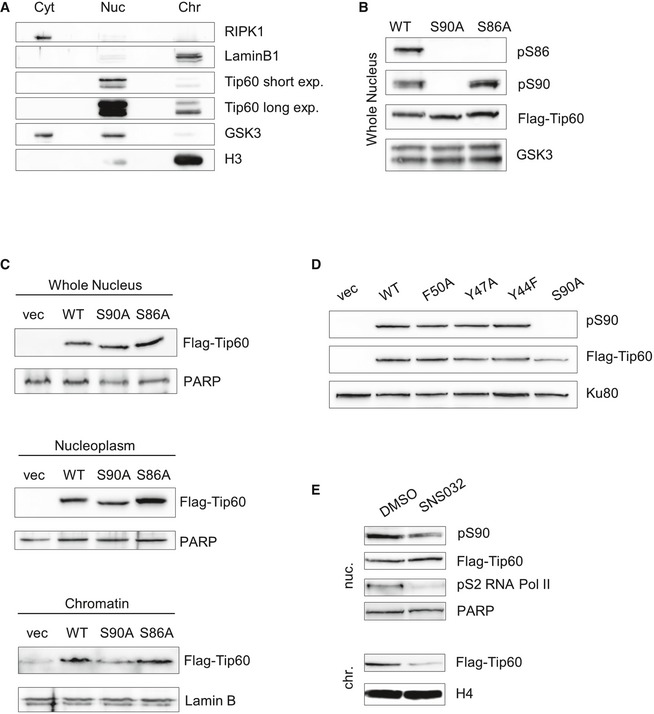
- U2OS cells were fractionated into cytosol (cyt), nucleoplasm (nuc.) and chromatin (chr.) fractions and analysed by Western blotting. RIPK1, Lamin B1, TIP60, GSK3 and H3 were detected by probing with specific antibodies.
- Nuclear extracts of U2OS cells stably expressing FLAG‐TIP60WT, FLAG‐TIP60S90A or FLAG‐TIP60S86A were analysed by Western blotting and probed with antibodies specific for phosphoS86TIP60, phosphoS90TIP60, FLAG and GSK‐3.
- Localization of TIP60 was analysed employing Ba/F3 cells stably expressing FLAG‐TIP60WT, FLAG‐TIP60S90A or FLAG‐TIP60S86A or the empty vector (vec). Whole nucleus, nucleoplasm and chromatin fraction were subjected to Western blot analysis. The blots were probed with antibodies specific for FLAG, Lamin B1 and PARP.
- Nuclear extracts of U2OS cells stably expressing FLAG‐TIP60WT, FLAG‐TIP60S90A or the chromodomain mutants FLAG‐TIP60F50A, FLAG‐TIP60Y47A, FLAG‐TIP60Y44F or the empty vector (vec) were analysed by Western blotting and probed for phosphoS90TIP60, FLAG and KU80.
- U2OS cells stably expressing FLAG‐TIP60S86A were treated with 2 μM SNS‐032 (SNS) for 3 h. Nucleoplasm and chromatin fraction were subjected to Western blot analysis. The blot was probed for phosphoS90TIP60, FLAG, PARP, phosphoS2RNAPol II and H4.
Source data are available online for this figure.
Figure 2. TIP60 S90 phosphorylation regulates its affinity to chromatin.
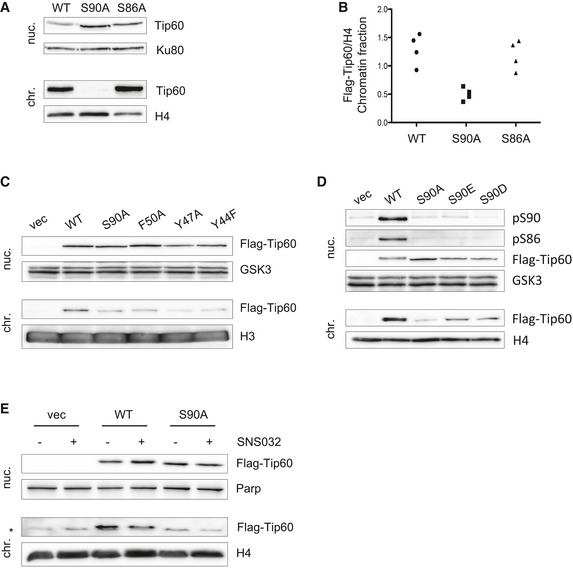
- Localization of TIP60 was analysed employing U2OS cells stably expressing FLAG‐TIP60WT, FLAG‐TIP60S90A or FLAG‐TIP60S86A. Nucleoplasm (nuc.) and chromatin (chr.) fractions were generated and were subjected to Western blot analysis.
- The experiment as described in (A) was repeated twice with U2OS cells and twice with Ba/F3 cells, and the blots were quantified. Each dot (n = 4) represents the ration of FLAG‐TIP60 to H4 in the chromatin fraction of altogether four individual experiments as shown in (A).
- Nuclear extracts of U2OS cells stably expressing FLAG‐tagged TIP60WT or TIP60S90A, or FLAG‐tagged chromodomain mutants TIP60F50A, TIP60Y47A, TIP60Y44F or the empty vector (vec) were subjected to fractionation into nucleoplasm (nuc.) and chromatin (chr.) fraction. Both fractions were analysed by Western blotting.
- Nuclear extracts of U2OS cells stably expressing FLAG‐tagged TIP60WT, TIP60S90A, TIP60S90E, TIP60S90D or the empty vector (vec) were subjected to fractionation into nucleoplasm (nuc.) and chromatin (chr.) fraction. Both fractions were analysed by Western blotting.
- U2OS cells stably expressing FLAG‐tagged TIP60WT, TIP60S90A or empty vector (vec) were treated with 2 μM SNS‐032 (SNS) for 3 h as indicated. The nucleus was fractionated into nucleoplasm and chromatin. Both fractions were analysed by Western blotting.
Source data are available online for this figure.
TIP60S90 phosphorylation affects TIP60 binding to H3 and RNA Pol II
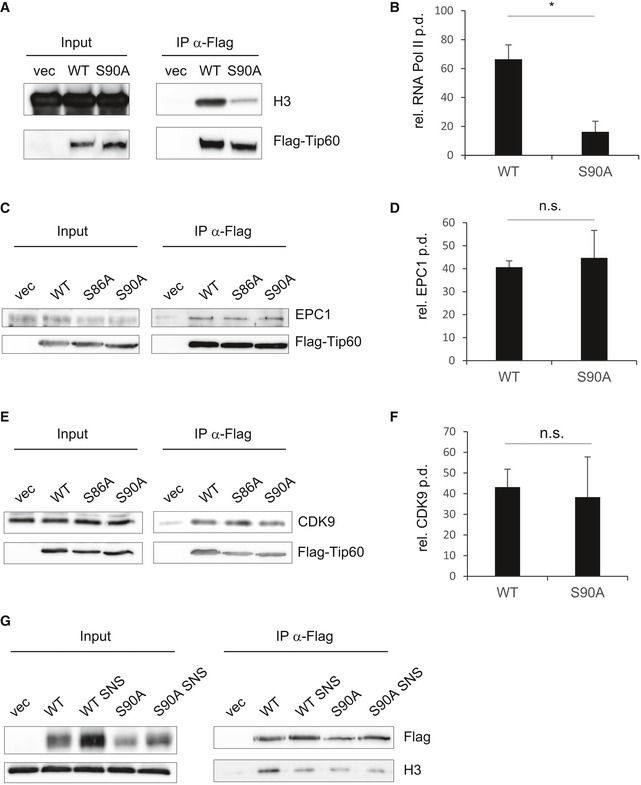
TIP60 has been shown to interact with methylated H3 in the context of DNA damage, via its chromodomain 5. Consistent with other studies 24, 25, we found TIP60 associated with H3 in healthy cells as well. To explore whether this interaction might be influenced by TIP60S90 phosphorylation, we immunoprecipitated FLAG‐tagged TIP60WT and the phosphorylation‐deficient mutants TIP60S86A or TIP60S90A, which were stably expressed in U2OS cells, and observed that the interaction of H3 and TIP60 was substantially reduced with the TIP60S90A mutant. The interaction of TIP60 with the TIP60 complex subunit EPC1 was not dependent on the phosphorylation of TIP60S90, indicating that the TIP60 complex itself remains intact with the TIP60S90A mutant (Fig 3A and B). Similarly, we found a reduced interaction of TIP60S90A with H3 in Ba/F3 cells (Fig EV3A).
Figure 3. TIP60 S90 phosphorylation affects its interaction with H3.
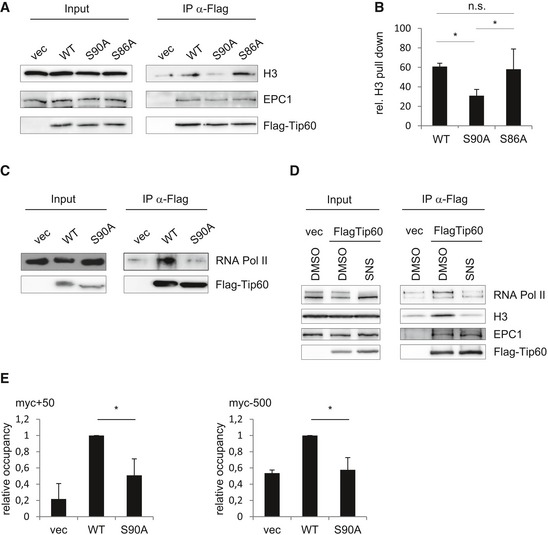
- FLAG‐immunoprecipitations were performed from nuclear extracts of U2OS cells stably expressing FLAG‐tagged TIP60WT, TIP60S90A, TIP60S86A or empty vector (vec). Immunoprecipitated material and input lysate were subjected to Western blot analysis.
- The experiment as shown in (A) was repeated three times. The graphs and error bars represent mean and standard deviation of these three individual experiments [one‐way ANOVA, Fisher's LSD test, WT vs. S86A P = 0.5992, WT vs. S90A P = 0.0429, S90A vs. S86A P = 0.0176 (*P ≤ 0.05; n.s. not significant, P > 0.05)].
- HEK293 cells were transfected with pcDNA3.1 encoding FLAG‐TIP60WT, FLAG‐TIP60S90A or empty vector. FLAG immunoprecipitations were performed from nuclear extracts. Immunoprecipitated material and input lysate were subjected to Western blot analysis.
- U2OS cells stably expressing FLAG‐TIP60WT or empty vector were treated with 2 μM SNS‐032 (SNS) for 2 h as indicated. FLAG immunoprecipitations were performed from nuclear extracts. This material and input lysate were subjected to Western blot analysis.
- U2OS cells stably expressing FLAG‐TIP60WT, FLAG‐TIP60S90A or empty vector (vec) were subjected to ChIP using anti‐FLAG antibody. Immunoprecipitated DNA and input were subjected to quantitative real‐time PCR using primers annealing in the myc locus about 50 bp upstream (myc+50) or about 500 bp downstream (myc−500) of the transcription start site. Promoter occupancy of FLAG‐TIP60WT or FLAG‐TIP60S90A was determined as per cent input in relation to FLAG‐TIP60WT. The graphs and error bars represent mean and standard deviation of three individual experiments [one‐way ANOVA, Bonferroni's multiple comparison test, myc+50 WT vs. S90A P = 0.0289, myc−500 WT vs. S90A P = 0.0155 (*P ≤ 0.05)].
Source data are available online for this figure.
Figure EV3. TIP60 S90 phosphorylation affects its interaction with H3.
- FLAG immunoprecipitations were performed from nuclear extracts of Ba/F3 cells stably expressing FLAG‐TIP60WT, FLAG‐TIP60S90A or empty vector (vec). Immunoprecipitated material and input lysates were analysed by Western blotting and probed for H3 and FLAG.
- HEK293 cells were transfected with pcDNA3.1 encoding FLAG‐TIP60WT, FLAG‐TIP60S90A or empty vector. FLAG immunoprecipitations were performed from nuclear extracts. Immunoprecipitated material and input lysate were subjected to Western blot analysis, and the blot was probed with specific antibodies for FLAG and RNA Pol II as indicated (as in Fig 3C). The experiment was repeated three times. The graphs and error bars represent mean and standard deviation of these three individual experiments [two‐tailed Student's t‐test, P = 0.0372 (*P ≤ 0.05)].
- HEK293 cells were transfected with pcDNA3.1 encoding FLAG‐TIP60WT, FLAG‐TIP60S90A or empty vector. FLAG immunoprecipitations were performed from nuclear extracts. Immunoprecipitated material and input lysate were subjected to Western blot analysis. The blot was probed with specific antibodies for EPC1 and FLAG as indicated.
- The experiment as shown in (C) was repeated three times. The graphs and error bars represent mean and standard deviation of these three individual experiments [two‐tailed Student's t‐test, P = 0.6579 (n.s. not significant, P > 0.05)].
- HEK293 cells were transfected with pcDNA3.1 encoding FLAG‐TIP60WT, FLAG‐TIP60S90A or empty vector. FLAG immunoprecipitations were performed from nuclear extracts. Immunoprecipitated material and input lysate were subjected to Western blot analysis. The blot was probed with antibodies, specific for CDK9 and FLAG as indicated.
- The experiment as shown in (E) was repeated four times. The graphs and error bars represent mean and standard deviation of these four individual experiments [two‐tailed Student's t‐test, P = 0.7399 (n.s. not significant, P > 0.05)].
- U2OS cells stably expressing FLAG‐TIP60WT, FLAG‐TIP60S90A or empty vector were treated with 2 μM SNS‐032 (SNS) for 2 h as indicated. FLAG immunoprecipitations were performed from nuclear extracts. Immunoprecipitated material and input lysate were subjected to Western blot analysis and probed with antibodies specific for FLAG and H3, as indicated.
Source data are available online for this figure.
RNA Pol II was shown to accumulate around the TSS of genes, which are subject to promoter‐proximal pausing. Quite remarkably, it was shown that the genomewide distribution of TIP60 and RNA Pol II largely overlaps 15. In the same study, the TIP60 complex subunit TRRAP was shown to interact with RNA Pol II, but an interaction of TIP60 and RNA Pol II was not demonstrated 15. We addressed the question whether TIP60 interacts with RNA Pol II, and we found indeed that TIP60 co‐immunoprecipitated RNA Pol II upon pull‐down of FLAG‐tagged TIP60. Importantly, this interaction was largely reduced with TIP60S90A (Figs 3C and EV3B). By contrast, the association of TIP60 with the TIP60 complex member EPC1 and with CDK9 itself did not depend on phosphorylation of TIP60S90 (Fig EV3C–F).
Consistent with a phosphorylation of TIP60S90 by CDK9, the treatment of U2OS cells expressing FLAG‐TIP60 with CDK9 inhibitor also resulted in a reduced interaction of H3 and RNA Pol II with TIP60. As before, the interaction of TIP60 with the TIP60 complex subunit EPC1 was not affected by the inhibition of CDK9 (Figs 3D and EV3G).
We next analysed the S90‐phosphorylation‐dependent interaction of TIP60 with the MYC gene, the transcription of which was shown to involve promoter‐proximal pausing, therefore requiring CDK9 for productive gene expression 26, 27.
TIP60 had been shown to be associated with the promoter of MYC 28, and we tested by chromatin immunoprecipitation (ChIP) whether the recruitment of TIP60 to the MYC locus was influenced by S90 phosphorylation. We found that TIP60 was associated with a site (+50) in the MYC promoter close to the transcription start site (TSS), which was substantially reduced with the TIP60S90A mutant. This was also observed, albeit less pronounced, in a region 500 bp upstream of the TSS (Fig 3E). These data indicate that TIP60 recruitment to the MYC promoter requires S90‐phosphorylation of TIP60, which likely affects MYC gene expression and MYC‐mediated effects such as cell proliferation.
Together, our data demonstrate that TIP60 interacts with RNA Pol II and that CDK9‐mediated phosphorylation of TIP60 on S90 is required for its association with RNA Pol II as well as H3. This suggests a co‐regulation of RNA Pol II and TIP60 by CDK9, phosphorylating the C‐terminal domain (CTD) of RNA Pol II, DSIF, NELF and TIP60 upon pause release and raises the possibility that S90‐phosphorylated TIP60 plays a role for the progress of RNA Pol II into the gene body.
This is consistent with the genomewide distribution of TIP60, being associated with the promoter region but also the gene body of active genes, resembling the distribution pattern of RNA Pol II 15. These data are also in line with the finding that the TIP60 complex subunit TRRAP interacts only with phosphorylated (active) RNA Pol II 15, a notion that is further supported by the finding that mainly phosphorylated RNA Pol II is pulled down with TIP60 (Fig 3D).
BRD4 is required for the recruitment of TIP60 to histone 3 and chromatin
The bromodomain‐containing protein BRD4 was shown to recruit P‐TEFb to promoters and RNA Pol II 11, 12. In addition, BRD4 was also shown to enhance CDK9 enzyme activity 29. We tested whether BRD4 affects CDK9‐mediated phosphorylation of TIP60S90 in vitro, but the phosphorylation of TIP60 by CDK9 in a kinase assay was not affected by the presence or absence of BRD4 (Fig EV4A).
Figure EV4. Brd4 influences the recruitment of TIP60 to chromatin.
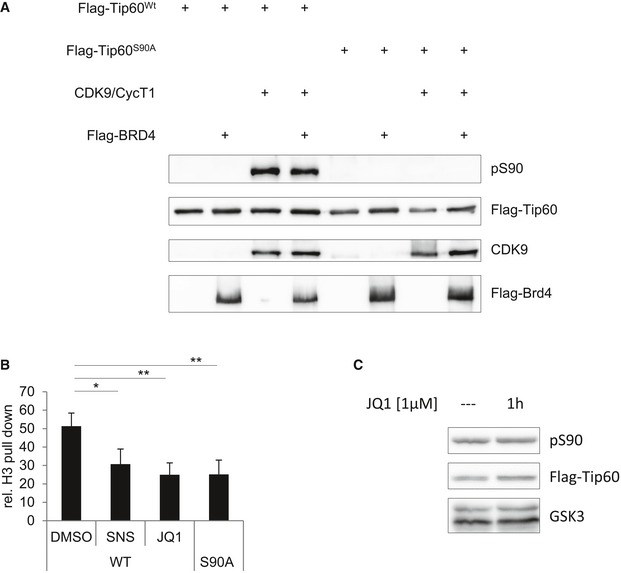
- HEK293T cells were transfected with pcDNA3.1 encoding FLAG‐BRD4, FLAG‐TIP60WT, FLAG‐TIP60S90A or empty vector (vec). The samples were subjected to FLAG affinity purification. FLAG‐TIP60 was dephosphorylated with shrimp alkaline phosphatase and incubated as indicated with CDK9/cyclinT1 and BRD4 in the presence of ATP. Phosphorylation of TIP60 was analysed by Western blotting with the phosphoS90TIP60 antibody, and the blot was further probed with antibodies specific for FLAG and CDK9 and as indicated.
- U2OS cells stably expressing FLAG‐TIP60WT, FLAG‐TIP60S90A or empty vector (vec) were treated with 2 μM SNS‐032 (SNS), 2 μM JQ1 (JQ1) or the solvent DMSO for 2 h. FLAG immunoprecipitations were performed from nuclear extracts. Immunoprecipitated material and input lysate were subjected to Western blot analysis. The experiment, similar to the one shown in Fig 4A, was repeated four times. The graphs and error bars represent mean and standard deviation of these four individual experiments [one‐way ANOVA, Bonferroni's multiple comparison test, DMSO vs. SNS P = 0.0459, DMSO vs. JQ1 P = 0.0089, WT vs. S90A P = 0.0092 (**P ≤ 0.01; *P < 0.05)].
- U2OS cells stably expressing FLAG‐TIP60WT were treated with 1 μM JQ1 for 1 h as indicated. Nuclear extracts were analysed by Western blotting and probed for phosphoS90TIP60, FLAG and GSK‐3.
Source data are available online for this figure.
We next tested whether the association of TIP60 with H3 is dependent on BRD4, by using a bromodomain inhibitor. Indeed, the treatment of cells with the bromodomain inhibitor JQ1 resulted in a reduction of the interaction of TIP60 with H3, to the same extent as did the treatment with the CDK9 inhibitor SNS‐032, or the absence of the S90 phosphorylation site. In contrast, the interaction with the TIP60 complex subunit EPC1 was not affected by JQ1 (Figs 4A and EV4B). Likewise, the recruitment of both of TIP60 and CDK9 to chromatin was dependent on BRD4, as the treatment of cells with JQ1 decreased TIP60 and CDK9 in the chromatin fraction (Fig 4B). In turn, overexpression of BRD4 increased the presence of TIP60 on chromatin (Fig 4C). Consistent with the in vitro kinase assay in the presence of BRD4, the bromodomain inhibitor JQ1 did not affect the phosphorylation of TIP60S90 in U2OS cells (Fig EV4C). Together, these data suggest that the phosphorylation of TIP60 on S90 by CDK9 is not dependent on their association with chromatin. Furthermore, the recruitment of TIP60 to chromatin is not only depending on S90 phosphorylation but also on BRD4.
Figure 4. BRD4 influences the recruitment of TIP60 to chromatin.
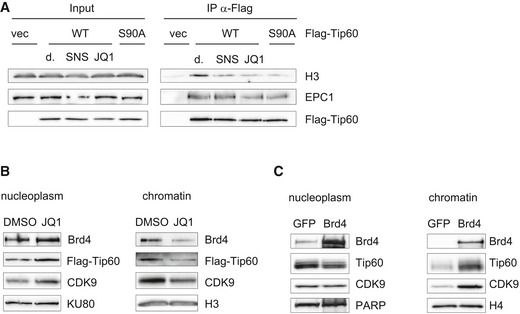
- U2OS cells stably expressing FLAG‐TIP60WT, FLAG‐TIP60S90A or empty vector (vec) were treated with 2 μM SNS‐032 (SNS), 2 μM JQ1 (JQ1) or the solvent DMSO (d.) for 2 h as indicated. FLAG immunoprecipitations were performed from nuclear extracts. Immunoprecipitated material and input lysate were subjected to Western blot analysis.
- U2OS cells stably expressing FLAG‐TIP60WT were treated with 2 μM JQ1 (JQ1) for 2 h. The nucleus was fractionated into nucleoplasm and chromatin. Both fractions were analysed by Western blotting.
- HEK293 cells were transiently transfected with pcDNA4 encoding Brd4 or GFP. The nucleus was fractionated into nucleoplasm and chromatin. Both fractions were analysed by Western blotting.
Source data are available online for this figure.
Deficient H4 acetylation and reduced cell proliferation in TIP60S90A‐ and TIP60S86A‐expressing cells
The TIP60 complex was shown to acetylate H2A and H4 30, and we investigated whether H4 KAT activity is affected by deficiency of TIP60 phosphorylation in vivo. First we tested whether TIP60 is necessary for the acetylation of lysine‐16 of H4 (H4K16). We transfected U2OS cells with siRNA targeting TIP60 and found in these cells, as compared to cells transfected with siRNA targeting luciferase, a reduction in the acetylation of H4K16 (Fig 5A). Next, we expressed TIP60WT, TIP60S86A or TIP60S90A in U2OS cells and probed the chromatin fraction with antibodies recognizing acetylated H4K16. We observed a reduced acetylation of H4K16 in the presence of TIP60S90A. This suggests a dominant‐negative effect of the phosphorylation‐deficient TIP60 mutant, competing with endogenous wild‐type TIP60 in the TIP60 complex (Fig 5B). However, we found H4K16ac also reduced in cells expressing the mutant protein TIP60S86A, which retains the phosphorylation of S90. As this mutant was shown to interact with chromatin just as wild‐type TIP60, reduced KAT activity, which was previously observed with the TIP60S86A and a TIP60S86A/S90A double mutant in vitro, most likely accounts for this effect 6, 9.
Figure 5. Phosphorylation of TIP60 S90 and S86 is required for TIP60 HAT activity.
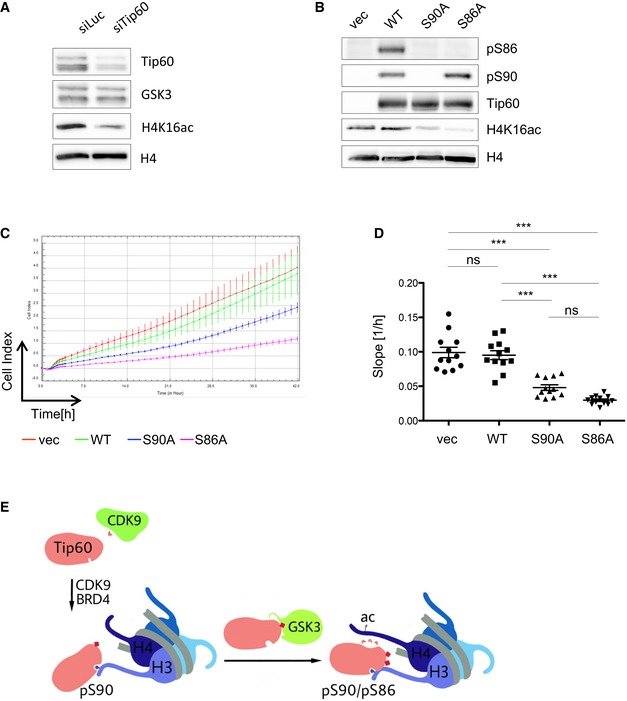
- U2OS cells were transfected with a siRNA pool targeting human TIP60 (Dharmacon) or luciferase (Dharmacon). The nuclear lysates were analysed by Western blotting 24 h after transfection.
- U2OS cells stably expressing FLAG‐TIP60WT, FLAG‐TIP60S90A, FLAG‐TIP60S86A or empty vector (vec) were analysed by Western blotting 60 h after viral transduction.
- 48 h after viral transduction, U2OS cells stably expressing FLAG‐tagged TIP60WT, TIP60S90A, TIP60S86A or empty vector (vec) were subjected to real‐time cell analysis (RTCA) for 42 h. Real‐time resistance measurement data were recorded every hour and presented as Cell Index. Curves and arrow bars represent mean and standard deviation of four technical replicates of one experiment.
- The experiment as shown in (C) was repeated three times. Each dot (n = 12) represents the slope of the Cell Index of the first 30 h of one technical replicate (one‐way ANOVA, Bonferroni's multiple comparison test, vec vs. WT P > 0.9999, S90A vs. S86A P = 0.1276, ****P < 0.0001; n.s. not significant, P > 0.05).
- Proposed model: The interaction of TIP60 with chromatin is regulated by CDK9 and Brd4. The phosphorylation of S90 stabilizes the interaction of TIP60 and H3 via the chromodomain, and BRD4 and CDK9 positively regulate the recruitment of TIP60 to chromatin. In addition, the phosphorylation of S90 is the priming phosphorylation required for GSK3‐mediated phosphorylation of S86. Double phosphorylated TIP60, on S90 and S86, exhibits increased HAT activity.
Source data are available online for this figure.
Compatible with this finding, we found substantially reduced acetylation of H4 in the presence of the CDK9 inhibitor, further corroborating the regulation of TIP60 by CDK9 (Fig EV5A). Likewise, consistent with the role of TIP60 as a H4 acetyltransferase, and the BRD4‐dependent recruitment of TIP60 to chromatin, H4K16 acetylation was decreased in cells treated with JQ1 to a similar extent, as observed upon treatment with the TIP60 inhibitor TH1834 (Fig EV5B). However, we cannot rule out the possibility that the deacetylation of H4K16 is due increased access of an HDAC upon displacement of BRD4 by JQ1.
Figure EV5. Phosphorylation of TIP60 S90 and S86 is required for TIP60 HAT activity.
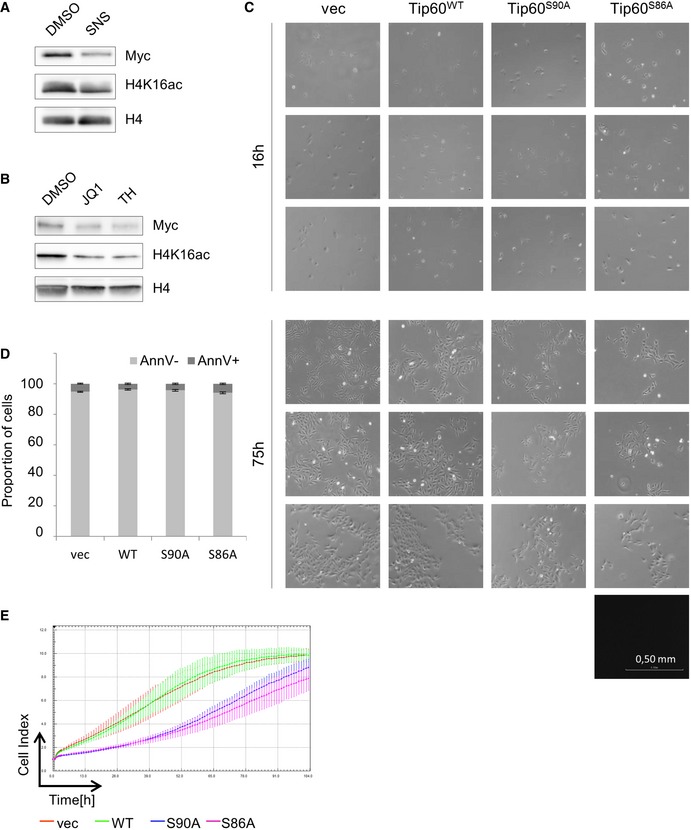
- U2OS cells were treated with 1 μM SNS‐032 or the solvent DMSO for 24 h. Whole nuclear extracts were analysed by Western blotting probing with specific antibodies for MYC, H4K16ac and H4 as indicated.
- U2OS cell were treated with DMSO, 2 μM JQ1 (JQ1) or 50 μM TH1834 (TH) for 24 h. Nuclear extracts were analysed by Western blotting using specific antibodies for MYC, H4K16ac and H4 as indicated.
- Per condition, 10,000 U2OS cells stably expressing FLAG‐TIP60WT, FLAG‐TIP60S90A, FLAG‐TIP60S86A or empty vector (vec) were seeded, 48 h after viral transduction. Representative pictures were taken as indicated after 16 or 75 h. All images were taken with a Nikon Eclipse TS100 microscope, 100× magnification.
- 48 h after viral transduction, U2OS cells stably expressing FLAG‐TIP60WT, FLAG‐TIP60S90A, FLAG‐TIP60S86A or empty vector (vec) were cultured for 100 h. Spontaneous cell death was assessed by Annexin V staining and flow cytometry analysis. The graphs and error bars represent mean and standard deviation of three technical replicates.
- Two days after viral transduction, U2OS cells stably expressing FLAG‐TIP60WT, FLAG‐TIP60S90A, FLAG‐TIP60S86A or empty vector (vec) were subjected to RTCA for 100 h. Real‐time resistance measurement data were recorded every hour and presented as Cell Index. Curves and arrow bars represent mean and standard deviation of four wells of one experiment.
Source data are available online for this figure.
We observed that cells, which were infected with retroviral vectors encoding TIP60S86A or TIP60S90A, but not TIP60wt, exhibited a reduced proliferation (Fig EV5C). In order to quantify this, we made use of the xCELLigence real‐time cell analysis. We found that expression of TIP60S90A, and even more so TIP60S86A, substantially slowed down cell proliferation, as compared to uninfected cells or cells expressing wild‐type TIP60 (Fig 5C and D). This was independent of cell death, as the proportion of Annexin V+ cells was the same in all conditions (Fig EV5D). It should be noted that, at later time points, we observed that the cells expressing the phosphorylation‐deficient TIP60 mutants lost their initial relative growth retardation, possibly due to the mechanisms of compensation (Fig EV5E).
Taken together, these data suggest that in vivo, TIP60 is regulated on distinct levels by phosphorylation on S90 and S86. We propose a mechanism (Fig 5E) by which CDK9‐mediated phosphorylation of S90 promotes the recruitment of TIP60 to chromatin, involving the interaction with H3. Consistently, the TIP60S90A mutant exhibits a reduced association globally with chromatin, and also specifically with the MYC gene. Likewise, TIP60S90 phosphorylation promotes its association with the RNA Pol II. In addition, the phosphorylation of S90 is required for the phosphorylation of S86 by GSK‐3 9. Consistently, we found that for full KAT activity, mediating the acetylation of H4K16, TIP60 phosphorylation on S86 was required. Moreover, our data show that expression of phosphorylation‐deficient TIP60 mutants dominant‐negatively affects cell proliferation, most likely affecting genes regulating cell proliferation, such as MYC, which was among the first genes reported to be regulated by promoter‐proximal pausing of RNA Pol II 26, 27. In addition, transactivation of MYC target genes was shown to require TIP60 co‐activator activity in order to promote G1/S progression, which is likely dependent on the phosphorylation of S90 and S86 31. However, whether S86 phosphorylation is required for all genes, the expression of which requires TIP60 as a co‐activator, remains to be elucidated.
We did not find that S86 or S90 phosphorylation of TIP60 influences the composition of the TIP60 complex, as assessed by probing for interaction with EPC1. Likewise, SILAC mass spectrometry interaction experiments with cells expressing TIP60WT, TIP60S86A or TIP60S90A we had performed previously did not reveal any changes regarding the composition of the TIP60 complex with TIP60S86A or TIP60S90A (F. Schubert & U. Maurer, unpublished data).
Previously, we found S86‐phosphorylated TIP60 to be required for the transcriptional induction of the pro‐apoptotic BCL‐2 protein PUMA by p53. This finding, along with the possibility that TIP60 plays a role for the productive transcription of paused genes, intimates that the PUMA gene, and possibly other genes encoding pro‐apoptotic proteins are subject to transcription involving promoter‐proximal pausing. This is compatible with a rapid and synchronous activation of pro‐apoptotic genes as a consequence promoter‐proximal pausing, once the decision for cell death is made 19.
Interestingly, the yeast TIP60 homologue Esa‐1 lacks phosphorylation sites corresponding to S86 and S90, which only appeared in Drosophila and higher organisms. Likewise, promoter‐proximal pausing is not observed in yeast, but in Drosophila and higher organisms. As the release of promoter‐proximal pausing and the phosphorylation of S90 are both regulated by CDK9, this raises the intriguing possibility of a co‐evolution of promoter‐proximal pausing and TIP60S90 phosphorylation.
Materials and Methods
Cell lines
All cell lines were cultured in a humidified incubator at 37°C and 5% CO2. HEK293T (ATCC), HEK293 (kindly provided from Andreas Hecht), U2OS (ATCC) and Mef p53−/− HRas G12V were cultured in DMEM high glucose medium, supplemented with 10% fetal calf serum (FCS) and 1% penicillin/streptomycin (P/S). Ba/F3 cells were grown in RPMI supplemented with 10% FCS and 1% P/S and 1 μg/l recombinant IL‐3 (PeproTech).
Cells were seeded on culture plates at 30% confluency 1 day before treatment. Cells were treated as indicated with SNS‐032 (Selleckchem, #S1145), DRB (Cayman Chemical, #10010302), (+)‐JQ1 (Cayman Chemical, #11187), Calyculin A (New England Biolabs #9902S) or TH1834 (Axon Medchem BV #2339).
Retroviral transduction
HEK293T cells were transfected with 1.5 μg pLXIN‐ or pLXIP‐FLAG‐TIP60 together with 1.5 μg Hit60 and 1.5 μg pVSV‐G (ClonTech) using the Attractene transfection reagent (Qiagen). Transfection was carried out in a cell culture 10‐cm dish according to manufacturer's protocol.
The day after transfection, the retrovirus‐producing cells were treated with 5 mM sodium butyrate to increase the virus production for 8 h. Sodium butyrate was thoroughly removed from the cells and after washing the cells with PBS, 5 ml fresh DMEM supplemented with FCS and PS was added to the cells. Two days after transfection, the virus particle‐containing medium was harvested and filtered through a Nalgene Syringe Filter (Thermo Fisher # 190‐2545). To improve transduction efficiency, the viral particles were supplemented with 5 μg/ml polybrene. Spinfection of the target cells was performed for 10 min at 400 g. The following day, selection of the cells was started using 4 μg/ml puromycin (Sigma‐Aldrich) for 1–3 days or 2 mg/ml neomycin (G418 sulphate, Life Technologies) for 5 days.
Transient transfection
HEK293 cells were either transfected with siRNA or DNA plasmids by using Lipofectamine®2000 Reagent (Invitrogen) or Attractene transfection reagent (Qiagen), respectively. Transfection was carried out in a cell culture 6‐well dish according to manufactures protocol.
U2OS cells were transfected with siRNA using Lipofectamine®2000 Reagent (Invitrogen). Transfection was carried out in a cell culture 6 cm dish according to manufactures protocol. For transfection with polyethylenimine (PEI), PEI was dissolved to a final concentration of 10 mg/ml in sterile ddH2O at 80°C to prepare a 10× PEI stock. Aliquots of 10× PEI were stored at −20°C. To dilute 10 mg/ml PEI to 1 mg/ml PEI, 10× PEI was defrosted and PEI was re‐dissolved by heating up to 80°C. 10× PEI was diluted in the appropriate amount of sterile ddH2O to 1× PEI. The solution was neutralized with HCl to pH 7.2. 1× PEI was aliquoted and stored at 4°C for up to 4 months. A DNA:PEI ratio of 1:3 (1 μg DNA + 3 μg PEI) works fine for HEK293T cells.
HEK293T cells were seeded the day before transfection in 15‐cm cell culture dishes at 30% confluency. To prepare the transfection cocktail, 18 μg DNA and 54 μg PEI were each diluted in 1 ml phenol red‐free DMEM and well mixed. The diluted PEI was added to the diluted DNA and gently mixed. After 15‐min incubation at room temperature, the mixture was added together with 18 ml DMEM supplemented with FCS and PS to the cells.
siRNA
| siRNA | Product no. | Supplier |
|---|---|---|
| CDK9 siRNA1 | SIHK0371‐0.25NMOL | Sigma‐Aldrich |
| CDK9 siRNA2 | SIHK0372‐0.25NMOL | Sigma‐Aldrich |
| CDK9 siRNA3 | SIHK0373‐0.25NMOL | Sigma‐Aldrich |
| ON‐TARGET plus human CDK9‐smart pool | SO‐2627665G | Dharmacon |
| ON‐TARGET plus human KAT5‐smart pool | SO‐2616016G | Dharmacon |
Constructs
pCDNA3.1‐TIP60WT, pCDNA3.1‐TIP60S90A, pCDNA3.1‐TIP60S86A were described before 9. The TIP60 constructs were subcloned into a pV3‐FLAG vector by PCR. The primers were designed to add the restriction sites NotI and XhoI to the 5′ and 3′ end of the TIP60 sequence, respectively.
From pV3‐FLAG‐TIP60, the different FLAG‐TIP60 constructs were subcloned into pLXIP and pLXIN by PCR. The primers were designed to add the restriction sites XhoI and BamHI to the 5′ and 3′ end of the FLAG‐TIP60 sequence, respectively.
From pV3‐FLAG‐TIP60, the different FLAG‐TIP60 constructs were subcloned into pcDNA3.1 with the restriction enzymes EcoRI and XhoI.
pcDNA4‐TO‐HA‐BRD4 had been described by others 32 and received from Addgene (Peter Howley). BRD4 was subcloned into pcDNA4c by digestion with BamHI and NotI.
| Primer | Sequence |
|---|---|
| NotI‐ 5′ TIP60 forward | 5′‐gcg gcc gct gcg gag gtg ggg gag ata at‐3′ |
| XhoI‐ 3′ TIP60 reverse | 5′‐cct cga gtc acc act tcc ccc tct tgc tcc‐3′ |
| XhoI ‐ 5′ FLAG‐TIP60 forward | 5′‐ccg ctc gag acc atg gat tac aag gat gac gac‐3′ |
| BamHI‐ 3′ FLAG‐TIP60 reverse | 5′‐cgg gat cct cac cac ttc ccc ctc ttg ct‐3′ |
Flow cytometry
The cells were harvested, and 50,000 cells were washed once with Annexin V binding buffer (10 mM HEPES, 150 mM NaCl, 150 μM MgCl, 2.5 mM CaCl2). Then, cells were incubated for 15 min at room temperature in 100 μl Annexin V binding buffer containing 1 μl Annexin V‐FITC (BD Pharmingen). After incubation, cells were analysed by flow cytometry.
Real‐time cell analysing (RTCA)
E‐16 Plates were used to monitor cell growth. First, 100 μl medium containing FCS and PS was pipetted into the wells, and the background resistance was measured. Cells were counted, and 10,000 cells were suspended in additional volume of 100 μl medium, supplemented with FCS and PS. Thus, per well 10,000 cells were seeded in 200 μl growth medium. Real‐time resistance measurement data were recorded every hour and presented as arbitrary units called Cell Index. This is a measure of the relative change in the electrical impedance in comparison with the background impedance. The slope of the Cell Index in a defined time frame was calculated.
Immunoblotting
Cells were washed before lysis using ice‐cold PBS. Cell pellets were lysed on ice for 5 min using 30–100 μl of lysis buffer (20 mM Tris–HCL, pH 7.5, 150 mM NaCl, 1% Triton X‐100, 5 mM EDTA, 1× protease inhibitor cocktail complete (Roche), MG132 (20 μM, Alexis Biochemicals), phosphatase inhibitor cocktail 1 (1:50, Sigma‐Aldrich). Lysates were then centrifuged 16,000 g for 10 min, 4°C. The supernatants were always kept on ice. Protein concentration was determined by using the Bradford reagent (Biorad). Laemmli buffer was added to 40–70 μg of protein lysate, and samples were boiled for 5 min at 95°C. In some cases, the same amount of lysate was loaded onto more than one gel to allow sequential probing with several antibodies. Proteins were separated on SDS–PAGE and transferred to nitrocellulose membranes. To detect proteins of interest, antibodies were diluted in 3% milk/TBS‐Tween (0.1%). The Western blot signal was detected with the chemiluminescence imaging system Fusion Solo (Vilber Lourmat). For signal quantification, the FusionCap software was used. The signal of interest was calculated in relation to the loading control or, in case of a post‐translational modification, in relation to the signal of the protein of interest.
Antibodies
| Antibody | Dilution | Product no. | Supplier |
|---|---|---|---|
| FLAG M2 | 1:1,000 | F1804 | Sigma‐Aldrich |
| P‐ERK | 1:2,000 | #9101 | Cell Signaling Technology |
| P‐AKT | 1:1,000 | #4058 | Cell Signaling Technology |
| PARP | 1:1,000 | #9542 | Cell Signaling Technology |
| TIP60 C7 | 1:1,000 | sc‐166323 | Santa Cruz Biotechnology |
| TIP60 | 1:2,000 | ab151432 | Abcam |
| gH2AX | 1:100,000 | ab81299 | Abcam |
| CDK9 (C12F7) | 1:1,000 | #2316 | Cell Signaling Technology |
| GSK3a/b (1H8) | 1:1,000 | sc‐56913 | Santa Cruz Biotechnology |
| Ku80 | 1:1,000 | #2753 | Cell Signaling Technology |
| mouse p21 (M‐19) | 1:200 | sc‐471 | Santa Cruz Biotechnology |
| Human p21 | 1:1,000 | 556430 | BD Pharmingen |
| BRD4 (E2A7X) | 1:1,000 | #13440 | Cell Signaling Technology |
| RNA Pol II (F‐12) | 1:200 | sc‐55492 | Santa Cruz Biotechnology |
| RNA Pol II (N‐20) | 1:500 | sc‐899 | Santa Cruz Biotechnology |
| pS2 RNA Pol II (3E10) | 1:2,000 | # 04‐1571‐l | Upstate/Millipore |
| pS2/S5 RNA Pol II | 1:1,000 | #4735 | Cell Signaling Technology |
| EPC1 | 1:1,000 | ab5514 | Abcam |
| H3 (1B1B2) | 1:1,000 | #14269 | Cell Signaling Technology |
| H4 (L64C1) | 1:1,000 | #2935 | Cell Signaling Technology |
| Acetyl‐H4 Lsy16 (E2B8W) | 1:1,000 | #13534 | Cell Signaling Technology |
| Acetylated lysine (Ac‐K‐103) | 1:1,000 | #9681 | Cell Signaling Technology |
| RIPK1 | 1:1,000 | D94C12, #3493 | Cell Signaling Technology |
| Lamin B1 (H‐90) | 1:500 | sc‐20682 | Santa Cruz Biotechnology |
| MYC (9E10) | 1:500 | sc‐40 | Santa Cruz Biotechnology |
Custom‐made antibodies
| Antibody | Dilution | Epitope | Supplier |
|---|---|---|---|
| pS90 (‐12) | 1:1,000 | RPG(pS)PERE | ProSci |
| pS90 (‐72) | 1:1,000 | GSRPG(pS)PEREV | ProSci |
| pS86 (‐69) | 1:1,000 | G(pS)RPGSPEREV | ProSci |
In vitro kinase assay
FLAG‐TIP60WT, FLAG‐TIP60S90A or empty pcDNA3.1 were transiently expressed in HEK293T cells. 24 h post‐transfection, the cells were treated for 2 h with HDAC inhibitors (sodium butyrate 5 mM, nicotinamide 5 mM and TSA 10 μM) and then lysed with 1 ml lysis buffer (20 mM Tris–HCl, pH 7.5, 150 mM NaCl, 1% Triton X‐100, 5 mM EDTA, 1× protease inhibitor cocktail complete (Roche), MG132 (20 μM, Alexis Biochemicals). The lysate was incubated for 2 h with 50 μl EZview Red ANTI‐FLAG M2 Affinity Gel (Sigma‐Aldrich, #F2426) on a rotating platform at 4°C. The FLAG M2 Affinity Gel was washed once with lysis buffer, twice with TBS 400 mM NaCl and twice with TBS. FLAG‐TIP60 was dephosphorylated with alkaline shrimp phosphatase (rSAP, New England Biolabs #M0371S) for 50 min at 37°C. The FLAG M2 Affinity Gel was washed again, once with TBS 400 mM NaCl and twice with TBS. FLAG‐TIP60 was eluted from the gel with 180 μl TBS containing 150 ng/μl 3× FLAG peptide (Sigma‐Aldrich, #F4799). 30 μl eluted TIP60 was incubated with 1.2 μl active CDK9/CycT1 (ProQinase, #0371‐0345‐1) in 20 μl 2.5× kinase buffer (125 mM Tris, 12.5 mM MnCl2, 12.5 mM MgCl2, 12.5 mM DTT, 2 mM ATP) for 30 min at 30°C. The reaction was stopped with 10 μl 5× Laemmli buffer. The phosphorylation of TIP60 S90 by CDK9 was analysed by Western blot with a phospho‐TIP60 S90‐specific antibody (custom‐made by ProSci).
Subcellular fractionation
The cells were lysed in cytosol lysis buffer [10 mM HEPES, 10 mM KCl, 1.5 mM MgCl2, 0.34 mM sucrose, 10% glycerol, 1× protease inhibitor cocktail complete (Roche), MG132 (20 μM, Alexis Biochemicals), 1× phosphatase inhibitor cocktail 1 (1:50, Sigma‐Aldrich)] supplemented with 0.1% Triton X‐100 followed by incubation on ice for 8 min. Subsequently, the lysed cells were centrifuged at 1,300 g for 5 min. The cytosolic fraction was in the supernatant and the pellet contained the nuclei. In order to fractionate the nuclei into nucleoplasm and chromatin, the pellet was suspended in nucleoplasm extracting buffer [400 mM NaCl, 3 mM EDTA, 0.2 mM EGTA, 1 mM DTT, 1× protease inhibitor cocktail complete (Roche), MG132 (20 μM, Alexis Biochemicals), 1× phosphatase inhibitor cocktail 1 (1:50, Sigma‐Aldrich)] and rested on ice for 20 min. Centrifugation at 1,000 g at for 2 min separated nucleoplasm in the supernatant from chromatin in the pellet. The pellet was suspended completely and washed in nucleoplasm extracting buffer. After 20‐min incubation on ice, the chromatin was centrifuged at 1,700 g at for 5 min. To cleave the DNA in small fragments, the chromatin was taken up in the nuclei lysis buffer [50 mM Tris–Cl (pH 8.1), 10 mM EDTA, 0.5% SDS, 1× protease inhibitor cocktail complete (Roche), MG132 (20 μM, Alexis Biochemicals), 1× phosphatase inhibitor cocktail 1 (1:50, Sigma‐Aldrich)] and sonicated 25 times for 30 s with the setting high amplitude in a Bioruptor®Plus (Diagenode). In between the sonication periods, there was each time 30‐s pause. The protein concentrations were determined by Bradford assay, and the lysates were analysed by Western blotting.
To obtain whole nuclear extracts, upon lysis with the cytosol lysis buffer, the nuclei containing pellets were lysed directly in the nuclei lysis buffer followed by 25 sonication cycles, as described above.
Co‐immunoprecipitation from nucleus
Cells expressing FLAG‐TIP60WT, FLAG‐TIP60S90A, FLAG‐TIP60S86A or empty vector were suspended in 500 μl cytosol lysis buffer [10 mM HEPES, 10 mM KCl, 1.5 mM MgCl2, 0.34 mM sucrose, 10% glycerol, 1× protease inhibitor cocktail complete (Roche), MG132 (20 μM, Alexis Biochemicals), 1× phosphatase inhibitor cocktail 1 (1:50, Sigma‐Aldrich)] supplemented with 0.1% Triton X‐100 followed by incubation on ice for 8 min. The nuclei containing pellet was suspended in 500 μl BC100 buffer [20 mM Tris pH8, 100 mM NaCL, 0.2 mM EDTA, 10% glycerol, 0.5% Triton X‐100, 1× protease inhibitor cocktail complete (Roche), MG132 (20 μM, Alexis Biochemicals), 1× phosphatase inhibitor cocktail 1 (1:50, Sigma‐Aldrich)]. The nuclei were sonicated in a Bioruptor®Plus (Diagenode) once for 20 s with the setting low amplitude. After centrifugation at 14,000 g at 4°C for 5 min, the protein concentrations of the supernatants were determined by the Bradford assay. 30 μg of the material was saved for the input control and 1,200–3,000 μg was incubated with 50 μl EZview Red ANTI‐FLAG®M2 Affinity Gel (Sigma‐Aldrich, #F2426) and rotated with the gel for 1.5 h at 4°C. The beads were washed once with BC100 buffer, once with BC100 buffer 300 mM KCl, once with BC100 buffer 250 mM NaCl and then twice with BC100 buffer. To elute FLAG‐TIP60 and TIP60 bound proteins from the FLAG®M2 Affinity Gel, 55 μl BC100 buffer containing 150 ng/μl 3× FLAG peptide (Sigma‐Aldrich, #F4799) was added. The suspension was rotated for 15 min at 4°C. After centrifugation, 45 μl supernatant was carefully removed. The FLAG pull‐down and the input were analysed by Western blotting.
Chromatin‐IP
To cross‐link proteins and DNA, the cells were incubated on the cell culture dish with 1% formaldehyde for 10 min on a rocking platform. The cross‐linking was stopped with 0.125 M glycine for 5 min on a rocking platform. The cells were washed twice on the plate with ice‐cold PBS. The cells were scraped off and transferred into a 15‐ml Falcon tube followed by 5‐min centrifugation at 100 g. The pellet was once more washed with ice‐cold PBS. The cells were then re‐suspended in 10 ml NP‐40 lysis buffer (0.5% NP‐40, 85 mM KCl, 5 mM HEPES pH 7.9) and incubated on ice for 10 min. To disrupt the membrane of the cells, the suspension was homogenized with a Dounce homogenizer employing a tight pestle for 50 times and subsequently centrifuged at 2,000 g for 5 min. The nuclei were re‐suspended in 270 μl nuclei lysis buffer (50 mM Tris–Cl pH 8.1, 10 mM EDTA) supplemented with 30 μl of 10% SDS. To shear the chromatin into around 500‐bp fragments, the nuclei were sonicated in a Bioruptor®Plus (Diagenode) 20 times for 30 s with high amplitude. After each sonication a 30‐s pause was allowed. After centrifugation at 16,000 g for 5 min, the DNA concentration of the supernatant was measured with a spectrophotometer (NanoDrop 2000c, peQLab). 10–20 μg was saved for the input control, and 100–200 μg chromatin was applied for the chromatin immunoprecipitation.
30 μl Dynabeads G (Life Technologies, #10003D) per sample were calculated and washed three times with IP buffer. The beads were blocked in 1 ml IP buffer (50 mM HEPES pH 7.9, 140 mM NaCl, 1 mM EDTA, 1% TTX100, 0.1% Na‐deoxycholate, 0.1% SDS) containing 250 μg/ml BSA and 250 μg/ml salmon sperm for 4 h on a rotating platform.
Each sample was incubated on a rotating platform at 4°C for 30 min and assembled as follows:
| Per sample | |
|---|---|
| 100–200 μg chromatin | X μl |
| Nuclei lysis buffer with 1% SDS | 100–X μl |
| IP buffer | 400 μl |
| FLAG antibody (Cell Signaling Technology #14793) | 10 μl |
Before using the blocked beads, they were washed three times with IP buffer. After washing, the Dynabeads were re‐suspended in the appropriate volume IP buffer and 30 μl Dynabeads were added to each sample. The suspension was incubated overnight on a rotating platform at 4°C.
The beads were washed eight times. Each time, the samples were incubated for 5 min on a rotating platform in the wash buffer. The Dynabeads were washed twice with each following buffers: IP buffer, wash buffer A (50 mM HEPES pH 7.9, 500 mM NaCl, 1 mM EDTA, 1% Triton X‐100, 0.1% Na‐deoxycholate, 0.1% SDS), wash buffer B (20 mM Tris pH 8.0, 250 mM LiCl, 1 mM EDTA, 0.5% Na‐deoxycholate, 0.5% NP‐40) and TE (10 mM Tris pH 8.0, 1 mM EDTA). To elute precipitated proteins and DNA, 150 μl elution buffer (50 mM Tris pH 8.0, 10 mM EDTA, 1% SDS) was added and the samples were shaken at 16,000 g on a thermomixer for 10 min at 67°C. After pelleting the beads, the supernatant was transferred to a new tube. The elution step was repeated once, and the elution fractions were pooled. To the input control, 300 μl of elution buffer was added. The input control and the elution were supplemented with 18 μl 5 M NaCl and 1 μl RNase (DNase free, Roche # 11119915001). To digest RNA and to reverse cross‐links, the samples were incubated 4–5 h at 67°C. 80 μg proteinase K were added, and proteins were digested for 1 h at 45°C.
One sample volume of phenol/chloroform was added, and the suspension was shaken by inverting the tubes. The samples were centrifuged for 5 min at 16,000 g. The upper phase was transferred into a new tube. One sample volume of chloroform was pipetted into the upper phase, and the samples were shaken again by inverting the tubes. After another centrifugation for 5 min at 13,200 rpm, the upper phase was again transferred into a new tube. To precipitate the DNA, the sample was supplemented with 0.1 volume 3 M NaOAc pH 5.2 and two volumes ice‐cold 100% ethanol. After incubation for 30 min at −80°C the precipitated DNA was centrifuged for 15 min at 16,000 g.
The DNA was washed once with 70% ethanol. After 5‐min centrifugation at 13,200 rpm, the supernatant was removed and the pellet air‐dried for 10 min at room temperature. The DNA was re‐suspended in 30 μl 10 mM Tris–HCl pH 8.
Immunoprecipitated DNA was analysed by quantitative PCR followed by calculation of the percentage from input.
Primers for ChIP qPCR
| Primer | Sequence |
|---|---|
| MYC promoter −500 bp forward | 5′‐aaa agg gga aag agg acc tgg‐3′ |
| MYC promoter −500 bp reverse | 5′‐cct aaa agg ggc aag tgg aga a‐3′ |
| MYC promoter +50 bp forward | 5′‐tat tca taa cgc gct ctc ca‐3′ |
| MYC promoter −50 bp reverse | 5′‐cag gga gag tgg agg aaa ga‐3′ |
Author contributions
PB‐S and UM conceived the study and analysed the data, assembled the figures and wrote the manuscript. FS, MWi, MWe, LS, SB and MS performed experiments and analysed the data. CM, CB and TB analysed data and contributed to the writing of the manuscript.
Conflict of interest
The authors declare that they have no conflict of interest.
Supporting information
Expanded View Figures PDF
Source Data for Expanded View
Review Process File
Source Data for Figure 1
Source Data for Figure 2
Source Data for Figure 3
Source Data for Figure 4
Source Data for Figure 5
Acknowledgements
We thank Andreas Hecht, Katja Rose, Sabine Jägle and Sven Beyes for advice with the ChIP experiments, Karin Neubert and Katrin Wieland for excellent technical assistance, Celia Jakob for initial experiments, Celine Charvet for advice and Scott Lowe for providing constructs. This study was supported by grants from the Centre for Biological Signalling Studies (BIOSS, EXC‐294), Freiburg, Germany to UM, TB and CB, and the Spemann Graduate School of Biology and Medicine (SGBM, GSC‐4), Freiburg, Germany, to PB‐S, FS, UM, TB and CB, both funded by the Excellence Initiative of the German Federal and State Governments, Germany, and Grant No. 112140 from the Deutsche Krebshilfe to UM.
EMBO Reports (2018) 19: 244–256
References
- 1. Squatrito M, Gorrini C, Amati B (2006) Tip60 in DNA damage response and growth control: many tricks in one HAT. Trends Cell Biol 16: 433–442 [DOI] [PubMed] [Google Scholar]
- 2. Allard S, Utley RT, Savard J, Clarke A, Grant P, Brandl CJ, Pillus L, Workman JL, Côté J (1999) NuA4, an essential transcription adaptor/histone H4 acetyltransferase complex containing Esa1p and the ATM‐related cofactor Tra1p. EMBO J 18: 5108–5119 [DOI] [PMC free article] [PubMed] [Google Scholar]
- 3. Sykes SM, Mellert HS, Holbert MA, Li K, Marmorstein R, Lane WS, McMahon SB (2006) Acetylation of the p53 DNA‐binding domain regulates apoptosis induction. Mol Cell 24: 841–851 [DOI] [PMC free article] [PubMed] [Google Scholar]
- 4. Tang Y, Luo J, Zhang W, Gu W (2006) Tip60‐dependent acetylation of p53 modulates the decision between cell‐cycle arrest and apoptosis. Mol Cell 24: 827–839 [DOI] [PubMed] [Google Scholar]
- 5. Sun Y, Jiang X, Xu Y, Ayrapetov MK, Moreau LA, Whetstine JR, Price BD (2009) Histone H3 methylation links DNA damage detection to activation of the tumour suppressor Tip60. Nat Cell Biol 11: 1376–1382 [DOI] [PMC free article] [PubMed] [Google Scholar]
- 6. Lemercier C, Legube G, Caron C, Louwagie M, Garin J, Trouche D, Khochbin S (2003) Tip60 acetyltransferase activity is controlled by phosphorylation. J Biol Chem 278: 4713–4718 [DOI] [PubMed] [Google Scholar]
- 7. Kaidi A, Jackson SP (2013) KAT5 tyrosine phosphorylation couples chromatin sensing to ATM signalling. Nature 498: 70–74 [DOI] [PMC free article] [PubMed] [Google Scholar] [Retracted]
- 8. Zheng H, Seit‐Nebi A, Han X, Aslanian A, Tat J, Liao R, Yates JR III, Sun P (2013) A posttranslational modification cascade involving p38, Tip60, and PRAK mediates oncogene‐induced senescence. Mol Cell 50: 699–710 [DOI] [PMC free article] [PubMed] [Google Scholar]
- 9. Charvet C, Wissler M, Brauns‐Schubert P, Wang S‐J, Tang Y, Sigloch FC, Mellert H, Brandenburg M, Lindner SE, Breit B et al (2011) Phosphorylation of Tip60 by GSK‐3 determines the induction of PUMA and apoptosis by p53. Mol Cell 42: 584–596 [DOI] [PMC free article] [PubMed] [Google Scholar]
- 10. Liu H, Herrmann CH (2005) Differential localization and expression of the Cdk9 42k and 55k isoforms. J Cell Physiol 203: 251–260 [DOI] [PubMed] [Google Scholar]
- 11. Jang MK, Mochizuki K, Zhou M, Jeong H‐S, Brady JN, Ozato K (2005) The bromodomain protein Brd4 is a positive regulatory component of P‐TEFb and stimulates RNA polymerase II‐dependent transcription. Mol Cell 19: 523–534 [DOI] [PubMed] [Google Scholar]
- 12. Yang Z, Yik JHN, Chen R, He N, Jang MK, Ozato K, Zhou Q (2005) Recruitment of P‐TEFb for stimulation of transcriptional elongation by the bromodomain protein Brd4. Mol Cell 19: 535–545 [DOI] [PubMed] [Google Scholar]
- 13. Peterlin BM, Price DH (2006) Controlling the elongation phase of transcription with P‐TEFb. Mol Cell 23: 297–305 [DOI] [PubMed] [Google Scholar]
- 14. Bowman EA, Kelly WG (2014) RNA polymerase II transcription elongation and Pol II CTD Ser2 phosphorylation: a tail of two kinases. Nucleus 5: 224–236 [DOI] [PMC free article] [PubMed] [Google Scholar]
- 15. Wang Z, Zang C, Cui K, Schones DE, Barski A, Peng W, Zhao K (2009) Genome‐wide mapping of HATs and HDACs reveals distinct functions in active and inactive genes. Cell 138: 1019–1031 [DOI] [PMC free article] [PubMed] [Google Scholar]
- 16. Cohen P, Frame S (2001) The renaissance of GSK3. Nat Rev Mol Cell Biol 2: 769–776 [DOI] [PubMed] [Google Scholar]
- 17. Fromm G, Gilchrist DA, Adelman K (2013) SnapShot: transcription regulation: pausing. Cell 153: 930.e931 [DOI] [PubMed] [Google Scholar]
- 18. Hsin JP, Manley JL (2012) The RNA polymerase II CTD coordinates transcription and RNA processing. Genes Dev 26: 2119–2137 [DOI] [PMC free article] [PubMed] [Google Scholar]
- 19. Adelman K, Lis JT (2012) Promoter‐proximal pausing of RNA polymerase II: emerging roles in metazoans. Nat Rev Genet 13: 720–731 [DOI] [PMC free article] [PubMed] [Google Scholar]
- 20. Sans M, Levin RS, Lipp JJ, Wang VY‐F, Greifenberg AK, Quezada EM, Ali A, Ghosh A, Larochelle SP, Rana TM et al (2016) P‐TEFb regulation of transcription termination factor Xrn2 revealed by a chemical genetic screen for Cdk9 substrates. Genes Dev 30: 117–131 [DOI] [PMC free article] [PubMed] [Google Scholar]
- 21. Legube G, Linares LK, Lemercier C, Scheffner M, Khochbin S, Trouche D (2002) Tip60 is targeted to proteasome‐mediated degradation by Mdm2 and accumulates after UV irradiation. EMBO J 21: 1704–1712 [DOI] [PMC free article] [PubMed] [Google Scholar]
- 22. Col E, Caron C, Chable‐Bessia C, Legube G, Gazzeri S, Komatsu Y, Yoshida M, Benkirane M, Trouche D, Khochbin S (2005) HIV‐1 Tat targets Tip60 to impair the apoptotic cell response to genotoxic stresses. EMBO J 24: 2634–2645 [DOI] [PMC free article] [PubMed] [Google Scholar]
- 23. Sánchez‐Molina S, Estarás C, Oliva JL, Akizu N, Asensio‐Juan E, Rojas JM, Martínez‐Balbás MA (2014) Regulation of CBP and Tip60 coordinates histone acetylation at local and global levels during Ras‐induced transformation. Carcinogenesis 35: 2194–2202 [DOI] [PubMed] [Google Scholar]
- 24. Jeong KW, Kim K, Situ AJ, Ulmer TS, An W, Stallcup MR (2011) Recognition of enhancer element–specific histone methylation by TIP60 in transcriptional activation. Nat Struct Mol Biol 18: 1358–1365 [DOI] [PMC free article] [PubMed] [Google Scholar]
- 25. Ginsburg DS, Anlembom TE, Wang J, Patel SR, Li B, Hinnebusch AG (2014) NuA4 links methylation of histone H3 lysines 4 and 36 to acetylation of histones H4 and H3. J Biol Chem 289: 32656–32670 [DOI] [PMC free article] [PubMed] [Google Scholar]
- 26. Krumm A, Meulia T, Brunvand M, Groudine M (1992) The block to transcriptional elongation within the human c‐myc gene is determined in the promoter‐proximal region. Genes Dev 6: 2201–2213 [DOI] [PubMed] [Google Scholar]
- 27. Strobl LJ, Eick D (1992) Hold back of RNA polymerase II at the transcription start site mediates down‐regulation of c‐myc in vivo . EMBO J 11: 3307–3314 [DOI] [PMC free article] [PubMed] [Google Scholar]
- 28. Zhao H, Jin S, Gewirtz AM (2012) The histone acetyltransferase TIP60 interacts with c‐Myb and inactivates its transcriptional activity in human leukemia. J Biol Chem 287: 925–934 [DOI] [PMC free article] [PubMed] [Google Scholar]
- 29. Itzen F, Greifenberg AK, Bösken CA, Geyer M (2014) Brd4 activates P‐TEFb for RNA polymerase II CTD phosphorylation. Nucleic Acids Res 42: 7577–7590 [DOI] [PMC free article] [PubMed] [Google Scholar]
- 30. Doyon Y, Selleck W, Lane WS, Tan S, Côté J (2004) Structural and functional conservation of the NuA4 histone acetyltransferase complex from yeast to humans. Mol Cell Biol 24: 1884–1896 [DOI] [PMC free article] [PubMed] [Google Scholar]
- 31. Patel JH, Du Y, Ard PG, Phillips C, Carella B, Chen CJ, Rakowski C, Chatterjee C, Lieberman PM, Lane WS et al (2004) The c‐MYC oncoprotein is a substrate of the acetyltransferases hGCN5/PCAF and TIP60. Mol Cell Biol 24: 10826–10834 [DOI] [PMC free article] [PubMed] [Google Scholar]
- 32. Rahman S, Sowa ME, Ottinger M, Smith JA, Shi Y, Harper JW, Howley PM (2011) The Brd4 extraterminal domain confers transcription activation independent of pTEFb by recruiting multiple proteins, including NSD3. Mol Cell Biol 31: 2641–2652 [DOI] [PMC free article] [PubMed] [Google Scholar]
Associated Data
This section collects any data citations, data availability statements, or supplementary materials included in this article.
Supplementary Materials
Expanded View Figures PDF
Source Data for Expanded View
Review Process File
Source Data for Figure 1
Source Data for Figure 2
Source Data for Figure 3
Source Data for Figure 4
Source Data for Figure 5