

Abstract
The transcriptional co‐activator YAP controls cell proliferation, survival, and tissue regeneration in response to changes in the mechanical environment. It is not known how mechanical stimuli such as tension are sensed and how the signal is transduced to control YAP activity. Here, we show that the LIM domain protein TRIP6 acts as part of a mechanotransduction pathway at adherens junctions to promote YAP activity by inhibiting the LATS1/2 kinases. Previous studies showed that vinculin at adherens junctions becomes activated by mechanical tension. We show that vinculin inhibits Hippo signaling by recruiting TRIP6 to adherens junctions and stimulating its binding to and inhibition of LATS1/2 in response to tension. TRIP6 competes with MOB1 for binding to LATS1/2 thereby blocking MOB1 from recruiting the LATS1/2 activating kinases MST1/2. Together, these findings reveal a novel pathway that responds to tension at adherens junctions to control Hippo pathway signaling.
Keywords: adherens junctions, mechano‐sensing, TRIP6, Vinculin, YAP
Subject Categories: Cell Adhesion, Polarity & Cytoskeleton; Post-translational Modifications, Proteolysis & Proteomics; Signal Transduction
Introduction
Tissue architecture and mechanical forces are major regulators of cell proliferation, and they play important roles during development, organ growth, and tissue regeneration 1, 2, 3. The cytoskeleton, extracellular matrix, and cell–cell adhesion are critical for transmitting force between cells and across tissues 4. The Hippo signaling pathway is a major regulator of cellular responses to mechanical inputs 5, 6. The core Hippo pathway 7 consists of two kinase modules: The first includes several Ste20‐superfamily kinases (MST1/2 are the best characterized), which phosphorylate and activate the LATS1/2 kinases. MST1/2 phosphorylation of LATS1/2 is mediated by MOB1, which promotes association of MST1/2 with LATS1/2. LATS1/2 then phosphorylate and inhibit the transcriptional co‐activator YAP (and its homolog TAZ) by causing it to be sequestered in the cytoplasm or degraded. When in the nucleus, YAP associates with transcription factor TEAD to upregulate genes responsible for survival, proliferation, and stem cell maintenance. The growth‐promoting properties of YAP are frequently co‐opted by cancer cells, in which YAP is often activated and overexpressed 8. Although the activity of both LATS1/2 and YAP is clearly regulated by mechanical inputs, how those inputs are sensed and the signals are transduced remain obscure.
Experiments in Drosophila and mammalian cells revealed that Hippo pathway regulation of YAP is controlled by mechanical tension 9, 10, 11, 12. When cells experience high mechanical tension, YAP localizes to the nucleus and promotes cell proliferation. Conversely, low tension causes YAP to exit the nucleus and cells to arrest growth. Transmission of tension across tissues requires cell–cell adhesion such as that provided by cadherins 13. Tension experienced by cells can be generated by the cells themselves through actomyosin stress fibers or by externally imposed stretch or force 6. Studies in Drosophila indicate that tension within tissues decreases as cell density increases, and hence, tension sensing could contribute to density‐dependent inhibition of cell growth, a property that is typically lost in cancer cells 9. Perturbation of stress fibers, externally applied stretch, and cell density all modulate LATS1/2 activity and YAP activity; however, the sensors and transduction pathways are not known. In Drosophila, the LIM domain protein Ajuba inhibits Warts (the LATS1/2 homolog) and recruits it to adherens junctions in a tension‐dependent manner 9. The mechanism by which Ajuba regulates Warts activity is not clearly understood. Although Zyxin and Ajuba LIM domain proteins have been shown to interact with LATS1/2 in mammalian cells 14, 15, 16, it is unclear whether Ajuba/Zyxin‐related proteins function similarly in mammals 10, 17, 18, 19. Here, we show that the human LIM domain protein TRIP6 acts as part of a mechanotransduction cascade at adherens junctions to regulate LATS1/2 in response to mechanical tension at cell–cell junctions.
Results
TRIP6 activates YAP through inhibition of LATS1/2
Although TRIP6 is overexpressed in various cancers where it promotes proliferation and invasion 20, 21, 22, prior studies had not connected TRIP6 to the Hippo signaling pathway. We previously identified TRIP6 as one of several LATS2 binding partners using tandem affinity purification and mass spectrometry 23. Here, to validate the LATS2‐TRIP6 interaction, we performed co‐immunoprecipitation experiments. LATS2 was pulled down in TRIP6 immunoprecipitates when both proteins were overexpressed (Fig 1A). In addition, endogenous LATS1 was present in TRIP6 immune complexes isolated from MCF10A cells (Fig 1B). Like its related family members (Zyxin, LPP, Ajuba, WTIP, and LIMD1), the carboxy‐terminal half of TRIP6 consists of three conserved LIM domains (Fig 1A). Truncation experiments showed that LATS2 binding maps to the C‐terminal LIM domain half of TRIP6 (Fig 1A). We next tested which parts of LATS2 interacted with TRIP6. TRIP6 bound to the N‐terminal region of LATS2 and specifically interacted with two segments (amino acids 376–397 and 625–644) (Fig 1C) previously identified to interact with Ajuba and Zyxin 14, 15.
Figure 1. TRIP6 promotes YAP activity by inhibiting LATS1/2.
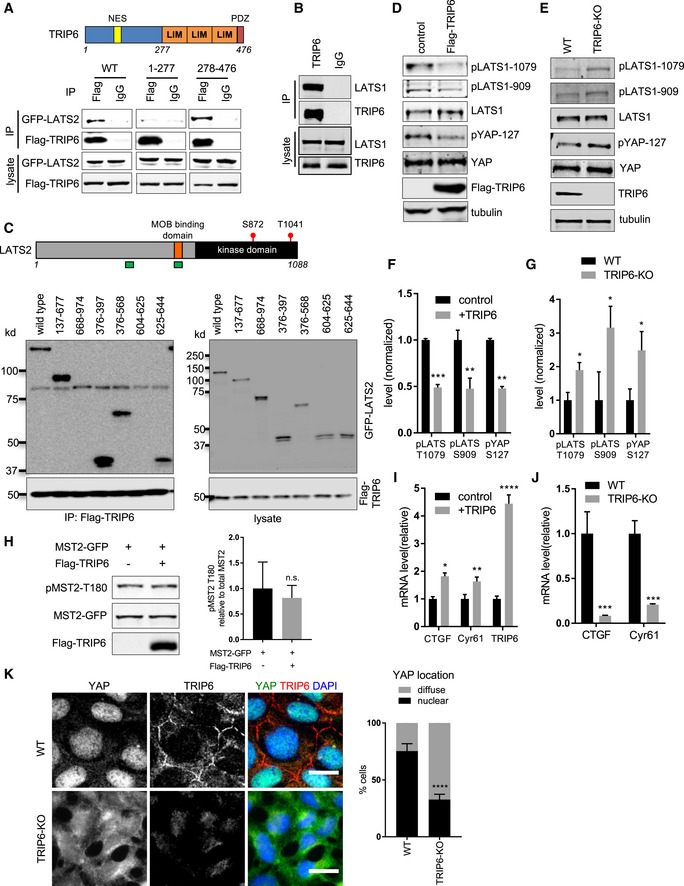
- Full‐length (WT), the amino‐terminal half (1–277), or the carboxy‐terminal half (278–476) of TRIP6 were tested for binding to LATS2 by immunoprecipitation. FLAG‐TRIP6 variants were co‐expressed with LATS2‐GFP in HEK293 cells; anti‐FLAG or control (IgG) antibodies were used to isolate immune complexes. Immune complexes and lysates were probed by Western blotting for LATS2‐GFP and FLAG‐TRIP6. Schematic diagram depicts TRIP6 domains (NES: nuclear export signal; LIM: LIM domain; PDZ: PDZ domain binding motif).
- Lysates from MCF10A cells were subjected to immunoprecipitation using anti‐TRIP6 or control (IgG) antibodies, and immune complexes and lysates were probed for TRIP6 and LATS1.
- FLAG‐TRIP6 was tested for binding to various LATS2‐GFP deletion mutants as described in part (A). Schematic diagram of LATS2 shows MOB1 binding domain, and the autophosphorylation (S872) and MST1/2 phosphorylation sites (T1041) in the kinase domain. The regions marked in green depict TRIP6 binding sites on LATS2.
- Lysates from HEK293A cells transfected with control or FLAG‐TRIP6 plasmid were analyzed by Western blotting using the indicated antibodies (quantification is shown in panel F).
- Lysates from control (WT) or CRISPR generated TRIP6 null (TRIP6‐KO) HEK293A cells were analyzed by Western blotting using the indicated antibodies (quantification shown in panel G).
- The relative levels of LATS1 activating phosphorylation (pLATS1‐1079, 909) and YAP S127 inhibitory phosphorylation from (D) were measured relative to LATS1 and YAP levels, respectively (mean ± SD; n = 3; **P ≤ 0.01, ***P ≤ 0.001, t‐test).
- The levels of LATS1 activating phosphorylation and YAP inactivating phosphorylation from part (E) were quantified (mean ± SD; n = 3; *P ≤ 0.05, t‐test).
- GFP‐MST2 was expressed with or without FLAG‐TRIP6 in HEK293 cells, and the levels of MST2, MST2 activating phosphorylation (pMST2‐T180), and FLAG‐TRIP6 were measured by Western blotting with the indicated antibodies (mean ± SD; n = 3; n.s. ≥ 0.05, t‐test).
- TRIP6 was overexpressed in HEK293A cells, and the levels of TRIP6 and YAP target gene expression were analyzed using RT–qPCR (mean ± SD; n = 3; *P ≤ 0.05, **P ≤ 0.01, ****P ≤ 0.0001, t‐test).
- The levels of YAP target gene expression were analyzed using RT–qPCR in control (WT) and TRIP6‐KO HEK293A cells (mean ± SD; n = 3; ***P ≤ 0.001, t‐test).
- Control (WT) and TRIP6‐KO HEK293A cells were stained for YAP and TRIP6. Merged image shows YAP (green), TRIP6 (red), and DNA (blue). Quantification of at least 100 cells is shown (mean ± SD; n = 3; ****P ≤ 0.0001, Fisher's test). Scale bar = 20 μm.
To determine whether TRIP6 regulates LATS1/2 activity, we examined the effects of TRIP6 overproduction and loss of function. Overexpression of TRIP6 in HEK293A cells reduced endogenous LATS1/2 activity as judged by probing the two sites of activating phosphorylation on LATS1/2, T1079, and S909 (for LATS1, T1041 and S872 for LATS2; Fig 1D and F) (note that T1079 is phosphorylated by MST1/2 and S909 is an autophosphorylation site). In contrast, TRIP6 overexpression did not affect MST2 activating phosphorylation (Fig 1H), suggesting that TRIP6 may regulate the ability of LATS1/2 to be phosphorylated by MST1/2. CRISPR‐mediated deletion of TRIP6 (TRIP6‐KO) in HEK293A cells (Fig 1E and G) or shRNA‐mediated knockdown of TRIP6 in MCF10A cells (Fig EV1A) increased LATS1/2 activating phosphorylation levels. Together these results show that TRIP6 acts to inhibit LATS1/2 activity.
Figure EV1. TRIP6 knockdown in MCF10A cells activates Hippo signaling, and TRIP6‐KO knockout cells are rescued by FLAG‐TRIP6 expression.
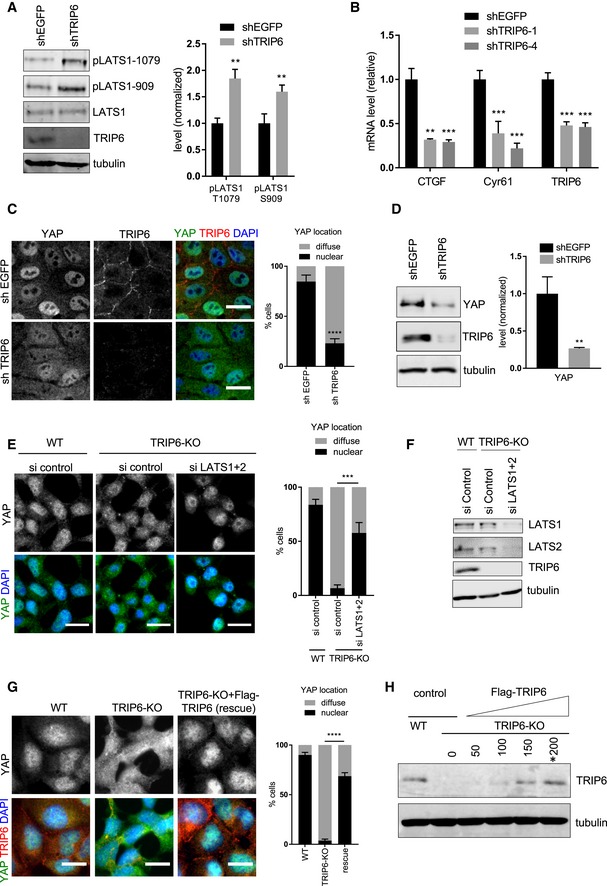
- Lysates from MCF10A cells infected with lentivirus with a control shRNA (shEGFP) or a mix of two different shRNA against TRIP6 (shTRIP6‐1 and shTRIP6‐4) were analyzed by Western blotting using the indicated antibodies, and the levels of LATS1 activating phosphorylation were quantified (mean ± SD; n = 3; **P ≤ 0.01, t‐test).
- MCF10A cells were infected with lentivirus carrying control shRNA (shEGFP), or two different shRNA against TRIP6 (shTRIP6‐1, shTRIP6‐4) and the levels of TRIP6 and YAP target gene expression were analyzed using RT–qPCR (mean ± SD; n = 3; **P ≤ 0.01, ***P ≤ 0.001, t‐test).
- MCF10A cells were infected with lentivirus carrying control shRNA (shEGFP), or a mix of two different shRNA against TRIP6 (shTRIP6‐1 and shTRIP6‐4) and were stained for YAP and TRIP6. Merged image shows YAP (green), TRIP6 (red), and DNA (blue). Quantification of YAP nuclear localization in least 100 cells is shown (mean ± SD; n = 3; ****P ≤ 0.0001, Fisher's test). Scale bar = 20 μm.
- YAP, TRIP6, and tubulin levels were measured by Western blotting in MCF10A cells infected with lentivirus carrying control shRNA (shEGFP), or shRNA against TRIP6 (shTRIP6‐1) (mean ± SD; n = 3; **P ≤ 0.01, t‐test).
- LATS1 and LATS2 were depleted from WT and TRIP6‐KO 293A cells using siRNA as described (Fig 3B) and were stained for YAP. Merged image shows YAP (green) and DNA (blue). Quantification of YAP nuclear localization in least 100 cells is shown (mean ± SD; n = 3; ***P ≤ 0.001, Fisher's test). Scale bar = 20 μm.
- The lysates from (E) were probed by Western blotting with LATS1, LATS2, TRIP6, and tubulin antibodies to test knockdown efficacy.
- Control (WT) and TRIP6‐KO HEK293A cells were transfected with 200 ng of control and FLAG‐TRIP6 plasmids. (Note that 200 ng of FLAG‐TRIP6 plasmid restores approximate wild‐type levels (see panel H) of TRIP6 expression). After 48 h of transfection, cells were stained using anti‐YAP and TRIP6 antibodies by immunofluorescence. Quantification of YAP nuclear localization is shown (mean ± SD; n = 3; ****P ≤ 0.0001, Fisher's test). Scale bar = 20 μm. We compare TRIP6‐KO cells to TRIP6‐KO cells rescued by FLAG‐TRIP6 plasmid (rescue).
- Different amounts (50, 100, 150, 200 ng) of FLAG‐TRIP6 plasmid were transfected into HEK293A TRIP6‐KO cells and TRIP6 levels in lysates were analyzed by Western blotting using anti‐TRIP6 antibodies and compared to those in control HEK293A (WT) cells. 200 ng of FLAG‐TRIP6 plasmid (marked with asterisk) was selected to perform the rescue experiment described in panel (G).
Because LATS1/2 phosphorylate and inhibit YAP nuclear localization, stability, and activity, we tested the effect of modulating TRIP6 levels on YAP. Overexpression of TRIP6 in HEK293A cells inhibited LATS1/2 phosphorylation of YAP on S127 (Fig 1D and F) and increased expression of YAP target genes (Fig 1I). In contrast, reduced levels of TRIP6 inhibited YAP function. Specifically, shRNA‐mediated knockdown of TRIP6 in MCF10A cells reduced expression of YAP target genes (Fig EV1B) and diminished YAP nuclear localization (Fig EV1C). These cells also had reduced levels of YAP protein (Fig EV1D), presumably caused by LATS1/2 phosphorylation‐dependent degradation 24, 25. TRIP6‐KO HEK293A cells showed increased YAP S127 phosphorylation (Fig 1E and G), reduced expression of YAP target genes (Fig 1J), and reduced YAP nuclear localization (Fig 1K). Consistent with TRIP6 acting through LATS1/2 to affect YAP localization, depletion of LATS1/2 by siRNA in TRIP6‐KO cells restored YAP nuclear localization (Fig EV1E and F). Our observation that MCF10A, but not HEK293A, cells had reduced levels of YAP when TRIP6 was depleted (or eliminated) may reflect cell‐type differences in YAP degradation in response to LATS1/2‐dependent phosphorylation. The TRIP6‐KO HEK293A cells also displayed a defect in cell–cell adhesion as judged by the presence of frequent gaps between cells even at high density that were not observed in parental HEK293A cells (Figs 1K and EV1G). The cell–cell adhesion and YAP localization defect in TRIP6‐KO HEK293A cells was rescued by re‐expression of TRIP6 (Fig EV1G and H). MCF10A cells knocked down for TRIP6 with shRNA did not show obvious cell–cell adhesion defects or changes in E‐cadherin staining (Fig EV4C), perhaps due to cell‐type differences or the presence of residual TRIP6. Overall, these results show that TRIP6 inhibition of LATS1/2 promotes YAP activity.
Figure EV4. Regulation of TRIP6 and LATS1 localization in HEK293A cells and E‐cadherin staining in MCF10A cells after various treatments, TRIP6, LATS1 and 2, and vinculin knockdown.
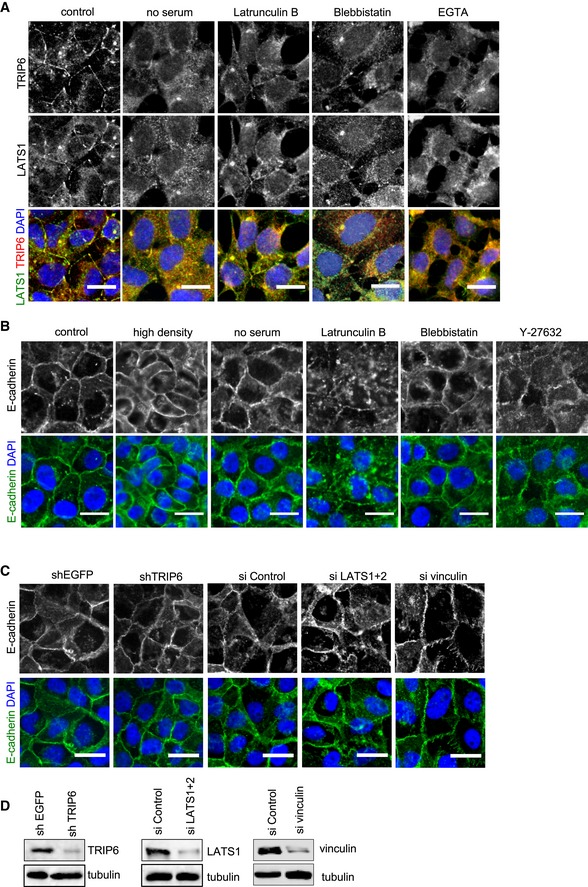
- HEK293A cells were either not treated (control) or treated separately by serum starvation (no serum), Latrunculin B, Blebbistatin, and EGTA, and then TRIP6 and LATS1 intracellular localization were determined by immunofluorescence using anti‐TRIP6 and anti‐LATS1 antibodies. Scale bar = 20 μm.
- MCF10A cells were either not treated (control) or treated separately by growth to high density, serum starvation, Latrunculin B, Blebbistatin, or Y27632 treatment, and stained using anti‐E‐cadherin antibodies by immunofluorescence. Scale bar = 20 μm.
- The lysates from (C) were probed by Western blotting for LATS1, TRIP6, and vinculin antibodies to test knockdown efficacy.
TRIP6 inhibits LATS1/2 by blocking binding to MOB1
We next investigated the mechanism for how TRIP6 inhibits LATS1/2. TRIP6‐related LIM domain proteins have been shown to bind and inhibit LATS [9,14, 15, 16,26,27]; however, it is not clear how they regulate LATS1/2 activity. Although Zyxin was shown to promote degradation of LATS1/2 in response to hypoxia 17, we did not observe any changes in LATS1 levels when TRIP6 levels were altered suggesting that TRIP6 uses a different mechanism. Because one of the TRIP6 binding sites in LATS2 (amino acids 625–644) overlaps with the binding site for its activator MOB1 (amino acids 595–662) 28, we wondered if TRIP6 and MOB1 compete for binding to LATS1/2. This mechanism would be consistent with our observations that TRIP6 inhibits the ability of MST1/2 to phosphorylate LATS1/2, because MOB1 activates LATS1/2 by promoting its association with and phosphorylation by MST1/2 28. We first examined whether TRIP6 could inhibit LATS1/2‐MOB1 binding in vivo. We found that overexpression of full‐length TRIP6 (but not a version of TRIP6 (1–277) lacking the LATS1/2 binding LIM domains) reduced LATS2‐MOB1A association in HEK293 cells (Fig 2A). To determine whether TRIP6 directly competes with MOB1A for binding to LATS2, competition experiments were carried out using purified recombinant proteins. Initial results demonstrated that GST‐TRIP6 bound directly to MBP‐LATS2 but not MBP alone (Fig 2B, compare lanes 1 and 3). Competition experiments showed that MOB1A could compete with TRIP6 for binding to LATS2. 6HIS‐MOB1A bound to MBP‐LATS2 and inhibited GST‐TRIP6 binding, with the highest levels of MOB1A reducing TRIP6‐LATS2 binding to background levels (Fig 2B, lanes 3–6). Addition of non‐specific competitor (BSA), at the same level as the highest amount of MOB1A used (Fig EV2), did not cause any reduction in TRIP6‐LATS2 binding (Fig 2B, lane 7). Together, these results show that TRIP6 and MOB1 compete for binding to LATS2 and that TRIP6 likely inhibits LATS1/2 activity at least in part by blocking MOB1 binding.
Figure 2. TRIP6 competes with MOB1 for binding to LATS2.
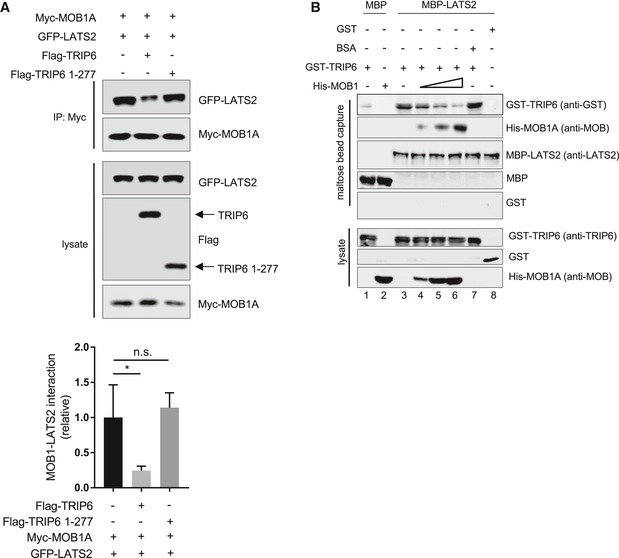
- LATS2‐GFP and Myc‐MOB1A were overexpressed in HEK293 cells with or without co‐overexpression of full‐length FLAG‐TRIP6 and FLAG‐TRIP6 1–277. Myc‐MOB1A was immunoprecipitated using anti‐Myc antibodies, and immune complexes were assayed for Myc‐MOB1A and LATS2‐GFP levels. Levels of FLAG‐TRIP6, FLAG‐TRIP6 1–277, Myc‐MOB1A, and LATS2‐GFP in the lysate are also shown. The levels of LATS2‐GFP in immune complexes relative to the level of Myc‐MOB1A are shown in the graph (mean ± SD; n = 3; **P ≤ 0.01, t‐test).
- Competitive binding experiments were done using purified recombinant MBP‐LATS2, GST‐TRIP6, and 6His‐MOB1A. MBP‐LATS2 bound to maltose beads was incubated with GST‐TRIP6 with or without increasing amounts of 6His‐MOB1A, and the levels of each protein bound to MBP‐LATS2 on the beads at the end of the experiment were determined by Western blotting. The levels of input proteins are shown (lysate). The binding of 6His‐MOB1A and GST‐TRIP6 to MBP alone, and the use BSA as a competitor instead of 6His‐MOB1A are shown as controls. The numbers at the bottom are referred to in the text.
Figure EV2. Levels of BSA and MOB1A.
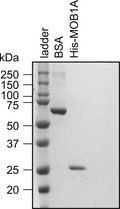
Coomassie‐stained gel showing the amounts of BSA and highest amount of HIS‐MOB1A used in Fig 2B.
TRIP6 modulates LATS1/2 activity and localization in response to tension at cell–cell junctions
To investigate what regulatory inputs might control TRIP6 inhibition of LATS1/2, we examined the localization of each protein. Endogenous TRIP6 and LATS1 co‐localize to cell–cell junctions in MCF10A (Figs 3A and EV3A) and to a lesser extent in HEK293A (Fig EV3B) cells. Although we have been unable to find LATS2 antibodies capable of detecting the endogenous protein, GFP‐LATS2 fusions also localize to cell–cell junctions 23. TRIP6 has been previously reported to localize to both cell–cell junctions (adherens junctions) 29 and to focal adhesions 30, 31. Although we could faintly observe TRIP6 at focal adhesions in MCF10A cells at low density or at the edge of monolayers, at densities typically used in this study (confluent but still proliferating), TRIP6 was primarily at adherens junctions, and we saw little focal adhesion staining for TRIP6 or the focal adhesion marker FAK (Fig EV3C). LATS1 was not observed at focal adhesions in MCF10A cells at any density (data not shown). We next assessed the mutual dependence of LATS1 and TRIP6 localization. Knockdown of TRIP6 in MCF10A cells (Figs 3A and EV3D) reduced localization of LATS1 to cell junctions. Deletion of TRIP6 in HEK293A cells (Fig EV3B) also caused reduced localization of LATS1 to cell–cell junctions, although because of the reduced cell–cell adhesion in these cells, it is possible that effects on LATS1 localization could be due to defects in cell–cell junctions. When LATS1/2 were knocked down (depleted) in MCF10A cells, TRIP6 remained at cell–cell junctions (Figs 3B and EV3E), but its localization was more punctate and less smooth, possibly reflecting a transition to a more mesenchymal state 32. E‐cadherin staining in TRIP6 and LATS1/2 knockdown cells looked similar to that in control cells (Fig EV4C) suggesting that cell–cell adhesion remains intact, but we cannot rule out more subtle effects on junction architecture. Together, these results show that TRIP6 is important for LATS1/2 localization to cell junctions.
Figure 3. TRIP6‐LATS binding and localization to cell–cell junctions are regulated by tension.
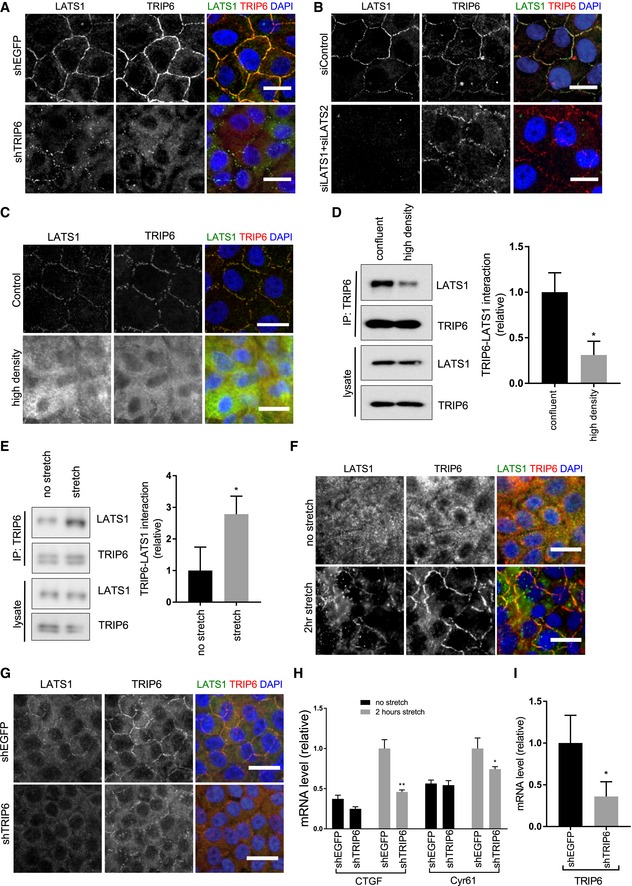
- MCF10A cells were infected with lentivirus carrying control shRNA (shEGFP), or a mix of two different shRNA against TRIP6 (shTRIP6‐1 and shTRIP6‐4) and were stained for TRIP6 and LATS1. Merged images show LATS1 (green), TRIP6 (red) and DNA (blue) (quantification of LATS1 localization at cell–cell junctions is shown in Fig EV3D). Scale bar = 20 μm.
- LATS1 and LATS2 were knocked down using siLATS1 and siLATS2 SMARTPools in MCF10A cells. MCF10A control cells were treated with control siRNA (siControl) against firefly luciferase. Cells were stained for TRIP6 and LATS1 as in (A) (quantification of TRIP6 localization at cell–cell junctions is shown in Fig EV3E). Scale bar = 20 μm.
- MCF10A cells were grown to high density and were stained for TRIP6 and LATS1 as in (A). Scale bar = 20 μm.
- Cells were grown as in (C) and then lysed, and anti‐TRIP6 antibodies were used to isolate immune complexes. Immune complexes and lysates were probed by Western blotting for LATS1 and TRIP6. Quantification is shown (mean ± SD; n = 3; *P ≤ 0.05, t‐test).
- MCF10A cells grown at high density on PDMS membranes and were stretched (or not) at 17% elongation for 2 h and lysed while under tension. Anti‐TRIP6 antibodies were used to isolate immune complexes. Immune complexes and lysates were probed by Western blotting for LATS1 and TRIP6. Quantification is shown (mean ± SD; n = 3; *P ≤ 0.05, t‐test).
- Cells were treated as in (E), fixed while under tension, and stained for TRIP6 and LATS1 as in (A). Scale bar = 20 μm.
- MCF10A cells infected with lentivirus carrying control shRNA (shEGFP), or a mix of two different shRNA against TRIP6 (shTRIP6‐1 and shTRIP6‐4), were grown at high density on PDMS membranes and were stretched or not (only stretched cells shown) at 17% elongation for 2 h, fixed while under tension, and were stained for TRIP6 and LATS1 as in (A). Scale bar = 20 μm.
- Cells were treated as in (G) and YAP target gene (CTGF and Cyr61) and TRIP6 expression were analyzed using RT–qPCR (mean ± SD; n = 3; *P ≤ 0.05, **P ≤ 0.01, t‐test).
- TRIP6 expression levels in (H) in control (shEGFP) and TRIP6 (shTRIP6) knockdown cells just prior to stretch were analyzed using RT–qPCR (mean ± SD; n = 3; *P ≤ 0.05, t‐test).
Figure EV3. Regulation of TRIP6 and LATS1 localization and binding.
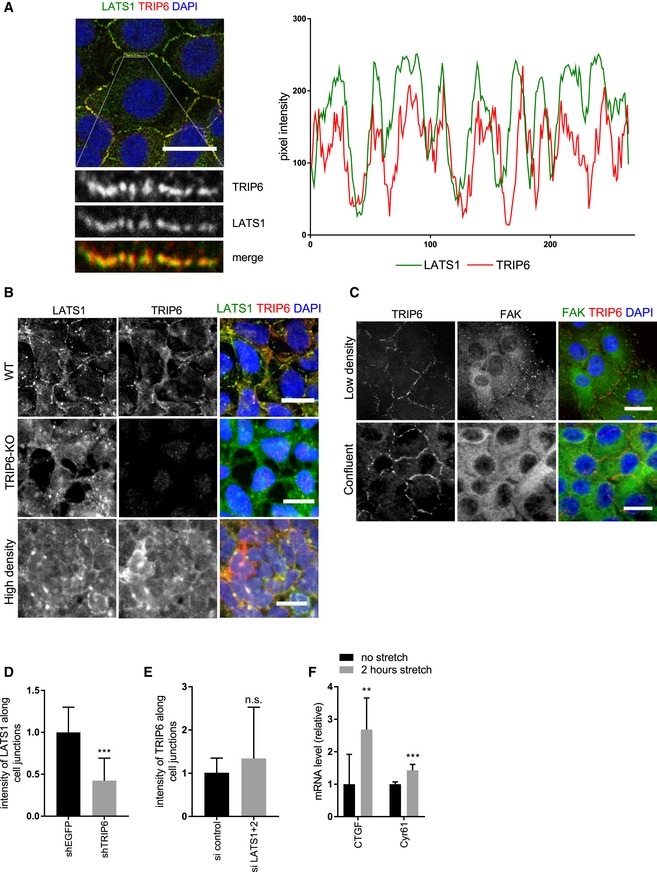
- MCF10A cells were stained for TRIP6 and LATS1, and the image was acquired with a confocal microscope. Merged images show LATS1 (green), TRIP6 (red), and DNA (blue). Scale bar = 20 μm. The LATS1‐TRIP6 co‐localization was confirmed by line scan analysis of the pixel intensity in different fluorescent channels.
- HEK293A cells (WT and TRIP6‐KO) were grown, and TRIP6 and LATS1 intracellular localization were determined by immunofluorescence using anti‐TRIP6 and anti‐LATS1 antibodies. HEK293A (WT) cells were also grown at high density (High density) and treated similarly. Scale bar = 20 μm.
- MCF10A cells were grown at low density and until confluency and stained for TRIP6 and FAK. Merged images show FAK (green), TRIP6 (red), and DNA (blue). Scale bar = 20 μm.
- Quantification of LATS1 at cell–cell junctions in MCF10A cells depleted of TRIP6 (see Fig 3A). Intensity of LATS1 was measured at individual cell–cell junctions (n ≥ 48) (mean ± SD; n = 3; ***P ≤ 0.001, t‐test).
- Quantification of TRIP6 at cell–cell junctions in MCF10A cells depleted of LATS1 and LATS2 (see Fig 3B). Average intensity of TRIP6 was measured at individual cell–cell junctions (n ≥ 48) (mean ± SD; n = 3; n.s. ≥ 0.05, t‐test).
- MCF10A cells grown at high density on PDMS membranes and were stretched (or not) at 17% elongation for 2 h; RNA was isolated, and YAP target gene expression was analyzed using RT–qPCR (mean ± SD; n = 3; **P ≤ 0.01, ***P ≤ 0.001, t‐test).
We next examined whether recruitment of TRIP6 and LATS1 to cell junctions is regulated by stimuli that control LATS1/2 activity. Both TRIP6 and LATS1 localized to cell–cell junctions in cells that were confluent but still proliferating. However, in highly dense non‐proliferating cells TRIP6 and LATS1 no longer localized to cell–cell junctions (Figs 3C and EV3B), despite unchanged levels of both proteins (Fig 3D), and cell–cell junctions remaining intact as judged by E‐cadherin staining (Fig EV4B). Interestingly, we also observed a reduction in TRIP6‐LATS1 binding in MCF10A cells at high cell density (Fig 3D), consistent with the increased LATS1/2 activity observed under these conditions 33. How cell density controls TRIP6‐LATS1/2 binding and localization is not clear. However, a study in Drosophila tissue showed that tension at cell–cell junctions is reduced as cell density increases 9. Therefore, we tested whether increasing tension at cell–cell junctions in dense cultures would restore localization of TRIP6 and LATS1 to cell–cell junctions. To do this, we examined TRIP6 and LATS1 localization in dense cultures grown on flexible PDMS substrates before and after static stretch for 2 h. We observed that stretch increased TRIP6‐LATS1 binding (Fig 3E), localization of both proteins to cell–cell junctions (Fig 3F), and YAP activity (Fig EV3F). Both tension‐dependent recruitment of LATS1 to cell–cell junctions and YAP activation in dense monolayers following stretch depended on TRIP6 (Fig 3G and H). Together, these results show that tension can trigger YAP activation through TRIP6 by increasing TRIP6 recruitment to cell–cell junctions, and TRIP6 binding to LATS1.
We also tested whether loss of tension across confluent (but not dense) monolayers of cells could trigger loss of LATS1‐TRIP6 binding and co‐localization at cell–cell junctions. Treatments that inhibit stress fibers such as type II myosin inhibition (Blebbistatin), Rho kinase inhibition (Y27632), or serum starvation are known to reduce tension at cell junctions 34. All of these treatments inhibited both LATS1‐TRIP6 binding and cell–cell junction localization, as did complete elimination of F‐actin using Latrunculin B (Figs 4A–C and EV4A). These treatments (with the exception of Latrunculin B) did not obviously affect cell–cell adhesion and E‐cadherin localization (Fig EV4B). To reduce tension at cell junctions by blocking force transmission between cells, we disrupted cadherin complexes by treating cells with EGTA and found that this treatment also inhibited LATS1‐TRIP6 binding and localization to cell–cell junctions (Figs 4A–C and EV4A). Together, these observations suggest that TRIP6 responds to tension at cell–cell junctions to regulate LATS1 and YAP activity.
Figure 4. Perturbations of junctions and f‐actin reduce TRIP6‐LATS1 binding and localization to cell–cell junctions.
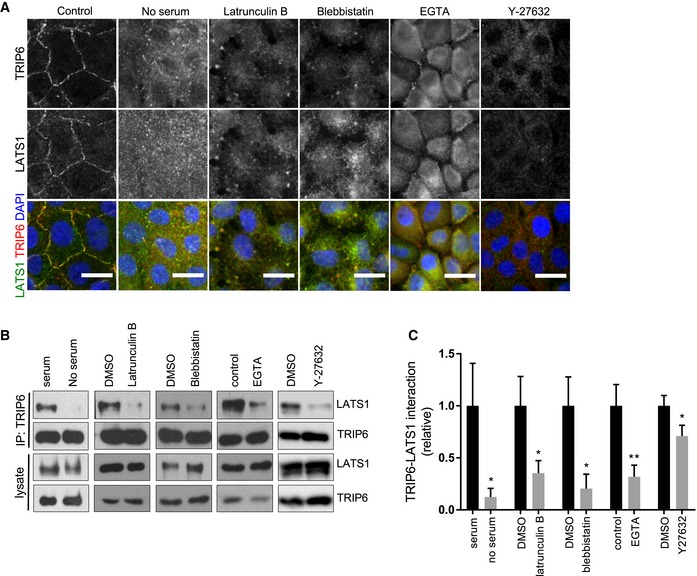
- MCF10A cells were either not treated or treated separately with Latrunculin B, Blebbistatin, EGTA, serum starvation, and Y27632 and were stained for TRIP6 and LATS1. Merged images show LATS1 (green), TRIP6 (red), and DNA (blue). Scale bar = 20 μm.
- Cells were treated as in (A) and then lysed, and anti‐TRIP6 antibodies were used to isolate immune complexes. Immune complexes and lysates were probed by Western blotting for LATS1 and TRIP6.
- Quantification of (B) is shown (mean ± SD; n = 3; *P ≤ 0.05, **P ≤ 0.01, t‐test).
TRIP6 is a part of the mechano‐responsive complex at adherens junctions
We next investigated whether TRIP6 could be part of a mechano‐responsive complex at cadherin–catenin‐based adherens junctions 35. Previous studies showed that TRIP6 localizes to adherens junctions, and its association with the cadherin complex is dependent on engagement between the extracellular domains of cadherins on neighboring cells 29. How TRIP6 interacts with the cadherin complex is not known. Interestingly, two high‐throughput two‐hybrid studies detected a binding interaction between TRIP6 and the adherens junction protein vinculin 36, 37 Consistent with the high‐throughput studies, we detected vinculin in TRIP6 immune complexes (Fig 5A). Vinculin and TRIP6 are known to respond to mechanical cues at focal adhesions 38, 39, 40. In addition, vinculin localizes to adherens junctions in response to mechanical tension 34, 41, 42, 43. To test whether vinculin was involved with TRIP6 in tension‐dependent regulation of Hippo signaling, we examined whether vinculin localization to cell–cell junctions in MCF10A cells was tension dependent and whether vinculin regulated Hippo signaling. As with TRIP6, we observed vinculin at focal adhesions in MCF10A cells at low density or at the edge of monolayers, but at densities used in this study (confluent but still proliferating), vinculin was concentrated at adherens junctions (Fig EV5A). Thus, we infer that TRIP6 is primarily interacting with vinculin at adherens junctions under these conditions. At high cell density, vinculin localization to adherens junctions was lost, but could be restored by stretch (Fig 5B and C), as observed for TRIP6 and LATS1. Also like TRIP6 and LATS1, treatments that disrupt tension in confluent but proliferating MCF10A cells reduce vinculin localization to cell–cell junctions (Fig 5B). To test whether vinculin regulated Hippo signaling, we knocked down vinculin using siRNA in MCF10A cells. Depletion of vinculin resulted in increased LATS1 and YAP phosphorylation (Fig 5D), and reduced YAP nuclear localization (Fig 5E) and activity (Fig 5F; as judged by reduction in YAP target genes CTGF and Cyr61). This same effect on YAP was observed using two different siRNAs (Fig EV5E and F). Like TRIP6, vinculin was required for stretch‐induced YAP‐dependent gene expression (Fig 5G). Knockdown of vinculin in HEK293A cells also reduced YAP activity (Fig EV5G), and this reduction could be rescued by expression of chicken vinculin (Fig EV5G and H). Together, these results show that vinculin interacts with TRIP6 and, like TRIP6, participates in tension‐dependent regulation of Hippo signaling.
Figure 5. Vinculin interacts with TRIP6 and regulates LATS and YAP activity.
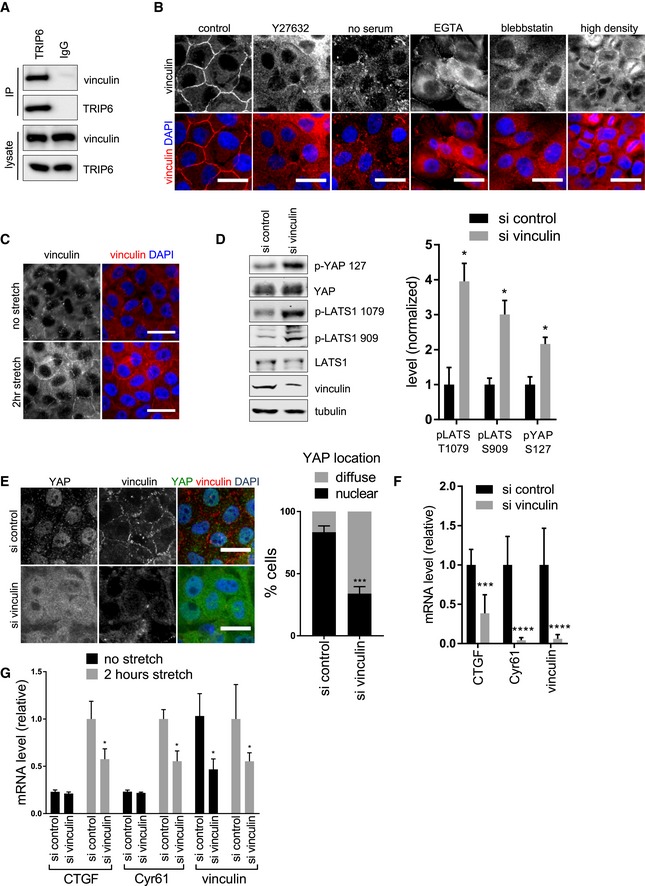
- MCF10A cells were lysed, and anti‐TRIP6 or control (IgG) antibodies were used to isolate immune complexes. Immune complexes and lysates were probed by Western blotting for vinculin and TRIP6.
- MCF10A cells were either not treated (control) or treated separately by growth to high density, serum starvation, Latrunculin B, Blebbistatin, EGTA, or Y27632 treatment and stained using anti‐vinculin antibodies by immunofluorescence. Scale bar = 20 μm.
- MCF10A cells grown at high density on PDMS membranes and were stretched (or not) at 17% elongation for 2 h and fixed while under tension and stained for vinculin. Scale bar = 20 μm.
- Vinculin was knocked down using two different siRNAs or control siRNA in MCF10A cells, and the cell lysates were probed by Western blotting for phospho‐LATS1 (T1079 and S909), phospho‐YAP (S127), LATS1, YAP, vinculin, and tubulin antibodies and the relative levels quantified (mean ± SD; n = 3; *P ≤ 0.05, t‐test).
- Vinculin was knocked down as described in (D), and cells were stained for YAP and vinculin. Merged image shows YAP (green), vinculin (red), and DNA (blue). Quantification of at least 100 cells is shown (mean ± SD; n = 3; ***P ≤ 0.001, Fisher's test). Scale bar = 20 μm.
- Vinculin was knocked down as described in (D), and the levels of vinculin and YAP target gene expression were analyzed using RT–qPCR (mean ± SD; n = 3; ***P ≤ 0.001, ****P ≤ 0.0001, t‐test).
- Vinculin was knocked down in MCF10A cells as described in (D), grown at high density on PDMS membranes and cells were stretched (or not) at 17% elongation for 2 h and the levels of vinculin and YAP target gene expression were analyzed using RT–qPCR (mean ± SD; n = 3; *P ≤ 0.05, t‐test).
Figure EV5. FAK and vinculin co‐staining in MCF10A cells, vinculin knockdown efficacy, LATS1 and vinculin co‐staining in MCF10A cells, effect of TRIP6 knockdown on vinculin, effect of vinculin knockdown by single siRNAs on YAP activity and localization and rescue of siRNA knockdown are shown.
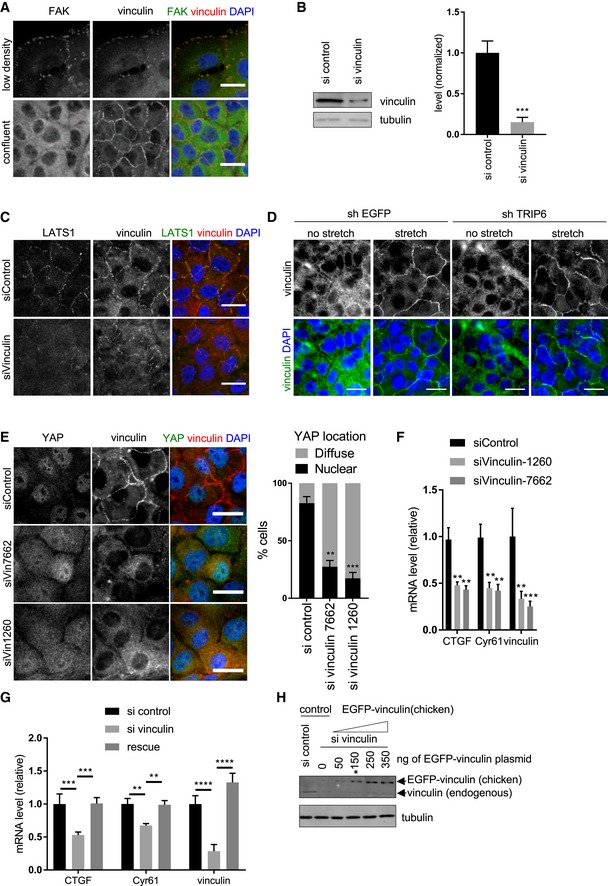
- MCF10A cells were grown at low density and until confluency and stained using FAK and vinculin antibodies by immunofluorescence. Scale bar = 20 μm.
- Vinculin was knocked down using two different stealth siRNAs in MCF10A cells. MCF10A control cells were treated with control siRNA. Lysates were probed by Western blotting for vinculin and tubulin. The levels of vinculin were determined (mean ± SD; n = 3; ***P ≤ 0.001, t‐test).
- Vinculin was knocked down as described in (B), and cells were stained using vinculin and LATS1 antibody. Merged images show LATS1 (green), vinculin (red), and DNA (blue). Scale bar = 20 μm.
- TRIP6 was depleted from MCF10A cells as described in Fig EV1A and grown at high density on PDMS membranes and that were stretched (or not) at 17% elongation for 2 h, fixed while under tension, and stained for vinculin. Merged images show vinculin (green) and DNA (blue). Scale bar = 20 μm.
- Vinculin was knocked down by single stealth siRNAs (7662 and 1260) in MCF10A cells and stained using vinculin and YAP antibody. Merged images show YAP (green), vinculin (red) and DNA (blue). Quantification of YAP nuclear localization in least 100 cells is shown (mean ± SD; n = 3; **P ≤ 0.01, ***P ≤ 0.001, Fisher's test). Scale bar = 20 μm.
- Vinculin was knocked down as described in (E) and the levels of vinculin, and YAP target gene expression was analyzed using RT–qPCR (mean ± SD; n = 3; **P ≤ 0.01, ***P ≤ 0.001, t‐test).
- Vinculin was knocked down as described (panel E) in HEK293A cells. Control and vinculin depleted HEK293A cells were transfected with 150 ng of control and EGFP‐vinculin (chicken) plasmids. (Note that 150 ng of EGFP‐vinculin plasmid restores approximate wild‐type levels (see panel H) of vinculin expression). After 48 h of transfection, the levels of vinculin, and YAP target gene expression was analyzed using RT–qPCR. We compare vinculin depleted cells to vinculin depleted cells rescued by EGFP‐vinculin (rescue) (mean ± SD; n = 3; **P ≤ 0.01, ***P ≤ 0.001, ****P ≤ 0.0001, t‐test).
- Vinculin was knocked down as described in Fig 5D in HEK293A cells. Different amounts (50, 150, 250, 350 ng) of EGFP‐vinculin plasmid were transfected into the vinculin depleted cells, and vinculin levels in lysates were analyzed by Western blotting using vinculin antibody and compared to those in control HEK293A cells. 150 ng of EGFP‐vinculin plasmid (marked with asterisk) was selected to perform the rescue experiment described (panel G).
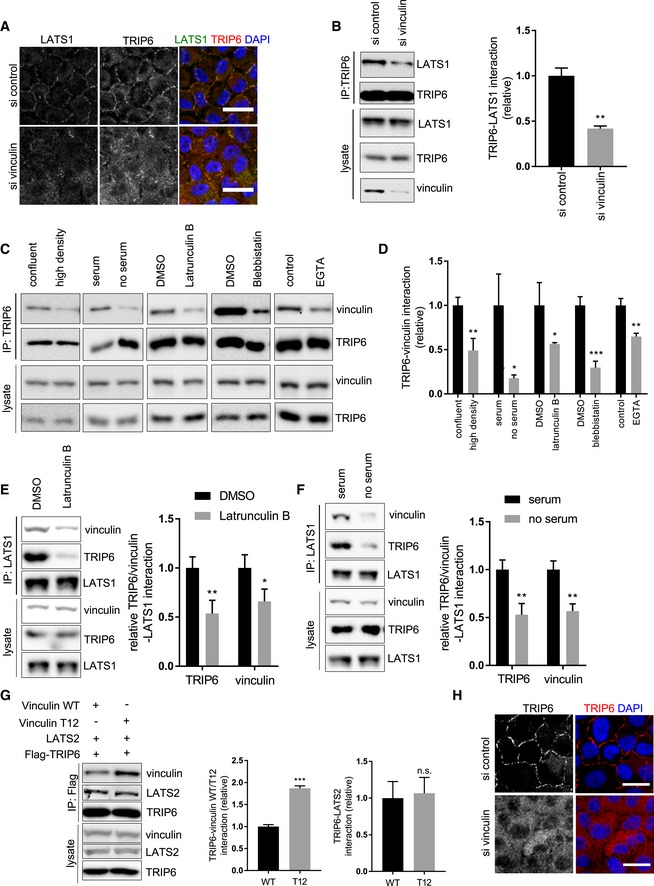
We then investigated whether vinculin and TRIP6 function together to regulate Hippo signaling in response to tension. Several lines of evidence suggested that vinculin acts upstream of TRIP6 and LATS1/2 in response to tension. First, when vinculin was depleted by siRNA, TRIP6 and LATS1 localization to cell–cell junctions was reduced (Figs 6A and EV5B and C), without an obvious effect on E‐cadherin staining (Fig EV4C). In contrast, stretch‐induced recruitment of vinculin to cell–cell junctions did not depend on TRIP6 (Fig EV5D). Thus, vinculin is required to recruit TRIP6 and LATS1 to cell–cell junctions. Vinculin also promotes TRIP6‐LATS1 binding since reduced TRIP6‐LATS1 binding was observed after vinculin depletion; Fig 6B). Vinculin binding to TRIP6 appears to be tension dependent because it is reduced by treatments that disrupt tension (Fig 6C–F). Tension‐dependent binding of upstream molecules can trigger vinculin to become activated by inducing a more open conformation 44. The vinculin‐T12 mutation 45 is thought to mimic the active (open) conformation. Therefore, we tested whether vinculin‐T12 is better than wild‐type vinculin at binding TRIP6 and promoting its association with LATS2. We co‐expressed TRIP6, LATS2, and either wild‐type or vinculin‐T12 and immunoprecipitated TRIP6. This experiment showed that vinculin‐T12 bound better to TRIP6 but did not increase the amount of LATS2 binding to TRIP6 as compared to wild‐type vinculin (Fig 6G). These results indicate that TRIP6 binds better to the activated form of vinculin, but this binding alone is not sufficient to stimulate TRIP6‐LATS2 binding. The inability of vinculin‐T12 to stimulate TRIP6‐LATS2 binding is surprising because we found that depletion of vinculin resulted in reduced TRIP6‐LATS1 binding. These results could be explained if either vinculin‐T12 does not fully mimic the tension activated state of vinculin at adherens junctions, or other proteins at adherens junctions besides vinculin are required to promote TRIP6‐LATS1/2 binding. A third possibility is that vinculin is necessary to generate tension, which could be sensed/transmitted to TRIP6‐LATS1/2 by other proteins. To test this possibility, we stretched high‐density cells that had been depleted of vinculin and stained them for TRIP6. These results showed that stretch was unable to trigger recruitment TRIP6 to cell–cell junctions when vinculin was depleted (Fig 6H), suggesting that vinculin does not solely affect TRIP6‐LATS1/2 binding indirectly by promoting tension at junctions. Overall, these results support a model where tension stimulates vinculin recruitment of TRIP6‐LATS1/2 to adherens junctions to control YAP activity in response to changes in tension across tissues.
Figure 6. Vinculin regulates TRIP6‐LATS1 interaction and localization.
-
AVinculin was knocked down as described (Fig 5D) in MCF10A cells, and cells were stained for LATS1 and TRIP6. Merged images show LATS1 (green), TRIP6 (red), and DNA (blue). Scale bar = 20 μm.
-
BVinculin was knocked down as described (Fig 5D), and TRIP6 immune complexes and lysates were probed by Western blotting for LATS1, TRIP6, and vinculin and the relative levels quantified (mean ± SD; n = 3; **P ≤ 0.01, t‐test).
-
CMCF10A cells were subjected to different treatments as described (Fig 4A), and TRIP6 immune complexes and lysates were probed by Western blotting for vinculin and TRIP6.
-
DQuantification of TRIP6‐vinculin binding from part (C) is shown (mean ± SD; n = 3; *P ≤ 0.05, **P ≤ 0.01, ***P ≤ 0.001, t‐test).
-
E, FMCF10A cells were treated separately (or not) with Latrunculin B (E) and by serum starvation (F) and LATS1 immune complexes, and lysates were probed by Western blotting for vinculin, LATS1, and TRIP6. Quantification of LATS1‐TRIP6‐vinculin binding is shown (mean ± SD; n = 3; *P ≤ 0.05, **P ≤ 0.01, t‐test).
-
GWild‐type and T12 mutant of vinculin were co‐expressed with LATS2, and FLAG‐TRIP6 and anti‐FLAG antibody were used to isolate immune complexes. Immune complexes and lysates were probed by Western blotting for vinculin, LATS2 and FLAG‐TRIP6. Quantification of LATS2‐TRIP6‐vinculin (WT or T12) binding is shown (mean ± SD; n = 3; ***P ≤ 0.001, t‐test).
-
HVinculin was knocked down as described (Fig 5D) in MCF10A cells grown at high density on PDMS membranes. The membranes were stretched at 17% elongation for 2 h and fixed while under tension and stained for TRIP6. Merged images show TRIP6 (red) and DNA (blue). Scale bar = 20 μm.
Discussion
This study provides new insight into the mechanism by which mechanical forces regulate cell growth and proliferation decisions via the Hippo signaling pathway. In particular, we report that the LIM domain protein TRIP6 functions as an intermediate between the LATS1/2 protein kinases, which transmit signals to YAP, and the mechano‐responsive protein vinculin at the adherens junctions. Previous studies have shown that YAP activity can be stimulated by tension 9, 10, 11, 12; however, the upstream signaling pathways remained uncertain. We found that tension stimulates TRIP6 binding to LATS1/2, and, once bound, TRIP6 inhibits LATS1/2 activity, reminiscent of work in Drosophila showing that the Ajuba LIM domain protein activates Yki (the YAP homolog) by inhibiting Warts (the LATS1/2 homolog) in response to tension (Rauskolb et al 9). Furthermore, we identified a specific molecular mechanism for how TRIP6 inhibits LATS1/2. We discovered that TRIP6 competes with MOB1 for binding to LATS1/2. MOB1 promotes LATS1/2 activation by scaffolding interactions between the LATS1/2 activating kinase MST1/2 and LATS1/2. The competition we observe between TRIP6 and MOB1 for binding to LATS1/2 is consistent with our other results showing TRIP6 interferes with MST1/2 phosphorylation of LATS1/2. This mechanism may be relevant for other LIM domain proteins that bind to a similar region of LATS1/2 (Abe et al 15; Hirota et al 14), and could function in conjunction with other proposed mechanisms for how LIM domain proteins inhibit LATS1/2 (Jagannathan et al 17; Ma et al 18; Sun et al 46).
Our studies identified vinculin as acting upstream of TRIP6. Both TRIP6 and vinculin loss of function promote LATS1/2 activity and inhibit YAP activity, and vinculin can be co‐immunoprecipitated with TRIP6 and is required to efficiently recruit TRIP6 and LATS1/2 to adherens junctions and to promote their binding to each other. It is not clear how vinculin promotes TRIP6‐LATS binding, but one possibility is that vinculin directly or indirectly causes a conformational change in TRIP6 to allow it to bind LATS1/2. Vinculin itself responds to mechanical tension at adherens junctions since both vinculin localization to adherens junctions and vinculin‐TRIP6 association are dependent on mechanical tension. Previous studies have shown that vinculin is recruited to adherens junctions by α‐catenin, which responds directly to mechanical tension. Alpha‐catenin binding to vinculin stabilizes its open conformation allowing it to bind actin and possibly other effectors like TRIP6 (Choi et al 44; Huveneers and de Rooij 35; Twiss et al 47; Yonemura et al 34). We found that the vinculin‐T12 mutant 45, which is thought to mimic the open conformation of vinculin, associates more strongly with TRIP6 than wild‐type vinculin suggesting that tension‐induced activation of vinculin may stimulate its binding to TRIP6. Surprisingly, vinculin‐T12 did not increase the binding of co‐expressed TRIP6 to LATS2 even though vinculin loss of function reduces TRIP6‐LATS1 binding. Although we do not observe obvious differences in E‐cadherin staining when vinculin (or TRIP6 or LATS1/2) is knocked down in MCF10A cells, we cannot rule out the possibility that subtle effects on cell–cell junction architecture when vinculin is depleted affect TRIP6‐LATS1/2 binding. Alternatively, it is possible that either vinculin‐T12 does not fully mimic activation of vinculin at adherens junctions or if the ability of vinculin to activate TRIP6‐LATS1/2 binding requires additional proteins.
Given that α‐catenin is thought to act upstream of vinculin, one would expect α‐catenin and vinculin loss of function to have similar effects on YAP activity. However, previous studies showed that α‐catenin loss of function stimulates YAP activity 48, 49, 50, in contrast to the increased YAP activity we observe when vinculin is knocked down. This apparent discrepancy could be resolved if adherens junctions and α‐catenin had different functions in cells at lower density (higher tension) compared to cells at high density (low tension). It should be noted that the earlier studies showing α‐catenin acting as an inhibitor of YAP were done at high cell density where tension would be low and vinculin and TRIP6 would not be at adherens junctions. At lower cell density, when cells are confluent but still proliferating (and presumably under more tension), α‐catenin may recruit vinculin to adherens junctions to enhance YAP activity (via TRIP6 inhibition of LATS1/2) and drive cell proliferation. Thus, as cell density increases and tension decreases, the vinculin‐TRIP6 system turns off, and the YAP inhibitory function of adherens junctions could become dominant. It will be interesting in the future to determine how these two systems interact with each other to tune YAP regulation in response to changes in cell density and/or tension. In summary, we showed that TRIP6 acts as an intermediary connecting tension monitoring at adherens junctions to Hippo signaling, which has implications for how tension contributes to growth of organs and tissues during development, tissue repair during injury and to pathological conditions such as cancer.
Materials and Methods
Reagents
All antibodies, cell lines, chemicals, oligos, plasmids, etc., used in this study are listed in Appendix Tables S1 and S2.
Cell lines
Human embryonic kidney (HEK293, HEK293A) cell lines were grown in Dulbecco's modified Eagle medium (DMEM, GIBCO) supplemented with 10% (v/v) fetal bovine serum (FBS, GIBCO) and 1% (v/v) penicillin/streptomycin (Invitrogen). Human mammary epithelial cell line MCF10A was cultured in DMEM/F12 (1:1) media supplemented with 5% (v/v) fetal horse serum (GIBCO), 20 ng/ml epidermal growth factor (Peprotech), 0.5 mg/ml hydrocortisone (Sigma), 100 ng/ml Cholera toxin (Sigma), 10 μg/ml insulin (Sigma), and 1% (v/v) penicillin/streptomycin (Invitrogen). Cell lines were cultured in a humidified incubator at 37°C with 5% CO2.
Expression plasmids and shRNAs
Flag‐TRIP6 plasmid is obtained from Addgene (Plasmid #27255). shRNAs for TRIP6 (shRNA1: TRCN0000061438, shRNA4: TRCN0000061441) and control shRNA (shEGFP) were obtained from the UMass RNAi core facility.
CRISPR‐mediated deletion of TRIP6 in 293A cell line
The target sequence to knock out the TRIP6 gene was selected with the web tool developed by the Zhang lab (http://crispr.mit.edu/). Oligos complementary to the target sequence with appropriate overhangs (CACCGGCGATCCCCCGCGGCACCC and AAACGGGTGCCGCGGGGGATCGCC) were annealed and cloned into a variant of the px330 plasmid with puromycin resistance 51. HEK293A and HEK293 cells were transfected with Lipofectamine 2000 (Invitrogen) following the manufacturer directions and using 500 ng of plasmid per well of a 12‐well plate. The next day, cells were placed under selection with 2 μg/ml of puromycin (GIBCO) for 48 h. Puromycin‐resistant cells were then heavily diluted and plated on 10‐cm plates for colony isolation. Colonies were picked 7–10 days later by depleting the media from the plate and using a P20 pipette loaded with 1 μl of media to dislodge the colony from the plate by rapid back and forth movements. Clonal lines were then expanded, and the expression of TRIP6 was determined by Western blot. Clonal lines that lacked expression of TRIP6 were again expanded from single cells by dilution followed by colony isolation and tested by Western blot to ensure that they were true clonal lines. At least two independent clonal lines were kept for further analysis. HEK293A cells were maintained at low densities as much as possible to prevent morphological changes associated with cell crowding.
Cell starvation and drug treatments
MCF10A and HEK293A cells were starved overnight in DMEM/F12 (1:1) and DMEM, respectively, supplemented with 1% of penicillin and streptomycin (Invitrogen) before adding complete cell culture medium described above for 1 h. Latrunculin B was used at 1 μM for 1 h. Blebbistatin was used at 25 μM for 2 h on MCF10A and 1 h on 293A. Both MCF10A and 293A cell lines were treated with 0.5 mM EGTA for 30 min. MCF10A cells were treated with 50 μM of Y27632 for 1 h.
Stretching experiments
MCF10A cells were cultured on collagen I‐coated bioflex plates (Flexcell International Corporation (# BF‐3001C)) at high density before stretching them with a Flexcell FX‐4000 machine (Flexcell International, Burlington, NC) using 22‐mm‐diameter posts under maximum vacuum pressure, resulting in a 17% equibiaxial stretch for 2 h in a humidified incubator at 37°C with 5% CO2. Cells were either lysed for RNA preparation (see RT–qPCR), protein preparation (cell lysis, immunoprecipitation, and Western blotting) or fixed while under stretch with 3.7% PFA for 10 min before performing immunofluorescence. Control plates were not stretched. For stretched plates, the stretch level was validated by measuring deformation before and after stretch using multiple fiduciary markers.
Immunofluorescence
HEK 293A and MCF10A cells were cultured on coverslips and fixed with 3.7% paraformaldehyde in PBS for 10 min, permeabilized in 0.5% Triton X‐100 in UB (UB; 150 mM NaCl, 50 mM Tris pH 7.6, 0.01% NaN3) for 3 min at 37°C, then blocked with 10% BSA in UB for 30 min at 37°C. Cells were then incubated for 1 h at 37°C with appropriate primary antibodies, washed three times in UB, and incubated with Alexa Fluor‐conjugated secondary antibodies (Molecular Probes) for 1 h at 37°C. After three washes in UB, coverslips were mounted on glass slides using Prolong Gold Antifade reagent with DAPI (Invitrogen) and left at 4°C overnight. The next day, slides were viewed using fluorescent microscopy (Nikon Eclipse E600) and images were acquired using a cooled charge‐coupled device camera (ORCA‐ER; Hamamatsu, Bridgewater, NJ). The confocal image was acquired using a Leica SP5 AOBS second‐generation laser scanning confocal microscope. Image processing and analysis were carried out with IPLab Spectrum software (Signal Analytics, Vienna, VA) and ImageJ software 52.
Cell lysis, immunoprecipitation, and Western blotting
HEK293 and HEK293A cells were transfected using Lipofectamine 2000 (Invitrogen) according to the manufacturer's protocol. For the rescue assay, HEK293A (WT) and HEK293A TRIP6‐KO knockout cells were transfected with empty plasmid and increasing amounts of FLAG‐TRIP6 plasmid (50–200 ng), respectively, using FuGENE® HD Transfection Reagent (#E2311, Promega) according to manufacturer's protocol. 200 ng of the plasmid was used for the final rescue experiment. Cells were collected after 48 h and lysed with lysis buffer (10% glycerol (Invitrogen), 20 mM Tris–HCl, pH 7.0, 137 mM NaCl, 2 mM EDTA, 1% NP‐40 (Invitrogen), 1 mM PMSF(Sigma), 1 mM Na3VO4 (Sigma), and 1× mammalian protease inhibitor cocktail (Sigma)). MCF10A cells were additionally passed through a 26G" needle. Cells were then incubated for 10 min at 4°C, and lysates were cleared by centrifugation at 9,391 g for 10 min at 4°C. For immunoprecipitation, Dynabeads (Invitrogen) were used according to the manufacturer's protocol.
siRNA/shRNA transfection
Knockdowns in MCF10A cells were performed using 30 nM of control siRNA (firefly luciferase) or SMARTpool siRNA from Dharmacon (for LATS1 and 2) or stealth siRNA from Thermo Fisher (for vinculin). RNAiMAX Lipofectamine (Invitrogen) was used according to the manufacturer's protocol. After 48 h, cells were either used for Western blotting or fixed for immunofluorescence. Stable knockdowns in MCF10A cells were done using lentiviral infection of shRNA, and cells were selected with puromycin for 3 days. Experiments were performed immediately after puromycin selection. Viral supernatants were generated by the shRNA Core Facility (UMASS) to target TRIP6.
RT–qPCR
RNA was prepared using Quick‐RNA MiniPrep kit (Zymo Research) according to the manufacturer's protocol. cDNA was prepared using qScript cDNA super mix (Quanta Biosciences, Inc) according to the manufacturer's protocol. RT–qPCR was performed using KAPA SYBR Fast‐Master Mix Universal kit (Kapa Biosystems). Target mRNA levels were measured relative to GAPDH mRNA levels. Oligo sequences used are listed in Appendix Table S1.
Recombinant protein expression and in vitro competition assays
TRIP6 and LATS2 were cloned in pDEST‐GST and pDEST‐MBP, respectively, (provided by Dr. Marian Walhout's lab) using Gateway (Thermo Fisher Scientific) directions. MOB1A was cloned in pET28a through standard cloning. GST‐TRIP6, MOB1A‐6xHis, and MBP‐LATS2 plasmids were transformed into BL21 DE3 cells, and recombinant protein expression was induced with 1 mM IPTG for 4 h and 30 min at 25°C. Bacterial pellets were resuspended in lysis buffer (1.8 mM KH2PO4, 10 mM Na2HPO4, 150 mM NaCl, 10 mM β‐mercapto ethanol, 0.05% Triton X‐100, 1 mg/ml of lysozyme, 5 μg/ml of nuclease, and 1 mM PMSF) and incubated for 30 min at 4°C. Cells were lysed on ice with six rounds of 10 sonications each using a VWR Sonifier 450 fitted with a microtip set to an output of 2 and a duty cycle of 80. Lysates were cleared by centrifugation at 21,000 g for 10 min at 4°C. GST‐TRIP6 was purified using glutathione beads (GE) and eluted with 20 mM glutathione for 30 min at 4°C in elution buffer (1.8 mM KH2PO4,10 mM Na2HPO4, 150 mM NaCl, 0.05% Triton X‐100, and 1 mM PMSF). MOB1A‐6His was purified using Ni‐IDA beads (Biotool) and eluted with 300 mM Imidazole for 30 min at 4°C in elution buffer. MBP‐LATS2 was pulled down with magnetic maltose beads (NEB). For the in vitro competition assay, GST‐TRIP6, MOB1A‐6xHis, and control proteins were mixed as indicated in Fig 3B and then adjusted to a volume of 60 μl using elution buffer. A constant amount of GST‐TRIP6 (approximately 0.7 μg) was used in each sample, and either onefold, fourfold, or 10‐fold molar ratios of MOB1A‐6xHis were added as competitor. The different protein solutions were then added with 20 μl of 10 mM Tris–HCl, pH 7.4 (to ensure an equal pH) to bead bound MBP‐LATS2 and incubated for 20 min at room temperature with mixing. MBP‐LATS2 bound beads were separated using a magnetic stand, washed times in elution buffer, and boiled in SDS–PAGE sample buffer. Protein samples were then subjected to SDS–PAGE and Western blotting with the specified antibodies.
Quantification and statistical analysis
Data are presented as mean ± SD. Each experiment was done in triplicate except where indicated. Student's t‐test (*P ≤ 0.05, **P ≤ 0.01, ***P ≤ 0.001, ****P ≤ 0.0001) was performed using Prism version 7.00 for Windows (GraphPad Software, La Jolla California USA, www.graphpad.com). For YAP localization studies, we counted 100 cells each from three different experiments and used Fisher's test (*P ≤ 0.05, **P ≤ 0.01, ***P ≤ 0.001, ****P ≤ 0.0001) using GraphPad Quickcalcs (http://graphpad.com/quickcalcs/contingency1/) to calculate the significance. For TRIP6 and LATS1 fluorescent intensity measurements at cell–cell junctions, the average intensity for each protein at individual cell–cell junctions (n ≥ 48) was measured using ImageJ. Intensity measurements for each junction were normalized to the total average fluorescence of the field of cells. For Western blots, we performed background subtraction and densitometric analysis of respective bands using ImageJ (Schneider et al, 2012) and normalized to loading control (either actin or tubulin).
Author contributions
SD, SM‐C, and DM devised the experiments. SD performed most of the experiments with assistance from SM‐C, ID, and HC. SM‐C made the TRIP6 knockout line in HEK293A cells, and MP made LATS2 plasmids. KB and HC helped design the static stretch experiments. SD, SM‐C, and DM wrote the manuscript.
Conflict of interest
The authors declare that they have no conflict of interest.
Supporting information
Appendix
Expanded View Figures PDF
Review Process File
Acknowledgements
We thank Anthony Schmitt, Maria Fernandes, Elizabeth Luna, and Greenfield Sluder for antibodies, and Tom Fazzio for CRISPR plasmids. We thank Peter Pryciak for giving valuable feedback on the manuscript. This work was supported by the National Institutes of Health grant GM058406‐18 to DM, and a UMMS‐WPI seed grant to DM and KB.
EMBO Reports (2018) 19: 337–350
References
- 1. Huang S, Ingber DE (1999) The structural and mechanical complexity of cell‐growth control. Nat Cell Biol 1: E131–E138 [DOI] [PubMed] [Google Scholar]
- 2. Mammoto T, Mammoto A, Ingber DE (2013) Mechanobiology and developmental control. Annu Rev Cell Dev Biol 29: 27–61 [DOI] [PubMed] [Google Scholar]
- 3. Heller E, Fuchs E (2015) Tissue patterning and cellular mechanics. J Cell Biol 211: 219–231 [DOI] [PMC free article] [PubMed] [Google Scholar]
- 4. Vogel V, Sheetz M (2006) Local force and geometry sensing regulate cell functions. Nat Rev Mol Cell Biol 7: 265–275 [DOI] [PubMed] [Google Scholar]
- 5. Sun S, Irvine KD (2016) Cellular organization and cytoskeletal regulation of the hippo signaling network. Trends Cell Biol 26: 694–704 [DOI] [PMC free article] [PubMed] [Google Scholar]
- 6. Halder G, Dupont S, Piccolo S (2012) Transduction of mechanical and cytoskeletal cues by YAP and TAZ. Nat Rev Mol Cell Biol 13: 591–600 [DOI] [PubMed] [Google Scholar]
- 7. Meng Z, Moroishi T, Guan KL (2016) Mechanisms of Hippo pathway regulation. Genes Dev 30: 1–17 [DOI] [PMC free article] [PubMed] [Google Scholar]
- 8. Yu FX, Zhao B, Guan KL (2015) Hippo pathway in organ size control, tissue homeostasis, and cancer. Cell 163: 811–828 [DOI] [PMC free article] [PubMed] [Google Scholar]
- 9. Rauskolb C, Sun S, Sun G, Pan Y, Irvine KD (2014) Cytoskeletal tension inhibits Hippo signaling through an Ajuba‐Warts complex. Cell 158: 143–156 [DOI] [PMC free article] [PubMed] [Google Scholar]
- 10. Codelia VA, Sun G, Irvine KD (2014) Regulation of YAP by mechanical strain through Jnk and Hippo signaling. Curr Biol 24: 2012–2017 [DOI] [PMC free article] [PubMed] [Google Scholar]
- 11. Aragona M, Panciera T, Manfrin A, Giulitti S, Michielin F, Elvassore N, Dupont S, Piccolo S (2013) A mechanical checkpoint controls multicellular growth through YAP/TAZ regulation by actin‐processing factors. Cell 154: 1047–1059 [DOI] [PubMed] [Google Scholar]
- 12. Benham‐Pyle BW, Pruitt BL, Nelson WJ (2015) Cell adhesion. Mechanical strain induces E‐cadherin‐dependent Yap1 and beta‐catenin activation to drive cell cycle entry. Science 348: 1024–1027 [DOI] [PMC free article] [PubMed] [Google Scholar]
- 13. Mui KL, Chen CS, Assoian RK (2016) The mechanical regulation of integrin‐cadherin crosstalk organizes cells, signaling and forces. J Cell Sci 129: 1093–1100 [DOI] [PMC free article] [PubMed] [Google Scholar]
- 14. Hirota T, Morisaki T, Nishiyama Y, Marumoto T, Tada K, Hara T, Masuko N, Inagaki M, Hatakeyama K, Saya H (2000) Zyxin, a regulator of actin filament assembly, targets the mitotic apparatus by interacting with h‐warts/LATS1 tumor suppressor. J Cell Biol 149: 1073–1086 [DOI] [PMC free article] [PubMed] [Google Scholar]
- 15. Abe Y, Ohsugi M, Haraguchi K, Fujimoto J, Yamamoto T (2006) LATS2‐Ajuba complex regulates gamma‐tubulin recruitment to centrosomes and spindle organization during mitosis. FEBS Lett 580: 782–788 [DOI] [PubMed] [Google Scholar]
- 16. Das Thakur M, Feng Y, Jagannathan R, Seppa MJ, Skeath JB, Longmore GD (2010) Ajuba LIM proteins are negative regulators of the Hippo signaling pathway. Curr Biol 20: 657–662 [DOI] [PMC free article] [PubMed] [Google Scholar]
- 17. Jagannathan R, Schimizzi GV, Zhang K, Loza AJ, Yabuta N, Nojima H, Longmore GD (2016) AJUBA LIM proteins limit Hippo activity in proliferating cells by sequestering the Hippo core kinase complex in the cytosol. Mol Cell Biol 36: 2526–2542 [DOI] [PMC free article] [PubMed] [Google Scholar]
- 18. Ma B, Cheng H, Gao R, Mu C, Chen L, Wu S, Chen Q, Zhu Y (2016) Zyxin‐Siah2‐Lats2 axis mediates cooperation between Hippo and TGF‐beta signalling pathways. Nat Commun 7: 11123 [DOI] [PMC free article] [PubMed] [Google Scholar]
- 19. Sun G, Irvine KD (2013) Ajuba family proteins link JNK to Hippo signaling. Sci Signal 6: ra81 [DOI] [PMC free article] [PubMed] [Google Scholar]
- 20. Fei J, Li J, Shen S, Zhou W (2013) Characterization of TRIP6‐dependent nasopharyngeal cancer cell migration. Tumour Biol 34: 2329–2335 [DOI] [PubMed] [Google Scholar]
- 21. Grunewald TG, Willier S, Janik D, Unland R, Reiss C, Prazeres da Costa O, Buch T, Dirksen U, Richter GH, Neff F et al (2013) The Zyxin‐related protein thyroid receptor interacting protein 6 (TRIP6) is overexpressed in Ewing's sarcoma and promotes migration, invasion and cell growth. Biol Cell 105: 535–547 [DOI] [PubMed] [Google Scholar]
- 22. Chastre E, Abdessamad M, Kruglov A, Bruyneel E, Bracke M, Di Gioia Y, Beckerle MC, van Roy F, Kotelevets L (2009) TRIP6, a novel molecular partner of the MAGI‐1 scaffolding molecule, promotes invasiveness. FASEB J 23: 916–928 [DOI] [PubMed] [Google Scholar]
- 23. Paramasivam M, Sarkeshik A, Yates JR III, Fernandes MJ, McCollum D (2011) Angiomotin family proteins are novel activators of the LATS2 kinase tumor suppressor. Mol Biol Cell 22: 3725–3733 [DOI] [PMC free article] [PubMed] [Google Scholar]
- 24. Zhao B, Li L, Tumaneng K, Wang CY, Guan KL (2010) A coordinated phosphorylation by Lats and CK1 regulates YAP stability through SCF(beta‐TRCP). Genes Dev 24: 72–85 [DOI] [PMC free article] [PubMed] [Google Scholar]
- 25. Liu CY, Zha ZY, Zhou X, Zhang H, Huang W, Zhao D, Li T, Chan SW, Lim CJ, Hong W et al (2010) The hippo tumor pathway promotes TAZ degradation by phosphorylating a phosphodegron and recruiting the SCF{beta}‐TrCP E3 ligase. J Biol Chem 285: 37159–37169 [DOI] [PMC free article] [PubMed] [Google Scholar]
- 26. Reddy BV, Irvine KD (2013) Regulation of Hippo signaling by EGFR‐MAPK signaling through Ajuba family proteins. Dev Cell 24: 459–471 [DOI] [PMC free article] [PubMed] [Google Scholar]
- 27. Rauskolb C, Pan G, Reddy BV, Oh H, Irvine KD (2011) Zyxin links fat signaling to the hippo pathway. PLoS Biol 9: e1000624 [DOI] [PMC free article] [PubMed] [Google Scholar]
- 28. Ni L, Zheng Y, Hara M, Pan D, Luo X (2015) Structural basis for Mob1‐dependent activation of the core Mst‐Lats kinase cascade in Hippo signaling. Genes Dev 29: 1416–1431 [DOI] [PMC free article] [PubMed] [Google Scholar]
- 29. Guo Z, Neilson LJ, Zhong H, Murray PS, Zanivan S, Zaidel‐Bar R (2014) E‐cadherin interactome complexity and robustness resolved by quantitative proteomics. Sci Signal 7: rs7 [DOI] [PMC free article] [PubMed] [Google Scholar]
- 30. Zhao MK, Wang Y, Murphy K, Yi J, Beckerle MC, Gilmore TD (1999) LIM domain‐containing protein trip6 can act as a coactivator for the v‐Rel transcription factor. Gene Expr 8: 207–217 [PMC free article] [PubMed] [Google Scholar]
- 31. Wang Y, Dooher JE, Koedood Zhao M, Gilmore TD (1999) Characterization of mouse Trip6: a putative intracellular signaling protein. Gene 234: 403–409 [DOI] [PubMed] [Google Scholar]
- 32. Zhang J, Smolen GA, Haber DA (2008) Negative regulation of YAP by LATS1 underscores evolutionary conservation of the Drosophila Hippo pathway. Cancer Res 68: 2789–2794 [DOI] [PubMed] [Google Scholar]
- 33. Meng Z, Moroishi T, Mottier‐Pavie V, Plouffe SW, Hansen CG, Hong AW, Park HW, Mo JS, Lu W, Lu S et al (2015) MAP4K family kinases act in parallel to MST1/2 to activate LATS1/2 in the Hippo pathway. Nat Commun 6: 8357 [DOI] [PMC free article] [PubMed] [Google Scholar]
- 34. Yonemura S, Wada Y, Watanabe T, Nagafuchi A, Shibata M (2010) Alpha‐Catenin as a tension transducer that induces adherens junction development. Nat Cell Biol 12: 533–542 [DOI] [PubMed] [Google Scholar]
- 35. Huveneers S, de Rooij J (2013) Mechanosensitive systems at the cadherin‐F‐actin interface. J Cell Sci 126: 403–413 [DOI] [PubMed] [Google Scholar]
- 36. Rual JF, Venkatesan K, Hao T, Hirozane‐Kishikawa T, Dricot A, Li N, Berriz GF, Gibbons FD, Dreze M, Ayivi‐Guedehoussou N et al (2005) Towards a proteome‐scale map of the human protein‐protein interaction network. Nature 437: 1173–1178 [DOI] [PubMed] [Google Scholar]
- 37. Yu H, Tardivo L, Tam S, Weiner E, Gebreab F, Fan C, Svrzikapa N, Hirozane‐Kishikawa T, Rietman E, Yang X et al (2011) Next‐generation sequencing to generate interactome datasets. Nat Methods 8: 478–480 [DOI] [PMC free article] [PubMed] [Google Scholar]
- 38. Kuo JC, Han X, Hsiao CT, Yates JR III, Waterman CM (2011) Analysis of the myosin‐II‐responsive focal adhesion proteome reveals a role for beta‐Pix in negative regulation of focal adhesion maturation. Nat Cell Biol 13: 383–393 [DOI] [PMC free article] [PubMed] [Google Scholar]
- 39. Schiller HB, Friedel CC, Boulegue C, Fassler R (2011) Quantitative proteomics of the integrin adhesome show a myosin II‐dependent recruitment of LIM domain proteins. EMBO Rep 12: 259–266 [DOI] [PMC free article] [PubMed] [Google Scholar]
- 40. Bays JL, DeMali KA (2017) Vinculin in cell‐cell and cell‐matrix adhesions. Cell Mol Life Sci 74: 2999–3009 [DOI] [PMC free article] [PubMed] [Google Scholar]
- 41. Huveneers S, Oldenburg J, Spanjaard E, van der Krogt G, Grigoriev I, Akhmanova A, Rehmann H, de Rooij J (2012) Vinculin associates with endothelial VE‐cadherin junctions to control force‐dependent remodeling. J Cell Biol 196: 641–652 [DOI] [PMC free article] [PubMed] [Google Scholar]
- 42. Leerberg JM, Gomez GA, Verma S, Moussa EJ, Wu SK, Priya R, Hoffman BD, Grashoff C, Schwartz MA, Yap AS (2014) Tension‐sensitive actin assembly supports contractility at the epithelial zonula adherens. Curr Biol 24: 1689–1699 [DOI] [PMC free article] [PubMed] [Google Scholar]
- 43. Thomas WA, Boscher C, Chu YS, Cuvelier D, Martinez‐Rico C, Seddiki R, Heysch J, Ladoux B, Thiery JP, Mege RM et al (2013) Alpha‐Catenin and vinculin cooperate to promote high E‐cadherin‐based adhesion strength. J Biol Chem 288: 4957–4969 [DOI] [PMC free article] [PubMed] [Google Scholar]
- 44. Choi HJ, Pokutta S, Cadwell GW, Bobkov AA, Bankston LA, Liddington RC, Weis WI (2012) AlphaE‐catenin is an autoinhibited molecule that coactivates vinculin. Proc Natl Acad Sci USA 109: 8576–8581 [DOI] [PMC free article] [PubMed] [Google Scholar]
- 45. Cohen DM, Chen H, Johnson RP, Choudhury B, Craig SW (2005) Two distinct head‐tail interfaces cooperate to suppress activation of vinculin by talin. J Biol Chem 280: 17109–17117 [DOI] [PubMed] [Google Scholar]
- 46. Sun S, Reddy BV, Irvine KD (2015) Localization of Hippo signalling complexes and Warts activation in vivo. Nat Commun 6: 8402 [DOI] [PMC free article] [PubMed] [Google Scholar]
- 47. Twiss F, Le Duc Q, Van Der Horst S, Tabdili H, Van Der Krogt G, Wang N, Rehmann H, Huveneers S, Leckband DE, De Rooij J (2012) Vinculin‐dependent Cadherin mechanosensing regulates efficient epithelial barrier formation. Biol Open 1: 1128–1140 [DOI] [PMC free article] [PubMed] [Google Scholar]
- 48. Kim NG, Koh E, Chen X, Gumbiner BM (2011) E‐cadherin mediates contact inhibition of proliferation through Hippo signaling‐pathway components. Proc Natl Acad Sci USA 108: 11930–11935 [DOI] [PMC free article] [PubMed] [Google Scholar]
- 49. Schlegelmilch K, Mohseni M, Kirak O, Pruszak J, Rodriguez JR, Zhou D, Kreger BT, Vasioukhin V, Avruch J, Brummelkamp TR et al (2011) Yap1 acts downstream of alpha‐catenin to control epidermal proliferation. Cell 144: 782–795 [DOI] [PMC free article] [PubMed] [Google Scholar]
- 50. Silvis MR, Kreger BT, Lien WH, Klezovitch O, Rudakova GM, Camargo FD, Lantz DM, Seykora JT, Vasioukhin V (2011) Alpha‐catenin is a tumor suppressor that controls cell accumulation by regulating the localization and activity of the transcriptional coactivator Yap1. Sci Signal 4: ra33 [DOI] [PMC free article] [PubMed] [Google Scholar]
- 51. Hainer SJ, Gu W, Carone BR, Landry BD, Rando OJ, Mello CC, Fazzio TG (2015) Suppression of pervasive noncoding transcription in embryonic stem cells by esBAF. Genes Dev 29: 362–378 [DOI] [PMC free article] [PubMed] [Google Scholar]
- 52. Schneider CA, Rasband WS, Eliceiri KW (2012) NIH Image to ImageJ: 25 years of image analysis. Nat Methods 9: 671–675 [DOI] [PMC free article] [PubMed] [Google Scholar]
Associated Data
This section collects any data citations, data availability statements, or supplementary materials included in this article.
Supplementary Materials
Appendix
Expanded View Figures PDF
Review Process File