Abstract
Super-resolution ultrasound microvessel imaging with contrast microbubbles has recently been proposed by multiple studies, demonstrating outstanding resolution with high potential for clinical applications. This study aims at addressing the potential noise issue in in vivo human super-resolution imaging with ultrafast plane wave imaging. The rich spatiotemporal information provided by ultrafast imaging presents features that allow microbubble signals to be separated from background noise. In addition, the high frame rate recording of microbubble data enables the implementation of robust tracking algorithms commonly used in particle tracking velocimetry. In this study, we applied the nonlocal means (NLM) denoising filter on the spatiotemporal domain of the microbubble data to preserve the microbubble tracks caused by microbubble movement and suppress random background noise. We then implemented a bipartite graph-based pairing method with the use of persistence control to further improve the microbubble signal quality and microbubble tracking fidelity. In an in vivo rabbit kidney perfusion study, the NLM filter showed effective noise rejection and substantially improved microbubble localization. The bipartite graph pairing and persistence control demonstrated further noise reduction, improved microvessel delineation and a more consistent microvessel blood flow speed measurement. With the proposed methods and freehand scanning on a free-breathing rabbit, a single microvessel cross-section profile with full width at half maximum of 57 μm could be imaged at approximately 2 cm depth (ultrasound transmit center frequency = 8 MHz, theoretical spatial resolution ~200 μm). Cortical microvessels that are 76 μm apart can also be clearly separated. These results suggest that the proposed methods have good potential in facilitating robust in vivo clinical super-resolution microvessel imaging.
Index Terms: Super-resolution imaging, contrast microbubbles, microvessel imaging, microbubble tracking, nonlocal means filtering, bipartite graph
I. INTRODUCTION
The use of ultrasound contrast microbubbles to break the diffraction limit of ultrasound and realize super-resolved microvessel imaging has recently been demonstrated in multiple studies [1–8]. Among these studies, Errico et al. [1] proposed a seminal method, ultrasound localization microscopy (ULM), that uses ultrafast ultrasound imaging to record spatially isolated microbubble blinking events from decorrelated microbubble signals that can be generated by microbubble disruption, dissolution and motion. ULM achieved ~λ/10 subwavelength spatial resolution with a wide dynamic range of blood flow speed measurement (1 mm/s to several cm/s) that is Doppler angle-independent [1, 9]. In an in vivo murine brain study, ULM demonstrated visualization of ~10 μm microvessels over the entire depth of the mouse brain (~10 mm) [1]. Such extraordinary combination of resolution and penetration and the accurate hemodynamics measurement provides a paradigm-shifting tool for structural and functional evaluation of tissue microvasculature.
Translating super-resolution microvessel imaging techniques such as ULM from preclinical to clinical applications has great potential of providing new imaging biomarkers for early detection, diagnosis and prognosis of many diseases. In vivo human imaging, however, can be more challenging than murine brain imaging. For example, in murine brain imaging, the targeted tissue is shallow, the animal is sedated, the transducer is fixed, and data accumulation for as long as 150 s and 18 bolus injections of microbubbles is achievable [1]. For in vivo human imaging, on the other hand, the targeted tissue can be much deeper (which results in ultrasound signals with lower signal-to-noise-ratio (SNR)), physiologic and operator-induced motion is inevitable (thus reducing the available data accumulation time), and significantly fewer bolus injections (typically 2~5) can be performed [10]. These potential challenges demand substantial technical development of the super-resolution microvessel imaging techniques and need to be addressed before a successful clinical translation can occur.
As part of the efforts to facilitate clinical translation, this study focused on the low SNR issue, which is frequently observed in in vivo human imaging. The common underlying principle of super-resolution microvessel imaging is to localize the center locations of the microbubbles and track the microbubble movement to derive the blood flow speed [1–3, 7]. When the microbubble signal SNR is low (e.g, noise from ultrasound attenuation, thermal noise, residual tissue clutter, etc. is high), it can be challenging to differentiate the isolated microbubble signal from ultrasound noise. This results in unreliable microbubble localization, accumulation, and tracking [2, 5]. This issue may be worse for ultrafast plane wave imaging-based super-resolution imaging because the unfocused plane waves typically have poorer penetration and lower SNR than conventional focused waves, unless a very large number of angular spatial compounding frames are used (which can be inadequate for microbubble tracking due to significantly decreased frame rate) [11]. On the other hand, the ultrafast plane wave data acquisition offers rich spatiotemporal information that can be advantageous for microbubble detection and tracking. In this study, we take advantage of two properties of ultrafast imaging to improve the microbubble localization and tracking: 1) the high frame rate recording of the microbubble signal provides unique microbubble movement “tracks” that can be observed in the spatiotemporal domain, which provides a strong feature that can be used to differentiate microbubble signals from noise; 2) the high frame rate imaging results in highly spatiotemporally coherent microbubble signals from frame to frame, which provides an opportunity to use established global tracking algorithms as commonly used in particle tracking velocimetry (PTV) for robust microbubble tracking. Specifically, for the first point, we propose to implement the nonlocal means (NLM) denoising filter [12] on the spatiotemporal microbubble data to suppress the background noise and extract the microbubble movement tracks; and for the second point we propose to use a two-frame PTV tracking method based on minimum distance bipartite graph pairing [13, 14] to realize efficient and robust microbubble tracking.
To obtain a more realistic imaging environment and a microbubble data set more representative of what is expected in humans, in this paper we used an in vivo rabbit kidney model with freehand scanning to test the proposed methods. Using an in vivo setup also eases the burdens of creating a proper in vitro imaging model (e.g., simulated or phantom data) with the appropriate noise characteristics, which is not trivial and requires additional investigation. Nevertheless, this in vivo experiment setup allows convenient comparisons before and after the application of the proposed methods on the same set of reference data, which is appropriate for the purpose of demonstrating the effectiveness of the introduced methods.
The rest of the paper is organized as follows: in the Materials and Method section, we briefly introduce the animal preparation and key steps of microbubble super-resolution imaging, and then focus on introducing the details of the spatiotemporal NLM denoising method and the bipartite graph microbubble pairing and tracking method. We then show results of the improvement achieved by each method together with the final super-resolved microvessel perfusion image and microvessel blood flow speed image. We finalize the paper with discussion and conclusions.
II. MATERIALS AND METHOD
A. In vivo rabbit study setup
The testing microbubble data set was obtained from a female New Zealand white rabbit. The experiment conformed to the policy of the Institutional Animal Care and Use Committee (IACUC) at Mayo Clinic. The rabbit was anesthetized with ketamine (35.0 mg/kg) and xylazine (6.0 mg/kg). The right kidney of the rabbit was imaged. For ultrasound data acquisition, a Verasonics Vantage system (Verasonics Inc., Kirkland, WA) and a linear array transducer L11-4v (Verasonics Inc., Kirkland, WA) were used. A 5-angle (−4° to 4° with a step size of 2°) plane wave compounding with effective pulse-repetition-frequency (PRF) of 500 Hz was used (center frequency = 8 MHz). The mechanical index (MI) of the transmit pulse was 0.4 [1]. The spatial resolution of the ultrasound data was 0.172 mm. A total of 1000 ensembles were acquired (corresponding to 2 s time duration), with 200 ensembles (0.4 s time duration) acquired in each second (total data acquisition time = 5 s). The rabbit was allowed to have free breathing and freehand scanning was conducted. The imaging field-of-view (FOV) was carefully chosen so that only in-plane kidney motion caused by breathing was observed (i.e., no out-of-plane tissue motion). Before data acquisition, a 0.1 ml (5.0–8.0 × 10⁸ microspheres per mL) bolus injection of Optison (GE Healthcare, Milwaukee, WI) suspension was administered through the marginal ear vein followed by a 1 ml flush of saline. Ultrasound data acquisition started after the kidney was fully perfused by microbubbles.
B. Processing steps for super-resolution imaging
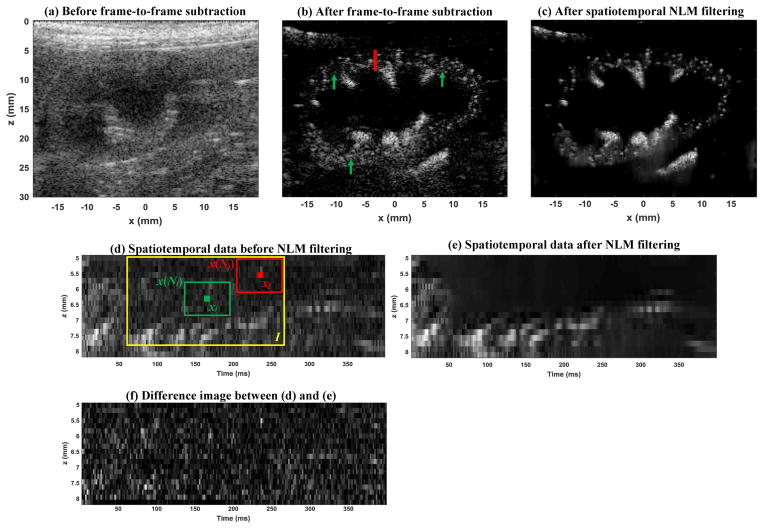
Figure 1 summarizes the key processing steps for super-resolution imaging. A 2-D phase correlation-based rigid geometric image registration method (the “imregcorr.m” function in Matlab) was used to first remove the in-plane tissue motion caused by breathing. The blinking microbubble signal (caused by microbubble movement, disruption, and dissolution) was then extracted by a subtraction of immediately adjacent frames (i.e., frame-to-frame) of the in phase quadrature (IQ) data [1], which removes the background tissue signal and constant microbubble signals. The ultrasound data before and after the frame-to-frame subtraction is shown in Figs. 2(a) and (b), respectively. The extracted blinking microbubble signal was then passed down to the rest of the processing chain.
Figure 1.
Processing steps of microvessel super-resolution imaging.
Figure 2.
Ultrasound amplitude image (B-mode) before frame-to-frame subtraction (a), after frame-to-frame subtraction (b), and after spatiotemporal NLM denoising filtering (c). The red vertical line in (b) indicates the location from which the spatiotemporal data example in (d) was obtained. The green arrows in (b) indicate example locations where the NLM denoising effect can be well appreciated. (d) The spatiotemporal data extracted from (b), with one dimension corresponding to the axial direction z of the ultrasound data, and the other dimension corresponding to time t. The green solid box indicates the targeted pixel, the green box indicates the patch centered on the targeted pixel, the red solid box indicates a nonlocal pixel, the red box indicates the patch centered on the nonlocal pixel, and the yellow box indicates the search window. (e) the NLM filtered result of (d). (f) the difference image between (d) and (e). Movies of the before and after spatiotemporal NLM filtering results (Supplemental videos 1 and 2, respectively) are available in supplemental materials.
C. Spatiotemporal nonlocal means (NLM) denoising filtering
After frame-to-frame subtraction, the blinking microbubble signal is more clearly revealed (Fig. 2(b)). However, one can also easily appreciate the ultrasound noise that resembles the microbubble signal, for example, the locations indicated by the green arrows in Fig. 2(b). Since microbubble localization relies on recognition of patterns that resemble the ultrasound system point-spread-function (PSF), these noise signals can be falsely identified as microbubbles. A 2D spatial smoothing filter combined with amplitude thresholding (i.e., rejection of image intensities values lower than a certain threshold) can alleviate the noise issue. However, this may not work in regions where the noise has amplitude comparable to the microbubble signal, and spatial smoothing filters may merge the originally isolated microbubbles, undermining the super-resolution capability. From an image processing perspective, it is very challenging to separate the microbubble signal from noise based only on the spatial information provided in Fig. 2(b). Therefore, we propose to add the temporal dimension into the processing and consider denoising the microbubble signal in a spatiotemporal domain. Figures 2(d)-(f) show such an example. In Fig. 2(d), one can clearly discern the microbubble “tracks” resulting from microbubble movement with the blood flow in the spatiotemporal domain (axial dimension and temporal dimension), as opposed to the random background noise that does not resemble any feature or pattern. This distinct feature of the microbubble signal in the spatiotemporal domain allows more robust denoising. In this study, we used the established NLM filter for the denoising task, to best preserve the microbubble track features and suppress noise without significant blurring (a key characteristic of NLM filtering). The detailed principles of NLM filtering can be found in [12, 15]. Briefly, as shown in Fig. 2(d), the NLM filter compares the intensity values between two patches of pixels (one patch x(Ni) centered on the targeted pixel xi (indicated by the green box in Fig. 2(d)) and the other patch x(Nj) centered on another pixel xj that is a certain distance away (indicated by the red box in Fig. 2(d)) and replaces the pixel value of xi with a weighted average of the pixel values within the search window (indicated by the yellow box in Fig. 2(d)). Specifically:
| (1) |
where w(i, j) is the weight between patch i and patch j and is given by:
| (2) |
Zi is a normalization factor that ensures the sum of w is equal to unity, and h controls the amount of filtering (the higher the h the more the smoothing). The center pixel xi is assigned with the highest weight obtained from the search window I. As suggested by Eq. (2), the higher the similarity of intensity values between the targeted pixel patch and the nonlocal patch, the higher the weight. The patch size N is typically determined by the size of the feature (i.e, size of the microbubble tracks, which was chosen to be 0.5 mm spatially by 20 ms temporally in this study ) and the search window size I was empirically chosen to be twice the patch size. The smoothing control factor h was chosen to be one standard deviation of the background noise of the spatiotemporal data. After NLM denoising filtering, as shown in Figs. 2(e) and (f), one can see the marked improvement of the signal quality thanks to the effective suppression of background noise by the NLM filter. The microbubble tracks were well preserved with minimum blurring. After applying the NLM filter on the entire data set, one can again appreciate the significant improvement of signal quality in Fig. 2(c), as compared Fig. 2(b). Videos of the microbubble signals before and after the spatiotemporal NLM filtering are provided in the supplemental materials (Supplement videos 1–2).
D. Microbubble localization
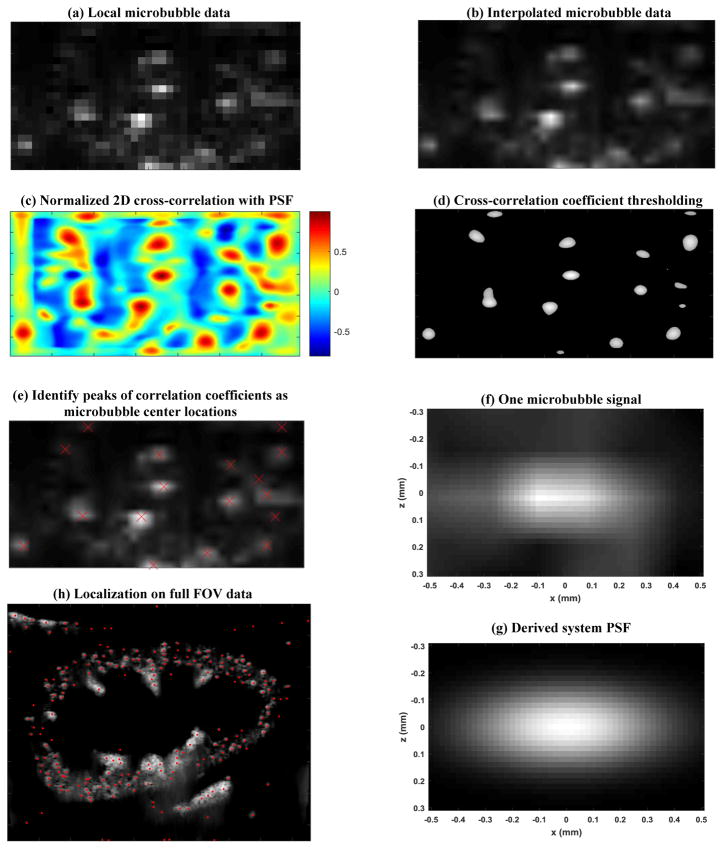
The processing used for microbubble localization is described through an example, as shown in Fig. 3. The NLM filtered microbubble signal was first thresholded by intensity value (i.e., rejecting pixels with intensity values < −40 dB (fine-tuned to this specific dataset) of the maximum microbubble intensity value in each frame) to further suppress unreliable microbubble signal and noise. The data was then spatially interpolated to 0.02 mm resolution using 2D linear interpolation (the “interp2.m” function in Matlab), as shown in Fig. 3(b). A system PSF (Fig. 3(g)) was derived based on typically observed microbubble signal dimensions and shape (i.e., full width at half maximum, Fig. 3(f)) using a multivariate Gaussian model. The PSF was then used to perform a 2D normalized cross-correlation with each frame of the interpolated microbubble signal, resulting in 2D cross-correlation coefficient maps (Fig. 3(c)). Pixels with cross-correlation coefficient less than 0.6 were then rejected, creating isolated blobs. The peaks of each isolated blob, representing the center location of the microbubble, were identified by searching for the regional maximum cross-correlation coefficient value (e.g., “imregionalmax.m” function of Matlab). The example of localization results are given in Figs. 3(e) and (h).
Figure 3.
Processes of microbubble localization. (a) shows an example of a local region of the microbubble data, followed by 2D spatial interpolation (b), normalized 2D cross-correlation with the derived system PSF (c), cross-correlation coefficient thresholding (d), and finally identifying microbubble center locations by searching local maximum correlation coefficient. (e) shows an example of the localization indicated by the red crosses. (f) shows a zoomed-in image of a microbubble signal and (g) shows the derived PSF signal based on (f). (h) shows one example of the microbubble localization result on the full FOV data.
E. Bipartite graph-based microbubble pairing and tracking
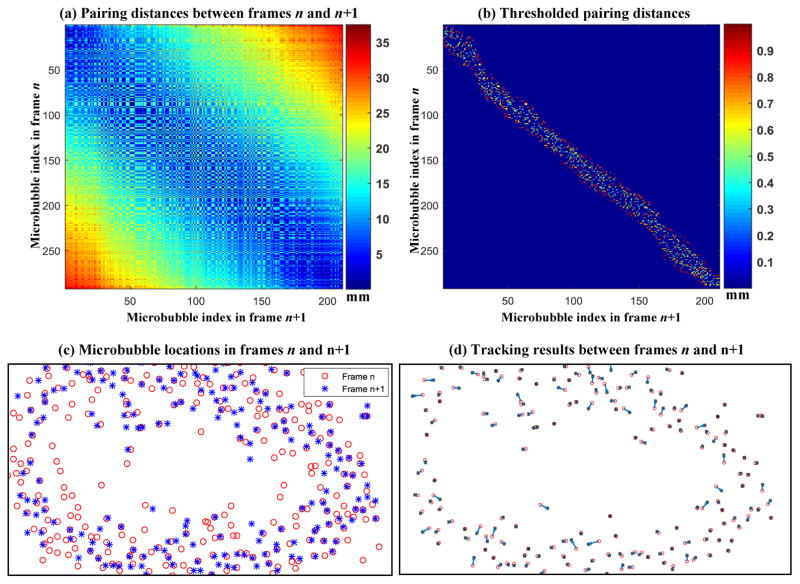
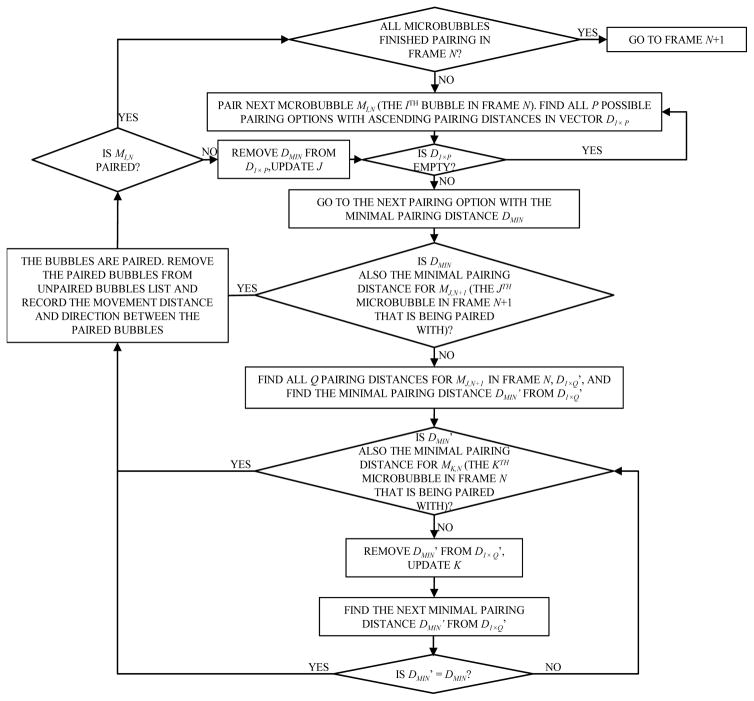
Similar to particle tracking velocimetry (PTV) where high speed cameras capture the motion of flow particles, super-resolution microvessel imaging uses high frame rate ultrasound to capture the flow motion of microbubbles. Because of the high frame rate recording, the most likely position that the same target (i.e., particles or microbubbles) in frame n will appear in frame n+1 is the location that is closest to where the said target was in frame n. Therefore, by pairing targets between consecutive frames in a bipartite graph fashion with the goal of minimizing total pairing distance, the targets can be robustly tracked [13]. Here we use the examples shown in Fig. 4 and the detailed flowchart of the pairing algorithm in Fig. 5 to explain the pairing and tracking method. As shown in Fig. 4(a), the distance between each possible pair of microbubble locations in adjacent frames is first calculated to form a 2D matrix. A physiological blood flow speed limit of 50 cm/s was applied to the distance matrix, rejecting cases of microbubble movement greater than 1 mm with a 2 ms time interval between two consecutive frames (Fig. 2(b)). Mutually pairing each microbubble in frame n and each microbubble in frame n+1 with a minimum total distance can be solved by the classic Hungarian algorithm for assignment problems (a.k.a. Kuhn-Munkres algorithm) [16, 17]. However, due to the existence of false microbubble signals resulting from noise and other microbubble events (e.g., disappearance of microbubble signal or emergence of new microbubble signal), some microbubble signals cannot (and should not) be paired. Standard formulations of the Hungarian algorithm require that all targets in at least one of the frames (the frame with the smaller number of targets) be paired, and this can give a suboptimal result in our situation. Here we developed a partial assignment algorithm for bipartite graph pairing which does not require all targets to be paired. The detailed algorithm is presented in the flowchart in Fig. 5. Briefly, the algorithm enforces that the pairing distance has to be mutually minimal for the paired microbubbles. If a microbubble in frame n has exhausted its pairing options in frame n+1 and still cannot be paired, then this microbubble signal will be discarded. The pairing distance and direction were recorded to track microbubble movement from frame to frame. Figure 4(c) shows an example of microbubble locations in two consecutive frames n and n+1, and Fig. 4(d) shows the pairing result with tracked microbubble movement between the same two frames. One can see that some microbubbles in frame n could not find a paired microbubble in frame n+1, and were consequently discarded.
Figure 4.
(a) Distance matrix obtained by calculating the movement distance between all possible pairings of microbubbles from frame n to frame n+1. The axes indicate the indices of the microbubble locations. (b) Thresholded distance matrix using a blood flow speed limit of 50 cm/s. (c) Microbubble locations in frames n and n+1. (d) Bipartite graph tracking result. The blue arrows indicate the distance and direction of microbubble movement between consecutive frames.
Figure 5.
Flow chart of the partial assignment pairing algorithm based on bipartite graph with minimum pairing distance.
To facilitate more robust microbubble tracking, a persistence control can be conveniently adapted for the proposed pairing method. The persistence control requires that the same microbubbles be paired in P consecutive frames (excluding the current frame where the targeted microbubble is in) to be counted as a reliable microbubble signal, which can then be used in final super-resolution accumulation and blood flow speed calculation. As an example, for P = 3, the same microbubbles have to be paired between frames n and n+1, n+1 and n+2, and n+2 and n+3. The path of the microbubble movement was recorded and each time a microbubble propagated through a pixel, the pixel value was increased by 1. The final super-resolution microvessel perfusion map was constructed from this microbubble counter result. The super-resolution microvessel blood flow speed map was obtained by calculating blood flow speed v at each spatial location (i,j):
| (3) |
where C is the total number of times a microbubble appeared at pixel (i,j), T is the time duration between consecutive frames (i.e., 1/PRF), and Δd is the microbubble movement distance between consecutive frames. To improve robustness of Δd estimation, a cumulative sum ds was calculated from each Δdn obtained from P consecutive frames:
| (4) |
Then a linear fit was performed on ds, and a new step microbubble movement Δd′ can be calculated by:
| (5) |
Δd′ was finally used in Eqn. (3) to calculate microbubble flow speed.
III. RESULTS
A. Spatiotemporal NLM filtering results
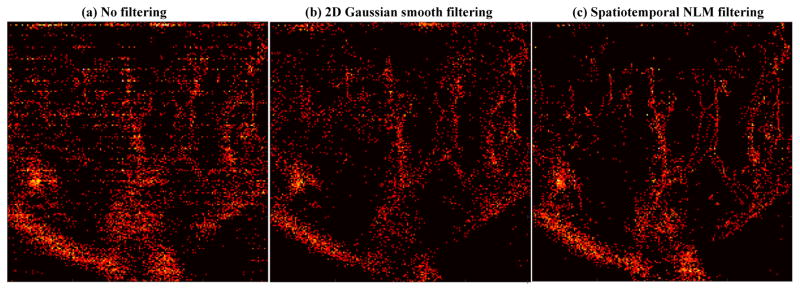
Figure 6 shows one frame of microbubble localization results using the microbubble signal that is not filtered (Fig. 6(a)), filtered with a 2D spatial Gaussian smoothing filter (kernel size = 0.86 mm, σ=1), and the proposed spatiotemporal NLM filter. The impact of noise on microbubble localization is clearly demonstrated in these examples. Without filtering, many false microbubbles are localized. While the 2D Gaussian filter alleviates the noise, it significantly blurs the microbubble signal and results in cases where isolated microbubble sources could not be resolved (examples shown by the green arrows in Figs. 6(b) and (c)). Meanwhile a substantial amount of noise is still misidentified as microbubbles with 2D Gaussian filtering (e.g., the medulla region inside the kidney and the area below the kidney). Spatiotemporal NLM filtering, on the other hand, did not blur the microbubble signal and robustly rejected most of the noise signal.
Figure 6.
Microbubble localization (red dots) using the microbubble signal without any filtering (a), 2D spatial Gaussian smooth filtering (b), and the proposed spatiotemporal NLM denoising filtering (c).
The improvement brought by the spatiotemporal NLM filter can be further illustrated in Fig. 7, which shows the accumulated super-resolution microvessel perfusion images obtained from various filtering options as in Fig. 6 (to facilitate a better visualization of the microvessel structure and improvement, only local regions of the kidney are shown in the comparison results hereinafter). One can appreciate the impact of noise when no filtering is applied. A similar microvascular structure could be observed among the three filtered results, but the NLM filtered result has the least amount of noise and shows marked improvement of delineation of the super-resolved microvessels.
Figure 7.
Accumulated local super-resolution microvessel perfusion images (compressed by taking the square root of the original data for better visualization) obtained with the microbubble signal without any filtering (a), 2D spatial Gaussian smooth filtering (b), and the proposed spatiotemporal NLM denoising filtering (c). All images were from the central upper cortex of the kidney.
B. Bipartite graph pairing results
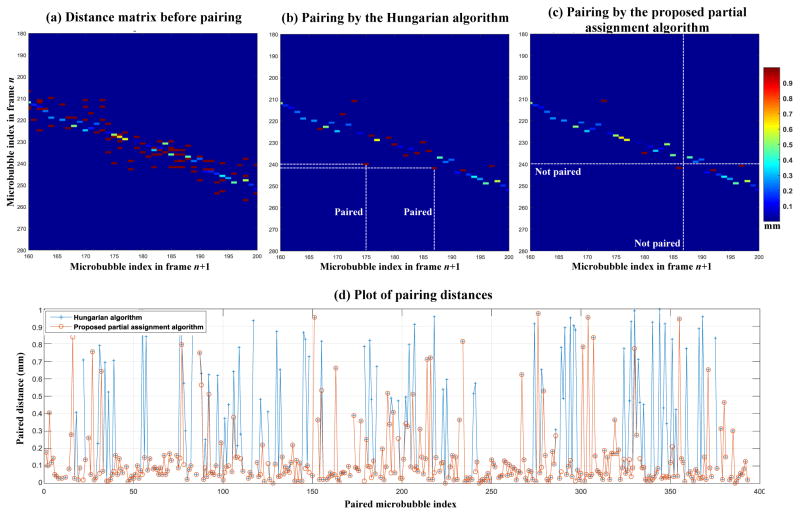
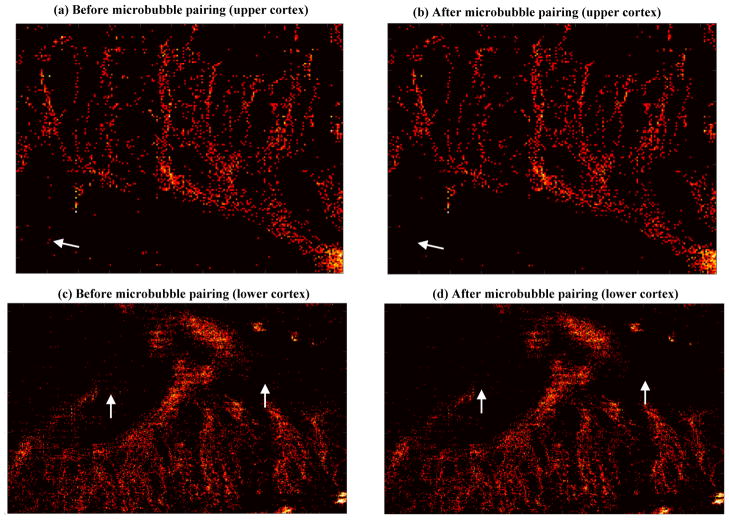
Figure 8 shows example results of microbubble pairing by using the Hungarian algorithm [17] (Fig. 8(b), source code available from [18]) and the proposed partial assignment algorithm (Fig. 8(c)). Similar pairing results were obtained for both algorithms, except for the central portion of the data. As marked by the white dashed lines in Fig. 8(b), the Hungarian algorithm had 2 pairs of microbubbles (one in frame n close to microbubble index number 240 and the other one in frame n+1 close to microbubble index number 187) that were left unpaired (i.e., no intersections with any available distance dots) by the partial assignment algorithm. As a result, the Hungarian algorithm delivered a higher number of pairings, but at the expense of a higher overall pairing distance. For all the microbubbles in this example (Figs. 8(a) and (b) only show part of the pairing distance matrix), the Hungarian algorithm paired 379 pairs of microbubbles with a total pairing distance of 96.6 mm, while the partial assignment algorithm paired 350 pairs of microbubbles with a total pairing distance of 39.5 mm. This can be further illustrated in Fig. 8(d), where it can be seen that for the unmatched pairings between the two algorithms, the Hungarian algorithm typically provides a higher pairing distance. One reason for this behavior of the Hungarian algorithm, which was originally designed to solve the assignment problem with the goal of minimizing total assignment cost, is that it provides as many pairings as possible while minimizing the pairing distances. For microbubble pairing, however, due to the existence of false microbubble signals and the disappearance or birth of microbubbles, maximizing the number of pairings may not be the optimal solution. The proposed partial assignment algorithm trades off the total number of pairings for lower pairing distances and allows for discarding microbubbles that cannot be paired. The final accumulated super-resolution microvessel perfusion images before and after pairing with the proposed partial assignment algorithm are shown in Fig. 9. It can be seen that the pairing process – and the discarding of signals that could not be paired – gave rise to a further reduction of unreliable microbubble signals and noise (example regions indicated by white arrows), especially for the lower cortex of the kidney with relatively low microbubble SNR.
Figure 8.
Distance matrix before microbubble pairing, after pairing with the Hungarian algorithm (b), and after pairing with the proposed partial assignment algorithm (c). (d) plot of the paired distances for both pairing algorithms.
Figure 9.
Accumulated microvessel super-resolution perfusion maps (compressed by taking the square root of the original data for better visualization) before (a and c) and after (b and d) microbubble pairing.
C. Persistence controlled pairing and tracking results
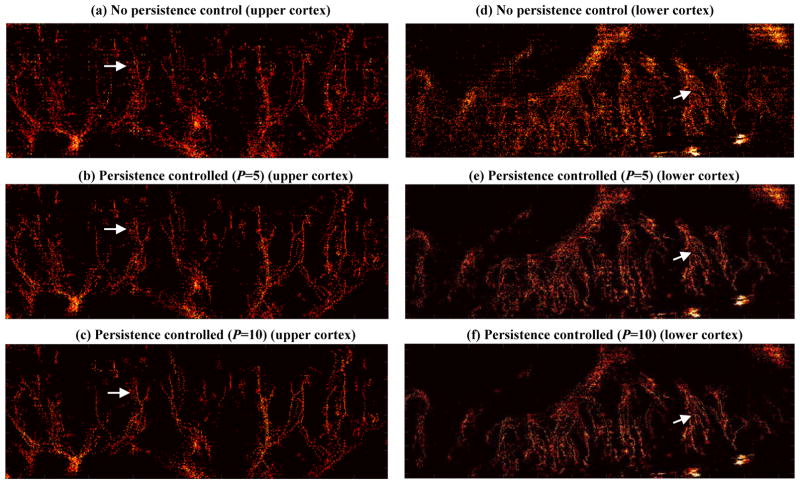
Figure 10 shows the accumulated super-resolution microvessel images with different persistence control settings. The images without persistence control are the same as the post-pairing results shown in Fig. 9. From Fig. 10 one can see that persistence control further reduces noise and enhances microvessels with persistent microbubble signals that can be tracked for multiple frames (example regions indicated by white arrows). Similar to the observation in Fig. 9, the improvement is more significant for the lower cortex of the kidney. The higher the persistence control factor the higher the fidelity of microbubble tracking. However, the higher constraint of multi-frame tracking from the high persistence control may also eliminate real microvessels and results in a less detailed microvascular image (e.g., Figs. 10(c) and (d)). As shown in Fig. 10, a persistence control factor of 5 (i.e., the same microbubble has to be tracked continuously within a 10ms time interval) empirically provides a good tradeoff between noise reduction and microvessel visualization. In this dataset, a total number of approximately 1.1 × 10⁵ microbubble events were detected after the NLM denoising and microbubble localization processes. After the pairing and persistence control steps, ~0.6 × 10⁵ microbubble events were preserved and used to construct the final microvessel perfusion and flow speed maps.
Figure 10.
Accumulated local microvessel super-resolution perfusion maps (compressed by taking the square root of the original data for better visualization) without persistence control (a and d), with persistence control P = 5 (b and e) which corresponds to 10 ms of multi-frame tracking, and with persistence control P = 10 (c and f) which corresponds to 20 ms of tracking.
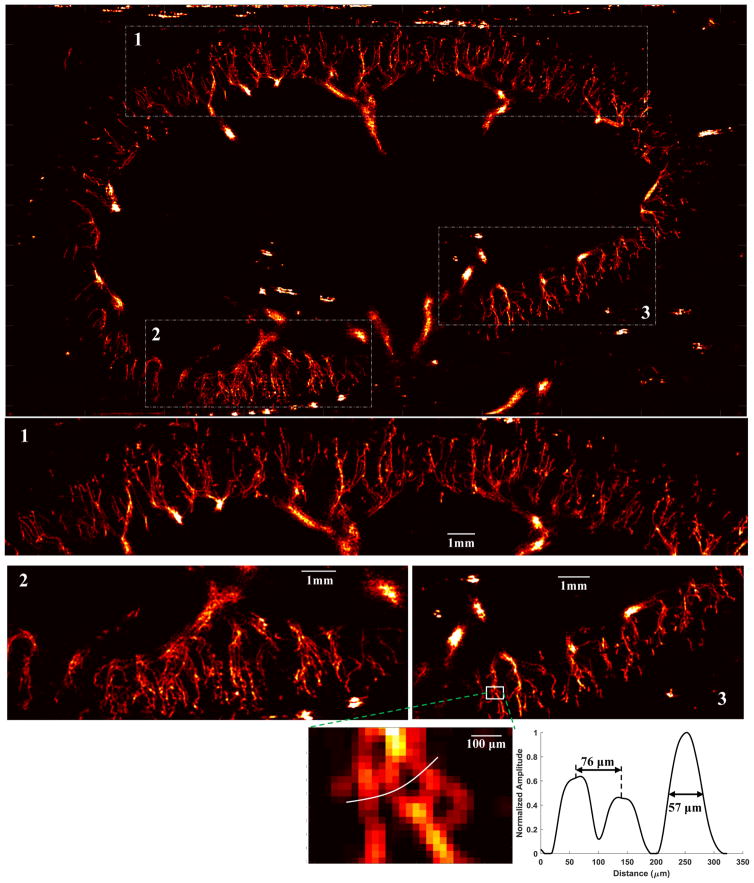
To effectively alleviate the sparse and pixelated appearance of the super-resolved microvessel images without introducing blurring, a local weighted average algorithm proposed in [3] can be implemented. Briefly, for a non-zero local window (i.e., regions for which at least one microbubble propagated through), the center pixel value is replaced by a distance-weighted average of all non-zero pixel values within this local window. In this study, a 3 × 3 (0.06 mm × 0.06 mm) local window was used for weighted averaging. Figure 11 shows the final weighted average result of the P = 5 persistence controlled microvessel image. At approximately 2 cm depth, a single microvessel cross-section profile with full width at half maximum of 57 μm could be imaged. Microvessels that are 76 μm apart can also be clearly separated. Although one can clearly observe the larger vessels (e.g., vessels larger than arterioles) in Fig. 11, multiple microbubble passages may be necessary to robustly measure their dimensions. A movie showing the dynamic super-resolved microvessel accumulation process can be found in Supplemental video 3.
Figure 11.
Super-resolution microvessel perfusion images processed with the local weighted averaging method. Three regions of the original microvessel image were magnified to show the detailed microvasculature. The dynamic microvessel accumulation process can be found in Supplemental video 3. Bottom panel: a branching microvessel at about 2cm depth was located to measure the microvessel cross-section profile.
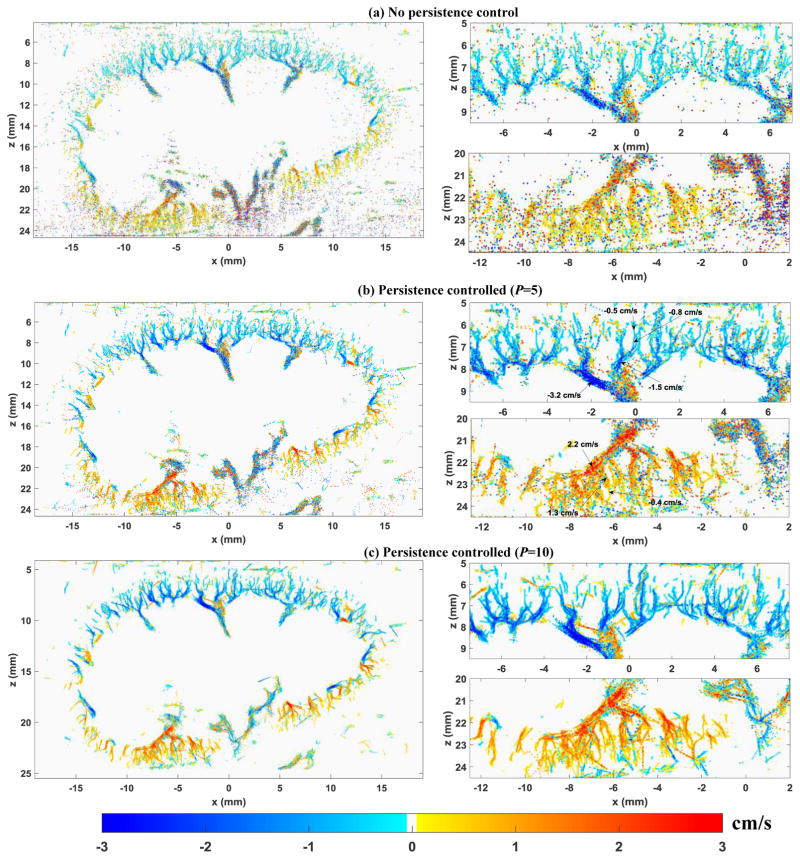
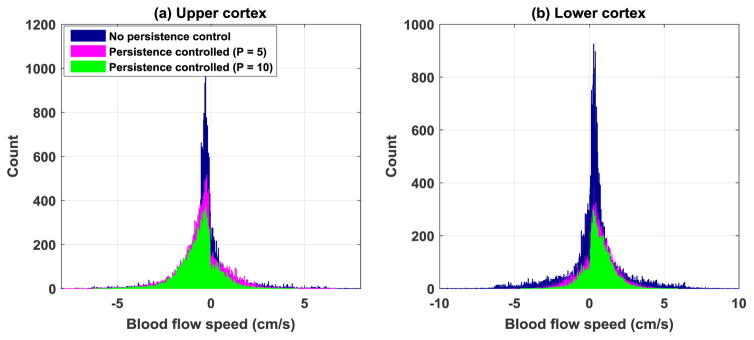
The improvement from the persistence control method can be further illustrated by the microvessel blood flow speed maps in Fig. 12. All the blood flow speed maps were processed with the local weighted average method. The blood flow direction was color-coded with blue corresponding to blood flow towards the transducer and red corresponding to flow away from the transducer. The blood flow speed measurement distributions of the local upper cortex and lower cortex of the kidney as in Fig. 12 are shown as histograms in Fig. 13. From Fig. 12, one can see that similar to the observations from the microvessel perfusion images, persistence control was effective in suppressing the noise and providing a better delineation of the microvessels. Figure 13 shows a narrower blood flow speed distribution with a higher persistence control factor, which indicates that a more uniform and consistent blood flow speed measurement could be achieved with persistence control. Similar to the observations above, the improvement is more pronounced for the lower cortex of the kidney where the microbubble SNR is relatively low.
Figure 12.
Super-resolution microvessel blood flow speed maps obtained from different amount of persistence control. The left column shows the global result and the right column shows the magnified local regions in the upper kidney cortex (upper panel) and lower kidney cortex (lower panel). All blood flow speed maps are under the same scale indicated by the color bar. Flow direction towards the ultrasound transducer was color-coded in blue, and away from the transducer was color-coded in red.
Figure 13.
Histograms showing blood flow speed measurement distributions with different persistence control settings. (a) Upper cortex of the kidney. (b) Lower cortex of the kidney. The same regions of the upper and lower cortex as in Fig. 12 were used to generate the histograms.
D. Comparisons with the Hungarian algorithm-based tracking and cross-correlation-based local microbubble tracking methods
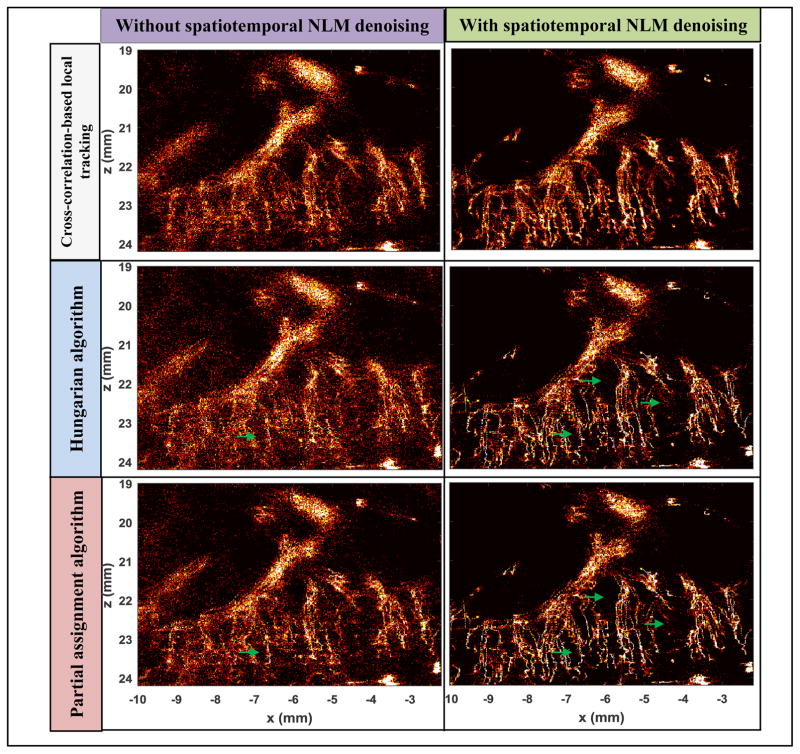
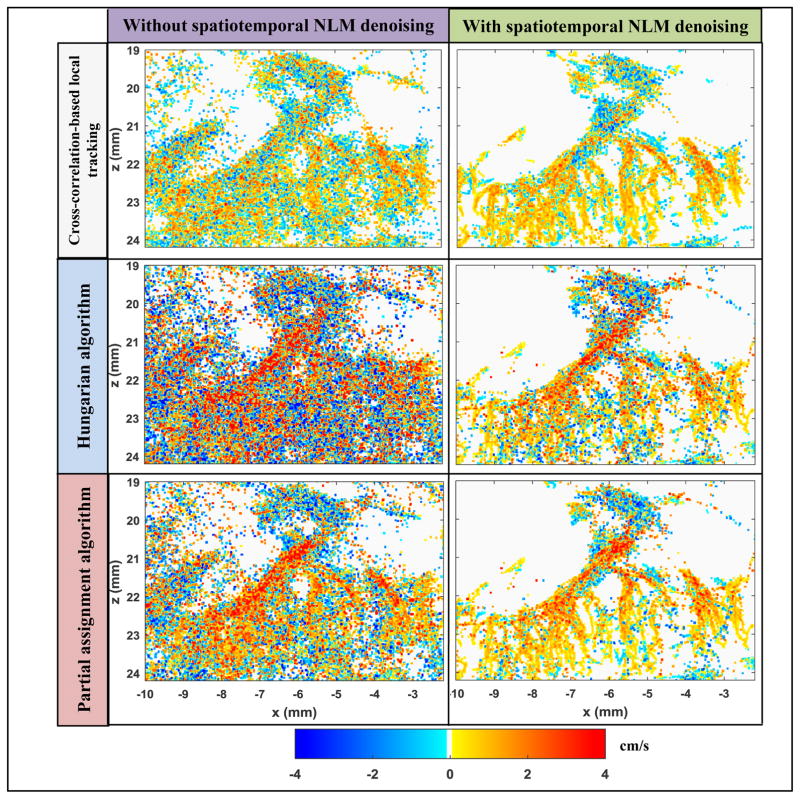
Figures 14 and 15 further demonstrate the effectiveness of the spatiotemporal NLM denoising filter in facilitating more robust microbubble tracking by suppressing noise. Both figures also demonstrated comparisons among different tracking methods that include the cross-correlation-based local microbubble tracking technique similar to the ones used in Errico et al. [1] and Christensen-Jeffries et al. [3], the Hungarian algorithm, and the proposed partial assignment algorithm. Both Hungarian and partial assignment methods used a blood flow speed limit of 50 cm/s. All tracking methods used the same microbubble localization signals. For cross-correlation-based local tracking, a 42 μm by 62 μm (axial by lateral) local window (about the size of a single microbubble PSF) centered on the microbubble peak was used to search in an 82 μm by 122 μm search window in adjacent frames by use of 2D normalized cross-correlation. Microbubble movement was estimated by locating the peak of the normalized cross-correlation coefficient. For all tracking methods, a persistence control of 5 frames was used to reject unreliable microbubble signals. As shown in Figs. 14 and 15, all tracking methods showed substantially improved results after the spatiotemporal NLM filtering. There was significantly less noise in the microvessel density maps as well as the blood flow speed maps with the NLM denoising filter. Among various tracking methods, the proposed partial assignment algorithm showed improved results over the Hungarian algorithm both with and without the NLM filter (green arrows in Fig. 14), especially for the flow speed estimates. This can be attributed to the more robust microbubble pairing by the proposed partial assignment algorithm as illustrated in Fig. 8. Cross-correlation-based local tracking showed similar performance as the partial assignment algorithm. This is expected because as shown in Supplemental video 2, the microbubble density in this study was low and thus it was straightforward to use the local cross-correlation-based approach for bubble tracking. In cases where microbubble density is high or microvessel morphology is more complicated, a more elegant local tracking method such as the Markov chain-based tracking algorithm proposed in [2] may be necessary. Table I summarizes the computational cost of the NLM denoising filter and each tracking algorithm. Both Hungarian algorithm and partial assignment algorithm are significantly cheaper than the cross-correlation-based local tracking method. This is because both Hungarian and partial assignment methods converted the tracking problem to a much simpler task of finding the track in a 2D distance matrix (Fig. 4(b)) that gives minimal total pairing distance. Computationally this is much less intensive than normalized cross-correlation-based searching for each individual microbubble.
Figure 14.
Microvessel density images processed with various combinations of filtering and tracking methods. Right column images were all denoised with the spatiotemporal NLM filter, and the left column images were not. The corresponding pairing and tracking algorithms are listed on the left side of each row. All density images are displayed under the same scale, which was intentionally set to make the images saturated in order to better illustrate the noise differences among different methods.
Figure 15.
Microvessel blood flow speed images processed with various combinations of filtering and tracking methods. Right column images were all denoised with the spatiotemporal NLM filter, and the left column images were not. The corresponding pairing and tracking algorithms are listed on the left side of each row. All flow speed maps are displayed under the same scale.
Table I.
Computational time associated with NLM filtering and different tracking methods
| Method | Computation time (s) |
|---|---|
| NLM denoising filter | 396.8 |
| Cross-correlation based local tracking | 2735.9 |
| Hungarian algorithm | 86.2 |
| Partial assignment algorithm | 81.1 |
DISCUSSION
In this study we proposed two methods to take advantage of the rich spatiotemporal information of ultrafast plane wave imaging data, with the objectives of improving microbubble localization and tracking to improve the overall robustness of super-resolution microvessel imaging. The first method applied the nonlocal means (NLM) denoising filter on the spatiotemporal microbubble signal to effectively suppress the decorrelated background ultrasound noise by preserving the coherent microbubble movement tracks. The second method uses the principles of bipartite graph pairing to robustly track microbubble motion by minimizing the global pairing distances while allowing for the presence of signals that should not be paired. Each step of the two methods showed significant reduction in noise and enhanced microvessel image quality in an in vivo rabbit kidney data set. A final super-resolution microvessel image was generated in which microvessels as small as 57 μm in full width at half maximum could be discerned and 76 μm apart could be separated at 2 cm depth, together with quantitative Doppler-angle independent blood flow speed measurements for each microvessel.
An NLM denoising filter has been previously used in ultrasound B-mode imaging and showed superior performance in preserving the ultrasound image features without blurring while achieving substantial speckle reduction [12]. Similar to the speckle reduction application, the spatiotemporal microbubble data also presents strong features from microbubble movement while background noise is random and redundant. This provides an ideal situation for the NLM denoising filter. Figure 16(b) shows an example of implementing the NLM denoising filter solely on the spatial domain (i.e., axial and lateral dimensions) of the microbubble data (i.e., to denoise Fig. 2(b)), as opposed to spatiotemporal filtering. One can see that the spatial NLM filter could not provide as robust denoising as the spatiotemporal NLM filter, especially for the lower left region of the kidney cortex (indicated by the white arrows). This is because with spatiotemporal filtering, the microbubble behavior over time provides strong features that allow the NLM to perform well. In this paper the spatiotemporal microbubble data was extracted from the axial-temporal domain of the ultrasound data (i.e., the NLM filter was performed on 2D microbubble data with one dimension in axial dimension and the other dimension in temporal dimension). An alternative spatiotemporal data can be extracted from the lateral-temporal domain, and the NLM filtered result is shown in Fig. 16(c). While the lateral-temporal filtering provides slightly better denoising result than spatial NLM filtering (Fig. 16(b)), it is still not as good as the axial-temporal NLM filter. The microbubbles are also better isolated (e.g., region indicated by red arrows) by using the axial-temporal data. One potential reason for the better performance of axial-temporal filter in this study is that kidney blood flow direction is primarily along the axial direction (Supplemental videos 1 and 2), which provides a stronger microbubble movement feature that facilitates a more robust NLM denoising. Theoretically a 3D NLM filter (two dimensions in space and one dimension in time) should be able to account for the different microbubble movement directions. However, 3D NLM filter can be very computationally expensive for the large ultrafast ultrasound data size. Future studies need to be conducted to fully investigate the feasibility of using 3D NLM filters for microbubble signal denoising.
Figure 16.
Microbubble images filtered by the spatiotemporal (axial-temporal dimension of data) NLM denoising filter (a), the spatial (axial-lateral dimension of data) NLM denoising filter, and an alternative spatiotemporal NLM filter using data in lateral-temporal dimension.
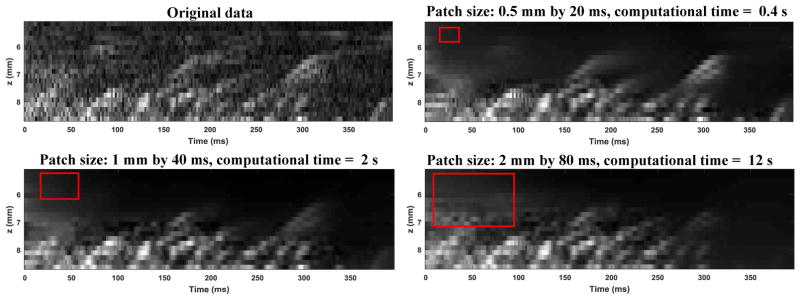
The patch size selection of the NLM denoising filter has a significant impact on microbubble signal denoising and computational cost: larger patch sizes tend to smooth out more features (i.e., bubble tracks) and are more computationally expensive, while smaller patch sizes tend to preserve more features and are faster to compute. This can be illustrated by Fig. 17 below which shows the effect of NLM denoising using different sized patches (indicate by the red boxes). The patch size of 0.5 mm by 20 ms was used in this study to achieve optimal denoising without suppressing microbubble signals.
Figure 17.
Effect of patch size on NLM denoising and computational time. The red box in each figure indicates the patch size. The search window size is twice the patch size in each dimension.
Unlike local microbubble tracking techniques (such as the cross-correlation-based method showed in this study) where a local search window is typically used to locally monitor the microbubble movement, the bipartite graph pairing and tracking algorithm tracks microbubble movement on a global scale. The basic principle of this tracking method, similar to the case in PTV, is that under high speed tracking the most likely position in which a microbubble will appear in the next frame is in the close vicinity of its position in the current frame. This can be demonstrated in the microbubble signal movie in Supplemental video 1. Another advantage of the global tracking method is that all possible pairings are considered simultaneously between two consecutive frames in the form of a pairing distance matrix, and the task of pairing and tracking is condensed into a simple 2D matrix (e.g., Fig. 4(b)) by minimizing the global pairing distances. This avoids the use of computationally expensive local tracking methods such as 2D cross-correlation (Table I) and the need to establish complicated models to track a large number of microbubbles simultaneously.
This study aimed at addressing the potential low SNR issue when performing super-resolution microvessel imaging in human. As mentioned in the introduction, there are many other potential technical challenges of the super-resolution imaging technique. For example, in this study a basic phase correlation image registration method was used to remove the global tissue motion caused by breathing. Recently a fine-tuned phase-correlation based rigid-motion correction method designated for ultrasound localization microscopy was proposed [19]. These methods may be acceptable for motions similar to the kidney motion observed in this study which was mostly global (i.e., the entire kidney moves together) and translational. For more complicated non-rigid tissue motion a more robust registration method may be necessary. In addition, in this study a simulated ultrasound system PSF was used to localize the microbubble location. The PSF was simulated based on measuring the typical microbubble dimensions and shapes (e.g., full width at half maximum) observed in the rabbit kidney data. In practice, the ultrasound PSF is not spatially invariant and can be affected by confounding factors such as phase aberration, reverberation, and other noise. The PSF may also be different among different imaging systems and imaging applications. A more advanced deconvolution method such as blind deconvolution may be more reliable in localizing the microbubbles. Nevertheless, the proposed NLM filtering and microbubble pairing methods can improve upon these techniques and increase the overall robustness of super-resolution imaging.
The theoretical resolution limit of the super-resolution imaging sequence used in this study can be calculated following the theories proposed in Errico et al. [1], where the axial resolution limit is given by the axial localization error (c is the ultrasound speed, στ is the timing resolution of the system given by Eq. (6) below, and n is the number of channels used in receive processing), and the lateral resolution limit is given by the lateral localization error (f is the focal length and D is the transducer array dimension). The timing resolution limit of the system στ is bounded by the Cramér-Rao lower bound (CRLB) of the ultrasound system, which is given by [20]:
| (6) |
where f0 is the ultrasound transmit pulse center frequency (8 MHz), T is the kernel size for the time delay estimation (for microbubble localization, this is essentially the timing resolution of the raw channel RF signal, which is equal to 28 ns in this study), B is the bandwidth of the transmit pulse (conservatively estimated to be 25%), ρ is the normalized correlation coefficient between the experimental signal and the reference PSF used for localization (the correlation cutoff threshold value of 0.6 as in Fig. 3(d) was used to be conservative), and SNR is the signal-to-noise-ratio and was assumed to be 20 dB. στ was calculated to be 80.3 ns, which gives an axial resolution limit of 5.5 μm, and lateral resolution limit of 9.9 μm at 1 cm depth, and 19.7 μm at 2 cm depth (elevational focal depth of the L11-4v transducer). The lateral resolution limit at the elevational focal depth is approximately 1/10 of the diffraction limit of the 8 MHz transmit pulse, which is 192.5 μm. This is in good agreement with the observations reported in Errico et al. [1] and Desailly et al. [9].
In this study, a simple and cheap frame-to-frame subtraction method was used to reject tissue signal and extract the blinking microbubble signal. Recently multiple studies have shown the robustness of using SVD-based clutter filters for microvessel tissue clutter filtering [21–23]. However, as compared to frame-to-frame subtraction, SVD-based filters can be computationally more expensive. In this study, we found the frame-to-frame subtraction method effective in tissue signal suppression thanks to the high frame-rate imaging and significantly improved SNR of blood signal provided by microbubbles. In cases where blood flow speed is significantly higher or the imaging frame rate is significantly lower, however, the frame-to-frame subtraction may result in inaccurate microbubble peak locations. More advanced filtering techniques such as SVD may be more appropriate for these applications. Future studies are needed to systematically investigate the impact of different tissue rejection and microbubble extraction techniques for super-resolution imaging.
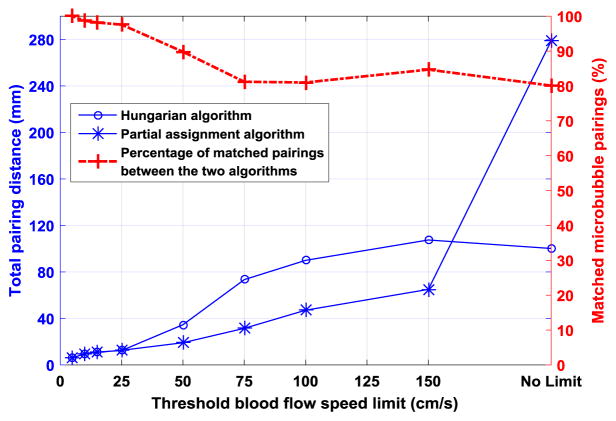
Similar to the Hungarian algorithm, the partial assignment algorithm developed in this study is based on the bipartite graph matching theory that specifically deals with weighted bipartite graphs [24] (that is, the edges connecting vertices of the graph have different weights, such as the pairing distance between microbubbles in this study). The Hungarian algorithm provides optimal solutions to this kind of “max-flow, min-cost” problem (i.e., maximum matching with minimum cost) with the premise that the final matching has to be perfect (a perfect matching requires all vertices to be adjacent to some edge) [25]. This is the key difference between the Hungarian algorithm and the proposed partial assignment approach which does not require the matching to be perfect - some microbubbles were allowed to be unpaired and discarded. Note that the partial assignment in this study is different from the partial association problem in the Hungarian algorithm in which, for instance, M workers need to be assigned to N jobs with M ≥ N, and the Hungarian algorithm will guarantee N parings (i.e., a perfect match) while our algorithm does not (e.g., final number of parings ≤ N). This allows the proposed algorithm to be more flexible and effective in rejecting false and unreliable microbubble signals (Fig. 8), which is not a problem that the Hungarian algorithm was originally designed to solve. Figure 18 further illustrates the difference between the two algorithms by comparing the pairing results from the same set of microbubble location data. One can see that the proposed partial assignment algorithm consistently provided lower total pairing distances than the Hungarian algorithm, except when no blood flow speed limit was utilized (that is, using the original distance matrix as in Fig. 4 (a) for pairing). This is expected because the Hungarian algorithm is the optimal solution to a weighted pairing problem as in Fig. 4 (a), when no a priori information about microbubble flow speed is provided. When a priori blood flow speed limit was used as thresholds to reject unrealistic distance entries (Fig. 4 (b)), as shown in Fig. 18, both algorithms showed improved performances with a descending trend of pairing distances. A speed limit of 150 cm/s was sufficient to ensure robust performance of the proposed algorithm, which is a very relaxed constraint because the upper bound of physiological range of normal blood flow speed is typically less than 150 cm/s (e.g., peak common carotid artery blood flow speed is approximately 66 cm/s [26]). The two algorithms showed well-matched pairing results that were over 80% for blood flow speed limit greater than 75 cm/s, about 90% for the 50 cm/s limit used in this study, and nearly 100% for speed limit less than 25 cm/s, which is also the point when the pairing distance curves of the two algorithms eventually merged.
Figure 18.
Pairing performances of the Hungarian algorithm and the proposed partial assignment algorithm with various blood flow speed limits as thresholds to reject entries of the pairing distance matrix. The left axis indicates the total pairing distance between two consecutive frames with localized microbubble signals, and the right axis indicates the percentage of matched pairings between the two algorithms.
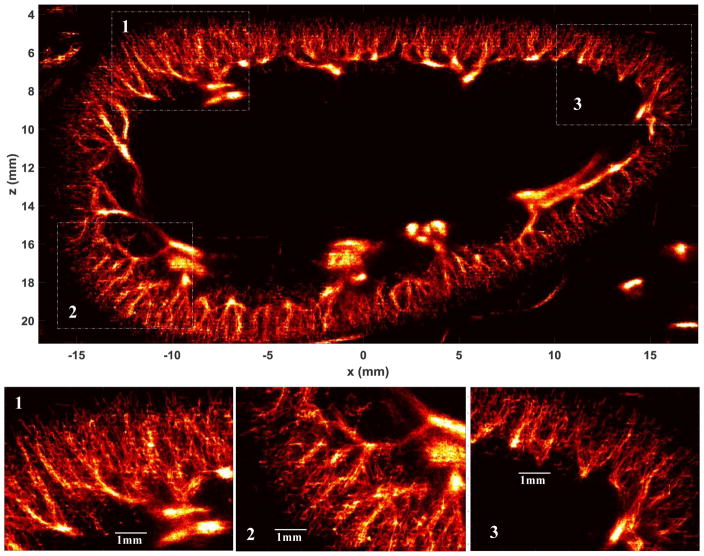
There are some limitations of this study. First, the proposed methods were tested on an in vivo rabbit kidney data set where the ground truth of the microvessel structure and microvessel blood flow speed was unknown. The microvessel structure can be potentially validated with other imaging techniques such as micro computed tomography (CT). However, the microvessel blood flow speed may be difficult to validate in vivo. A simulation platform or a tissue mimicking microflow phantom with appropriate in vivo microvessel hemodynamics and noise characteristics may be needed for the validation. Second, we did not compare the proposed tracking methods with existing microbubble tracking methods such as the Markov chain-based technique proposed in [2]. This study was designed to show the step-by-step improvements from the proposed methods based on the same reference data. Future studies will be conducted to further validate the proposed methods with the existence of ground truth as well as comparing with other microbubble tracking techniques. And finally, the dataset used in this study was obtained from a short acquisition that only lasted 5 seconds, which may result in an insufficient number of microbubble events to accurately depict the kidney microvasculature. With a long-term goal of clinical translation of the super-resolution imaging technique, in this study we performed free-hand scanning and allowed the rabbit to breathe freely to best mimic in vivo human scanning. Also we acquired microbubble data from only 1 bolus injection (with dose adjusted to the weight of the rabbit), which was also attempting to simulate a human imaging setup. Combining all these factors, it was challenging to obtain a long and rich microbubble dataset without significant tissue motion that is similar to the 150s dataset with 18 bolus injections and fixed transducer scanning used in Errico et al. [1]. At present, the longest robust dataset we were able to acquire lasted 15 seconds with a total of 4125 frames (as compared to the 5 seconds data with 1000 frames used above) and ~3 × 10⁵ microbubble events (single bolus injection). The microvessel perfusion image from this dataset is shown in Fig. 19. One can clearly see the significantly improved details of the kidney cortical microvessels with this dataset. Future investigations need to be conducted to increase microbubble blinking events with a limited dose of bolus injection in clinic and improve the robustness of image registration to maximize the available microbubble signals that can be used for super-resolution imaging of the tissue microvasculature.
Figure 19.
Super-resolution kidney microvessel perfusion images from the 15s dataset with 4125 frames acquired from a free-breathing rabbit with free-hand scanning and a single bolus injection.
CONCLUSIONS
In this study we demonstrated significant improvement of microvessel super-resolution imaging by using a spatiotemporal nonlocal means (NLM) denoising filter and the bipartite graph-based microbubble pairing and tracking. The NLM filter effectively rejected ultrasound noise and preserved the microbubble signal without significant blurring, facilitating more robust microbubble localization. The bipartite graph-based pairing with persistence control further suppresses unreliable microbubble signals and enhances the microvessel imaging quality as well as the consistency of microvessel blood flow speed measurement. This study demonstrated visualization of microvessels as small as 57 μm and separation of microvessels that are 76 μm apart at 2 cm depth from a freely-breathing rabbit with a freehand ultrasound scan, paving the way for the future clinical translation of the microvessel super-resolution imaging technique.
Supplementary Material
Acknowledgments
This publication was supported by the National Cancer Institute (NCI) of the National Institutes of Health (NIH) under Award Number K99CA214523 and funding from General Electric (GE) Healthcare. The content is solely the responsibility of the authors and does not necessarily represent the official views of the National Institutes of Health.
Contributor Information
Pengfei Song, Department of Radiology, Mayo Clinic College of Medicine, Rochester, MN 55905 USA.
Joshua D. Trzasko, Department of Radiology, Mayo Clinic College of Medicine, Rochester, MN 55905 USA.
Armando Manduca, Department of Physiology and Biomedical Engineering, Mayo Clinic College of Medicine, Rochester, MN 55905 USA.
Runqing Huang, Division of Cardiovascular Diseases, Mayo Clinic College of Medicine, Rochester, MN 55905 USA.
Ramanathan Kadirvel, Department of Radiology, Mayo Clinic College of Medicine, Rochester, MN 55905 USA.
David F. Kallmes, Department of Radiology, Mayo Clinic College of Medicine, Rochester, MN 55905 USA
Shigao Chen, Department of Radiology, Mayo Clinic College of Medicine, Rochester, MN 55905 USA.
References
- 1.Errico C, Pierre J, Pezet S, Desailly Y, Lenkei Z, Couture O, Tanter M. Ultrafast ultrasound localization microscopy for deep super-resolution vascular imaging. Nature. 2015 Nov 26;527:499–502. doi: 10.1038/nature16066. [DOI] [PubMed] [Google Scholar]
- 2.Ackermann D, Schmitz G. Detection and Tracking of Multiple Microbubbles in Ultrasound B-Mode Images. IEEE Trans Ultrason Ferroelectr Freq Control. 2016 Jan;63:72–82. doi: 10.1109/TUFFC.2015.2500266. [DOI] [PubMed] [Google Scholar]
- 3.Christensen-Jeffries K, Browning RJ, Tang MX, Dunsby C, Eckersley RJ. In vivo acoustic super-resolution and super-resolved velocity mapping using microbubbles. IEEE Trans Med Imaging. 2015 Feb;34:433–40. doi: 10.1109/TMI.2014.2359650. [DOI] [PubMed] [Google Scholar]
- 4.Viessmann OM, Eckersley RJ, Christensen-Jeffries K, Tang MX, Dunsby C. Acoustic super-resolution with ultrasound and microbubbles. Phys Med Biol. 2013 Sep 21;58:6447–58. doi: 10.1088/0031-9155/58/18/6447. [DOI] [PubMed] [Google Scholar]
- 5.Lin F, Shelton SE, Espindola D, Rojas JD, Pinton G, Dayton PA. 3-D Ultrasound Localization Microscopy for Identifying Microvascular Morphology Features of Tumor Angiogenesis at a Resolution Beyond the Diffraction Limit of Conventional Ultrasound. Theranostics. 2017;7:196–204. doi: 10.7150/thno.16899. [DOI] [PMC free article] [PubMed] [Google Scholar]
- 6.Bar-Zion A, Tremblay-Darveau C, Solomon O, Adam D, Eldar YC. Super-Resolution Ultrasound Imaging of Vascular Structures with High Temporal Resolution. 2016 arXiv preprint arXiv:1601.05710. [Google Scholar]
- 7.Hansen KB, Villagómez-Hoyos CA, Brasen JC, Diamantis K, Sboros V, Sørensen CM, Jensen JA. Robust microbubble tracking for super resolution imaging in ultrasound. 2016 IEEE International Ultrasonics Symposium (IUS); 2016. pp. 1–4. [Google Scholar]
- 8.Couture O, Besson B, Montaldo G, Fink M, Tanter M. Microbubble ultrasound super-localization imaging (MUSLI). 2011 IEEE International Ultrasonics Symposium; 2011. pp. 1285–1287. [Google Scholar]
- 9.Desailly Y, Pierre J, Couture O, Tanter M. Resolution limits of ultrafast ultrasound localization microscopy. Physics in Medicine and Biology. 2015 Nov 21;60:8723–8740. doi: 10.1088/0031-9155/60/22/8723. [DOI] [PubMed] [Google Scholar]
- 10.Dietrich CF, Averkiou MA, Correas JM, Lassau N, Leen E, Piscaglia F. An EFSUMB introduction into Dynamic Contrast-Enhanced Ultrasound (DCE-US) for quantification of tumour perfusion. Ultraschall Med. 2012 Aug;33:344–51. doi: 10.1055/s-0032-1313026. [DOI] [PubMed] [Google Scholar]
- 11.Montaldo G, Tanter M, Bercoff J, Benech N, Fink M. Coherent plane-wave compounding for very high frame rate ultrasonography and transient elastography. IEEE Transactions on Ultrasonics Ferroelectrics and Frequency Control. 2009 Mar;56:489–506. doi: 10.1109/TUFFC.2009.1067. [DOI] [PubMed] [Google Scholar]
- 12.Coupe P, Hellier P, Kervrann C, Barillot C. Nonlocal means-based speckle filtering for ultrasound images. IEEE transactions on image processing: a publication of the IEEE Signal Processing Society. 2009 Oct;18:2221–9. doi: 10.1109/TIP.2009.2024064. [DOI] [PMC free article] [PubMed] [Google Scholar]
- 13.Jonas S, Bhattacharya D, Khokha MK, Choma MA. Microfluidic characterization of cilia-driven fluid flow using optical coherence tomography-based particle tracking velocimetry. Biomedical optics express. 2011;2:2022–2034. doi: 10.1364/BOE.2.002022. [DOI] [PMC free article] [PubMed] [Google Scholar]
- 14.Plummer MD, Lovász L. Matching theory. Elsevier; 1986. [Google Scholar]
- 15.Buades A, Coll B, Morel JM. A Review of Image Denoising Algorithms, with a New One. Multiscale Modeling & Simulation. 2005;4:490–530. [Google Scholar]
- 16.Kuhn HW. The Hungarian method for the assignment problem. Naval Research Logistics Quarterly. 1955;2:83–97. [Google Scholar]
- 17.Munkres J. Algorithms for the Assignment and Transportation Problems. Journal of the Society for Industrial and Applied Mathematics. 1957;5:32–38. [Google Scholar]
- 18.Cao Y. Munkres’ Assignment Algorithm. 2008 Available: http://csclab.murraystate.edu/~bob.pilgrim/445/munkres.html.
- 19.Hingot V, Errico C, Tanter M, Couture O. Subwavelength motion-correction for ultrafast ultrasound localization microscopy. Ultrasonics. 2017 May;77:17–21. doi: 10.1016/j.ultras.2017.01.008. [DOI] [PubMed] [Google Scholar]
- 20.Walker WF, Trahey GE. A fundamental limit on delay estimation using partially correlated speckle signals. IEEE Transactions on Ultrasonics Ferroelectrics and Frequency Control. 1995 Mar;42:301–308. [Google Scholar]
- 21.Demene C, Deffieux T, Pernot M, Osmanski BF, Biran V, Gennisson JL, Sieu LA, Bergel A, Franqui S, Correas JM, Cohen I, Baud O, Tanter M. Spatiotemporal Clutter Filtering of Ultrafast Ultrasound Data Highly Increases Doppler and fUltrasound Sensitivity. IEEE Transactions on Medical Imaging. 2015 Nov;34:2271–85. doi: 10.1109/TMI.2015.2428634. [DOI] [PubMed] [Google Scholar]
- 22.Song P, Manduca A, Trzasko JD, Chen S. Ultrasound Small Vessel Imaging With Block-Wise Adaptive Local Clutter Filtering. IEEE Trans Med Imaging. 2017 Jan;36:251–262. doi: 10.1109/TMI.2016.2605819. [DOI] [PubMed] [Google Scholar]
- 23.Errico C, Osmanski BF, Pezet S, Couture O, Lenkei Z, Tanter M. Transcranial functional ultrasound imaging of the brain using microbubble-enhanced ultrasensitive Doppler. Neuroimage. 2016 Jan 1;124:752–61. doi: 10.1016/j.neuroimage.2015.09.037. [DOI] [PMC free article] [PubMed] [Google Scholar]
- 24.West DB. Introduction to graph theory. Vol. 2. Prentice hall; Upper Saddle River: 2001. [Google Scholar]
- 25.Suri S. Bipartite Matching & the Hungarian Method. 2006 www.cs.ucsb.edu/~suri.
- 26.Shehada RE, Cobbold RS, Johnston KW, Aarnink R. Three-dimensional display of calculated velocity profiles for physiological flow waveforms. Journal of vascular surgery. 1993;17:656–660. doi: 10.1067/mva.1993.39751. [DOI] [PubMed] [Google Scholar]
Associated Data
This section collects any data citations, data availability statements, or supplementary materials included in this article.


