Abstract
Background
This article summarizes the European Renal Association – European Dialysis and Transplant Association (ERA-EDTA) Registry’s 2015 Annual Report. It describes the epidemiology of renal replacement therapy (RRT) for end-stage renal disease (ESRD) in 2015 within 36 countries.
Methods
In 2016 and 2017, the ERA-EDTA Registry received data on patients who were undergoing RRT for ESRD in 2015, from 52 national or regional renal registries. Thirty-two registries provided individual patient-level data and 20 provided aggregated-level data. The incidence, prevalence and survival probabilities of these patients were determined.
Results
In 2015, 81 373 individuals commenced RRT for ESRD, equating to an overall unadjusted incidence rate of 119 per million population (pmp). The incidence ranged by 10-fold, from 24 pmp in Ukraine to 232 pmp in the Czech Republic. Of the patients commencing RRT, almost two-thirds were men, over half were aged ≥65 years and a quarter had diabetes mellitus as their primary renal diagnosis. Treatment modality at the start of RRT was haemodialysis for 85% of the patients, peritoneal dialysis for 11% and a kidney transplant for 4%. By Day 91 of commencing RRT, 82% of patients were receiving haemodialysis, 13% peritoneal dialysis and 5% had a kidney transplant. On 31 December 2015, 546 783 individuals were receiving RRT for ESRD, corresponding to an unadjusted prevalence of 801 pmp. This ranged throughout Europe by more than 10-fold, from 178 pmp in Ukraine to 1824 pmp in Portugal. In 2015, 21 056 kidney transplantations were performed, equating to an overall unadjusted transplant rate of 31 pmp. This varied from 2 pmp in Ukraine to 94 pmp in the Spanish region of Cantabria. For patients commencing RRT during 2006–10, the 5-year unadjusted patient survival probabilities on all RRT modalities combined was 50.0% (95% confidence interval 49.9–50.1).
Keywords: dialysis, end-stage renal disease, epidemiology, kidney transplantation, survival analysis
Introduction
The European Renal Association – European Dialysis and Transplant Association (ERA-EDTA) Registry’s Annual Report describes the epidemiology of renal replacement therapy (RRT) for end-stage renal disease (ESRD) within Europe and countries bordering the Mediterranean Sea based on data collected via national and regional renal registries [1]. On an annual basis we publish a summary of the ERA-EDTA Registry’s Annual Report that is intended to provide an overview of the current status of RRT for ESRD in Europe [2–4]. In 2016 and 2017, we received the 2015 data from 52 national or regional renal registries in 36 countries covering a general population of 683.4 million people, representing 80.3% of the 2015 European general population. Thirty-two national or regional renal registries from 17 countries provided individual patient data, whereas 20 countries or regions provided aggregated-level data (see Appendix 1). The proportion of the European population covered by the ERA-EDTA Registry in 2015 was higher than in 2014 (65.4%) due to the inclusion of Russia and Belarus in this year’s Annual Report. Furthermore, compared with the 2014 ERA-EDTA Registry’s Annual Report, Switzerland switched from providing aggregated data to providing individual patient data, while Montenegro was unable to provide data.
This summary presents the 2015 incidence and prevalence of patients receiving RRT, kidney transplantation activity and the patient and graft survival in these 36 countries. A description of the methods to analyse the data, along with the full results, can be found in the ERA-EDTA Registry 2015 Annual Report [1].
Results
Incidence of RRT
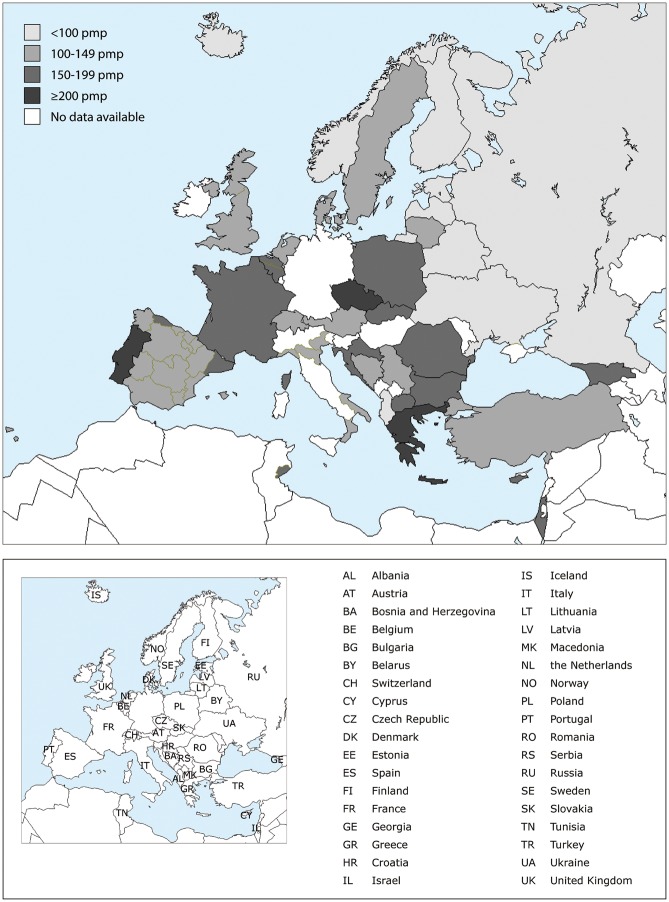
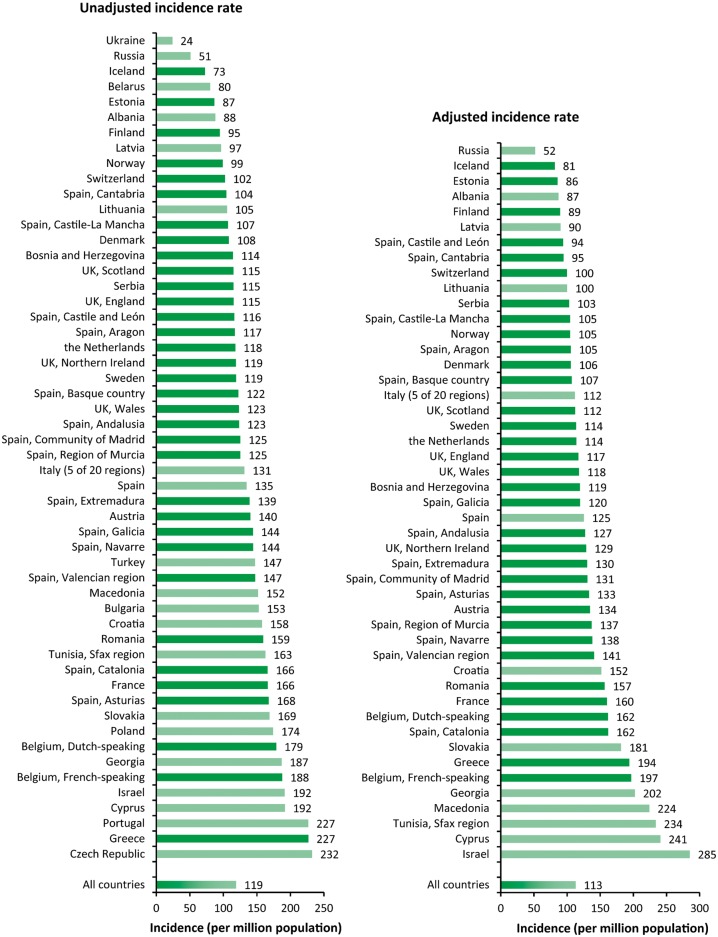
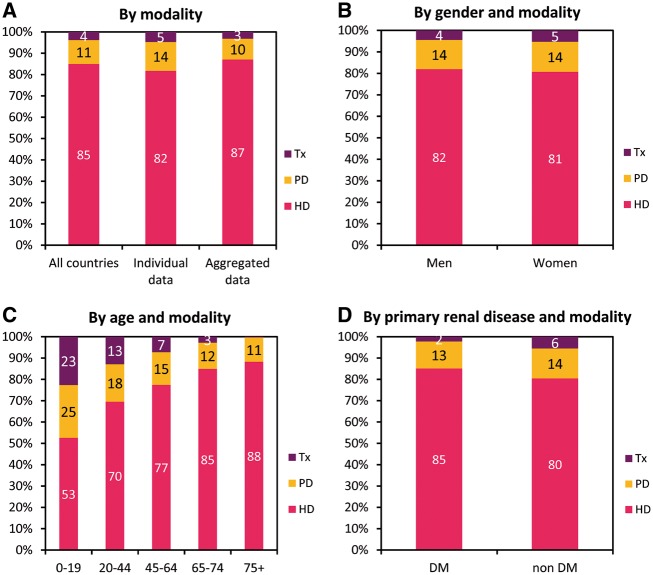
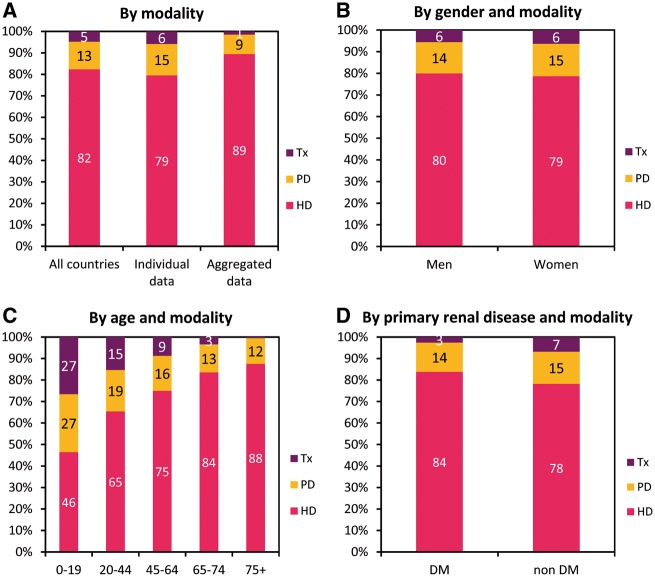
In 2015, 81 373 individuals commenced RRT for ESRD, which equated to an overall unadjusted incidence rate of 119 per million population (pmp, Table 1). The unadjusted incidence rate was highest in the Czech Republic (232 pmp), Greece (227 pmp) and Portugal (227 pmp), whereas it was lowest in Ukraine (24 pmp) and Russia (51 pmp, Table 1 and Figures 1 and 2). The top five countries with the highest incident rates were equal to the top five in 2014, except for the Czech Republic, which had the fourth highest incident rate in 2014, but the highest incident rate in 2015. Of the patients commencing RRT, 62% were men, 52% were aged ≥65 years and 23% had diabetes mellitus as their primary renal diagnosis (Figure 3). The mean age of the patients commencing RRT in all countries and regions combined was 63.1 years, ranging from 48.1 years in Albania to 70.6 years in the Dutch-speaking part of Belgium (Table 1). The majority of patients started RRT with haemodialysis (85%), while 11% of patients started with peritoneal dialysis and 4% received a pre-emptive kidney transplant (Figure 4). However, the initial treatment modality varied considerably between age groups, as the proportion of patients receiving either peritoneal dialysis or a pre-emptive transplant decreased with increasing age. Furthermore, patients with a primary renal diagnosis of diabetes mellitus were less likely to receive a pre-emptive kidney transplant compared with the non-diabetic group (2% versus 6%). Of the incident patients alive and receiving RRT at Day 91 after the start of treatment, the majority (82%) were receiving haemodialysis, 13% were receiving peritoneal dialysis and 5% were living with a kidney transplant (Figure 5). In the first 90 days of treatment, the percentage of patients receiving haemodialysis decreased, this was particularly evident in the younger age groups.
Table 1.
Incidence of RRT in 2015 at Day 1, for all primary renal diseases combined and diabetes mellitus Types 1 and 2, as count (n) and unadjusted rate pmp, and the mean age at the start of RRT
| Country/region | General population covered by the registry in thousands | Incidence of RRT in 2015, at Day 1 |
||||
|---|---|---|---|---|---|---|
| All (n) | All (pmp) | Mean age (years) | DM (n) | DM (pmp) | ||
| Albania | 2851 | 251 | 88 | 52.5 | 30 | 11 |
| Austria | 8585 | 1204 | 140 | 65.0 | 316 | 37 |
| Belarus | 9299 | 747 | 80 | 167 | 18 | |
| Belgium, Dutch-speakinga | 6473 | 1158 | 179 | 70.6 | 234 | 36 |
| Belgium, French-speakinga | 4802 | 902 | 188 | 67.8 | 197 | 41 |
| Bosnia and Herzegovina | 3531 | 404 | 114 | 61.4 | 122 | 35 |
| Bulgariab | 7154 | 1093 | 153 | 278 | 39 | |
| Croatia | 3427 | 540 | 158 | 65.3 | 168 | 49 |
| Cyprus | 855 | 164 | 192 | 66.3 | 61 | 71 |
| Czech Republicb | 10 293 | 2393 | 232 | |||
| Denmark | 5740 | 621 | 108 | 62.3 | 179 | 31 |
| Estonia | 1315 | 114 | 87 | 58.6 | 23 | 17 |
| Finland | 5480 | 520 | 95 | 59.6 | 177 | 32 |
| France | 66 624 | 11 084 | 166 | 67.9 | 2513 | 38 |
| Georgia | 3714 | 694 | 187 | 61.9 | 158 | 43 |
| Greece | 10 821 | 2455 | 227 | 69.6 | 646 | 60 |
| Iceland | 331 | 24 | 73 | 57.4 | 5 | 15 |
| Israel | 8380 | 1606 | 192 | 65.3 | 723 | 86 |
| Italy (5 of 20 regions) | 16 986 | 2232 | 131 | 68.2 | 402 | 24 |
| Latvia | 1574 | 152 | 97 | 62.2 | 23 | 15 |
| Lithuania | 2921 | 308 | 105 | 64.7 | 44 | 15 |
| Macedonia | 2022 | 307 | 152 | 63.5 | 71 | 35 |
| Norway | 5189 | 514 | 99 | 63.0 | 90 | 17 |
| Poland | 37 967 | 6617 | 174 | |||
| Portugal | 10 375 | 2352 | 227 | 771 | 74 | |
| Romania | 19 617 | 3125 | 159 | 61.7 | 355 | 18 |
| Russia | 145 080 | 7413 | 51 | 52.3 | 1297 | 9 |
| Serbia | 7095 | 818 | 115 | 62.4 | 185 | 26 |
| Slovakia | 5426 | 916 | 169 | 62.8 | 334 | 62 |
| Spain (all regions) | 46 624 | 6277 | 135 | 64.8 | 1454 | 31 |
| Spain, Andalusia | 8402 | 1037 | 123 | 62.6 | 263 | 31 |
| Spain, Aragon | 1323 | 155 | 117 | 66.2 | 6 | 5 |
| Spain, Asturias | 1050 | 176 | 168 | 66.6 | 45 | 43 |
| Spain, Basque country | 2165 | 265 | 122 | 64.8 | 58 | 27 |
| Spain, Cantabriaa | 584 | 61 | 104 | 65.6 | 16 | 27 |
| Spain, Castile and Leóna | 2466 | 287 | 116 | 67.4 | 71 | 29 |
| Spain, Castile-La Manchaa | 2056 | 220 | 107 | 64.0 | 47 | 23 |
| Spain, Catalonia | 7508 | 1247 | 166 | 66.9 | 213 | 28 |
| Spain, Extremadura | 1093 | 152 | 139 | 66.2 | 34 | 31 |
| Spain, Galicia | 2728 | 393 | 144 | 65.6 | 104 | 38 |
| Spain, Community of Madrid | 6437 | 807 | 125 | 65.2 | 217 | 34 |
| Spain, Region of Murcia | 1467 | 184 | 125 | 62.3 | 37 | 25 |
| Spain, Navarrea | 637 | 92 | 144 | 63.6 | 16 | 25 |
| Spain, Valencian region | 4981 | 734 | 147 | 64.8 | 147 | 30 |
| Sweden | 9799 | 1166 | 119 | 63.7 | 306 | 31 |
| Switzerland | 8282 | 848 | 102 | 64.6 | 155 | 19 |
| The Netherlands | 16 940 | 1996 | 118 | 63.7 | 375 | 22 |
| Tunisia, Sfax region | 1186 | 193 | 163 | 59.4 | 62 | 52 |
| Turkeyc | 78 736 | 11 597 | 147 | 636 | 8 | |
| Ukraine | 42 759 | 1024 | 24 | 48.1 | 248 | 6 |
| UK, Englanda,d | 54 786 | 6323 | 115 | 62.3 | 1546 | 28 |
| UK, Northern Irelanda | 1852 | 220 | 119 | 63.5 | 51 | 28 |
| UK, Scotland | 5373 | 619 | 115 | 59.6 | 173 | 32 |
| UK, Walesa | 3099 | 382 | 123 | 63.3 | 104 | 34 |
| All countries | 683 363 | 81 373 | 119 | 63.1 | 14 679 | 26 |
When cells are left empty, the data are unavailable and could not be used for the calculation of the summary data.
Patients younger than 20 years of age are not reported. The true incidence counts are, therefore, slightly higher than the counts reported here.
Data on incidence include dialysis patients only.
Data on incidence of primary renal disease (DM) is based on 1707 dialysis patients (14.7% of total).
The incidence is underestimated by ∼4% due to a small number of centres not submitting complete data for 2015.
DM , diabetes mellitus as primary renal disease.
Fig. 1.
Unadjusted incidence rates of RRT pmp, by country/region at Day 1 in 2015. The incidence rate for Bulgaria, the Czech Republic, Russia and Slovakia only includes patients receiving dialysis. For England (UK), the overall incidence of RRT is underestimated by ∼4%.
Fig. 2.
Unadjusted (left panel) and adjusted (right panel) incidence rates of RRT pmp by country/region at Day 1 in 2015. Registries providing individual patient data are shown as dark bars, and registries providing aggregated-level data as light bars. Adjustment of incidence rates was performed by standardizing the rates to the age and gender distribution of the EU27 population [5]. The incidence rate for Bulgaria, the Czech Republic, Russia and Slovakia only includes patients receiving dialysis. For England (UK), the overall incidence of RRT is underestimated by ∼4%.
Fig. 3.
Unadjusted incidence of RRT (%) by (A) gender, (B) age and (C) primary renal diagnosis at Day 1 in 2015. See Appendix 1 for a list of countries and regions supplying individual patient-level or aggregated-level data.
Fig. 4.
Unadjusted incidence (%) of (A) treatment modality overall, and treatment modality by (B) gender, (C) age and (D) primary renal diagnosis in 2015. (B–D) Only based on data from registries providing individual patient data. See Appendix 1 for a list of countries and regions supplying individual patient-level or aggregated-level data. HD, haemodialysis; PD, peritoneal dialysis; Tx, transplant; DM, diabetes mellitus.
Fig. 5.
Unadjusted incidence (%) of (A) treatment modality overall, and treatment modality by (B) gender, (C) age and (D) primary renal diagnosis at Day 91 in 2015. (B–D) Only based on data from registries providing individual patient data. See Appendix 1 for a list of countries and regions supplying individual patient-level or aggregated-level data. HD, haemodialysis; PD, peritoneal dialysis; Tx, transplant; DM, diabetes mellitus.
Prevalence of RRT
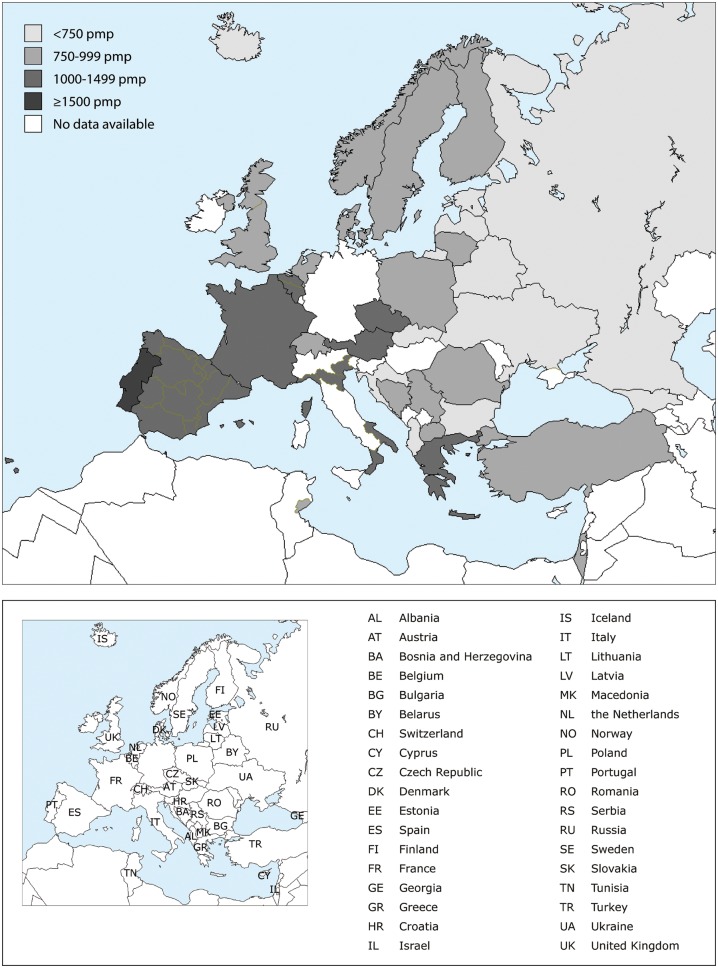
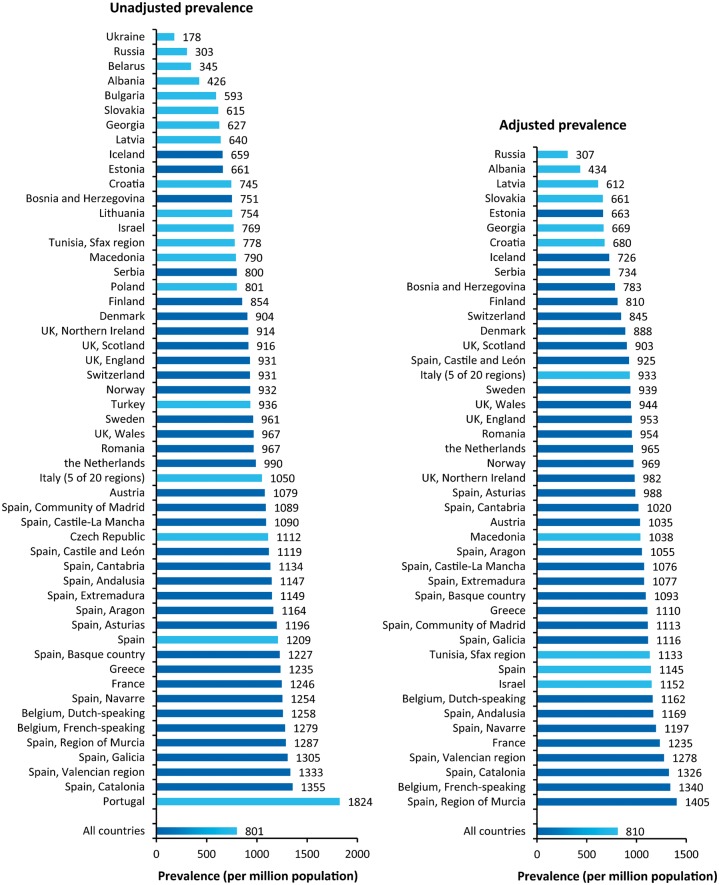
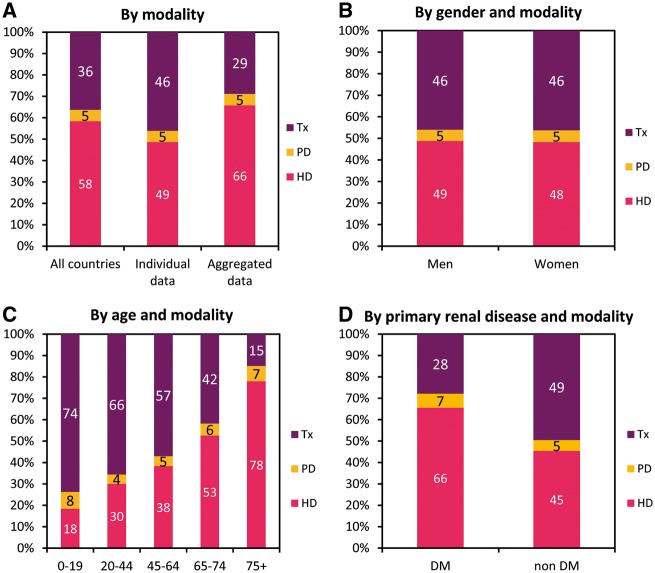
On 31 December 2015, 546 783 individuals were receiving RRT for ESRD (Table 2). This corresponds to an overall unadjusted prevalence of 801 pmp. Again there was considerable variation between countries, with the highest unadjusted prevalence seen in Portugal (1824 pmp) and the Spanish regions of Catalonia (1355 pmp) and Valencia (1333 pmp) (Table 2 and Figures 6 and 7). The unadjusted prevalence of RRT was considerably lower in Ukraine (178 pmp) and Russia (303 pmp). The top five countries with the highest prevalence remained the same as with 2014. Of the prevalent patients the majority were men (60%), 42% were aged ≥65 years and 16% had diabetes mellitus as their primary renal diagnosis (Figure 8). The mean age of the prevalent patients receiving RRT in all countries and regions combined was 60.8 years, ranging from 48.6 years in Ukraine to 66.8 years in Portugal (Table 2). The majority of prevalent patients (58%) were receiving haemodialysis, 36% of patients were living with a kidney transplant and only 5% were on peritoneal dialysis (Figure 9). Once again the modality of RRT varied considerably between age groups as the proportion of patients with a kidney transplant decreased with increasing age. For those aged 20–44 years, 66% were living with a kidney transplant whereas this was true for only 42% of patients aged 65–74 years. Prevalent patients with a primary renal diagnosis of diabetes mellitus were much less likely to be living with a kidney transplant compared with the patients without diabetes mellitus (28% versus 49%).
Table 2.
Prevalence of RRT on 31 December 2015, for all primary renal diseases combined and diabetes mellitus Types 1 and 2, as count (n) and unadjusted rate pmp, and the mean age of prevalent patients
| Country/region | General population covered by the registry in thousands | Prevalent patients on RRT in 2015 |
||||
|---|---|---|---|---|---|---|
| All (n) | All (pmp) | Mean age (years) | DM (n) | DM (pmp) | ||
| Albania | 2851 | 1214 | 426 | 50.3 | 144 | 51 |
| Austria | 8585 | 9259 | 1079 | 61.0 | 1828 | 213 |
| Belarus | 9299 | 3204 | 345 | 444 | 48 | |
| Belgium, Dutch-speakinga | 6473 | 8142 | 1258 | 65.8 | 1400 | 216 |
| Belgium, French-speakinga | 4802 | 6143 | 1279 | 64.8 | 1071 | 223 |
| Bosnia and Herzegovina | 3531 | 2653 | 751 | 59.4 | 512 | 145 |
| Bulgaria | 7154 | 4241 | 593 | |||
| Croatia | 3427 | 2553 | 745 | 65.6 | 656 | 191 |
| Cyprus | 855 | |||||
| Czech Republic | 10 293 | 11 444 | 1112 | |||
| Denmark | 5740 | 5190 | 904 | 58.4 | 878 | 153 |
| Estonia | 1315 | 869 | 661 | 57.8 | 163 | 124 |
| Finland | 5480 | 4679 | 854 | 58.8 | 1189 | 217 |
| France | 66 624 | 83 042 | 1246 | 63.0 | 13 217 | 198 |
| Georgia | 3714 | 2327 | 627 | 56.5 | 483 | 130 |
| Greece | 10 821 | 13 359 | 1235 | 64.0 | 2485 | 230 |
| Iceland | 331 | 218 | 659 | 54.6 | 23 | 70 |
| Israelb | 8380 | 6442 | 769 | 65.6 | 2954 | 352 |
| Italy (5 of 20 regions) | 16 986 | 17 832 | 1050 | 62.2 | 2061 | 121 |
| Latvia | 1574 | 1007 | 640 | 55.9 | 95 | 60 |
| Lithuania | 2921 | 2203 | 754 | |||
| Macedonia | 2022 | 1598 | 790 | 57.8 | 245 | 121 |
| Norway | 5189 | 4836 | 932 | 59.3 | 644 | 124 |
| Poland | 37 967 | 30 400 | 801 | |||
| Portugalc | 10 375 | 18 928 | 1824 | 66.8 | 3392 | 327 |
| Romaniad | 19 617 | 18 977 | 967 | 60.5 | 1996 | 102 |
| Russia | 145 080 | 43 955 | 303 | 54.4 | 5318 | 37 |
| Serbia | 7095 | 5673 | 800 | 59.2 | 935 | 132 |
| Slovakiab | 5426 | 3337 | 615 | 63.3 | 1145 | 211 |
| Spain (all regions) | 46 624 | 56 354 | 1209 | 63.2 | 8863 | 190 |
| Spain, Andalusia | 8402 | 9640 | 1147 | 60.2 | 1476 | 176 |
| Spain, Aragon | 1323 | 1539 | 1164 | 62.7 | 238 | 180 |
| Spain, Asturias | 1050 | 1256 | 1196 | 62.8 | 206 | 196 |
| Spain, Basque country | 2165 | 2656 | 1227 | 61.8 | 286 | 132 |
| Spain, Cantabriaa | 584 | 662 | 1134 | 62.2 | 89 | 152 |
| Spain, Castile and Leóna | 2466 | 2761 | 1119 | 64.3 | 476 | 193 |
| Spain, Castile-La Manchaa | 2056 | 2241 | 1090 | 62.0 | 341 | 166 |
| Spain, Catalonia | 7508 | 10 171 | 1355 | 62.7 | 1414 | 188 |
| Spain, Community of Madrid | 6437 | 7008 | 1089 | 61.5 | 1247 | 194 |
| Spain, Extremadura | 1093 | 1256 | 1149 | 61.4 | 191 | 175 |
| Spain, Galicia | 2728 | 3559 | 1305 | 62.2 | 608 | 223 |
| Spain, Navarrea | 637 | 799 | 1254 | 62.0 | 112 | 176 |
| Spain, Region of Murcia | 1467 | 1888 | 1287 | 61.8 | 257 | 175 |
| Spain, Valencian region | 4981 | 6638 | 1333 | 62.8 | 883 | 177 |
| Sweden | 9799 | 9421 | 961 | 59.6 | 1668 | 170 |
| Switzerlande | 8282 | 7714 | 931 | 62.5 | 1166 | 141 |
| The Netherlands | 16 940 | 16 764 | 990 | 60.1 | 2122 | 125 |
| Tunisia, Sfax regionb | 1186 | 923 | 778 | 58.3 | 184 | 155 |
| Turkeyf | 78 736 | 73 660 | 936 | 2048 | 26 | |
| UK, Englanda,g | 54 786 | 50 999 | 931 | 58.6 | 8483 | 155 |
| UK, Northern Irelanda | 1852 | 1693 | 914 | 58.4 | 258 | 139 |
| UK, Scotland | 5373 | 4923 | 916 | 56.6 | 781 | 145 |
| UK, Walesa | 3099 | 2997 | 967 | 59.4 | 509 | 164 |
| Ukraine | 42 759 | 7610 | 178 | 48.6 | 1137 | 27 |
| All countries | 683 363 | 546 783 | 801 | 60.8 | 70 497 | 128 |
When cells are left empty, the data are unavailable and could not be used for the calculation of the summary data.
Patients younger than 20 years of age are not reported. The true prevalent counts are therefore slightly higher than the counts reported here.
Data on prevalence include dialysis patients only.
Data on prevalence of primary renal disease (DM) include dialysis patients only.
The prevalence is underestimated by ∼3% due to an estimated 30% underreporting of patients living on a functioning graft.
The prevalence is underestimated by ∼6% due to an estimated 11% underreporting of patients living on a functioning graft.
Data on the prevalence of primary renal disease (DM) is based on 6400 dialysis patients (8.7% of total).
The prevalence is underestimated by ∼1% due to a small number of centres not submitting complete data for 2015.
DM, diabetes mellitus as primary renal disease.
Fig. 6.
Unadjusted prevalence of RRT pmp by country/region on 31 December 2015. The prevalence for Israel, Slovakia and Tunisia (Sfax region) only includes patients receiving dialysis. For Romania, Switzerland and England (UK), the overall prevalence of RRT is underestimated by, respectively, 3, 6 and 1%.
Fig. 7.
Unadjusted (left panel) and adjusted (right panel) prevalence of RRT pmp by country/region on 31 December 2015. Registries providing individual patient data are shown as dark bars, and registries providing aggregated-level data as light bars. Adjustment of the prevalence was performed by standardizing the prevalence to the age and gender distribution of the EU27 population [5]. The prevalence for Israel, Slovakia and Tunisia (Sfax region) only includes patients receiving dialysis. For Romania, Switzerland and England (UK), the overall prevalence of RRT is underestimated by, respectively, 3, 6 and 1%.
Fig. 8.
Unadjusted prevalence (%) by (A) gender, (B) age and (C) primary renal diagnosis on 31 December 2015. See Appendix 1 for a list of countries and regions supplying individual patient-level or aggregated-level data.
Fig. 9.
Unadjusted prevalence (%) of (A) treatment modality overall, and treatment modality by (B) gender, (C) age and (D) primary renal diagnosis on 31 December 2015. (B–D) Only based on data from registries providing individual patient data. See Appendix 1 for a list of countries and regions supplying individual patient-level or aggregated-level data. HD, haemodialysis; PD, peritoneal dialysis; Tx, transplant; DM, diabetes mellitus.
Kidney transplantation
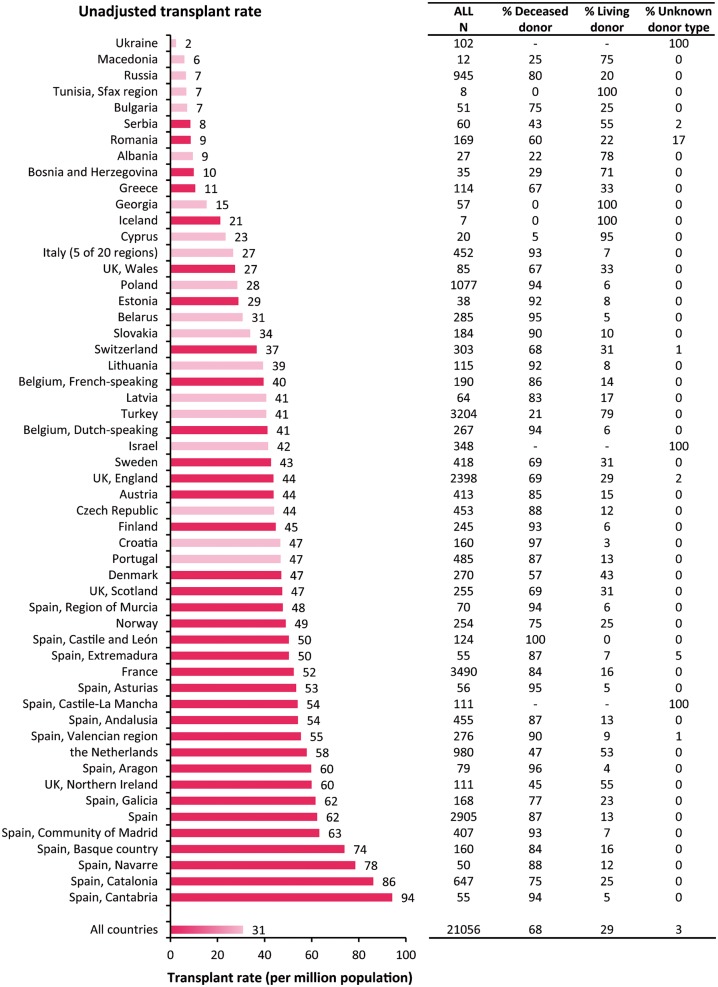
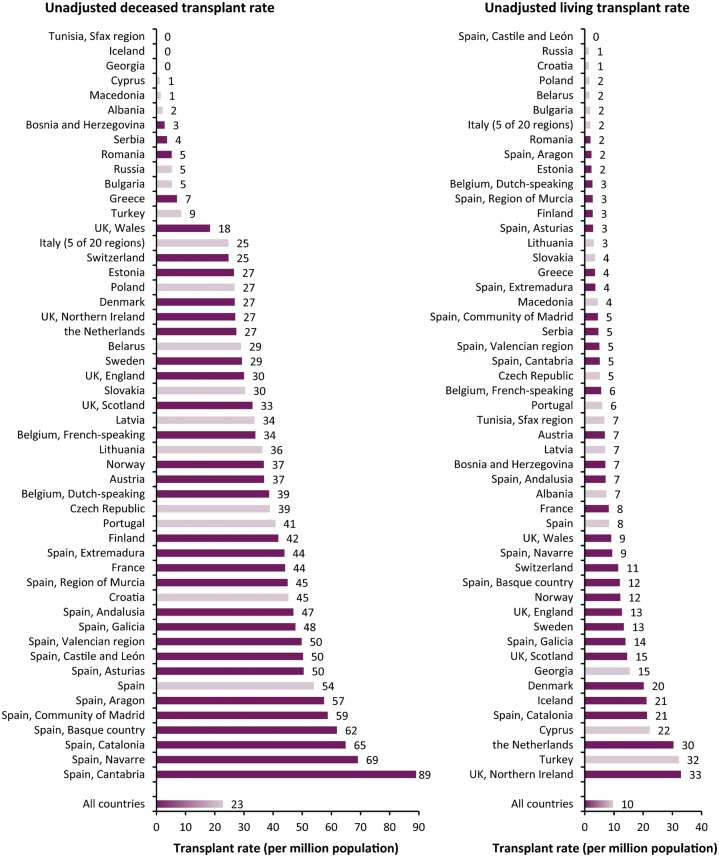
In 2015, 21 056 kidney transplantations were performed, which equated to an overall unadjusted transplant rate of 31 pmp (Figure 10). Again there was considerable variation between countries/regions with unadjusted kidney transplant rates well over 70 pmp in some Spanish regions, and very low unadjusted kidney transplant rates in Ukraine (2 pmp) and Macedonia (6 pmp). Overall, the unadjusted deceased donor transplant rate was more than twice that of the unadjusted living donor transplant rate (23 pmp versus 10 pmp; 68% versus 29%, Figure 11). The highest unadjusted rates of deceased donor transplants were seen in some Spanish regions (>60 pmp, Figure 12), whereas the highest unadjusted rate of living donor transplants were seen in the Netherlands (30 pmp), Turkey (32 pmp) and Northern Ireland (33 pmp, Figure 12).
Fig. 10.
Kidney transplants performed in 2015, as counts and pmp (unadjusted) by country/region. Registries providing individual patient-level data are shown as dark bars, and registries providing aggregated-level data as light bars. Data based on patients aged ≥20 years in Dutch-speaking Belgium, French-speaking Belgium, the Spanish regions of Cantabria, Castile and León, Castile-La Mancha and Navarre and the UK: England, Northern Ireland and Wales. The total count for Austria is based on residents and non-residents. For Romania, Switzerland and England (UK), the overall transplant rate is underestimated by, respectively, 30, 6 and 7%.
Fig. 11.
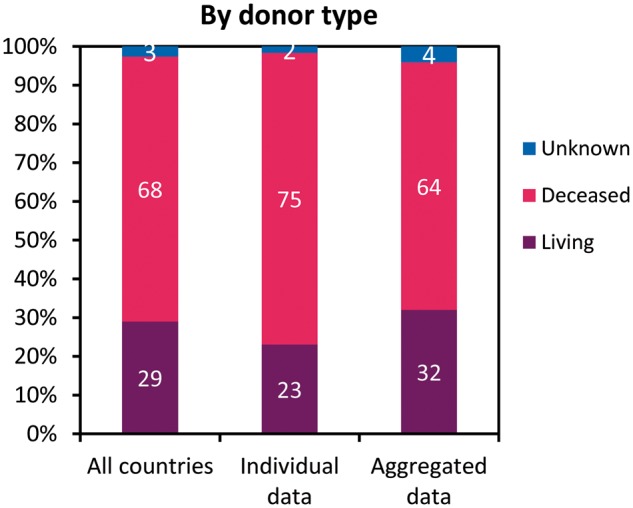
Percentage of kidney transplants performed in 2015 by kidney donor type. See Appendix 1 for a list of countries and regions supplying individual patient-level or aggregated-level data.
Fig. 12.
Unadjusted deceased donor (left panel) and living donor (right panel) kidney transplants performed in 2015 pmp, by country/region. Registries providing individual patient-level data are shown as dark bars, and registries providing aggregated-level data as light bars. Data based on patients aged ≥20 years in Dutch-speaking Belgium, French-speaking Belgium, the Spanish regions of Cantabria, Castile and León, Castile-La Mancha and Navarre and the UK: England, Northern Ireland and Wales. The total count for Austria is based on residents and non-residents. For Romania, Switzerland and England (UK), the overall transplant rate is underestimated by, respectively, 30, 6 and 7%.
Survival of patients receiving RRT
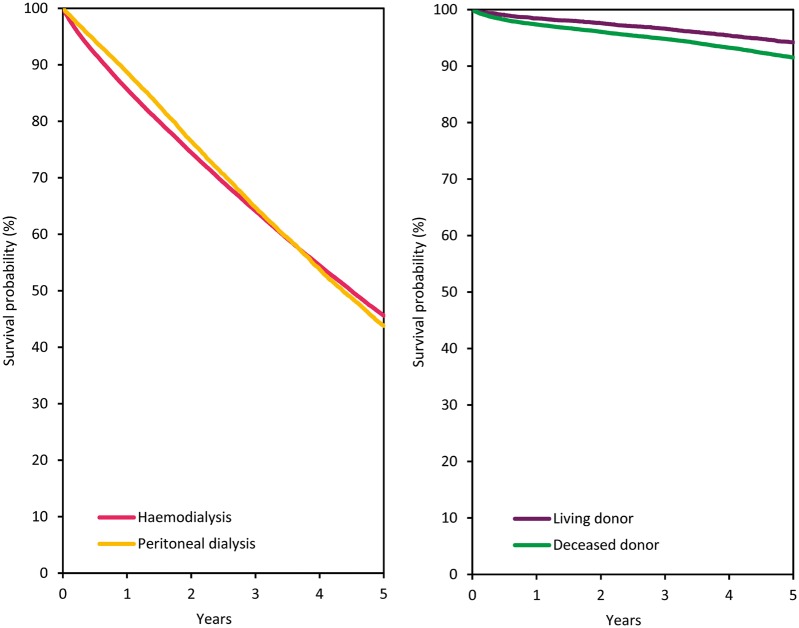
For patients commencing RRT in the period 2006–10, the 1-, 2- and 5-year unadjusted patient survival probabilities for all RRT modalities combined were 83.2% [95% confidence interval (CI) 83.1–83.4], 72.7% (95% CI 72.6–72.9) and 50.0% (95% CI 49.9–50.1), respectively (see Table 3 for a description of the countries/regions included in this analysis). For patients commencing dialysis between 2006 and 2010, the 5-year unadjusted patient survival probability was 41.8% (95% CI 41.7–41.9). Adjusted analyses comparing patient survival on haemodialysis and peritoneal dialysis revealed higher survival probabilities in the first 3 years for patients on peritoneal dialysis (Figure 13). For those with a kidney transplant, 5-year adjusted patient and graft survival were higher with a living donor transplant compared with a deceased donor transplant [94.5% (95% CI 94.0–95.0) versus 91.7% (95% CI 91.3–92.1) for patient survival and 86.6% (95% CI 85.8–87.4) versus 80.7% (95% CI 80.2–81.2) for graft survival]. See Table 3 for a description of the adjustments made and the countries/regions included in this analysis.
Table 3.
The survival probabilities at 1, 2 and 5 years by treatment modality and cohort, from Day 1 of the start of RRT/dialysis, or from the day of kidney transplantation
| Survival type | Survival probabilities as percentage (95% CIs) |
||||
|---|---|---|---|---|---|
| Cohort: 2006–10 |
Cohort: 2009–13 |
||||
| 1 year | 2 years | 5 years | 1 year | 2 years | |
| Patient survival on RRT | |||||
| Unadjusted | 83.2 (83.1–83.4) | 72.7 (72.6–72.9) | 50.0 (49.9–50.1) | 84.4 (84.2–84.5) | 74.3 (74.2–74.5) |
| Adjusteda | 85.9 (85.8–86.1) | 76.1 (75.9–76.3) | 51.1 (50.8–51.4) | 86.9 (86.7–87.1) | 77.6 (77.4–77.9) |
| Patient survival on dialysis | |||||
| Unadjusted | 82.2 (82.1–82.4) | 70.4 (70.2–70.6) | 41.8 (41.7–41.9) | 83.3 (83.1–83.4) | 71.9 (71.7–72.0) |
| Adjusteda | 84.4 (84.2–84.6) | 73.5 (73.3–73.7) | 45.0 (44.7–45.4) | 85.7 (85.5–85.9) | 75.4 (75.2–75.6) |
| Patient survival after first kidney transplantation (deceased donor) | |||||
| Unadjusted | 96.1 (95.9–96.4) | 94.3 (94.1–94.6) | 88.0 (87.6–88.3) | 96.3 (96.1–96.5) | 94.3 (94.0–94.5) |
| Adjustedb | 97.5 (97.3–97.6) | 96.2 (96.0–96.4) | 91.7 (91.3–92.1) | 97.8 (97.7–98.0) | 96.5 (96.3–96.7) |
| Graft survival after first kidney transplantation (deceased donor) | |||||
| Unadjusted | 90.9 (90.5–91.2) | 88.1 (87.8–88.5) | 78.9 (78.5–79.3) | 91.1 (90.8–91.3) | 88.1 (87.7–88.4) |
| Adjustedb | 91.8 (91.4–92.1) | 89.3 (88.9–89.7) | 80.7 (80.2–81.2) | 92.4 (92.1–92.7) | 89.8 (89.4–90.1) |
| Patient survival after first kidney transplantation (living donor) | |||||
| Unadjusted | 98.6 (98.3–98.8) | 97.7 (97.4–98.0) | 94.1 (93.6–94.6) | 98.9 (98.7–99.1) | 97.9 (97.6–98.2) |
| Adjustedb | 98.7 (98.5–99.0) | 98.0 (97.7–98.3) | 94.5 (94.0–95.0) | 99.1 (98.9–99.2) | 98.2 (98.0–98.5) |
| Graft survival after first kidney transplantation (living donor) | |||||
| Unadjusted | 95.9 (95.4–96.3) | 94.1 (93.6–94.5) | 87.4 (86.7–88.0) | 96.5 (96.2–96.8) | 94.7 (94.3–95.1) |
| Adjustedb | 95.6 (95.2–96.1) | 93.8 (93.2–94.3) | 86.6 (85.8–87.4) | 96.3 (95.9–96.7) | 94.4 (93.9–94.9) |
This is based on data from the following renal registries providing individual patient data: Austria, Belgium (Dutch-speaking), Belgium (French-speaking), Denmark, Finland, France, Greece, Iceland, Norway, Spain (Andalusia), Spain (Aragon), Spain (Asturias), Spain (Basque country), Spain (Cantabria), Spain (Castile and León), Spain (Castile-La Mancha), Spain (Catalonia), Spain (Extremadura), Spain (Galicia), Spain (Community of Madrid), Spain (Valencian region), Sweden, the Netherlands, UK (all countries).
Analyses were adjusted using fixed values: age (67 years), gender (63% men) and primary renal disease (24% diabetes mellitus, 19% hypertension/renal vascular disease, 11% glomerulonephritis and 46% other causes).
Analyses were adjusted using fixed values: age (50 years), gender (63% men) and primary renal disease (14% diabetes mellitus, 10% hypertension/renal vascular disease, 23% glomerulonephritis and 53% other causes).
Fig. 13.
Adjusted patient survival of patients starting haemodialysis and peritoneal dialysis between 2006 and 2010 from Day 91 (left panel) and patients receiving a first transplant from a living or deceased donor between 2006 and 2010 (right panel), adjusted for age, gender and primary renal diagnosis. Survival on dialysis was adjusted using the following fixed values: age (67 years), gender (63% men) and primary renal disease (24% diabetes mellitus, 19% hypertension/renal vascular disease, 11% glomerulonephritis and 46% other causes). Survival after kidney transplantation was adjusted using the following fixed values: age (50 years), gender (63% men) and primary renal disease (14% diabetes mellitus, 10% hypertension/renal vascular disease, 23% glomerulonephritis and 53% other causes). These figures are based on data from the following registries providing individual patient data: Austria, Belgium (Dutch-speaking), Belgium (French-speaking), Denmark, Finland, France, Greece, Iceland, Norway, Spain (Andalusia), Spain (Aragon), Spain (Asturias), Spain (Basque country), Spain (Cantabria), Spain (Castile and León), Spain (Castile-La Mancha), Spain (Catalonia), Spain (Extremadura), Spain (Galicia), Spain (Community of Madrid), Spain (Valencian region), Sweden, the Netherlands and UK (all countries).
Expected remaining lifetime
There remains a substantial difference in the expected remaining lifetime between the general population and those receiving dialysis (Figure 14). Patients aged 20–44 years receiving dialysis are expected to live only one-third of the estimated remaining lifetime of the age-matched general population, which is about 35 years less. The prospect is even worse for patients aged 55–64 years, as they are expected to live only a quarter as long as their age-matched counterparts in the general population (∼20 years less). Patients living with a kidney transplant fare better than those receiving dialysis. However, the life expectancy of the transplant recipients aged 20–44 years is still approximately one-third less than that of the age-matched general population (∼17 years less). With increasing age of transplant recipients the percentage disparity in life expectancy with the age-matched general population also increases.
Fig. 14.
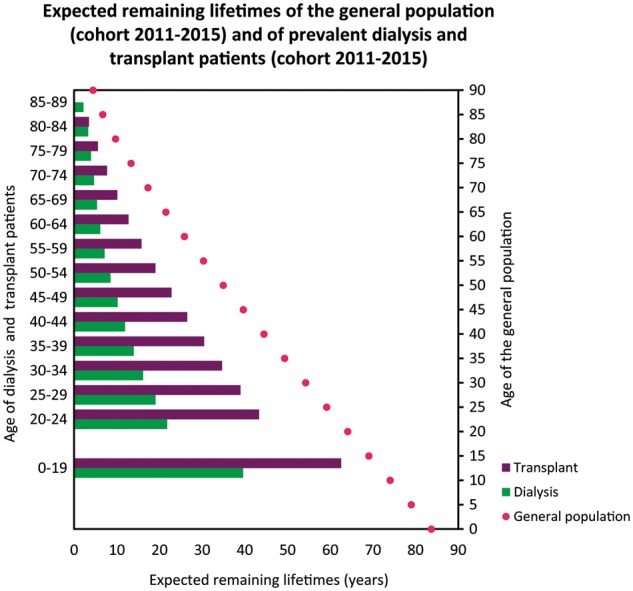
Expected remaining lifetimes of the general population (cohort 2011–15), and of prevalent dialysis and transplant patients (cohort 2011–15), by age and gender. This figure is based on data from the following registries providing individual patient data: Austria, Belgium (Dutch-speaking), Belgium (French-speaking), Denmark, Finland, France, Greece, Iceland, Norway, Spain (Andalusia), Spain (Aragon), Spain (Asturias), Spain (Basque Country), Spain (Cantabria), Spain (Castile and León), Spain (Castile-La Mancha), Spain (Catalonia), Spain (Extremadura), Spain (Galicia), Spain (Community of Madrid), Spain (Valencian region), Sweden, the Netherlands, UK (England, Northern Ireland and Wales) and UK (Scotland).
Affiliated registries
Albanian Renal Registry (M. Barbullushi, A. Idrizi and E. Bolleku Likaj); Austrian Dialysis and Transplant Registry (OEDTR) (R. Kramar); Belarus Renal Registry (K. S. Komissarov, A. V. Kalachyk and O. V. Krasko); Dutch-speaking Belgian Society of Nephrology (NBVN) (B. De Moor, F. Schroven and J. De Meester); French-speaking Belgian Society of Nephrology (GNFB) (J. M. des Grottes and F. Collart); Renal Registry Bosnia and Herzegovina (H. Resić, M. Grujicić and S. Corić); Bulgaria (E. S. Vazelov, I. Velinova and M. Gitcheva); Croatian Registry of Renal Replacement Therapy (CRRRT) (I. Bubić, S. Rački and N. Janković); Cyprus Renal Registry (K. Ioannou and all of the renal units providing data); Czech Republic: Registry of Dialysis Patients (RDP) (I. Rychlík, J. Potucek and F. Lopot); Danish Nephrology Registry (DNS) (J. G. Heaf); Estonian Society of Nephrology (Ü. Pechter, M. Rosenberg and K. Lilienthal); Finnish Registry for Kidney Diseases (P. Finne, A. Pylsy and P. H. Groop); France: The Epidemiology and Information Network in Nephrology (REIN) (M. Lassalle and C. Couchoud); Georgian Renal Registry (N. Kantaria and Dialysis Nephrology and Transplantation Union of Georgia); Hellenic Renal Registry (N. Afentakis); Icelandic End-Stage Renal Disease Registry (R. Palsson); Israel National Registry of Renal Replacement Therapy (R. Dichtiar, T. Shohat and E. Golan); Italian Registry of Dialysis and Transplantation (RIDT): (A. Limido, M. Nordio and M. Postorino); Latvian Renal Registry (H. Cernevskis, V. Kuzema and A. Silda); Lithuanian Renal Registry (V. Kuzminskis, I. A. Bumblytė and E. Žiginskienė); Macedonian Renal Registry (L. Trpenovski, J. Masin Spasovska and O. Stojceva-Taneva); Norwegian Renal Registry (T. Leivestad, A. V. Reisæter and A. Åsberg); Polish Renal Registry (M. Klinger, B. Rutkowski and A. Dębska-Ślizień); Portuguese Renal Registry (F. Macário and A. Ferreira); Romanian Renal Registry (RRR) (G. Mircescu, L. Garneata and E. Podgoreanu); Russian Renal Regiostry (N. Tomilina, A. Andrusev and H. Zakharova); Renal Registry in Serbia (N. Maksimovic, all of the Serbian renal units and Serbian Society of Nephrology); Slovakian Renal Registry (V. Spustová, I. Lajdová and M. Karolyova); Spanish RRT National Registry at ONT, Spanish Regional Registries and Spanish Society of Nephrology (SEN) and the regional registries of Andalusia (SICATA) (P. Castro de la Nuez (on behalf of all users of SICATA), Aragon (J. I. Sanchez Miret and J. M. Abad Diez), Asturias (R. Alonso de la Torre, J. R. Quirós and RERCA Working Group), Basque country (UNIPAR) (Á. Magaz, J. Aranzabal, M. Rodrigo and I. Moina), Cantabria (A. L. M. de Francisco, O. Garcia Ruiz and C. Piñera Haces), Castile and León (R. González and C. Fernández-Renedo), Castile-La Mancha (G. Gutiérrez Ávila and I. Moreno Alía), Catalonia (RMRC) (E. Arcos, J. Comas and J. Tort), Extremadura (J. M. Ramos Aceitero and M. A. García Bazaga), Galicia (E. Bouzas-Caamaño and J. Sánchez-Ibáñez), Community of Madrid (M. I. Aparicio de Madre), Renal Registry of the Region of Murcia (C. Santiuste de Pablos and I. Marín Sánchez), Navarre (M. F. Slon Roblero, J. Manrique Escola and J. Arteaga Coloma) and the Valencian region (REMRENAL) (M. Ferrer Alamar, N. Fuster Camarena and J. Pérez Penadés); Swedish Renal Registry (SNR) (K. G. Prütz, M. Stendahl, M. Evans, S. Schön, T. Lundgren and M. Segelmark); Swiss Dialysis Registry (P. Ambühl and R. Winzeler); Dutch Renal Registry (RENINE) (L. Heuveling, S. Vogelaar and M. Hemmelder); Tunisia, Sfax region (D. Zalila, H. Mahfoud and F. Jarraya); Registry of the Nephrology, Dialysis and Transplantation in Turkey (TSNNR) (G. Süleymanlar, N. Seyahi and K. Ateş); Ukrainian Renal Data System (URDS) (M. Kolesnyk, S. Nikolaenko and O. Razvazhaieva); United Kingdom Renal Registry (UKRR) (all the staff of the UK Renal Registry and of the renal units submitting data); Scottish Renal Registry (SRR) (all of the Scottish renal units).
ERA-EDTA Registry Committee Members
C. Zoccali, Italy (ERA-EDTA President); Z. A. Massy, France (Chairman); F. J. Caskey, UK; C. Couchoud, France; M. Evans, Sweden; P. Finne, Finland; J. W. Groothoff, The Netherlands; J. Harambat, France; J. G. Heaf, Denmark; F. Jarraya, Tunisia; M. Nordio, Italy; and I. Rychlik, Czech Republic.
ERA-EDTA Registry Office Staff
K. J. Jager (Managing Director), M. Bonthuis (for the paediatric section), R. Cornet, G. Guggenheim, A. Kramer, M. Noordzij, M. Pippias, V. S. Stel and A. J. Weerstra.
Acknowledgements
The ERA-EDTA Registry would like to thank the patients and staff of all the dialysis and transplant units who have contributed data via their national and regional renal registries. In addition, we would like to thank the persons and organizations listed in the paragraph ‘affiliated registries’ for their contribution to the work of the ERA-EDTA Registry.
Funding
The ERA-EDTA Registry is funded by the ERA-EDTA. This article was written by Anneke Kramer et al. on behalf of the ERA-EDTA Registry, which is an official body of the ERA-EDTA.
Conflict of interest statement
None declared.
Appendix 1
Countries or regions providing individual patient-level data
Austria, Dutch-speaking Belgium, French-speaking Belgium, Bosnia and Herzegovina, Denmark, Estonia, Finland, France, Greece, Iceland, Norway, Romania, Serbia, the Spanish regions of Andalusia, Aragon, Asturias, Basque country, Cantabria, Castile and León, Castile-La Mancha, Catalonia, Extremadura, Galicia, Community of Madrid, Murcia, Navarre, Valencian region, Sweden, Switzerland, the Netherlands, UK (England/Northern Ireland/Wales) and UK (Scotland).
Countries or regions providing aggregated-level data
Albania, Belarus, Bulgaria, Croatia, Cyprus, Czech Republic, Georgia, Israel, Italy, Latvia, Lithuania, Macedonia, Poland, Portugal, Russia, Slovakia, Spain, Tunisia (Sfax region), Turkey, Ukraine.
References
- 1. ERA-EDTA Registry. ERA-EDTA Registry Annual Report 2015. Amsterdam, The Netherlands: Academic Medical Center, Department of Medical Informatics, 2017
- 2. Pippias M, Stel VS, Abad Diez JM. et al. Renal replacement therapy in Europe: a summary of the 2012 ERA-EDTA Registry Annual Report. Clin Kidney J 2015; 8: 248–261 [DOI] [PMC free article] [PubMed] [Google Scholar]
- 3. Kramer A, Pippias M, Stel VS. et al. Renal replacement therapy in Europe: a summary of the 2013 ERA-EDTA Registry Annual Report with a focus on diabetes mellitus. Clin Kidney J 2016; 9: 457–469 [DOI] [PMC free article] [PubMed] [Google Scholar]
- 4. Pippias M, Kramer A, Noordzij M. et al. The European Renal Association – European Dialysis and Transplant Association Registry Annual Report 2014: a summary. Clin Kidney J 2017; 10: 154–169 [DOI] [PMC free article] [PubMed] [Google Scholar]
- 5. Eurostat. http://ec.europa.eu/eurostat/data/database (21 February 2017, date last accessed)


