

Abstract
Introduction
This review summarizes the current literature for the prevalence and medical costs of noncommunicable chronic diseases among adult Medicaid beneficiaries to inform future program design.
Methods
The databases MEDLINE and CINAHL were searched in August 2016 using keywords, including Medicaid, health status, and healthcare cost, to identify original studies that were published during 2000–2016, examined Medicaid as an independent population group, examined prevalence or medical costs of chronic conditions, and included adults within the age group 18–64 years. The review and data extraction was conducted in Fall 2016–Spring 2017. Disease-related costs (costs specifically to treat the disease) and total costs (all-cause medical costs for a patient with the disease) are presented separately.
Results
Among the 29 studies selected, prevalence estimates for enrollees aged 18–64 years were 8.8%–11.8% for heart disease, 17.2%–27.4% for hypertension, 16.8%–23.2% for hyperlipidemia, 7.5%–12.7% for diabetes, 9.5% for cancer, 7.8%–19.3% for asthma, 5.0%–22.3% for depression, and 55.7%–62.1% for one or more chronic conditions. Estimated annual per patient disease-related costs (2015 U.S. dollars) were $3,219–$4,674 for diabetes, $3,968–$6,491 for chronic obstructive pulmonary disease, and $989–$3,069 for asthma. Estimated hypertension-related costs were $687, but total costs per hypertensive beneficiary ranged much higher. Estimated total annual healthcare costs were $29,271–$51,937 per beneficiary with heart failure and $11,446–$20,585 per beneficiary with schizophrenia. Costs among beneficiaries with cancer were $29,384–$46,194 for the 6 months following diagnosis.
Conclusions
These findings could help inform the evaluation of interventions to prevent and manage noncommunicable chronic diseases and their potential to control costs among the vulnerable Medicaid population.
INTRODUCTION
The prevalence of chronic diseases has been high in the U.S. in recent decades.1 In 2012, half of all U.S. adults had at least one chronic condition, and at least one in four had two or more.2 The high prevalence of chronic diseases is a key driver of total U.S. healthcare costs; in 2010, 86% of healthcare spending was for patients with at least one chronic condition, and 71% of spending was for patients with multiple conditions.3
Medicaid is the second largest source of health insurance in the U.S., after employer-provided insurance, and the largest public source of insurance.4,5 In 2012, average monthly enrollment in Medicaid was 57.5 million, and total Medicaid program expenditures for that year were $428.5 billion.6 Historically, Medicaid has primarily covered low-income children and parents, pregnant women, and the disabled.6–8 This population is vulnerable to higher rates of chronic diseases than are seen in the U.S. as a whole or even in the low-income population overall.9
The Medicaid population has changed and grown substantially since the program began in 1965.7,8 As the Medicaid population continues to change, it is increasingly important to understand the major health burdens this population faces and the associated medical costs, which is important for informing future program design and developing health promotion programs to contain or reduce the public health burden and healthcare costs. Although the literature on the prevalence of, and costs associated with, chronic diseases among adult Medicaid beneficiaries has expanded rapidly in recent years, to the authors’ knowledge a review article summarizing these findings is not available. This review describes the current literature related to the prevalence of chronic diseases and associated medical costs among adult Medicaid beneficiaries to inform future program design and interventions to manage chronic diseases among this group.
METHODS
Initial scoping determined the literature on chronic disease prevalence and costs among Medicaid beneficiaries was too diverse and not large enough for a systematic review and meta-analysis; the evidence for each health condition and outcome was limited and too heterogeneous. This review serves as an overview by summarizing the current literature including all noncommunicable chronic diseases and covering both topic areas of disease prevalence and medical costs. Therefore, the authors did not strictly adhere to the Preferred Reporting Items for Systematic Reviews and Meta-Analyses (PRISMA) checklist guidelines for this project.
Selection of Literature
The review included peer-reviewed journal articles published between January 2000 and August 2016. The databases MEDLINE and CINAHL were searched in August 2016 and the search was supplemented by using Google Scholar and checking the references of relevant articles. Keywords for the database search included variations of Medicaid, beneficiary, health status, utilization, and healthcare cost (full search strategy in the Appendix, available online). The lead researcher reviewed the articles and extracted data during Fall 2016–Spring 2017; any uncertainties about data extraction were brought to the coauthors for further review. Titles and abstracts of collected articles were screened to exclude those that were (1) review papers, commentaries, editorials, or theses or (2) were not about the prevalence or cost burden of noncommunicable chronic diseases among Medicaid beneficiaries. The remaining studies underwent full-text review against the following exclusion criteria:
did not include Medicaid beneficiaries within the age group 18–64 years in the analysis (e.g., included only those aged <18 or >64 years) or examined exclusively those who were dual eligible (i.e., eligible for both Medicaid and Medicare);
did not study Medicaid beneficiaries as an independent population group (e.g., studied the total population within Medicaid expansion states versus non-expansion states);
did not include disease-specific measures of prevalence or costs; and
examined only a specific medication, treatment, or intervention.
Synthesizing Evidence
The prevalence of health conditions and the associated medical costs are presented separately. After review, estimates were organized into the following nine disease categories, which were created based on their observed representativeness in the included literature: (1) heart disease and stroke (including coronary heart disease [CHD], myocardial infarction, heart failure [HF] or congestive HF [CHF], pulmonary heart disease, angina, and measures of “any heart disease” and cardiovascular disease as a whole); (2) hypertension; (3) dyslipidemia (including hyperlipidemia); (4) diabetes; (5) cancer; (6) respiratory illnesses (including asthma, chronic obstructive pulmonary disease [COPD], and emphysema); (7) mental disorders (including schizophrenia, depression, bipolar disorder, dementia, obsessive compulsive disorder, and anxiety disorder); (8) other chronic conditions (including obesity, arthritis, renal disease or end-stage renal disease, and peptic ulcer disease); and (9) multiple chronic conditions (including prevalence of one or more conditions).
For each cost study, the total (all-cause) medical costs per patient with the disease, the disease-related costs, or both are presented when available. Total medical costs per patient with the disease captures the all-cause medical costs from any sources, including costs resulting from comorbidities or complications and those not directly related to treatment of the disease. Disease-related costs include only costs directly related to the treatment of the specific disease and therefore do not include other costs that might be incurred for a patient with that disease. For example, disease-related costs to treat hypertension might be low, but total costs for a hypertensive patient might be much higher because the condition is related to costly diseases like CHD or stroke. When available, excess (incremental) costs are noted separately. Excess costs are the difference in total per patient costs between a patient with a disease versus a patient without the disease (i.e., total cost per patient with a disease minus total cost per patient without the disease). All costs were adjusted to 2015 U.S. dollars using the Personal Consumption Expenditures health component price index from the Bureau of Economic Analysis.10,11
Many studies explored topics beyond estimating the prevalence or associated costs of chronic diseases, such as comparing disease prevalence between Medicaid beneficiaries and other groups or examining quality of care or access to care. Although the findings related to these topics are also valuable, and some insights from them are included in the discussion section, they fall outside the scope of this review and thus these data are not included in the results.
RESULTS
In total, 358 articles were collected and screened, leaving 81 articles for full-text review. Of these, 29 original research articles12–40 met the selection criteria (Figure 1). Of these, 20 (69%) examined costs13,17,20–26, 29–37,39,40 and 19 (66%) examined prevalence12–20,22,25,27–30,32,33,38,40; ten (34%) included both costs and prevalence.13,17,20,22,25,29,30,32,33,40 Among the 29 studies, 17 (59%) examined diabetes; 16 (55%), mental disorders; 15 (52%), respiratory illnesses; 15 (52%), heart disease and stroke; 12 (41%), hypertension; 11 (38%), other chronic conditions; ten (34%), cancer; seven (24%), multiple chronic conditions; and six (21%), dyslipidemia. Eleven studies (38%) examined only one disease category; 11 (38%) examined two to six; and seven (24%) examined seven to nine categories (Appendix Figure 1, available online).
Figure 1.
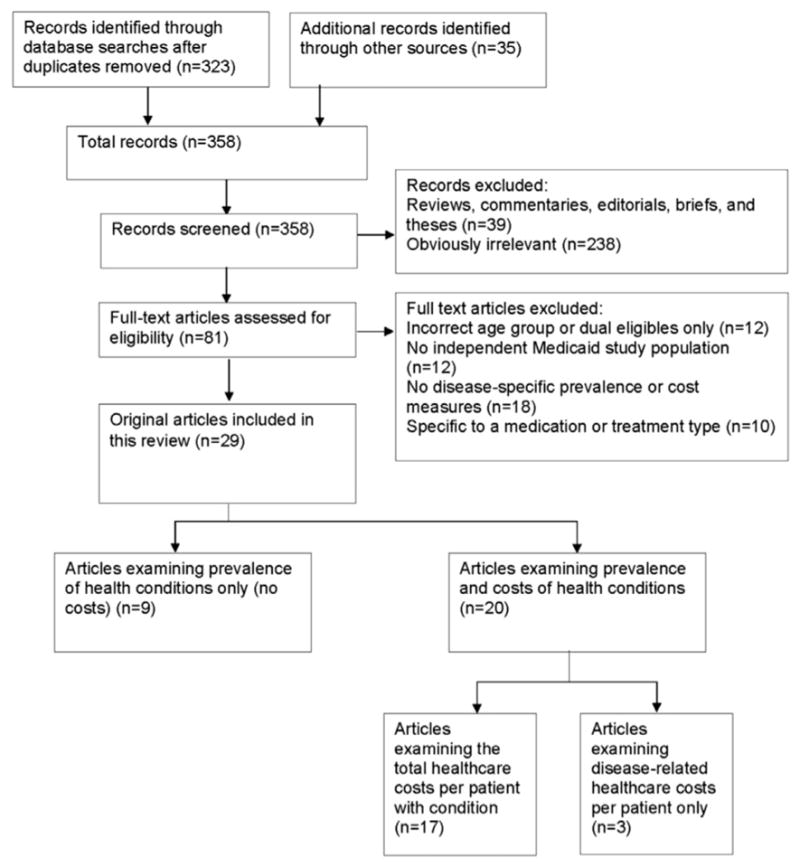
Selecting literature on the prevalence or associated costs of non-communicable chronic diseases among Medicaid beneficiaries (2000–2016).
The data used in the 29 studies were from as early as the year 1987 to as late as 2012 (Table 1). Seventeen studies (59%) used state-specific data from a single state or a combination of four or fewer states; the remaining studies used nationally representative data. The most common data sources used were state (e.g., North Carolina, California) Medicaid administrative and claims data (n=17, 59%); MarketScan (n=4, 14%); the Medical Expenditure Panel Survey (n=3, 10%); and the National Health and Nutrition Examination Survey (n=3, 10%).
Table 1.
Overview of Literature on Prevalence of Non-communicable Chronic Diseases or Medical Costs Among Medicaid Beneficiaries, 2000–2016 (n=29)
| Author (year) | Title | Study population | Data source |
|---|---|---|---|
| Bagchi (2007)12 | Utilization of, and adherence to, drug therapy among Medicaid beneficiaries with congestive heart failure | Medicaid beneficiaries of any age in Arkansas, California, Indiana, and New Jersey continuously enrolled during the study period and diagnosed with CHF | 1998 State Medicaid Research Files and 1999 Medicaid Analytic eXtract for Arkansas, California, Indiana, and New Jersey (n=45,572) |
| Buescher (2010)13 | Medical care costs for diabetes associated with health disparities among adult Medicaid enrollees in North Carolina | North Carolina Medicaid enrollees aged ≥18 years | North Carolina Medicaid claims data, 2007–2008 (n=812,717) |
| Chang (2013)14 | Potential adult Medicaid beneficiaries under the Patient Protection and Affordable Care Act compared with current adult Medicaid beneficiaries | U.S. adults aged 19–64 years enrolled in Medicaid | NHANES, 2007–2010 (n=991) |
| Cheung (2012)15 | National study of barriers to timely primary care and emergency department utilization among Medicaid beneficiaries | U.S. adults aged ≥18 years enrolled in Medicaid | NHIS, 1999–2009 (n=24,986) |
| Christopher (2016)16 | Access to care and chronic disease outcomes among Medicaid-insured persons versus the uninsured | U.S. Medicaid beneficiaries aged 18–64 years with a household income of <138% the federal poverty level | NHANES, 1999–2012 (n=1,485) |
| Clemans-Cope (2013)17 | The expansion of Medicaid coverage under the ACA: implications for healthcare access, use, and spending for vulnerable low-income adults | U.S. adults aged 19–64 years enrolled in Medicaid, excluding dual eligibles and pregnant women, with household income of <138% the federal poverty level and with one or more chronic conditions (including mental illnesses) | MEPS, 2003–2009 (n=3,261) |
| Decker (2013)18 | Health status, risk factors, and medical conditions among persons enrolled in Medicaid versus uninsured low-income adults potentially eligible for Medicaid under the Affordable Care Act | U.S. adults aged 19–64 years enrolled in Medicaid (excluding dual eligibles) with household income <138% the federal poverty level | NHANES, 2007–2010 (n=471) |
| Downie (2011)19 | Racial disparities in blood pressure control and treatment differences in a Medicaid population, North Carolina, 2005–2006 | North Carolina Medicaid enrollees aged ≥21 years who identified as “black” or “white” race who were enrolled for at least 11 months and diagnosed with hypertension, excluding those with claims for cardiologist or endocrinologist office visits or on dialysis for end-stage renal disease | North Carolina Medicaid administrative data, 2005–2006 (n=3,514) |
| D’Souza (2014)20 | Clinical and economic burden of COPD in a Medicaid population | U.S. adults aged ≥40 years continuously enrolled in Medicaid FFS and diagnosed with COPD, including dual eligibles and excluding those with comorbid cystic fibrosis, bronchiectasis, respiratory cancer, pulmonary fibrosis, pneumoconiosis, sarcoidosis, or pulmonary tuberculosis | MarketScan, 2003–2007 (n=10,221) |
| Epstein (2008)21 | Cost of care for early- and late-stage oral and pharyngeal cancer in the California Medicaid population | California Medicaid FFS beneficiaries aged 18–100 years diagnosed with oral or pharyngeal cancer with 1 year of continuous enrollment after diagnosis | California Medicaid claims data, 1995–2003 (n=229) |
| Esposito (2009)22 | Medicaid beneficiaries with congestive heart failure: association of medication adherence with healthcare use and costs | Medicaid beneficiaries of any age in Arkansas, California, Indiana, or New Jersey continuously enrolled in FFS, diagnosed with CHF in 1998 (defined as at least one hospitalization or at least two ambulatory visits with CHF diagnosis) and at least one CHF drug claim | 1998 State Medicaid Research Files, 1999 Medicaid Analytic eXtract, and 1999 Medicare Standard Analytic File for Arkansas, California, Indiana, and New Jersey (n=37,408) |
| Garis (2002)23 | Examining costs of chronic conditions in a Medicaid population | Kentucky Medicaid beneficiaries of any age with at least one claim for one of the studied diseases | Oklahoma Medicaid claims data, 1995 (n=41,159) |
| Gilmer (2004)24 | Adherence to treatment with antipsychotic medication and healthcare costs among Medicaid beneficiaries with schizophrenia | San Diego Medicaid beneficiaries of any age diagnosed with schizophrenia and continuously enrolled in FFS for 12 months, excluding dual eligibles | San Diego County Adult Mental Health Services data linked with California Medicaid claims data, 1998–2000 (n=2,801 person-years) |
| Guo (2007)25 | Treatment costs related to bipolar disorder and comorbid conditions among Medicaid patients with bipolar disorder | U.S. Medicaid beneficiaries aged <65 years diagnosed with bipolar disorder, excluding those diagnosed with schizophrenia | PHARMetrics, 1998–2002 (n=13,471) |
| Hankin (2011)26 | Patients with obsessive compulsive disorder versus depression have comparable healthcare costs: a retrospective claims analysis of Florida Medicaid enrollees | Florida Medicaid beneficiaries aged ≥18 years diagnosed with pure OCD (OCD without depression or other major mental disorders) or pure depression | Florida Medicaid claims data, 1997–2006 |
| Hill (2014)27 | Adults in the income range for the Affordable Care Act’s Medicaid expansion are healthier than pre-ACA enrollees | U.S. adults aged 19–64 years enrolled in Medicaid, excluding dual eligibles, those enrolled because of disability, those with limited benefits, and pregnant women | MEPS, 2005–2010 (n=6,005) |
| Khoury (2013)28 | The association between chronic disease and physical disability among female Medicaid beneficiaries aged 18–64 years | Female Florida Medicaid enrollees aged 18–64 years continuously enrolled during the study period, excluding dual eligibles or those with limited benefits | Florida Medicaid eligibility and claims data, 2001–2005 (n=74,851) |
| Lin (2010)29 | Economic implications of comorbid conditions among Medicaid beneficiaries with COPD | Maryland Medicaid enrollees aged 40–64 years diagnosed with COPD and continuously enrolled 12 months before and after first claims for diagnosed COPD | Maryland Medicaid claims data, 2001–2003 (n=1,388) |
| McCombs (2000)30 | The use of conventional antipsychotic medications for patients with schizophrenia in a Medicaid population: therapeutic and cost outcomes over 2 years | California Medicaid beneficiaries aged 14–100 years diagnosed with schizophrenia and continuously enrolled for 2 years following initiation of treatment | California Medicaid claims data, 1987–1996 (n=2,467) |
| Mullins (2004)31 | Economic disparities in treatment costs among ambulatory Medicaid cancer patients | Maryland Medicaid beneficiaries aged ≥18 years diagnosed with breast, colorectal, or prostate cancer | Maryland Medicaid administrative claims data, 1999–2000 |
| Piecoro (2001)32 | Asthma prevalence, cost, and adherence with expert guidelines on the utilization of healthcare services and costs in a state Medicaid population | Kentucky Medicaid enrollees of any age (n=530,000); cost estimates for those diagnosed with asthma, excluding those diagnosed with COPD (n=24,365) | Kentucky Medicaid administrative data, 1996 |
| Priest (2011)33 | Quality of care associated with common chronic diseases in a nine-state Medicaid population utilizing claims data: an evaluation of medication and healthcare use and costs | Medicaid FFS beneficiaries aged <65 years enrolled at least 6 months, excluding dual eligibles | MarketScan, 2007 (n=2,812,849) |
| Shaya (2009)34 | Burden of COPD, asthma, and concomitant COPD and asthma among adults: racial disparities in a Medicaid population | Maryland Medicaid beneficiaries aged 40–60 years diagnosed with asthma, COPD, or both, excluding dual eligibles | Maryland Medicaid Managed Care patient encounter data, 2001–2003 (n=9,131) |
| Subramanian (2011)35 | Impact of Medicaid copayments on patients with cancer: lessons for Medicaid expansion under health reform | Georgia, South Carolina, and Texas Medicaid beneficiaries aged 21–64 years, diagnosed with cancer, and continuously enrolled in FFS for at least 6 months after diagnosis, excluding pregnant women | Georgia, South Carolina, and Texas Medicaid administrative data linked with cancer registry data, 1999–2004 (n=10,241) |
| Subramanian (2013)36 | Impact of chronic conditions on the cost of cancer care for Medicaid beneficiaries | Georgia, Maine, and Illinois Medicaid beneficiaries aged 21–64 years diagnosed with cancer and continuously enrolled for 3 months prior and 6 months following diagnosis, excluding dual-eligibles | Georgia, Maine, and Illinois Medicaid administrative data linked with cancer registry data, 2000–2003 (n=6,212) |
| Svarstad (2001)37 | Using drug claims data to assess the relationship of medication adherence with hospitalization and costs | Wisconsin Medicaid beneficiaries aged ≥18 years continuously enrolled for 12 months and diagnosed with severe mental illness | Wisconsin Medicaid claims data and data from a prior study (system and medical records and a client assessment questionnaire), 1989–1990 (n=619) |
| Widmer (2015)38 | The association between office-based provider visits and emergency department utilization among Medicaid beneficiaries | U.S. adults aged 18–64 years enrolled for a full year in Medicaid, excluding pregnant women and dual eligibles or others with additional insurance coverage | MEPS, 2009 (n=1,497) |
| Wu (2011)39 | Medical utilization and costs associated with statin adherence in Medicaid enrollees with type 2 diabetes | Medicaid beneficiaries aged ≥18 years diagnosed with diabetes and hyperlipidemia and continuously enrolled 1 year pre-index date and 1 year post-index, excluding dual eligibles | MarketScan, 2004–2006 (n=1,705) |
| Yang (2016)40 | Association of antihypertensive medication adherence with healthcare use and Medicaid expenditures for acute cardiovascular events | Medicaid beneficiaries aged 18–62 years enrolled in Medicaid FFS beginning January 1, 2007, and continuously enrolled for at least 36 months, diagnosed with hypertension and taking antihypertensive medication; excludes dual eligibles and patients with diagnoses for cancer or end-stage renal disease | MarketScan, 2007–2012 (n=59,037) |
ACA, Affordable Care Act; CHF, congestive heart failure; COPD, chronic obstructive pulmonary disease; FFS, fee-for-service; MEPS, Medical Expenditure Panel Survey; NHANES, National Health and Nutrition Examination Survey; NHIS, National Health Interview Survey; OCD, obsessive compulsive disorder.
Prevalence estimates for each disease varied by the population group studied (e.g., age range, inclusion of dual eligibles); data source type (e.g., claims data, self-reported survey data); and the case definitions used to identify diseases. Among the 19 studies exploring prevalence, nine examined only those diagnosed with a specific condition (Appendix Table 2, available online).
Five studies used data from nationally representative surveys and studied the age group 18–64 years.14,16,18,27,38 These studies were the most comparable for presenting a range of prevalence estimates for the population of interest, but differences in their methodologies still produced a wide range in estimates for some diseases. One notable difference in methodology was whether studies used only self-reported survey responses to measure the prevalence of a disease—which misses individuals who are unaware of their condition—or anthropometric and laboratory data, and thus these estimates are presented separately (Table 2). Other examples of methodologic variation included the inclusion or exclusion of dual eligibles and differences in the case definitions used to identify diseases.
Table 2.
Summary of Selected Prevalence and Cost Estimates for Non-Communicable Chronic Diseases Among Medicaid Beneficiaries (2000–2016)
| Disease | Prevalence estimates from nationally representative data for ages 18–64 years | Annual per-patient cost estimatesa | ||
|---|---|---|---|---|
|
|
|
|||
| Self-reported alone, % | Measured, % | Total cost per patient with disease,b $ | Disease-related cost per patient with disease, $ | |
| Heart disease and stroke | ||||
|
| ||||
| Heart disease | 8.8–11.8 | N/A | N/A | N/A |
|
| ||||
| CHD | 5.0 | N/A | 35,548 | 5,835 |
|
| ||||
| HF/CHF | N/A | N/A | 29,271c–51,937 | 7,031 |
|
| ||||
| Angina | 2.0 | N/A | N/A | N/A |
|
| ||||
| Stroke | 1.5–5.5 | N/A | N/A | N/A |
|
| ||||
| Hypertension | 17.2–18 | 27.4 | 5,458d–19,821 | 687 |
|
| ||||
| Dyslipidemia | ||||
|
| ||||
| Hyperlipidemia | 16.8 | 23.2 | 18,785 | 560–3,370e |
|
| ||||
| Diabetes | 7.7 | 7.5–12.7 | 17,515f–27,888 | 3,219–4,674g |
|
| ||||
| Cancer | 9.5 | N/A | 29,384h–46,194h | N/A |
|
| ||||
| Oral or pharyngeal | N/A | N/A | 34,882 | N/A |
|
| ||||
| Respiratory illnesses | ||||
|
| ||||
| Asthma | 7.8i–19.3 | N/A | 5,724–9,127 | 989–3,069j |
|
| ||||
| COPD | N/A | N/A | 10,114k–31,753 | 3,968–6,491l |
|
| ||||
| Emphysema | 1.6–4.8 | N/A | N/A | N/A |
|
| ||||
| Mental disorders | ||||
|
| ||||
| Depression | 5.0m–22.3 | N/A | 9,048n–11,231 | 1,545 |
|
| ||||
| Schizophrenia | N/A | N/A | 11,446n–20,585 | N/A |
|
| ||||
| Bipolar | N/A | N/A | 16,038 | 4,811o |
|
| ||||
| Other conditions | ||||
|
| ||||
| Obesity | 35.3 | 42.9–45.2 | N/A | N/A |
|
| ||||
| Arthritis | 27.7p | N/A | N/A | N/A |
|
| ||||
| Multiple chronic conditions | ||||
|
| ||||
| ≥1 chronic conditions | 55.7–62.1 | N/A | 9,273q | N/A |
|
| ||||
| ≥1 mental health conditions | N/A | N/A | 11,120q | N/A |
Costs adjusted to 2015 U.S. dollars using the Personal Consumption Expenditures health component price index. Excludes 2-year cost estimates from two studies, estimates from one study examining only hospital costs, and estimates from one study examining only ambulatory cancer costs. Six-month cancer cost estimates included but noted.
Estimates for physical conditions from one study reporting the total cost per patient with the disease alone (without the presence of other major chronic conditions) were treated as outliers and excluded.
For a medication-adherent patient. Estimate from a regression-adjusted model comparing adherent and nonadherent patients.
Estimate for a medication-adherent patient. Includes only emergency department visits, hospitalizations, and medication costs. Estimate from a regression-adjusted model comparing adherent and nonadherent patients.
Estimate for a medication-nonadherent diabetes patient with hyperlipidemia.
Estimate for a diabetes patient with hyperlipidemia who is adherent to medication.
Includes skilled and intermediate nursing care.
Total costs per cancer patient in the 6 months following initiation of treatment.
“Active asthma” defined as respondents reporting they still had asthma or had an asthma attack in the past 12 months.
Includes claims with asthma as the primary, secondary, or tertiary diagnosis as asthma-related costs.
Includes only physician office, inpatient, and outpatient costs. Estimate from a regression-adjusted model comparing total cost per COPD patient with a matched non-COPD cohort.
Includes claims with COPD as the primary, secondary, or tertiary diagnosis as COPD-related costs.
Patient Health Questionnaire nine-item survey cut off point not specified; likely a measure of more severe depression.
Cost of a patient with the condition alone (without the presence of other major chronic conditions).
Defined as 30% of total costs of a bipolar patient in original study; 30% of the $16,038 total cost estimate=$4,811.
Includes respondents with pain, aching, stiffness, or swelling around the joint in the past 12 months.
Sum of the separately presented Medicaid costs and out-of-pocket costs.
CHD, coronary heart disease; CHF, congestive heart failure; COPD, chronic obstructive pulmonary disease; HF, heart failure; N/A, not applicable.
Among the aforementioned five studies, the prevalence of having one or more chronic conditions (where reported) ranged from 55.7% to 62.1%; of “any heart disease,” from 8.8% to 11.8% (one study had estimates for CHD and angina of 5.0% and 2.0%, respectively); of stroke, 1.5% to 5.5%; of hypertension, 17.2% to 27.4%; of hyperlipidemia, 16.8% to 23.2%; of diabetes, 7.5% to 12.7%; of asthma, 7.8% to 19.3%; of emphysema, 1.6% to 4.8%; of depression, 5.0% to 22.3%; and of obesity, 35.3% to 45.2%; one study had an estimate for cancer of 9.5% and one had an estimate for arthritis (including joint pain, swelling, or stiffness) of 27.7% (Table 2).14,16,18,27,38
The wide range in estimated prevalence of hypertension might be because of variations in the methods used to identify hypertensive beneficiaries. Two studies used self-reported data, which misses those unaware of their condition, and produced the lower estimates (17.2% and 18.0%).27,38 The third and highest estimate (27.4%) came from a study by Decker and colleagues,18 who used data with actual blood pressure measurements >140/90 mmHg or the use of antihypertensive medications to identify hypertensive beneficiaries, which is a more accurate measure. A fourth study by Chang and Davis14 used the same data and method of identification for hypertension as Decker and colleagues, but found an improbably low estimate of prevalence (9.9%). In addition, Chang and Davis included dual eligibles in their analysis whereas Decker and colleagues did not, which should raise the hypertension prevalence rather than significantly lower it.14 Therefore, the Chang and Davis estimate was treated as an outlier and excluded from the range presented.
Although all asthma prevalence estimates were self-reported, the range in estimates might partially be because of differences in the case definitions used to identify asthmatic beneficiaries. The lowest estimate (7.8%) was for active asthma, defined as respondents reporting they still had asthma or had an asthma attack in the last 12 months,27 whereas the other two estimates (15% and 19.3%) were self-reported as having asthma but without a time specification.18,38 The wide range in depression prevalence estimates also might have resulted from differences in case definitions. Hill et al.27 used the Patient Health Questionnaire two-item survey to identify depression and estimated the prevalence as 16.5%. Chang and Davis14 used the Patient Health Questionnaire nine-item survey and defined depression as a score of ten or higher, which is a standard measure of moderate depression and produced a comparable estimate (22.3%). Decker and colleagues18 also used the Patient Health Questionnaire nine-item survey but did not specify the cut off point used to define depression and estimated 5% prevalence. This likely indicates the use of a higher cut off point than was used by Chang and Davis—because both studies used the same data source—and likely described the prevalence of more severe depression.18
Of the 20 studies exploring costs, 15 included a breakdown of costs by component (e.g., outpatient, pharmacy),17,20,22–26,29,30,32–34,36,39,40 and one studied hospital costs only37; the remaining four presented total cost without a breakdown of costs by component. Cost estimates varied widely for some diseases, which could partially be because of differences in studies’ definitions of included costs and the types of statistical analyses used. Studies varied in their inclusion of certain cost components. Most included at least inpatient, outpatient, and pharmacy costs, and some included such costs as home health care, skilled and intermediate nursing, or long-term care and nursing home costs, which tended to yield higher estimates. Five studies employed regression-based methods to compare total costs between two or more groups while adjusting for demographic characteristics and comorbidities; two compared the costs of patients with a disease to those without the disease,20,29 and three compared the costs of patients with a disease between groups with varying levels of medication adherence.22,24,40 Estimates from these regression models tended to be lower than unadjusted estimates from other studies, after considering differences in the cost components included (Appendix Table 3, available online).
One study examined the total healthcare costs per beneficiary among those with just one of the nine chronic diseases examined alone (without the presence of any other major chronic diseases included in this analysis). This method produced significantly lower cost estimates for the studied physical conditions than those estimates that included all beneficiaries with the particular disease (including those with other comorbidities) from other studies.23 Cost estimates for the physical conditions (e.g., hypertension, CHF, diabetes) examined in this study were treated as outliers and excluded from the ranges presented because they are likely significant underestimates of a typical patient with one of these conditions, who commonly have comorbidities. Cost estimates for mental disorders (e.g., depression, psychosis) from this study were included because they were comparable to estimates from other studies and it is more reasonable to assume a beneficiary with one of these mental disorders could have no other chronic conditions (Table 2; Appendix Table 3, available online).
The estimated total annual cost per beneficiary with CHF in one study ranged from $29,271 to $38,187 for a medication adherent and nonadherent patient, respectively, after adjusting for differences in demographics and comorbidities.22 One study estimated the unadjusted total annual cost per patient with HF and HF-related costs were $51,937 and $7,031, respectively.33 In this study, the total annual cost per beneficiary with CHD and CHD-related costs were estimated at $35,548 and $5,835, respectively.33 Annual hypertension-related costs per patient were estimated at $687 in this study, but total annual costs per patient with hypertension were estimated at $21,557.33 One study estimated that the emergency department, hospitalization, and pharmacy costs of a hypertensive beneficiary depended on medication adherence and ranged from $5,458 to $6,038 for patients with high and low adherence, respectively, after adjusting for differences in demographics and comorbidities.40 Annual per patient hyperlipidemia-related costs were estimated in one study at $560,33 and in a different study were estimated to range from $2,756 to $3,370 in patients with diabetes.39 One study estimated the total annual cost per patient with hyperlipidemia at $18,785.33 Annual per patient diabetes-related costs were estimated at $3,219 in one study33 and ranged up to $4,674 in another study that included skilled and intermediate nursing care and home healthcare costs.13 Total annual healthcare costs per beneficiary with diabetes ranged from $17,515 (for a medication-adherent patient with hyperlipidemia) in one study to $27,888 in another study.33,39
Estimates of the total healthcare costs per patient diagnosed with cancer in the 6 months following diagnosis ranged from $29,384 to $46,194.35,36 Estimates of annual asthma-related costs ranged from $989 to $1,185 when only claims with asthma as the primary diagnosis were included,32,33 and were estimated at $3,069 in another study that included claims with asthma as the primary, secondary, or tertiary diagnosis.34 Total medical costs per beneficiary with asthma ranged from $5,724 to $9,127.32,33 Two studies examined the excess (incremental) cost of a COPD patient compared with a non-COPD patient from a matched sample after controlling for demographics and comorbidities and estimated that this cost ranged from $2,478 to $2,489.20,29 Estimates for the total cost per patient with COPD from the regression models in these two studies ranged from $10,114 (including only physician, inpatient, and outpatient costs)29 to $20,900 (including all medical, pharmacy, and long-term care costs).20 A separate study estimated the unadjusted average annual cost of a COPD patient at $31,753, and estimates for COPD-related costs ranged from $3,968 in this study33 to $6,491 in a study that included claims with COPD as the primary, secondary, or tertiary diagnosis.34
Annual healthcare costs per patient diagnosed with schizophrenia (or psychosis) were estimated at $11,446 (for a patient with psychosis alone without other chronic conditions) in one study23 and ranged from $11,972 to $20,585 in another study that compared the costs of patients in groups with varying levels of medication adherence, after adjusting for covariates.24 A different study estimated the total costs in the 2 years following initiation of treatment was $76,679, including nursing home costs.30 One study estimated the annual cost of a patient with bipolar disorder at $16,038, 30% of which was estimated as specifically bipolar-related costs.25 Estimates for total annual healthcare costs per patient with depression ranged from $9,048 (for a patient with depression alone without other chronic conditions) to $11,446.23,33 One study estimated that the cost of a beneficiary with one or more chronic conditions was $8,881, plus $392 in out-of-pocket costs, and the costs per beneficiary with one or more mental disorders was $10,645, plus $475 in out-of-pocket costs.17
DISCUSSION
The studies included in this review tended to find a high prevalence of most noncommunicable chronic diseases among the Medicaid population. In a subset of studies using nationally representative data to examine beneficiaries aged 18–64 years, 55.7% to 62.1% of these adults had at least one chronic condition,16,18,27 which is higher than national estimates of 50% for all adults (which include those aged ≥65 years, who tend to have much higher rates of chronic disease).1,2 The difference could be partly because of the fact that a segment of the Medicaid population is eligible because of a disability; those in this group tend to be in particularly worse health than the general low-income population.9,28 However, even studies excluding the disabled or dual eligibles found a relatively high prevalence of many chronic diseases compared with other low-income adults.18,27
Medicaid beneficiaries tended to have a high prevalence of heart diseases and related conditions.13,15,18 Estimates for hypertension prevalence varied between studies. Regardless, all but one of the studies reporting on this condition that examined Medicaid beneficiaries and a comparison group found the prevalence of hypertension to be higher in Medicaid beneficiaries.14,15,18,27,38 Hypertension, hyperlipidemia, heart disease, and diabetes were common comorbidities in this review.12,19,22,40 Patients with COPD also had high rates of hypertension and diabetes.19,20,29,40
Hypertension-related costs were composed mostly of medication costs and were fairly low compared with the much higher total cost of a hypertensive patient or a patient with heart disease.23,33,40 Similarly, hyperlipidemia-related costs were mostly medication costs and were fairly low compared with the total cost of a patient with hyperlipidemia and the cost estimates for diabetes or heart disease.13,23,33,39 One study found the total costs per beneficiary with HF and CHD to be substantial and that these were the two most costly among the diseases they examined, and the total cost of a diabetic beneficiary was found to be the fourth highest.33 In separate studies, estimates for the total costs of a patient with diabetes with hyperlipidemia and of a patient with CHF were also found to be substantial.22,39 These findings highlight the potential value of early identification and treatment of hypertension and hyperlipidemia in an attempt to contain later, more expensive costs of their sequelae, which is reflected in the literature for cardiovascular disease overall.41–44
In addition to being a costly disease among the estimates in this review, diabetes was also the most frequently studied. Diabetes was commonly measured as a comorbidity in studies examining only patients with a specific disease and was found to be highly prevalent (20%–38%) among patients with hypertension, CHF, and COPD.12,19,20,22,29,40 Mental disorders were also commonly studied and were prevalent in the Medicaid population. Patients with severe mental disorders, such as schizophrenia or bipolar disorder, had high healthcare costs.17,24–26,30,37 Clemans-Cope et al.17 found the average annual cost per patient with one or more mental disorders to be $11,120 (after summing the separately presented payer costs and out-of-pocket costs), well above the average they found of $9,273 per patient with one or more chronic conditions overall.
Multiple studies explored Medicaid beneficiaries’ medication adherence and the effect of level of adherence on healthcare costs, including studies of patients with schizophrenia, hypertension, diabetes, CHF, and hyperlipidemia.22,24,37,39,40 All but one found that better adherence was associated with lower total healthcare costs, despite the increase in medication costs.22,37,39,40 However, studies consistently found that Medicaid beneficiaries tended to have poor medication adherence for their conditions.12,24,30,33,37,39,40 These findings suggest that interventions to improve medication adherence for certain diseases could be important for controlling Medicaid costs.
The literature on the prevalence and costs of non-communicable chronic diseases among adult Medicaid beneficiaries has expanded rapidly in recent years; two thirds of the studies included in this review were published in 2010 or later. This expansion could possibly be because of an increased focus on the Medicaid program in anticipation of Medicaid expansion in 2014 following the 2010 enactment of the Patient Protection and Affordable Care Act. However, none of the reviewed studies used data from 2014 or later. The expansion of Medicaid has likely produced shifts in the overall demographic composition of enrollees to include more childless adults and an increased proportion of males,45,46 and thus it is likely to have changed the average disease burden in the population.14,18,27,47 Multiple studies compared the then-current (pre-expansion) Medicaid population to those potentially eligible under expansion and found then-current beneficiaries to be in similar or worse health, suggesting that expansion could shift the Medicaid population to be slightly healthier on average.13,17,25 However, the extent of changes to the Medicaid population following the Affordable Care Act expansion also depends on the level of outreach and potential adverse selection.14,18,27,48–51 The lack of use of post-2014 data in the reviewed studies is an evidence gap that should be filled with future research. In addition, possible future legislation could further change the design of the Medicaid program, including its eligibility requirements,52 which might create additional evidence gaps.
Limitations
The literature had some limitations. Many studies used state-level data, which might limit the generalizability of results. States’ Medicaid populations can vary in composition because populations differ by region and states have varying eligibility requirements for Medicaid. States also vary widely in Medicaid reimbursement rates for services; therefore Medicaid expenditure estimates for different states can vary considerably.53 In addition, state Medicaid reimbursement rates have varied over time. Studies have found that Medicaid reimbursements have generally risen less rapidly with inflation,54 which implies that older Medicaid cost studies might yield higher average cost estimates. Older studies might also be limited in the applicability of their results because of changes in Medicaid, and the healthcare environment overall, over time; some studies used data dating back as far as 1987, when the healthcare environment likely differed compared with today.
Many studies used claims data, which might under-count the number of patients with certain chronic diseases that might not require frequent healthcare visits, such as hypertension, or patients who have less frequent access to healthcare services. Further, the studies were heterogeneous in their definitions of the Medicaid population and the age group studied. The variation in definitions of the population of interest, combined with variations in the representativeness of the population (e.g., state-specific versus nationally representative) and differences in data sources (e.g., surveys versus claims data), makes it difficult to accurately compare some prevalence and cost estimates between studies, and the review’s findings should be viewed with this in mind.
This review did not include gray literature, although that literature might also provide valuable information. For example, a study from the Urban Institute found prevalence estimates for chronic conditions that were similar to those found in this review.9 And a working paper for the Agency for Healthcare Research and Quality examined medication costs in the Medicaid population.55
CONCLUSIONS
The limitations described above notwithstanding, the present review confirms that the health and economic burden of noncommunicable chronic diseases among Medicaid beneficiaries has been high. The review suggested that a wide range of prevalence and cost estimates are found in the literature. The specific prevalence and cost estimates highlighted here could be used to inform the evaluation of interventions for effectively managing chronic diseases and controlling costs in this vulnerable population and for informing future designs of the Medicaid program. Future studies using large nationally representative data sets or combined state-specific data sources might be needed. Additionally, rigorous analytic frameworks, such as economic modeling techniques, should be employed for high-quality estimates of the disease prevalence and economic burden among this vulnerable population.
Supplementary Material
Acknowledgments
Publication of this article was supported by the U.S. Centers for Disease Control and Prevention (CDC), an Agency of the U.S. Department of Health and Human Services, and the Association for Prevention Teaching and Research (APTR) Cooperative Agreement No. 1U36 OE000005.
The findings and conclusions in this publication are those of the authors and do not necessarily represent the official position of the CDC.
John Chapel planned this project, obtained all literature, and wrote the manuscript. Guijing Wang supervised the planning, analysis, and writing for the manuscript. Matthew Ritchey and Donglan Zhang participated in summarizing the evidence and revising the manuscript. Partial results of this manuscript were presented as a poster at the AcademyHealth Annual Research Meeting in June of 2017.
No financial disclosures were reported by the authors of this paper.
Footnotes
Supplemental materials associated with this article can be found in the online version at https://doi.org/10.1016/j.amepre.2017.07.019.
References
- 1.Ward BW, Schiller JS. Prevalence of multiple chronic conditions among U.S. adults: estimates from the National Health Interview Survey, 2010. Prev Chronic Dis. 2013;10:120203. doi: 10.5888/pcd10.120203. https://doi.org/10.5888/pcd10.120203. [DOI] [PMC free article] [PubMed] [Google Scholar]
- 2.Ward BW, Schiller JS, Goodman RA. Multiple chronic conditions among U.S. adults: a 2012 update. Prev Chronic Dis. 2014;11:130389. doi: 10.5888/pcd11.130389. https://doi.org/10.5888/pcd11.130389. [DOI] [PMC free article] [PubMed] [Google Scholar]
- 3.Gerteis J, Izrael D, Deitz D, et al. Multiple Chronic Conditions Chartbook. Rockville, MD: Agency for Healthcare Research and Quality; 2014. [Google Scholar]
- 4.DeNavas-Walt C, Proctor BD, Smith JC. Income, Poverty, and Health Insurance Coverage in the United States: 2012. Washington, DC: U.S. Census Bureau; 2013. [Google Scholar]
- 5.Barnett JC, Vornovitsky MS. Health Insurance Coverage in the United States: 2015. Washington, DC: U.S. Census Bureau; 2016. [Google Scholar]
- 6.Centers for Medicare & Medicaid Services. 2013 CMS Statistics. Baltimore, MD: U.S. DHHS; 2013. [Google Scholar]
- 7.Banthin J, Cohen J. Changes in the Medicaid Community Population: 1987–96. Rockville, MD: Agency for Health Care Policy and Research; 1999. [Google Scholar]
- 8.Gornick M, Greenberg JN, Eggers PW, Dobson A. Twenty years of Medicare and Medicaid: covered populations, use of benefits, and program expenditures. Health Care Financ Rev. 1985;1985(suppl):13–59. [PMC free article] [PubMed] [Google Scholar]
- 9.Holahan J, Kenney G, Pelletier J. The Health Status of New Medicaid Enrollees Under Health Reform: Timely Analysis of Immediate Health Policy Issues. Washington, DC: Urban Institute; 2010. [Google Scholar]
- 10.Bureau of Economic Analysis. [Accessed April 5, 2017];Table 2.5.4. Price indexes for personal consumption expenditures by function. www.bea.gov/iTable/iTable.cfm?ReqID=9&step=1#reqid=9&step=3&isuri=1&903=73.
- 11.Dunn A, Grosse SD, Zuvekas SH. Adjusting health expenditures for inflation: a review of measures for health services research in the United States. Health Serv Res. doi: 10.1111/1475-6773.12612. In press. Online November 21, 2016. https://doi.org/10.1111/1475-6773.12612. [DOI] [PMC free article] [PubMed]
- 12.Bagchi AD, Esposito D, Kim M, Verdier J, Bencio D. Utilization of, and adherence to, drug therapy among Medicaid beneficiaries with congestive heart failure. Clin Ther. 2007;29(8):1771–1783. doi: 10.1016/j.clinthera.2007.08.015. https://doi.org/10.1016/j.clinthera.2007.08.015. [DOI] [PubMed] [Google Scholar]
- 13.Buescher PA, Whitmire JT, Pullen-Smith B. Medical care costs for diabetes associated with health disparities among adult Medicaid enrollees in North Carolina. N C Med J. 2010;71(4):319–324. [PubMed] [Google Scholar]
- 14.Chang T, Davis M. Potential adult Medicaid beneficiaries under the Patient Protection and Affordable Care Act compared with current adult Medicaid beneficiaries. Ann Fam Med. 2013;11(5):406–411. doi: 10.1370/afm.1553. https://doi.org/10.1370/afm.1553. [DOI] [PMC free article] [PubMed] [Google Scholar]
- 15.Cheung PT, Wiler JL, Lowe RA, Ginde AA. National study of barriers to timely primary care and emergency department utilization among Medicaid beneficiaries. Ann Emerg Med. 2012;60(1):4–10. doi: 10.1016/j.annemergmed.2012.01.035. https://doi.org/10.1016/j.annemergmed.2012.01.035. [DOI] [PubMed] [Google Scholar]
- 16.Christopher AS, McCormick D, Woolhandler S, et al. Access to care and chronic disease outcomes among Medicaid-insured persons versus the uninsured. Am J Public Health. 2016;106(1):63–69. doi: 10.2105/AJPH.2015.302925. https://doi.org/10.2105/AJPH.2015.302925. [DOI] [PMC free article] [PubMed] [Google Scholar]
- 17.Clemans-Cope L, Long SK, Coughlin TA, Yemane A, Resnick D. The expansion of Medicaid coverage under the ACA: implications for health care access, use, and spending for vulnerable low-income adults. Inquiry. 2013;50(2):135–149. doi: 10.1177/0046958013513675. https://doi.org/10.1177/0046958013513675. [DOI] [PubMed] [Google Scholar]
- 18.Decker SL, Kostova D, Kenney GM, Long SK. Health status, risk factors, and medical conditions among persons enrolled in Medicaid vs uninsured low-income adults potentially eligible for Medicaid under the Affordable Care Act. JAMA. 2013;309(24):2579–2586. doi: 10.1001/jama.2013.7106. https://doi.org/10.1001/jama.2013.7106. [DOI] [PubMed] [Google Scholar]
- 19.Downie DL, Schmid D, Plescia MG, et al. Racial disparities in blood pressure control and treatment differences in a Medicaid population, North Carolina, 2005–2006. Prev Chronic Dis. 2011;8(3):A55. [PMC free article] [PubMed] [Google Scholar]
- 20.D’Souza AO, Shah M, Dhamane AD, Dalal AA. Clinical and economic burden of COPD in a Medicaid population. COPD. 2014;11(2):212–220. doi: 10.3109/15412555.2013.836168. https://doi.org/10.3109/15412555.2013.836168. [DOI] [PubMed] [Google Scholar]
- 21.Epstein JD, Knight TK, Epstein JB, Bride MA, Nichol MB. Cost of care for early- and late-stage oral and pharyngeal cancer in the California Medicaid population. Head Neck. 2008;30(2):178–186. doi: 10.1002/hed.20670. https://doi.org/10.1002/hed.20670. [DOI] [PubMed] [Google Scholar]
- 22.Esposito D, Bagchi AD, Verdier J, Bencio D, Kim MS. Medicaid beneficiaries with congestive heart failure: association of medication adherence with healthcare use and costs. Am J Manag Care. 2009;15(7):437–445. [PubMed] [Google Scholar]
- 23.Garis RI, Farmer KC. Examining costs of chronic conditions in a Medicaid population. Manag Care. 2002;11(8):43–50. [PubMed] [Google Scholar]
- 24.Gilmer TP, Dolder CR, Lacro JP, et al. Adherence to treatment with antipsychotic medication and health care costs among Medicaid beneficiaries with schizophrenia. Am J Psychiatry. 2004;161(4):692–699. doi: 10.1176/appi.ajp.161.4.692. https://doi.org/10.1176/appi.ajp.161.4.692. [DOI] [PubMed] [Google Scholar]
- 25.Guo JJ, Keck PE, Li H, Patel NC. Treatment costs related to bipolar disorder and comorbid conditions among Medicaid patients with bipolar disorder. Psychiatr Serv. 2007;58(8):1073–1078. doi: 10.1176/ps.2007.58.8.1073. https://doi.org/10.1176/ps.2007.58.8.1073. [DOI] [PubMed] [Google Scholar]
- 26.Hankin CS, Koran L, Sheehan DV, et al. Patients with obsessive-compulsive disorder vs depression have comparable health care costs: a retrospective claims analysis of Florida Medicaid enrollees. Ann Clin Psychiatry. 2011;23(4):285–296. [PubMed] [Google Scholar]
- 27.Hill SC, Abdus S, Hudson JL, Selden TM. Adults in the income range for the Affordable Care Act’s Medicaid expansion are healthier than pre-ACA enrollees. Health Aff (Millwood) 2014;33(4):691–699. doi: 10.1377/hlthaff.2013.0743. https://doi.org/10.1377/hlthaff.2013.0743. [DOI] [PubMed] [Google Scholar]
- 28.Khoury AJ, Hall A, Andresen E, et al. The association between chronic disease and physical disability among female Medicaid beneficiaries 18–64 years of age. Disabil Health J. 2013;6(2):141–148. doi: 10.1016/j.dhjo.2012.11.006. https://doi.org/10.1016/j.dhjo.2012.11.006. [DOI] [PubMed] [Google Scholar]
- 29.Lin PJ, Shaya FT, Scharf SM. Economic implications of comorbid conditions among Medicaid beneficiaries with COPD. Respir Med. 2010;104(5):697–704. doi: 10.1016/j.rmed.2009.11.009. https://doi.org/10.1016/j.rmed.2009.11.009. [DOI] [PubMed] [Google Scholar]
- 30.McCombs JS, Luo M, Johnstone BM, Shi L. The use of conventional antipsychotic medications for patients with schizophrenia in a Medicaid population: therapeutic and cost outcomes over 2 years. Value Health. 2000;3(3):222–231. doi: 10.1046/j.1524-4733.2000.33004.x. https://doi.org/10.1046/j.1524-4733.2000.33004.x. [DOI] [PubMed] [Google Scholar]
- 31.Mullins CD, Snyder SE, Wang J, Cooke JL, Baquet C. Economic disparities in treatment costs among ambulatory Medicaid cancer patients. J Natl Med Assoc. 2004;96(12):1565–1574. [PMC free article] [PubMed] [Google Scholar]
- 32.Piecoro LT, Potoski M, Talbert JC, Doherty DE. Asthma prevalence, cost, and adherence with expert guidelines on the utilization of health care services and costs in a state Medicaid population. Health Serv Res. 2001;36(2):357–371. [PMC free article] [PubMed] [Google Scholar]
- 33.Priest JL, Cantrell CR, Fincham J, Cook CL, Burch SP. Quality of care associated with common chronic diseases in a 9-state Medicaid population utilizing claims data: an evaluation of medication and health care use and costs. Popul Health Manag. 2011;14(1):43–54. doi: 10.1089/pop.2010.0019. https://doi.org/10.1089/pop.2010.0019. [DOI] [PMC free article] [PubMed] [Google Scholar]
- 34.Shaya FT, Maneval MS, Gbarayor CM, et al. Burden of COPD, asthma, and concomitant COPD and asthma among adults: racial disparities in a Medicaid population. Chest. 2009;136(2):405–411. doi: 10.1378/chest.08-2304. https://doi.org/10.1378/chest.08-2304. [DOI] [PMC free article] [PubMed] [Google Scholar]
- 35.Subramanian S. Impact of Medicaid copayments on patients with cancer: lessons for Medicaid expansion under health reform. Med Care. 2011;49(9):842–847. doi: 10.1097/MLR.0b013e31821b34db. https://doi.org/10.1097/MLR.0b013e31821b34db. [DOI] [PubMed] [Google Scholar]
- 36.Subramanian S, Tangka FK, Sabatino SA, et al. Impact of chronic conditions on the cost of cancer care for Medicaid beneficiaries. Medicare Medicaid Res Rev. 2013;2(4):e1–e20. doi: 10.5600/mmrr.002.04.a07. https://doi.org/10.5600/mmrr.002.04.a07. [DOI] [PMC free article] [PubMed] [Google Scholar]
- 37.Svarstad BL, Shireman TI, Sweeney JK. Using drug claims data to assess the relationship of medication adherence with hospitalization and costs. Psychiatr Serv. 2001;52(6):805–811. doi: 10.1176/appi.ps.52.6.805. https://doi.org/10.1176/appi.ps.52.6.805. [DOI] [PubMed] [Google Scholar]
- 38.Widmer AJ, Basu R, Hochhalter AK. The association between office-based provider visits and emergency department utilization among Medicaid beneficiaries. J Community Health. 2015;40(3):549–554. doi: 10.1007/s10900-014-9970-3. https://doi.org/10.1007/s10900-014-9970-3. [DOI] [PubMed] [Google Scholar]
- 39.Wu J, Seiber E, Lacombe VA, Nahata MC, Balkrishnan R. Medical utilization and costs associated with statin adherence in Medicaid enrollees with type 2 diabetes. Ann Pharmacother. 2011;45(3):342–349. doi: 10.1345/aph.1P539. https://doi.org/10.1345/aph.1P539. [DOI] [PubMed] [Google Scholar]
- 40.Yang Z, Howard D, Will J, et al. Association of antihypertensive medication adherence with healthcare use and Medicaid expenditures for acute cardiovascular events. Med Care. 2016;54(5):504–511. doi: 10.1097/MLR.0000000000000515. https://doi.org/10.1097/MLR.0000000000000515. [DOI] [PubMed] [Google Scholar]
- 41.Mozaffarian D, Benjamin EJ, Go AS, et al. Heart disease and stroke statistics—2016 update: a report from the American Heart Association. Circulation. 2016;133(4):e38–e360. doi: 10.1161/CIR.0000000000000350. https://doi.org/10.1161/CIR.0000000000000350. [DOI] [PubMed] [Google Scholar]
- 42.Valero-Elizondo J, Salami JA, Ogunmoroti O, et al. Favorable cardiovascular risk profile is associated with lower healthcare costs and resource utilization: the 2012 Medical Expenditure Panel Survey. Circ Cardiovasc Qual Outcomes. 2016;9(2):143–153. doi: 10.1161/CIRCOUTCOMES.115.002616. https://doi.org/10.1161/CIRCOUTCOMES.115.002616. [DOI] [PubMed] [Google Scholar]
- 43.Basu R, Krueger PM, Lairson DR, Franzini L. Lifetime medical expenditures among hypertensive men and women in the United States. Womens Health Issues. 2011;21(3):246–253. doi: 10.1016/j.whi.2010.12.004. https://doi.org/10.1016/j.whi.2010.12.004. [DOI] [PubMed] [Google Scholar]
- 44.Willis BL, DeFina LF, Bachmann JM, et al. Association of ideal cardiovascular health and long-term healthcare costs. Am J Prev Med. 2015;49(5):678–685. doi: 10.1016/j.amepre.2015.03.034. https://doi.org/10.1016/j.amepre.2015.03.034. [DOI] [PubMed] [Google Scholar]
- 45.Centers for Medicare & Medicaid Services. 2015 CMS Statistics. Baltimore, MD: U.S. DHHS; 2015. [Google Scholar]
- 46.Centers for Medicare & Medicaid Services. Total Medicaid Enrollees—VIII Group Break Out Report. Baltimore, MD: U.S. DHHS; 2016. [Google Scholar]
- 47.Holahan J, Buettgens M, Carroll C, Dorn S. The Cost and Coverage Implications of the ACA Medicaid Expansion: National and State-by-State Analysis. Washington, DC: Kaiser Family Foundation; 2012. [Google Scholar]
- 48.Sommers BD, Kenney GM, Epstein AM. New evidence on the Affordable Care Act: coverage impacts of early Medicaid expansions. Health Aff (Millwood) 2014;33(1):78–87. doi: 10.1377/hlthaff.2013.1087. https://doi.org/10.1377/hlthaff.2013.1087. [DOI] [PubMed] [Google Scholar]
- 49.Natoli C, Cheh V, Verghese S. Who Will Enroll in Medicaid in 2014? Lessons from Section 1115 Medicaid Waivers. Princeton, NJ: Mathematica Policy Research; 2011. [Google Scholar]
- 50.Somers SA, Hamblin A, Verdier JM, Byrd VLH. Covering Low-Income Childless Adults in Medicaid: Experiences From Selected States. Hamilton, NJ: Center for Health Care Strategies, Inc; 2010. [Google Scholar]
- 51.Allen H, Baicker K, Finkelstein A, Taubman S, Wright BJ Oregon Health Study Group. What the Oregon health study can tell us about expanding Medicaid. Health Aff (Millwood) 2010;29(8):1498–1506. doi: 10.1377/hlthaff.2010.0191. https://doi.org/10.1377/hlthaff.2010.0191. [DOI] [PMC free article] [PubMed] [Google Scholar]
- 52.Congressional Budget Office. Congressional Budget Office cost estimate: American Health Care Act. Washington, DC: Congressional Budget Office; Mar 31, 2017. [Google Scholar]
- 53.Polsky D, Richards M, Basseyn S, et al. Appointment availability after increases in Medicaid payments for primary care. N Engl J Med. 2015;372(6):537–545. doi: 10.1056/NEJMsa1413299. https://doi.org/10.1056/NEJMsa1413299. [DOI] [PubMed] [Google Scholar]
- 54.Selden TM, Karaca Z, Keenan P, White C, Kronick R. The growing difference between public and private payment rates for inpatient hospital care. Health Aff (Millwood) 2015;34(12):2147–2150. doi: 10.1377/hlthaff.2015.0706. https://doi.org/10.1377/hlthaff.2015.0706. [DOI] [PubMed] [Google Scholar]
- 55.Miller E, Sarpong E, Banthin J. Recent Trends in Prescription Drug Use and Expenditures by Medicaid Enrollees. Baltimore, MD: Agency for Healthcare Research and Quality; 2012. [Google Scholar]
Associated Data
This section collects any data citations, data availability statements, or supplementary materials included in this article.